Submitted:
23 May 2026
Posted:
25 May 2026
You are already at the latest version
Abstract
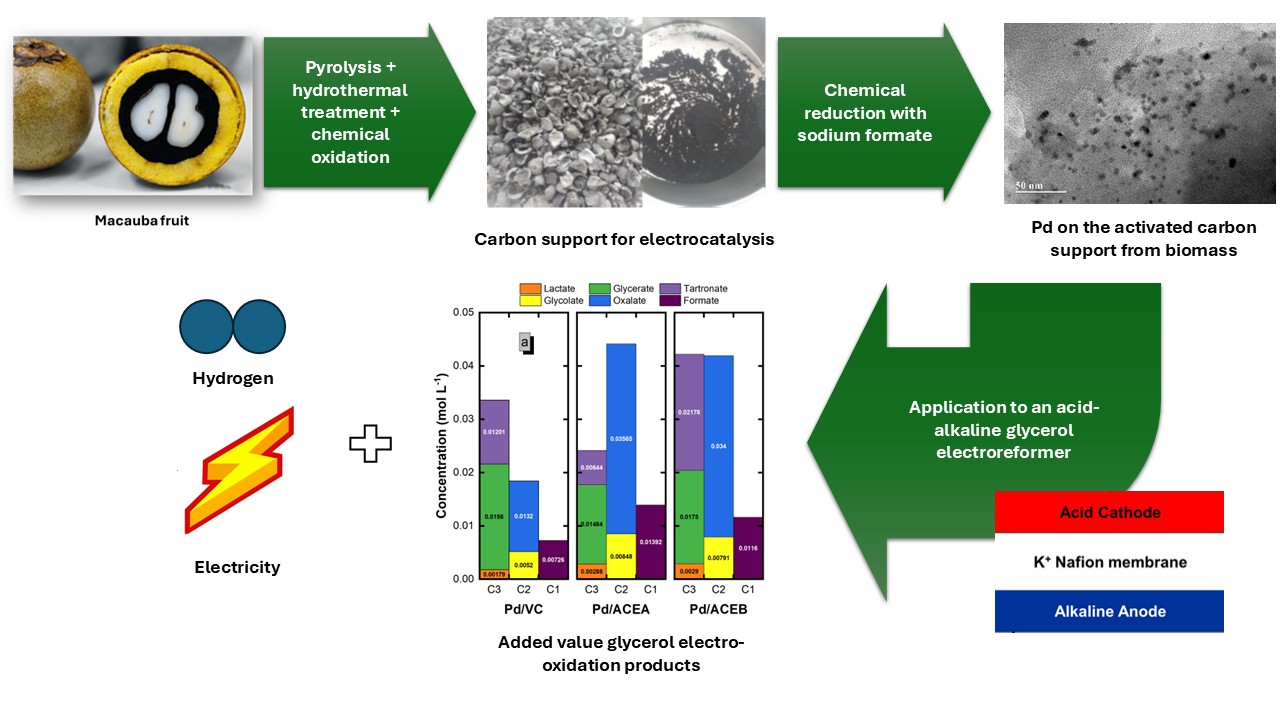
This manuscript proposes to valorize the macauba endocarp (E) wastes from the macauba processing by a pyrolytic + hydrothermal process to produce activated carbon (ACE), followed by chemical treatment with H2O2 (A) and HNO3 (B). Elemental analysis, surface area, pore-size distribution, and surface functional groups are investigated for the different prepared materials. ACEA and ACEB offer a higher surface area and functionality than Vulcan XC-72R (VC), making them suitable as carbon supports for Pd nanoparticles. The prepared Pd/ACEA and Pd/ACEB are physicochemically characterized by X-ray diffraction and Transmission Electron Microscopy. Their electrochemical performance is initially evaluated in a 3-electrode glass cell and is found to surpass that of Pd/VC in glycerol electro-oxidation. This trend is confirmed in the glycerol acid-alkaline electroreformer, where hydrogen and electricity were simultaneously produced, achieving a maximum power density of 0.28 kW m-2 and H2 flux of 0.6 STP m3 m-2 h-1 at 80 °C.
Keywords:
macauba endocarp
; activated carbon
; glycerol electroreforming
; green hydrogen
; electricity
1. Introduction
Hydrogen is crucial for many industries, including fertilizers, petroleum refining, petrochemicals, methanol production, steel, and food processing [1]. However, current hydrogen is produced from fossil fuels, mainly via steam reforming of natural gas and carbon gasification, contributing to CO2 emissions (for the 97 Mt of total hydrogen produced, 620 Mt of CO2 are emitted) [2]. Thus, replacing current H2 production pathways with more sustainable alternatives is necessary. Among these, hydrogen produced by electrolysis powered by renewable energy stands out as the most promising option, the so-called green hydrogen.
Current green H2 accounts for less than 0.1% of overall hydrogen production. The reasons behind this poor contribution are technical and, mainly, economic. On the one hand, among the available technologies, alkaline (AWE), polymer electrolyte membrane (PEMWE), and solid oxide electrolyzers (SOWE), AWE has enough operating and maintenance background. Despite this maturity, the harsh operating conditions associated with the use of a highly alkaline solution increase maintenance costs and reduce electrolyzer efficiency, particularly at low current densities [1]. In the case of the PEMWE, compactness, versatility, maturity, and high performance are outstanding strengths. Nevertheless, PEMWE uses expensive materials, especially in the anode, where Pt and Ir are used as electrocatalysts, and incurs high costs for the polymeric exchange membrane [2]. Finally, SOWE presents the highest efficiency and does not require noble metals. This technology is limited by its still-early stage of development, as it has not demonstrated long-term operation or material stability, nor has it addressed safety and sealing issues, resulting in high investment costs [3,4].
The limitations of electrolyzed hydrogen open the door to alternative approaches to producing green hydrogen, such as biological methods (including microbial electrolysis cells, dark fermentation, and biophotolysis), thermochemical methods (pyrolysis, steam reforming, and gasification) for biowastes, and photoelectrochemical water splitting [5]. Another alternative gaining attention over the last 15 years is the electrochemical reforming/electrolysis of organic molecules. Molecules such as formic acid, methanol, and ethanol have been explored as potential fuels [6]. In recent years, electroreforming has been applied to biomass waste, either oxidizing it completely to CO2 or converting it into higher-value products [9,10,11] as part of the novel concept of the electrorefinery. Given that the potentials required to oxidize organic molecules are lower than those for the oxygen evolution reaction, the estimated energy requirement can be reduced to one-half or one-third of that of a water electrolyzer [7].
In the electroreforming of alcohol, the electrocatalyst is a key element that must ensure high catalytic activity, stability, and low poisoning [8]. Most electrocatalysts are based on metallic nanoparticles, typically platinum-group metals, due to their high intrinsic electroactivity and homogeneous dispersion/deposition on a conductive support. Most of these supports are carbon-based due to their high electrical conductivity, large surface area, and strong electronic interactions between the metallic nanoparticles and the carbon support [9,10]. The most widely used carbon support is carbon black Vulcan XC-72R (VC) from Cabot Corp. (Japan), due to its high electrical conductivity, uniform pore distribution, massive mesoporosity, surface functionality, and suitable corrosion resistance [11,12,13]. Carbon materials derived from biomass, especially biowastes, have recently been investigated as alternatives to traditional carbon black materials. These materials fulfill the previously described features of carbon blacks and, in addition, are inexpensive and enable alternative valorization of waste, distinct from their most common thermal uses (e.g., fuel for vaporizers and steam generation) [14,15]. Typical procedures for converting those biowastes into functional carbon materials include pyrolysis, hydrothermal carbonization, ionothermal carbonization, and molten salt carbonization [16]. Such materials have high potential for application as carbon supports in electrocatalysis [14,17,18,19,20].
Based on these antecedents, this study presents results on the preparation of activated carbon from macauba endocarp waste, used as a carbon support for Pd/C electrocatalysts, and its application to a glycerol acid-alkaline electroreformer aimed at producing H2 and electricity simultaneously, a concept already developed by our research group [21,22]. The first step describes and discusses the preparation and characterization of activated carbon derived from macauba endocarps (E), in two stages: the first, after pyrolysis, producing a biochar labeled CE; and the second, after hydrothermal treatment, activating the CE to yield the labeled ACE. This process is followed by chemical activation of ACE with strong oxidants, resulting in the materials called ACEA (with H2O2) and ACEB (with HNO3). In sequence, the obtained carbon materials are used as supports for anchoring Pd nanoparticles. The prepared electrocatalysts are physicochemically characterized and tested in a three-electrode glass cell to preliminarily test their electroactivity towards glycerol electro-oxidation (GEO). In the final step, the best electrocatalysts are tested in a single-cell acid-alkaline glycerol electroreformer (AAGE), with their performance analyzed under different operating conditions, and product samples are collected to verify their distribution.
2. Results and Discussion
2.1. Physico-Chemical Characterization of the E/CE/ACE
Before presenting and discussing the results focused on the preparation of the Pd/C materials, the Supplementary Material presents the characterization of E/CE/ACE, and their comparison to the standard VC support.
Figure S1 shows an image of the macauba tree and fruit, and Figure S2 displays the initially obtained biochars, which are subsequently milled. Figure S3 shows the corresponding fractions of volatile compounds, fixed carbon, ashes, and moisture for the E, CE, and ACE treatments, demonstrating the transformations that occur during the sequential endocarp treatments and comparing them with VC, resulting in materials with larger fixed carbon and a significant fraction of ashes from the inorganic fraction present in the biomass, after the volatilization of the more labile compounds and the moisture (as observed in the samples weight evolution over the sequence of treatments). Figure S4 shows the C, H, N, and O percentages in the samples, quantifying the notorious compositional variations observed during the (hydro)thermal treatment of the E sample, as well as the notable difference between VC, massively formed by C and H, compared to CE and ACE, which contained a significant fraction of oxygen coming from the oxygenated groups present in the biomass. During pyrolysis, a significant fraction of these oxygenated groups is converted into volatile compounds, resulting in a carbonized CE material with a higher C content. Subsequently, the hydrothermal treatment allows oxidation of the carbon surface, leading to a higher oxygen fraction. This difference can impact the polarity, acidity, wettability, and the anchorage of the Pd nanoparticle on the support [23].
Regarding the carbon surface, Table S1 shows the corresponding point of zero charge for this sequence of materials, revealing higher surface acidity after the consecutive treatments applied to the macauba endocarp, most likely due to its high oxygen content [24]. The basicity and acidity functionality are shown in Figure S5, where we observe the expected increase in functionality upon activation of the base CE biochar. Figure S6 displays the main microstructural parameters extracted from the microstructural analysis, from which we observe that the sequential pyrolysis and hydrothermal treatment lead to a highly porous structure that combines a micro and mesoporous hierarchical structure, with a higher BET, mesoporous, and external surface area, which could make ACE a potential candidate for carbon support for preparing electrocatalysts: microporosity with large area that could favor the metal dispersion, mesoporosity to assist in the reactant access and external area for exposition of the active sites. Based on these results, the next steps in this work focus on utilizing ACE as the candidate support.
2.2. Chemical Activation of ACE and Physico-Chemical Characterization of ACEA and ACEB
To improve the anchorage of the later-deposited Pd nanoparticles, ACE is chemically activated by treatment with strong oxidants, H2O2 and HNO3, yielding the labeled ACEA and ACEB carbons, respectively. Figure 1 shows the changes in the C, H, N, and O elements with the oxidation treatments. Such treatments increase the oxygen content of the ACEA and, especially, the ACEB compared to the base material, due to the oxidation activity of H2O2 and HNO3. Also, these treatments modify the acidity of the ACE, as shown in Figure 2. In the oxidation with hydrogen peroxide, lactonic and, especially, phenolic groups are the most noticeably increased due to its moderate oxidizing power. When nitric acid is used instead, its more aggressive nature makes carboxylic acid the most abundant acid group. Finally, the oxidant attack significantly reduces the basic groups. The oxygenated groups are highly electronegative, attracting electron density and withdrawing it from the π-rings of the carbon structure [25], further weakening the basicity of the ACEA and ACEB carbons. Compared with the reference VC, ACEA and ACEB are clearly more acidic and have greater functionality. Table 1 presents the point-of-zero-charge values for the ACEA and ACEB carbons compared with the reference ACE. As expected, surface oxidation with the inclusion of acid groups leads to a decrease in the point of zero charge, as a consequence of the greater number of carboxylic acids on the surface of the ACE.
Finally, to better view the surface of the chemically treated ACE materials, Figure 3 shows the C 1s XPS spectra of ACE, ACEA, and ACEB carbons, as well as VC, the reference carbon support material. Table 2 summarizes the relative distribution of the different carbon species.
Significant differences can be observed among the four types of support. VC is primarily composed of graphitic carbon, originating from the furnace black process, with approximately 20% oxygenated groups resulting from exposure to air, oxidation of structural defects, and humidity, among other factors [26]. In the case of ACE, graphitic carbon remains predominant; however, the fraction of aliphatic carbon is higher, likely due to the formation of more amorphous carbon during pyrolysis and hydrothermal treatment, which is associated with structural defects, surface heterogeneity, and reduced π-conjugation. Furthermore, the fraction of oxidized groups is lower than that of VC (14% for ACE vs. 20% for VC). This result contrasts with the elemental analysis, which indicates that ACE contains a high bulk oxygen content. One possible explanation is that the oxygenated species are predominantly located within the internal microporous structure of ACE, making them less accessible to the XPS probe. This uneven distribution of oxygenated surface groups may explain why complete Pd deposition onto this carbon support was not achieved during the preparation of the Pd/ACE electrocatalysts. The H2O2 and HNO3-treated materials show a significant increase in the percentage of surface oxygen species. In the first case, ACEA shows a high fraction of C-O oxygenated groups, i.e., hydroxyl, ether, and epoxy groups, because hydrogen peroxide is less aggressive toward the carbon structure than HNO3. In this latter case, nitric acid, by its oxidizing power and the strong acidic environment, can more deeply attack C sp2 and sp3 structures, forming carbonyl compounds, quinones, and even carboxylic acids, esters, and lactones as the most oxidized species. Both results provide evidence of the oxidants’ significant effects on the ACE surface.
Figure 4 shows the evolution of the microporosity, mesoporosity, and external structures by assessing the BET, microporous, mesoporous, and external-area values. As observed, the chemical treatments of the ACE redistribute the pore structure. ACE is a highly microporous material with high mesoporosity and external surface area. Oxidation with H2O2 moderately reduces the BET surface area and microporous area, while slightly increasing the mesoporous and external areas. This restructuring suggests a slight collapse of some micropores, combined with pore opening induced by the mild oxidative action of hydrogen peroxide [27,28]. Nitric acid oxidation is more aggressive, reducing the overall BET surface area and microporous area while substantially increasing the mesoporous and external surface areas. These results indicate strong oxidative etching activity, leading to the collapse of the microporous structure, surface erosion, and the formation of larger pores. Thus, the material evolves from a mostly microporous to a balanced micro- and mesoporous structure, with its surface extensively oxidized [29,30,31].
2.3. Pd on Carbon Electrocatalysts. Physicochemical Characterization
Once the characterization of the candidate supports was completed, Pd electrocatalysts were prepared by chemical reduction with sodium formate. Table 3 displays the metal loading of the different electrocatalysts. As shown, the three prepared materials exhibit metal percentages close to their nominal values, indicating successful metal anchorage.
Figure S7 shows the XRD patterns of the different Pd electrocatalysts, which display the typical Pd0 fcc peaks. Table 4 displays the average Pd crystallite size. As expected, the oxygen-rich carbon surface of the ACEA and ACEB carbons, along with the increased exposed area, led to the formation of smaller Pd crystallites. This greater presence of oxygenated groups can extend their interaction with ionic Pd species in solution across the carbon surface, forming more anchoring sites and thereby favoring the growth of smaller, more dispersed Pd crystallites. Figure S8 shows the TEM images and the particle size distribution, with the average values reported in Table 4. The chemical oxidation of the ACE surface facilitates the dispersion of Pd nanoparticles on the support, leading to smaller particle sizes due to the greater availability of oxygenated anchoring sites.
2.4. Electrochemical Results in the Three-Electrode Glass Cell
Figure 5 shows the blank voltammetries of the Pd electrocatalysts with the different supports. As can be seen, all the materials show the typical shape of Pd nanoparticles on KOH, with peaks at low potentials associated with the desorption of hydrogen from the Pd surface, the formation of a Pd-OH layer at intermediate potentials, and, finally, at high potentials, the formation of PdO. The subsequent reduction of these species is observed in the cathodic scan. From the peak attributed to the PdO reduction, at circa 0.66 V vs. RHE, the electrochemically active surface area (EASA, see inset of Figure 5) [32]. The EASA sequence is Pd/ACEA > Pd/ACEB > Pd/VC, indicating that chemical activation enhances the dispersion of the formed Pd nanoparticles. The generated oxygenated groups likely serve as anchoring sites by coordinating with the Pd precursor and early-formed Pd0 embryos. On the other hand, the voltammetries show that the inclusion of oxygenated groups on the carbon surface increases the double-layer current due to increased carbon support capacity. The presence of oxygenated groups on the surface helps accumulate charge, especially in an alkaline medium, where these functional groups can be deprotonated (e.g., carboxylates, hydroxyls), resulting in greater surface hydrophilicity and stronger interactions with ions in solution [33,34].
To evaluate a possible influence of the carbon support on the oxidation of adsorbed CO, a relevant poisoning species that can be generated during the glycerol electro-oxidation reaction (GEOR) [35,36,37], Figure 6 shows the corresponding CO oxidation curves for the different materials. As can be observed, both the onset potentials, aside from the potential at which the maximum current is achieved, shift to lower potentials when the oxidized ACEA and ACEB supports are used. A reduction of approximately 0.1 V is observed comparing Pd/ACEB to Pd/VC. A more oxidized surface can affect the local availability of oxygenated species at the metal/support interface, promoting the oxidative removal of adsorbed CO at lower potentials [38,39]. This behavior highlights the important role of the carbon support, which is far from passive, especially in Pd/ACEA and Pd/ACEB, where more oxidized surfaces provide a more favorable environment for CO oxidation, likely through a bifunctional effect at the nanoparticle-support interface.
To preliminarily assess the performance of the candidate materials for glycerol electro-oxidation, Figure 7a displays the corresponding voltammetries in 1 mol L−1 KOH and glycerol. The results confirm the significant impact of the carbon support on the GEOR. On the one hand, the use of the largely oxygenated carbon supports, ACEA and ACEB, reduces the onset potential, as the oxygenated sites can act as oxygen sources required for the GEOR to occur. On the other hand, the particle-size effect can promote GEOR activity, allowing higher current densities to be achieved in the same sequence as particle size decreases (jPd/ACEB > jPd/ACEA > jPd/VC), combined with the aforementioned metal-oxidized support bifunctional effect. Indeed, the active role of the carbon support on Au and Pt nanoparticles for GEOR has already been demonstrated by Gomes et al. [40] when Pt and Au nanoparticles were deposited onto carbon compared to other non-active supports. We can extrapolate their observations to our Pd/ACEA and Pd/ACEB system.
Given that the study is devoted to the generation of green hydrogen, a rapid estimation of the potential hydrogen formed is presented in Figure 7b, represented with respect to the EASA, to reflect the effect of the increase of the available surface area (related to the inverse of the particle size), and the GEOR onset potential, related to the metal-oxidized support bifunctional effect. As can be seen, the variation from the Pd/CB to the Pd/ACEA is very accentuated (205%) due to the contribution of both effects, whereas in the comparison between Pd/ACEB and Pd/ACEA, the increase is more discrete (131%), as it is solely ascribed to the higher EASA that Pd/ACEB possesses. Thus, we can see the intrinsic mechanistic role of the carbon support in promoting GEOR, as well as its role in favoring greater dispersion of the Pd nanoparticles on the support.
2.5. Acid-Alkaline Glycerol Electroreformer
As a first analysis, Appendix A shows the benefits of operating in the acid-alkaline format and of electro-oxidizing alcohols rather than water. Next, we examine the ability of the acid-alkaline glycerol electroreformer (AAGE) to simultaneously generate hydrogen and electricity. Figure 8a presents the polarization and power curves in the region where both outputs are obtained from the AAGE, while Figure 8b illustrates the hydrogen production.
As shown, the use of chemically treated activated carbon improves the performance of the AAGE, allowing a wider electrochemical window for operation in the spontaneous region due to a higher open-circuit voltage (a parameter related to the onset potential). Also, the larger EASA of Pd/ACEA and Pd/ACEB, especially in the latter case, lead to achieving larger current densities in the entire range of current densities, which reflects on the higher maximum power densities, whose values are 0.0148 W cm−2 for Pd/VC, 0.0241 W cm−2 for Pd/ACEA, and 0.0284 W cm−2. In addition to electricity production, green hydrogen is produced, with values close to those predicted by Faraday’s law [41]. Moreover, Pd/ACEA and Pd/ACEB produce greater volumes of H2, achieving an overall maximum in the case of Pd/ACEB (15.5 mL vs. 15.85 predicted by Faraday’s law). Thus, the two activated carbons prepared from biomass and subsequently surface-oxidized by chemical treatment possess significant potential as active carbon supports for metal nanoparticles, such as palladium, as used in this study.
To complete the AAGE study, Figure 9 displays the chronoamperometric curves of the AAGE over 3 h at cell voltages of 0.155, 0.188, and 0.192 V for the Pd/VC, Pd/ACEA, and Pd/ACEB, respectively (those corresponding to the maximum power densities). Figure 9a shows the curves for the recycled and refed anodic solutions until the end of the experiment. In contrast, Figure 9b shows the corresponding curves for a single-pass anode solution configuration. These different configurations imply that in the former case, oxidation products accumulate in the anode compartment and are a part of the fuel fed to the AAGE. In the latter case, the anode fuel is always fresh. Focusing on the performance of the different electrocatalysts, the results corroborate the previous observations, with the following performance order: Pd/ACEB > Pd/ACEA > Pd/VC in both configurations (recycle and single-pass). Over time, the recycle configuration diminishes performance more quickly than the single-pass configuration. This observation has been previously documented in a study concerning an acid-alkaline ethanol electroreformer [22], and was attributed to the accumulation of oxidation products over time in the recycle mode, compared to the continuous refreshment of the fuel in the single-pass mode. This accumulation leads to blockage and deactivation of the Pd active sites. Given the greater complexity of the GEOR, in which a broader range of products can be obtained [42], we may tentatively extrapolate that explanation to our AAGE (the product distribution analyzed in sequence supports this).
The hydrogen produced by the AAGE during the recycle and single-pass operations is also shown in Figure 9c and d. As observed and consistent with the results in Figure 8, the hydrogen produced is close to that predicted by Faraday’s law, indicating that the sole reaction at the cathode is hydrogen evolution. Because electricity is also drawn from the AAGE, Table 5 summarizes the power and H2 flux produced by the electroreformer in the potentiostatic experiments with the different Pd electrocatalysts for each configuration. These estimates are obtained by integrating the chronoamperometric curves; the resulting area, multiplied by the cell voltage and divided by the time, yields the power output. In line with the sequence of results throughout this study, depositing Pd nanoparticles on oxidized activated carbons is beneficial for extracting more power from the AAGE, particularly when the ACE is treated with HNO3 to render the most oxidized carbon surface.
2.6. Product Distribution
Given the high added value of the GEOR products, Figure 10 shows the concentrations of the various products formed after 3 h of AAEG electroreforming in both the recycle and single-pass configurations. The six detected products are classified by the number of carbons, and, for each group, in order of increasing number of electrons involved in the oxidation of glycerol to these products (lactate, 2e−; glycerate, 4e−; tartronate, 8e−; glycolate, 5e−; oxalate, 11e−; formate, 8e−).
The product distributions presented are rather heterogeneous overall. However, there are some general trends: in the recycle mode, C3 products are predominant in Pd/VC, whereas C2 products are most abundant in Pd/ACEA, with C3 and C2 concentrations nearly equivalent in Pd/ACEB. These results indicate that the use of VC favors the preservation of the C-C-C structure, with the lowest contribution from C2 and C1 species. On the other hand, ACEA displays the highest concentration of C2 species, especially oxalate, the most oxidized C2 product, whilst ACEB shows the highest C3 concentration, especially tartronate, along with a high concentration of C2 oxalate. In the single-pass configuration, the product distribution shows a major contribution from the C3 species. The C2 and C1 carboxylates gain prominence in the ACEA and ACEB, with higher concentrations of the most oxidized C3 tartronate and C2 oxalate in the latter case.
Although the explanation of these tendencies is not straightforward, given the wide variety of parameters that influence the GEOR (Pd particle size, shape, and distribution; structure of the carbon support, its surface chemistry, among others), we have focused on comparing based on the effect of the different carbon supports. In particular, two parameters, one structural, the microporosity of the supports, and another compositional, the percentage of oxygenated groups on the carbon surface from XPS are considered. These parameters are compared with the variation of the average carbon oxidation state (ΔACOS) of the products collected after the potentiostatic experiments, as described in the Supplementary Information (ACOS of glycerol = −2/3). Table 6 presents all these parameters, as well as the contribution of C3, C2, and C1 species to the ΔACOS, including the contribution of the most oxidized species per group.
As indicated by the concentrations in Figure 10, Table 6 shows that in both operating modes, the use of oxidized carbon supports (ACEA and ACEB) yields higher ΔACOS than Pd/VC. Specifically, the ACEA support promotes the formation of C2 and C1 compounds via C–C cleavage, which may be associated with its higher microporosity. The increased fraction of micropores can favor the confinement of intermediate and partially oxidized species, effectively increasing their residence time near active sites and promoting consecutive oxidation steps, including C-C scission. In parallel, the higher density of oxygenated surface groups may facilitate the formation of strongly oxidized products, particularly oxalate, contributing to the highest ΔACOS observed. The ACEB also increases ACOS, although with a distinct product distribution: while the formation of C2 products, especially oxalate, is still favored, the contribution of the C3 tartronate becomes the most significant. This behavior can be rationalized by the comparatively lower microporosity of ACEB, which likely reduces the extent of intermediate confinement and, consequently, the progression toward extensive C-C cleavage. At the same time, the relatively high density of oxygenated groups continues to promote the formation of highly oxidized products, such as tartronate and, to a lesser extent, oxalate. These tendencies are consistently observed in both single-pass and recycle configurations, although the single-pass configuration yields the largest fraction of C3 products because the solution is continuously refreshed, eliminating the effects of accumulation and reprocessing of intermediate species, regardless of their carbon number.
3. Materials and Methods
3.1. Biochar Synthesis
Biochars from macauba were synthesized by pyrolysis at 750 °C. In a typical procedure, performed in a pilot-plant-scale pyrolysis reactor, 3.5 kg of the macauba endocarp (kindly donated by Cooperativa de Agricultores Familiares e Agroextrativistas Ambiental do Vale do Riachão (COOPERRIACHÃO) (Brasilia, DF, Brazil)) were pyrolyzed under a N2 atmosphere (flow rate of 10 L min−1) for 20 minutes at 750 °C, followed by a hydrothermal activation using steam preheated to 450 °C for 320 minutes. The pyrolyzer temperature during the activation stage was maintained at 750 °C (± 25 °C). Two samples were obtained, one without the vapor activation stage, labeled as CE, and the other with vapor activation, ACE. These biochars were thoroughly washed with distilled water (DW) until the conductivity and pH were close to those of DW. The obtained solids were crushed in a knife mill.
3.2. Chemical Treatment of the CE/ACE
The ACE was further activated by chemical treatment with two strong oxidizing agents, nitric acid (A) and hydrogen peroxide (B). This stage focuses on enhancing the attachment of Pd nanoparticles to the carbon support, since initial Pd/ACE samples demonstrated incomplete Pd deposition, indicated by a brownish supernatant during filtration after nanoparticle synthesis. In this procedure, one gram of material (CE or ACE) was dispersed in 100 mL of a 2.5 mol L−1 nitric acid (from a 65 wt.% solution, Sigma-Aldrich Brasil Ltda., Barueri, SP, Brazil) and hydrogen peroxide (from a 30 vol.% solution, Dinâmica Química Contemporânea Ltda., Indaiatuba, SP, Brazil). The mixture was left under full reflux, aided by a condenser, for 6 h. Afterward, the ACEA and ACEB were thoroughly washed with deionized water until the pH became constant.
3.3. Characterization of the CE/ACE/ACEA/ACEB
To determine the amounts of volatile matter, ash, moisture, and fixed carbon, the ABNT NBR rules 16587, 16586, 16508, and 16702 were used, respectively. The analyses were carried out using a LECO TGA701 thermogravimetric analyzer (Leco Corporation, St. Joseph, MI, USA). A mass of 0.8 to 1 g of biochar was heated from room temperature to 900 °C at a rate of 10 °C min−1 under a N2 flow of 25 mL min−1. Elemental analysis (CHNOS) was performed according to ISO 29541:2025 using a PE2400 Series II Elementar CHNS/O Analyzer (PerkinElmer do Brasil Analítica Ltda., São Paulo, SP, Brazil). The point of zero charge (pHPZC) was evaluated by titration using a solution of 0.01 mol L−1 NaCl to provide ionic strength, and 0.1 mol L−1 HCl or NaOH to adjust the initial pH between values in the range of 2 and 12, using volumes of 50 mL of solution containing 50 mg of the different carbons. After 48 h, the final pH was measured, building the curve pHfinal vs pHinitial, from which the intercept with the diagonal allows us to determine the pHPZC [43]
Acid oxygenated groups were quantified according to the Boehm method [44,45], using 50 mL of 0.02 mol L−1 NaHCO3, Na2CO3, and NaOH (reagents from Sigma-Aldrich Brasil Ltda., Barueri, SP, Brazil). To determine the total alkalinity, 50 mL of 0.02 mol L−1 HCl (37 wt.% solution, Sigma-Aldrich Brasil Ltda., Barueri, SP, Brazil). Before the titration, 300 mg of ACE were stirred for 48 h in 300 mL of deionized water, and the solution was filtered through a nylon membrane (pore size 45 μm, Whatman® nylon filter, Sigma-Aldrich Brasil Ltda., Barueri, SP, Brazil), with 10 mL of the supernatant recovered for titration. The microstructural analysis (surface area and pore-size distribution) of the AC was performed by measuring N2 isotherms on a Quanta Chrome NOVA 2000 (Anton Paar, Graz, Austria). The samples were pretreated by degasification under vacuum at 200 °C for 12 h. The specific area was calculated by the Brunauer-Emmett-Teller (BET) method. The micropore volume was determined using the t-plot method. The volume, size distribution, and mesoporous surface area were estimated using the Barrett-Joyner-Halenda (BJH) method.
X-ray Photoelectron Spectroscopy (XPS) was performed on the supports using a Scienta-Omicron ESCA Spectrometer (Scienta Omicron, Uppsala, Sweden), equipped with a monochromator, an Al Kα X-ray source (hν = 1486.6 eV), and a high-performance hemispherical analyzer. The photoemission energy was calibrated for 284.6 eV, corresponding to the C 1s level. A first survey spectrum was obtained over the 0-1200 eV range, with a step size of 1 eV and a residence time of 100 ms. Afterward, spectra in the C 1s and O 1s regions were recorded with a step size of 0.1 V and a residence time of 200 ms. The charge-neutralization effect on the samples was achieved by emitting a low-energy beam. The data were mathematically treated after Shirley-type background correction [46].
3.4. Synthesis of the Pd Electrocatalysts
Pd/ACE and Pd/VC were prepared by reduction with sodium formate [21]. Briefly, 100 mL of a solution containing sodium formate 0.01 mol L−1 at pH 13 (prepared by correcting the pH of a 0.01 mol L−1 formic acid (85 wt.% solution from Dinâmica Química Contemporânea Ltda., Indaiatuba, SP, Brazil) with 1 mol L−1 NaOH (ACS reagent, Dinâmica Química Contemporânea Ltda., Indaiatuba, SP, Brazil) solution). To this solution, 80 mg of VC/ACEA/ACEB was added and dispersed using an ultrasonic tip (Sonics Vibra-Cell VC 505, Biovera, Rio de Janeiro, RJ, Brazil). After dispersion, the reducing solution was stirred and heated to 80 °C. In parallel, 55.3 mg of Na2PdCl4 was dissolved in 8 mL of water in an ultrasonic bath. Once the temperature was reached, the precursor solution was added dropwise via a burette in three sequential additions, with 5 min between each addition. After the last precursor addition, the system was maintained at 80 °C for 1 h, then the heating was turned off and stirring continued for 12 h. Finally, the obtained powder was filtered, thoroughly washed with boiling water, and dried at 70 °C for 12 h. The materials produced were then ground to obtain a fine powder and stored under an N2 atmosphere for further use.
3.5. Physico-Chemical Characterization of the Pd Electrocatalysts
The metal loading was determined by Inductively Coupled Plasma Optical Emission Spectroscopy (ICP-OES) in an Agilent 5100 Dual-View ICP-OES (Agilent Technologies, Santa Clara, CA, USA). A previous metal digestion was performed by immersing 30 mg of the prepared material in boiling aqua regia for 3 h until complete evaporation, then redissolving in fresh aqua regia and analyzing the supernatant. X-ray diffraction patterns of the electrocatalysts were obtained in a Moniflex 300 diffractometer from Rigaku (Rigaku Corporation, Tokyo, Japan). The samples were scanned over 2θ angles from 20 to 90° at a scan rate of 0.5° min−1 and a step size of 0.05°. TEM images were obtained from a JEOL 2100 microscope operated at 200 kV at the LabMic (Laboratório Multiusuário de Microscopia de Alta Resolução, Univ. Federal de Goiás, Goiânia, Goiás, Brazil). The average particle size (D) was estimated from Equation 1, where ni is the number of particles whose size is Di.
3.6. Electrochemical Measurement in the Three-Electrode Glass Cell
The initial electrochemical characterization of the prepared Pd/C was carried out by cyclic voltammetry (CV) in 1 mol L−1 KOH. For this purpose, the working electrode was prepared by dispersing 4 mg of Pd/C in 1 mL of 2-propanol and 10 µL of Nafion® emulsion in an ultrasonic bath for 30 min. With the aid of an automatic pipette, 10 µL was deposited onto a circular reticulated vitreous carbon support (5 mm) inserted into a Teflon rod. The counter-electrode was a platinized platinum mesh, whereas the reference electrode was a Hg/HgO (in 1 mol L−1 KOH) electrode. A μ-Autolab (model Type III, Metrohm-Autolab, Utrecht, The Netherlands) potentiostat/galvanostat was coupled to a personal computer. General-Purpose Electrochemical System (GPES) software was used for electrochemical measurements. The blank voltammetries were executed between –0.926 and 0.474 V vs. Hg/HgO at a scan rate of 0.05 V s−1. Curves were repeated until a stable voltammogram shape was obtained. The integration of the PdO reduction peak allows estimation of the ECSA using Equation 2, where Q is the measured charge corresponding to the PdO reduction, v is the scan rate, and CPdO is the charge per monolayer of PdO (426 μC cm−2) [32].
CO-stripping was also carried out. In this case, the electrode potential was fixed at −0.826 V vs. Hg/HgO, bubbling the electrolyte with CO to saturate the Pd surface with adsorbed CO for 20 mins and, in sequence, with N2 for 40 min to remove any absorbed CO. Once completed this time, a CV were applied, from the −0.826 V to 0.474 V vs. Hg/HgO, corresponding to the CO oxidation process. GEOR were carried out under identical conditions to the blank voltammetries, in the presence of a glycerol concentration of 1 mol L−1, with a reduced scan rate of 0.005 V s–1. Curves were repeated until a stable voltammogram was obtained.
3.7. Acid-Alkaline Glycerol Electroreformer
Electroreforming tests were conducted in a 4 cm2 single-cell electroreformer. Details about the experimental setup are available elsewhere [21]. The anode used the prepared Pd electrocatalyst, with a Pd loading of 2 mg cm−2, whereas the cathode was prepared with a commercial 20 wt.% Pt on VC carbon black (Premetek Co., Cherry Hill, NJ, USA). As membrane electrolyte, a Nafion® 211 membrane (Chemour Co., Wilmington, DE, USA) was used, previously soaked in 1 mol L−1 KOH at 80 °C for 2 h. Next, the membrane was thoroughly washed with water. The electrodes were sandwiched together, and the cell was closed with an applied torque of 3 N · m. The anode was fed with an alkaline solution of 4 mol L−1 KOH with 1 mol L−1 glycerol, whereas the cathode was fed with 0.5 mol L−1 H2SO4 to maintain the pH gradient. The polarisation curves were recorded with an AUTOLAB PGSTAT 302 N potentiostat/galvanostat (Metrohm-Autolab, Utrecht, The Netherlands) in galvanodynamic mode, increasing from zero current to the point where the voltage reaches 0.0 V, at a scan rate of 0.001 V s–1, and at a temperature of 80 °C.
Potentiostatic experiments were conducted to analyze the system’s behavior under two simulated electrolysis conditions: a batch mode, in which the anodic outlet is returned to the feed reservoir, and a one-pass configuration, in which the fuel is pumped exclusively to the anode. The voltage was set to the value corresponding to the maximum output power density for each electrocatalyst. At the end of the experiment, a single sample was collected to determine the distribution of glycerol oxidation products. In both polarization curves and potentiostatic experiments, hydrogen from the cathode was collected using an inverted burette, as described by Abid et al. [47].
3.8. Product Distribution
The GEO products were detected by High Performance Liquid Chromatography (HPLC) on a modular Prominence HPLC (Shimadzu, Kyoto, Japan) equipped with an autosampler SIL-20A, column oven CTO-20A, photodiode-array detector SPD-M20A, and a refractive index detector. To reduce the samples’ alkalinity, they were diluted with ultrapure water to a pH of 13. Three ion-exclusion columns were used to separate the different products (Supelcogel™ C610H, length 30 cm, diameter 7.8 mm, particle size 9 μm). The compounds were identified by comparison with the peaks of the pure compounds, using a mobile phase composed of 0.1 mol L−1 H3PO4 at 60 °C. These were the most suitable conditions for separating the peaks of mesoxalic, oxalic, and tartronic acids on the one hand, and of glyceric acid and glyceraldehyde on the other. Before the sample injections, calibration curves were obtained for mesoxalate, oxalate, tartronate, glycerate, glyceraldehyde, glycolate, glyoxylate, dihydroxyacetone, lactate, and formate. All the standards were purchased from Sigma-Aldrich (Barueri, SP, Brazil). More details about the chromatographic sequence can be found elsewhere [42].
5. Conclusions
This study has demonstrated the potential of macauba endocarp as a raw material for producing carbon supports suitable for nanosized Pd electrocatalysts, which are then used in an AAEG to simultaneously produce H2 and electricity. A sequence of pyrolysis and hydrothermal treatments applied to the endocarp is required to produce a highly micro- and mesoporous structure, whose surface is then chemically oxidized with strong oxidants such as hydrogen peroxide or nitric acid to enrich it with oxygenated groups. The high surface area and a high percentage of oxygen-containing surface groups enable a better dispersion of the Pd nanoparticles, resulting in Pd/ACEA and Pd/ACEB electrocatalysts with a lower average particle size than Pd/VC.
These features positively impact GEOR performance, reducing the onset potential and increasing the current density, especially for the most oxidized Pd/ACEB, due to the combined effects of greater Pd dispersion and bifunctional Pd-carbon support interfacial interactions. All these results are reflected in the AAGE, where the Pd/ACEB produces the highest power output and, concomitantly, H2 with an efficiency close to 100%. Also, this enhanced performance is corroborated by a 3 h potentiostatic experiment, which yields the maximum power and hydrogen, regardless of whether the operation is in recycle or single-pass mode. The former configuration shows lower performance decay due to the lack of accumulation of oxidation products.
Finally, the carbon support influences the product distribution, where the microporosity and the presence of surface oxygenated groups favor, in the first case, the formation of C2 and C1 products, more abundant for the Pd/ACEA, and, in the second case, the most oxidized products of the detected sequence (tartronate for C3 and oxalate for C2), more abundant for Pd/ACEB. These effects are more pronounced during the recycle operation, as the fuel solution is continuously recirculated to the AAGE, promoting deeper oxidation, C-C cleavage, and accumulation. In single-pass mode, with the fuel refreshed, a lower degree of oxidation is observed, resulting in a higher abundance of C3 carboxylates, especially tartronate, in Pd/ACEA and, more pronouncedly, in Pd/ACEB, due to surface enrichment of oxygenated groups.
Supplementary Materials
The following supporting information can be downloaded at: www.mdpi.com/xxx/s1, Figure S1: Image of a macauba palm tree and the different parts of the fruit; Figure S2: Carbonized macauba waste after the pyrolysis/wet physical activation (left side), converted into a fine powder (right side); Figure S3: Percentage of volatile compounds, ashes, moisture, and fixed carbon for each stage of the biomass treatment and its comparison to VC, as well as the observed evolution of the sample weight over the applied treatments; Figure S4: Elemental C, H, N, and O analysis for each stage of the biomass treatment and its comparison with VC; Table S1: Point of zero charge of the different carbon materials; Figure S5: Acid (carboxylic, lactonic, and phenolic) and basic functional groups quantified by Boehm’s titration for the reference VC and biomass-based carbons; Table S2: Carbon oxidation state of the different glycerol oxidation products; Figure S6. Micro- and mesostructured characterization; Figure S7: XRD spectra of the different electrocatalysts; Figure S8: TEM images and particle size distribution of the different electrocatalysts.
Author Contributions
Conceptualization, R.G. and J.J.L.; methodology, F.M.L.A. and J.J.L.; validation, F.M.L.A. and S.P.F.; formal analysis, F.M.L.A. and J.J.L.; investigation, F.M.L.A.; resources, R.G. and S.P.F.; data curation, F.M.L.A. and J.J.L.; writing—original draft preparation, J.J.L.; visualization, J.J.L.; supervision, R.G., S.P.F. and J.J.L.; project administration, R.G. and S.P.F.; funding acquisition, R.G. and S.P.F. All authors have read and agreed to the published version of the manuscript.”
Funding
The authors thank Coordenação de Aperfeiçoamento de Pessoal de Nível Superior (CAPES) for a scholarship awarded to Rudy Crisafulli. In addition, we acknowledge the research scholarship provided by CNPq, FAPDF (process no. 0193.001.473/2017), and FINEP through the DENDEPALM project.
Data Availability Statement
Dataset available on request from the authors.
Conflicts of Interest
The authors declare no conflicts of interest
Appendix A
To show the relevance of the acid-alkaline operation and the replacement of water by glycerol as the “hydrogen/electrons source”, Figure A1 compares the performances for the single-cell operation in the mode of alkaline water electrolysis (AWE, 4 mol L−1 in both anode and cathode compartments), acid-alkaline water electrolysis (AAWE, 4 mol L−1 KOH in the anode, and 0.5 mol L−1 H2SO4 in the cathode compartment), alkaline glycerol electroreforming (AGE, 4 mol L−1 KOH and 1 mol L−1 glycerol in the anode, and 4 mol L−1 KOH the cathode compartment), and acid-alkaline glycerol electroreforming (AAGE, 4 mol L−1 KOH and 1 mol L−1 glycerol in the anode, and 0.5 mol L−1 H2SO4 in the cathode compartment) for the Pd/ACEB electrocatalyst.
As observed, the operation under conventional alkaline water electrolysis yields virtually no current/H2 up to 1.4 V, indicating that a high overpotential is required (the thermodynamic value is 1.23 V). On the other hand, when a pH gradient of 14 is applied, the available energy from the pH gradient (resulting from eventual neutralization) reduces the thermodynamic potential by 0.059ΔpH (= 0.83 V), making it possible for the AAWE to occur at 0.4 V. In practical terms, the AAWE electrolysis initiates at approximately 0.6 V, thereby reducing energy demand. When glycerol is added, the cell voltage is significantly lower than in AWE. This behavior is due to the higher chemical energy of the glycerol molecule, which reduces the potential barrier compared to AWE. Moreover, the establishment of a pH gradient provides a thermodynamic driving force that enables the spontaneous operation of the AAGE in a certain current density range, making the system extremely attractive and promising, due to the simultaneous generation of H2 and electricity.
Figure A1.
Comparison of the single cell electrolyzer/electroreformer performance under different operating modes, comparing the effects of the pH gradient and the replacement of water by glycerol as the “hydrogen/electrons source”.
Figure A1.
Comparison of the single cell electrolyzer/electroreformer performance under different operating modes, comparing the effects of the pH gradient and the replacement of water by glycerol as the “hydrogen/electrons source”.

References
- Karacan, C.; Lohmann-Richters, F.P.; Keeley, G.P.; Scheepers, F.; Shviro, M.; Müller, M.; Carmo, M.; Stolten, D. Challenges and Important Considerations When Benchmarking Single-Cell Alkaline Electrolyzers. Int. J. Hydrogen Energy 2022, 47, 4294–4303. [Google Scholar] [CrossRef]
- Liu, J.; Liu, H.; Yang, Y.; Tao, Y.; Zhao, L.; Li, S.; Fang, X.; Lin, Z.; Wang, H.; Tao, H.B.; et al. Efficient and Stable Proton Exchange Membrane Water Electrolysis Enabled by Stress Optimization. ACS Cent. Sci. 2024, acscentsci.4c00037. [Google Scholar] [CrossRef]
- Xu, Y.; Cai, S.; Chi, B.; Tu, Z. Technological Limitations and Recent Developments in a Solid Oxide Electrolyzer Cell: A Review. Int. J. Hydrogen Energy 2024, 50, 548–591. [Google Scholar] [CrossRef]
- Benghanem, M.; Mellit, A.; Almohamadi, H.; Haddad, S.; Chettibi, N.; Alanazi, A.M.; Dasalla, D.; Alzahrani, A. Hydrogen Production Methods Based on Solar and Wind Energy: A Review. Energies 2023, 16, 757–787. [Google Scholar] [CrossRef]
- Anand, C.; Chandraja, B.; Nithiya, P.; Akshaya, M.; Tamizhdurai, P.; Shoba, G.; Subramani, A.; Kumaran, R.; Yadav, K.K.; Gacem, A.; et al. Green Hydrogen for a Sustainable Future: A Review of Production Methods, Innovations, and Applications. Int. J. Hydrogen Energy 2025, 111, 319–341. [Google Scholar] [CrossRef]
- Colmati, F.; Bastos, T.L.; De Amorim Lino, F.M.; Linares, J.J. Hydrogen Production via Electroreforming. In Comprehensive Renewable Energy; Elsevier, 2022; Vol. 4, pp. 566–593. ISBN 978-0-12-819734-9. [Google Scholar]
- Miller, H.A.; Lavacchi, A.; Vizza, F. Storage of Renewable Energy in Fuels and Chemicals through Electrochemical Reforming of Bioalcohols. Curr. Opin. Electrochem. 2020, 21, 140–145. [Google Scholar] [CrossRef]
- Yaqoob, L.; Noor, T.; Iqbal, N. A Comprehensive and Critical Review of the Recent Progress in Electrocatalysts for the Ethanol Oxidation Reaction. RSC Adv. 2021, 11, 16768–16804. [Google Scholar] [CrossRef]
- Stepacheva, A.A.; Markova, M.E.; Lugovoy, Y.V.; Kosivtsov, Y.Yu.; Matveeva, V.G.; Sulman, M.G. Plant-Biomass-Derived Carbon Materials as Catalyst Support, A Brief Review. Catalysts 2023, 13, 655. [Google Scholar] [CrossRef]
- Liu, T.; Yabu, H. Biomass-Derived Electrocatalysts: Low-Cost, Robust Materials for Sustainable Electrochemical Energy Conversion. Adv. Energy Sustain Res. 2024, 5, 2300168. [Google Scholar] [CrossRef]
- Pérez-Rodríguez, S.; Pastor, E.; Lázaro, M.J. Electrochemical Behavior of the Carbon Black Vulcan XC-72R: Influence of the Surface Chemistry. Int. J. Hydrogen Energy 2018, 43, 7911–7922. [Google Scholar] [CrossRef]
- Tang, S.; Sun, G.; Qi, J.; Sun, S.; Guo, J.; Xin, Q.; Haarberg, G.M. Review of New Carbon Materials as Catalyst Supports in Direct Alcohol Fuel Cells. Chin. J. Catal. 2010, 31, 12–17. [Google Scholar] [CrossRef]
- Bezerra, C.W.B.; Zhang, L.; Liu, H.; Lee, K.; Marques, A.L.B.; Marques, E.P.; Wang, H.; Zhang, J. A Review of Heat-Treatment Effects on Activity and Stability of PEM Fuel Cell Catalysts for Oxygen Reduction Reaction. J. Power Sources 2007, 173, 891–908. [Google Scholar] [CrossRef]
- Mojapelo, N.A.; Seroka, N.S.; Khotseng, L. Macadamia Nut Bio-Waste: An Agricultural Waste with Potential to Be Used as Carbon Support Material in Fuel Cell Applications. Coatings 2023, 13, 1545. [Google Scholar] [CrossRef]
- Feng, Y.; Jiang, J.; Xu, Y.; Wang, S.; An, W.; Chai, Q.; Prova, U.H.; Wang, C.; Huang, G. Biomass Derived Diverse Carbon Nanostructure for Electrocatalysis, Energy Conversion and Storage. Carbon 2023, 211, 118105. [Google Scholar] [CrossRef]
- Kaur, J.; Kumar, A.; Gupta, R.K. Nanostructured Carbon Materials Derived from Biomass Waste for Electrocatalytic Hydrogen Production. Int. J. Hydrogen Energy 2024, S0360319924034670. [Google Scholar] [CrossRef]
- Goswami, S.; Dillip, G.R.; Nandy, S.; Banerjee, A.N.; Pimentel, A.; Joo, S.W.; Martins, R.; Fortunato, E. Biowaste-Derived Carbon Black Applied to Polyaniline-Based High-Performance Supercapacitor Microelectrodes: Sustainable Materials for Renewable Energy Applications. Electrochimica Acta 2019, 316, 202–218. [Google Scholar] [CrossRef]
- Shetty, A.; Hegde, G. Synthesis and Characterization of Biowaste-Derived Porous Carbon Supported Palladium: A Systematic Study as a Heterogeneous Catalyst for the Reduction of Nitroarenes. Reac Kinet. Mech. Cat. 2024, 137, 2989–3004. [Google Scholar] [CrossRef]
- Sarki, N.; Narani, A.; Naik, G.; Tripathi, D.; Jain, S.L.; Natte, K. Biowaste Carbon Supported Manganese Nanoparticles as an Active Catalyst for the Selective Hydrogenation of Bio-Based Aldehydes. Catal. Today 2023, 408, 127–138. [Google Scholar] [CrossRef]
- Murugesan, R.; Yesupatham, M.S.; Agamendran, N.; Sekar, K.; Neethinathan, C.S.S.; Maruthapillai, A. Recent Advances in Biomass-Derived Carbon-Based Nanostructures for Electrocatalytic Reduction Reactions: Properties–Performance Correlations. Energy Tech 2024, 12, 2400882. [Google Scholar] [CrossRef]
- Amorim, F.; Crisafulli, R.; Linares, J. An Alkaline-Acid Glycerol Electrochemical Reformer for Simultaneous Production of Hydrogen and Electricity. Nanomaterials 2022, 12, 1315–1327. [Google Scholar] [CrossRef]
- Amorim, F.M. de L.; Crisafulli, R.; Linares, J.J. Hydrogen and Electricity at Once: An Alkaline-Acidic Ethanol Electroreformer. Electrochem. Commun. 2023, 148, 107452. [Google Scholar] [CrossRef]
- Sun, Z.; Dai, L.; Lai, P.; Shen, F.; Shen, F.; Zhu, W. Air Oxidation in Surface Engineering of Biochar-Based Materials: A Critical Review. Carbon Res. 2022, 1, 32. [Google Scholar] [CrossRef]
- Chen, J.; Zhou, J.; Zheng, W.; Leng, S.; Ai, Z.; Zhang, W.; Yang, Z.; Yang, J.; Xu, Z.; Cao, J.; et al. A Complete Review on the Oxygen-Containing Functional Groups of Biochar: Formation Mechanisms, Detection Methods, Engineering, and Applications. Sci. Total Environ. 2024, 946, 174081. [Google Scholar] [CrossRef]
- Figueiredo, J.L.; Pereira, M.F.R.; Freitas, M.M.A.; Órfão, J.J.M. Modification of the Surface Chemistry of Activated Carbons. Carbon 1999, 37, 1379–1389. [Google Scholar] [CrossRef]
- Moraes, A.; Assumpção, M.H.M.T.; Simões, F.C.; Antonin, V.S.; Lanza, M.R.V.; Hammer, P.; Santos, M.C. Surface and Catalytical Effects on Treated Carbon Materials for Hydrogen Peroxide Electrogeneration. Electrocatalysis 2016, 7, 60–69. [Google Scholar] [CrossRef]
- Gomez-Serrano, V.; Acedo-Ramos, M.; Lopez-Ppeinado, A.; Valenzuela-Calahorro, C. Oxidation of Activated Carbon by Hydrogen Peroxide. Study of Surface Functional Groups by FT-i.r. Fuel 1994, 73, 387–395. [Google Scholar] [CrossRef]
- Moreno-Castilla, C.; Ferro-Garcia, M.A.; Joly, J.P.; Bautista-Toledo, I.; Carrasco-Marin, F.; Rivera-Utrilla, J. Activated Carbon Surface Modifications by Nitric Acid, Hydrogen Peroxide, and Ammonium Peroxydisulfate Treatments. Langmuir 1995, 11, 4386–4392. [Google Scholar] [CrossRef]
- Lakshminarayanan, P.V.; Toghiani, H.; Pittman, C.U. Nitric Acid Oxidation of Vapor Grown Carbon Nanofibers. Carbon 2004, 42, 2433–2442. [Google Scholar] [CrossRef]
- Lu, X.; Jiang, J.; Sun, K.; Xie, X.; Hu, Y. Surface Modification, Characterization and Adsorptive Properties of a Coconut Activated Carbon. Appl. Surf. Sci. 2012, 258, 8247–8252. [Google Scholar] [CrossRef]
- Berenguer, R.; Morallón, E. Oxidation of Different Microporous Carbons by Chemical and Electrochemical Methods. Front. Mater. 2019, 6, 130. [Google Scholar] [CrossRef]
- Şahin, N.E.; Pech-Rodríguez, W.J. Scrutinizing the Basis of Pd Electrochemistry: An Accurate Assessment of the Electrochemically Active Surface Area. Electroanalysis 2025, 37, e12027. [Google Scholar] [CrossRef]
- Kecira, Z.; Kaizra, S.; Benturki, O.; Alouache, A.; Berrabah, S.E.; Daoud, M.; Derkaoui, K. Synthesis of Oxygen-Functionalized Biomass-Based Activated Carbon as Supercapacitor with Improved Electrochemical Performance. Appl. Phys. A 2023, 129, 863. [Google Scholar] [CrossRef]
- Wang, Y.; Chang, Z.; Zhang, Z.; Lin, J.; Qian, M.; Wang, P.; Lin, T.; Huang, F. A Facile Approach To Improve Electrochemical Capacitance of Carbons by in Situ Electrochemical Oxidation. ACS Appl. Mater. Interfaces 2019, 11, 5999–6008. [Google Scholar] [CrossRef]
- De Souza, M.B.C.; Vicente, R.A.; Yukuhiro, V.Y.; V. M. T. Pires, C.T.G.; Cheuquepán, W.; Bott-Neto, J.L.; Solla-Gullón, J.; Fernández, P.S. Bi-Modified Pt Electrodes toward Glycerol Electrooxidation in Alkaline Solution: Effects on Activity and Selectivity. ACS Catal. 2019, 9, 5104–5110. [CrossRef]
- González-Cobos, J.; Baranton, S.; Coutanceau, C. Development of Bismuth-Modified PtPd Nanocatalysts for the Electrochemical Reforming of Polyols into Hydrogen and Value-Added Chemicals. ChemElectroChem 2016, 3, 1694–1704. [Google Scholar] [CrossRef]
- Zalineeva, A.; Serov, A.; Padilla, M.; Martinez, U.; Artyushkova, K.; Baranton, S.; Coutanceau, C.; Atanassov, P.B. Glycerol Electrooxidation on Self-Supported Pd1Sn Nanoparticules. Appl. Catal. B Environ. 2015, 176–177, 429–435. [Google Scholar] [CrossRef]
- De La Fuente, J.L.G.; Rojas, S.; Martínez-Huerta, M.V.; Terreros, P.; Peña, M.A.; Fierro, J.L.G. Functionalization of Carbon Support and Its Influence on the Electrocatalytic Behaviour of Pt/C in H2 and CO Electrooxidation. Carbon 2006, 44, 1919–1929. [Google Scholar] [CrossRef]
- Yonamine, N.C.; Zanata, C.R.; De Souza, M.B.C.; Fernández, P.S.; Wender, H.; Martins, C.A. Glycerol Electrolyzer with Graphite Anode and Cathode Produces Carbonyl Compounds and Hydrogen: Background Electrocatalysis of a “Nonparticipating” Current Collector. ACS Appl. Mater. Interfaces 2024, 16, 18918–18926. [Google Scholar] [CrossRef]
- Gomes, J.F.; Gasparotto, L.H.S.; Tremiliosi-Filho, G. Glycerol Electro-Oxidation over Glassy-Carbon-Supported Au Nanoparticles: Direct Influence of the Carbon Support on the Electrode Catalytic Activity. Phys. Chem. Chem. Phys. 2013, 15, 10339. [Google Scholar] [CrossRef]
- De Paula, J.; Nascimento, D.; Linares, J.J. Influence of the Anolyte Feed Conditions on the Performance of an Alkaline Glycerol Electroreforming Reactor. J. Appl. Electrochem 2015, 45, 689–700. [Google Scholar] [CrossRef]
- Costa Santos, J.B.; Vieira, C.; Crisafulli, R.; Linares, J.J. Promotional Effect of Auxiliary Metals Bi on Pt, Pd, and Ag on Au, for Glycerol Electrolysis. Int. J. Hydrogen Energy 2020, 45, 25658–25671. [Google Scholar] [CrossRef]
- Gutierrez-Martinez, J.; Martinez-Vargas, D.R.; Vences-Alvarez, E.; Arjona-Jaime, P.; López-Cázares, M.I.; Rios-Saldaña, L.E.; Isaacs-Páez, E.D.; Quijano-Meza, M.; Rocha-Medina, C.; Rangel-Mendez, R. Point of Zero Charge, Isoelectric Point, and Potential of Zero Charge on Activated Carbons: A Comprehensive Interpretation about Their Interrelation. Curr. Opin. Solid State Mater. Sci. 2026, 40, 101247. [Google Scholar] [CrossRef]
- Schönherr, J.; Buchheim, J.; Scholz, P.; Adelhelm, P. Boehm Titration Revisited (Part I): Practical Aspects for Achieving a High Precision in Quantifying Oxygen-Containing Surface Groups on Carbon Materials. C 2018, 4, 21. [Google Scholar] [CrossRef]
- Breen, R.; Goggin, C.; Holmes, J.D.; Collins, G. A Collaborative Cocurricular Undergraduate Research Experience on Sustainable Materials: Analysis of Biochar Using the Boehm Titration and Spectroscopic Techniques. J. Chem. Educ. 2025, 102, 1323–1332. [Google Scholar] [CrossRef]
- Végh, J. The Shirley Background Revised. J. Electron Spectrosc. Relat. Phenom. 2006, 151, 159–164. [Google Scholar] [CrossRef]
- Abid, H.A.; Ong, J.W.; Lin, E.S.; Liew, O.W.; Ng, T.W. Volume and Rate Measurement of Slowly Generated Gas Bubbles. Flow Meas. Instrum. 2020, 72, 101694. [Google Scholar] [CrossRef]
Figure 1.
Evolution of the C, H, N, and O percentages present in the ACE carbon after the respective chemical oxidation treatment with H2O2 (A) and HNO3 (B).
Figure 1.
Evolution of the C, H, N, and O percentages present in the ACE carbon after the respective chemical oxidation treatment with H2O2 (A) and HNO3 (B).

Figure 2.
Functional groups distribution for the ACE base sample, and after the chemical treatments with H2O2 and HNO3.
Figure 2.
Functional groups distribution for the ACE base sample, and after the chemical treatments with H2O2 and HNO3.

Figure 3.
C 1s XPS spectra of the different carbon supports: (a) VC, (b) ACE, (c) ACEA, and (d) ACEB.
Figure 3.
C 1s XPS spectra of the different carbon supports: (a) VC, (b) ACE, (c) ACEA, and (d) ACEB.

Figure 4.
Effect of the chemical activation of the ACE carbon on the micro- and mesostructures of the ACE.
Figure 4.
Effect of the chemical activation of the ACE carbon on the micro- and mesostructures of the ACE.

Figure 5.
Blank voltammetries of the Pd nanoparticles supported on the different carbon supports in 1 mol L−1 KOH (inset: electrochemically active surface area, EASA, of the different electrocatalysts).
Figure 5.
Blank voltammetries of the Pd nanoparticles supported on the different carbon supports in 1 mol L−1 KOH (inset: electrochemically active surface area, EASA, of the different electrocatalysts).

Figure 6.
CO-oxidation curves obtained after a CO-stripping experiment applied to the different electrocatalysts.
Figure 6.
CO-oxidation curves obtained after a CO-stripping experiment applied to the different electrocatalysts.

Figure 7.
(a) GEO curves for the different electrocatalysts, including the onset potentials in the inset of the figure, and (b) Potential H2 produced from the GEOR as a function of the onset potential (more related to the metal-support bifunctional effect) and the EASA (related to the effect of the particle size and available surface area for GEOR).


Figure 8.
(a) Polarization and power output curves for Pd catalysts supported onto the different carbon materials, and (b) experimental and theoretical H2 produced in the AAGE.
Figure 8.
(a) Polarization and power output curves for Pd catalysts supported onto the different carbon materials, and (b) experimental and theoretical H2 produced in the AAGE.


Figure 9.
(a) Polarization and power output curves for Pd catalysts supported onto the different carbon materials, and (b) experimental and theoretical H2 produced in the AAGE.
Figure 9.
(a) Polarization and power output curves for Pd catalysts supported onto the different carbon materials, and (b) experimental and theoretical H2 produced in the AAGE.

Figure 10.
Quantified GEOR products of the potentiostatic experiments in (a) recycle, and (b) single-pass configuration, grouped by the number of carbons in the sequence of more oxidized states.
Figure 10.
Quantified GEOR products of the potentiostatic experiments in (a) recycle, and (b) single-pass configuration, grouped by the number of carbons in the sequence of more oxidized states.


Table 1.
Point of zero charge resulting from the chemical treatment of the ACE base carbon.
| Material | pH |
| ACE | 5.1 |
| ACEA | 4.6 |
| ACEB | 3.2 |
Table 2.
Distribution of the surface C species for each carbon.
| Carbon species | Binding energy (eV) | VC | ACE | ACEA | ACEB |
| Graphitic (sp2) | ~ 284.4 | 66.7 | 54.5 | 45.6 | 35.6 |
| Aliphatic (sp3) | ~ 285.2 | 12.3 | 31.6 | 22.1 | 22.2 |
| C-O (hydroxyl, ether, epoxy) | ~ 286.2 | 9.8 | 3.2 | 19.8 | 14.3 |
| C=O (carbonyl, quinone) | ~ 287.5 | 4.5 | 6.6 | 6.4 | 12.5 |
| O-C=O (carboxyl, ester, lactone) | ~ 288.9 | 5.6 | 4 | 5.8 | 14.9 |
| π–π* shake-up | ~ 290.5 | 1.1 | 0 | 0.3 | 0.4 |
Table 3.
Palladium wt.% of the prepared electrocatalysts.
| Material | Metal percentage |
| Pd/VC | 19.4 ± 0.4 |
| Pd/ACEA | 19.6 ± 0.6 |
| Pd/ACEB | 20.3 ± 0.3 |
Table 4.
Average Pd crystallite size for the different electrocatalysts.
| Material | Average Pd crystallite size (nm) | Average TEM particle size (nm) (Standard deviation) |
| Pd/VC | 7.6 ± 0.1 | 6.7 (1.6) |
| Pd/ACEA | 5.9 ± 0.2 | 5.2 (1.2) |
| Pd/ACEB | 5.8 ± 0.4 | 4.3 (1.2) |
Table 5.
Power and hydrogen flux extracted from the AAGE over the potentiostatic experiments.
| Material | Recycle | Single-pass | ||
| Power (kW m−2) | H2 flux (STP m3 m−2h−1) | Power (kW m−2) | H2 flux (STP m3 m−2h−1) | |
| Pd/VC | 0.100 | 0.260 | 0.151 | 0.400 |
| Pd/ACEA | 0.202 | 0.438 | 0.238 | 0.520 |
| Pd/ACEB | 0.247 | 0.531 | 0.280 | 0.600 |
Table 6.
Variation of the average carbon oxidation state of the product mixture, by number of carbons (in parentheses the most oxidized species), compared to the microporous area and the percentage of oxygenated species on the carbon surface.
Table 6.
Variation of the average carbon oxidation state of the product mixture, by number of carbons (in parentheses the most oxidized species), compared to the microporous area and the percentage of oxygenated species on the carbon surface.
| Recycle configuration | ||||||
| Material | Microporous area of the support (m2 g−1) | % of oxygenated species on the surface support | ΔACOS |
ΔACOS from C3 (% from tartronate) |
ΔACOS from C2 (% from oxalate) | ΔACOSfrom C1 |
| Pd/VC | 3.2 | 19.9 | 2.132 | 1.235 (53.7) | 0.764 (87.5) | 0.133 |
| Pd/ACEA | 340 | 32 | 2.507 | 0.668 (44.2) | 1.626 (92.0) | 0.213 |
| Pd/ACEB | 197.9 | 41.7 | 2.484 | 1.126 (69.7) | 1.218 (92.2) | 0.139 |
| Single-pass configuration | ||||||
| Pd/VC | 3.2 | 19.9 | 2.052 | 1.430 (54.4) | 0.596 (89.5) | 0.026 |
| Pd/ACEA | 340 | 32 | 2.299 | 1.249 (55.6) | 1.014 (96.7) | 0.037 |
| Pd/ACEB | 197.9 | 41.7 | 2.326 | 1.454 (67.3) | 0.832 (95.7) | 0.039 |
Disclaimer/Publisher’s Note: The statements, opinions and data contained in all publications are solely those of the individual author(s) and contributor(s) and not of MDPI and/or the editor(s). MDPI and/or the editor(s) disclaim responsibility for any injury to people or property resulting from any ideas, methods, instructions or products referred to in the content. |
© 2026 by the authors. Licensee MDPI, Basel, Switzerland. This article is an open access article distributed under the terms and conditions of the Creative Commons Attribution (CC BY) license (http://creativecommons.org/licenses/by/4.0/).
Copyright: This open access article is published under a Creative Commons CC BY 4.0 license, which permit the free download, distribution, and reuse, provided that the author and preprint are cited in any reuse.


