

Submitted:
22 May 2026
Posted:
25 May 2026
You are already at the latest version
Abstract
N-of-1 medicine reasons about one patient at a time using that patient's own molecular data, but lacks standardized evidence architectures. Current strategies depend on fragmented biomarkers, population-level associations, or expert preference, limiting auditability and reproducibility. Here we present SteeraMed Core, a framework that addresses these limitations by representing individual molecular state through PPI-network modules, linking it to candidate interventions via a steerability alignment score, and packaging the result as an auditable evidence chain. Retrospective positive-control evaluation across three disease and one aging methylation cohort supported the PPI-module design. Known drugs were recovered above random chance in rheumatoid arthritis (5.8-fold), breast cancer (5.1-fold), and aging (1.8-fold with literature-convergent candidates niacin and colchicine). In depression, nutraceuticals exceeded baseline recovery particularly in mid-age sub-cohorts (36-55 years, ~2.0-fold enrichment). Patient-level evidence chains, each composed of four layers (perturbed modules, drug-module alignment scores, mechanism annotations, and bootstrap confidence), illustrated how the framework links individual molecular state to ranked candidate interventions, aligning with the FDA Plausible Mechanism Framework's emphasis on traceable mechanistic evidence. These results support PPI modules as effective leverage points that aggregate weak individual signals into coherent functional units. Critically, PPI modules retained above-baseline drug recovery under progressive Gaussian noise, whereas single-gene representations collapsed, confirming greater robustness of module-level alignment. Together, these results establish the core of a Steerable Biomedical World Model that directly addresses the three limitations above: PPI modules replace fragmented biomarkers with coherent functional units; per-patient scoring replaces population-level associations with individual mechanism alignment; and evidence chains from public data replace expert preference with auditable reasoning. This core has been validated through retrospective positive-control recovery, not clinical efficacy. Converting it into a full learning system will require prospective cohorts with paired pre- and post-intervention measurements.
Keywords:
SteeraMed
; steerable biomedical world model
; N-of-1 individualized intervention
; molecular evidence chains
; DNA methylation
; protein-protein interaction networks
; compound-target alignment
; steerability
; positive-control recovery
1. Introduction
1.1. Medicine Needs World Models, Not Only Predictive Models
Medicine increasingly requires systems that can represent patient state, encode candidate interventions, generate testable transition hypotheses, monitor response, and update future actions [1,2,3,4]. World models, computational architectures that learn system-state representations, simulate outcomes, and plan toward goals, have driven breakthroughs in game playing [5] and are now explored for biomedicine [6]. Most biomedical AI systems, however, remain predictive: they estimate disease risk or classify samples from static snapshots. Intervention reasoning requires a different architecture, one that explicitly represents state, action, transition hypothesis, and objective, generating auditable, testable mechanism-alignment hypotheses rather than opaque predictions.
No existing framework has translated the world-model paradigm into a standardized evidence-chain architecture for individualized intervention reasoning.
1.2. N-of-1 Intervention Reasoning Needs Auditable Evidence Chains
N-of-1 medicine — the design and evaluation of interventions at the individual-patient level — requires evidence objects that are individualized, mechanistic, auditable, and longitudinally testable. However, current individualized intervention strategies often rely on fragmented biomarkers, population-level associations, or expert preference, making them difficult to audit, compare, reproduce, or improve.
Regulatory discussions around individualized therapies provide a useful analogy. FDA guidance for individualized antisense oligonucleotide products [7,8] and the Plausible Mechanism Framework for Individualized Therapies [9] emphasize five evidentiary components: molecular abnormality definition, intervention-to-mechanism linkage, reference or natural-history context, target engagement, and outcome or biomarker response. Although the present study addresses individualized intervention reasoning rather than regulatory compliance, these principles provide a useful template for structuring individualized evidence. We do not claim that SteeraMed satisfies FDA evidentiary requirements; rather, we borrow the epistemic structure of mechanism-based individualized evidence to guide computational evidence-chain design.
1.3. Steerability: A Key Design Principle for Biomedical World Models
A biomedical world model for individualized intervention reasoning requires a way to assess whether a candidate intervention is aligned with the patient's molecular state. We term this property steerability: the degree to which an intervention's mechanism of action overlaps with the patient's perturbed molecular modules. In a companion paper, we outlined the general SteeraMed architecture as a steerability-oriented framework for biomedical world models [10], defining constraint checkpoints for state representation, state quantification, intervention-response semantics, counterfactual transition, and deviation inspection. The SEMO algorithm (Selective Remodeling of Protein Networks by Chemicals) [11] proposed a complementary network-medicine scoring principle for linking compound target profiles with protein-network perturbation patterns.
The present paper reports SteeraMed Core, the molecular-network implementation layer of SteeraMed. Rather than reintroducing the general framework, it implements one concrete layer: mapping individual DNA methylation perturbations onto PPI modules and scoring compound-module alignment using known-drug recovery as a retrospective positive-control task. The detailed methods are described in Section 2.
1.4. Contributions
This paper makes three contributions:
1. A molecular-network evidence-chain architecture for N-of-1 intervention reasoning. We frame individualized intervention reasoning as a state-action-transition-evidence problem, representing individual molecular state through promoter-level methylation perturbations mapped to PPI modules, and linking candidate interventions via a steerability alignment score.
2. Retrospective positive-control evaluation across three disease cohorts. Using known-drug recovery in public methylation cohorts (rheumatoid arthritis, breast cancer, depression) and one aging cohort, we test whether the evidence-chain pipeline produces biologically plausible rankings. Module-level aggregation preserved signal under artificial noise more robustly than single-gene representations.
3. A roadmap toward calibrated transition learning. We identify the data requirements for converting SteeraMed Core from a static mechanism-alignment framework into a calibrated state-action-next-state transition model.
A project overview and future implementation resources will be made available through https://steeramed.com, and the SteeraMed v1.0 codebase is planned for release on GitHub upon publication.
2. Methods
2.1. Terminology: SteeraMed, SteeraMed Core, SEMO, and SA Score
Throughout this paper, SteeraMed (short for Steerable Medicine) refers to the Steerable Biomedical World Model system for N-of-1 individualized intervention reasoning. The name emphasizes the goal of moving medicine from passive prediction toward auditable, intervention-oriented, and iteratively testable reasoning. The long-term goal of SteeraMed is to support state representation, candidate action encoding, transition-hypothesis generation, response monitoring, and iterative intervention learning in medicine.
The present study reports SteeraMed Core, the molecular-network implementation layer of SteeraMed. SteeraMed Core integrates promoter-level DNA methylation perturbations, STRING protein-protein interaction modules, STITCH compound-target annotations, and patient-level evidence-chain generation. It is designed to convert individual molecular states and candidate intervention actions into auditable, testable mechanism-alignment hypotheses.
SEMO refers to an earlier network-medicine scoring principle, originally introduced as Selective Remodeling of Protein Networks by Chemicals [11], that linked compound target profiles to perturbed protein-network regions. In SteeraMed Core, this principle is operationalized as a steerability alignment score, or SA score, defined as a Welch-type contrast statistic comparing methylation deltas of compound-target genes against non-target genes within disease-perturbed PPI modules. The statistic is used as a ranking feature, not for inferential p-value interpretation, because genes within modules are not independent (connected through PPI and potentially co-regulated).
The current SteeraMed Core implementation should be interpreted as a molecular evidence-chain engine and the core implementation of a Steerable Biomedical World Model. It does not yet implement learned dose-response dynamics, multi-step planning, or calibrated state-action-next-state transition learning. This separation allows the SteeraMed system to be evaluated independently of the current SteeraMed Core implementation — future work may develop improved scoring algorithms and additional implementation layers within the same system.
2.2. Overview
SteeraMed takes as input (i) a gene-level DNA methylation matrix (cases and controls), (ii) a PPI network (STRING), and (iii) a chemical-protein target database (STITCH). It outputs, for each patient, a ranked list of FDA-approved compounds with associated four-layer evidence chains (Figure 1).
2.3. Three-Layer Funnel
The SteeraMed Core pipeline applies three sequential filters to reduce the combinatorial space while preserving biological signal:
Level 1: PPI module selection. We construct PPI subnetworks by taking each protein in STRING (combined score >= 400) and its first-order neighbors. PPI modules aggregate information over functionally related genes [18], providing a more robust unit for state-action alignment than individual genes. Modules with 20-800 genes overlapping the methylation data are retained (~14,000 modules). For each module, we compute the mean methylation delta across all case patients and test against zero using a one-sample t-test. The top 100 modules by p-value are selected. Note: PPI selection uses group-level deltas (all cases pooled); individual patients' N=1 evaluations are then performed on these group-selected modules. We use p-values for ranking rather than significance testing - no multiple comparison correction is applied, as top-K selection does not require a significance threshold. This identifies the PPI subnetworks most perturbed in the disease.
Level 2: Chemical pool curation. From STITCH (score >= 200), we retained FDA-approved or clinically annotated compounds with sufficient compound-target annotations. Disease-specific known therapeutic drugs or biologically supported interventions were marked as positive controls for evaluation but remained part of the same candidate pool. This design reflects SteeraMed Core's intended use case: ranking available candidate interventions against an individual molecular state, rather than conducting fully blinded novel drug discovery. Compounds with insufficient target coverage in the methylation-derived gene space were excluded according to phenotype-specific target-count thresholds (see Table S4). This yields a candidate pool of ~1,500 compounds for RA and BC, and ~966 for depression (after expanding to include nutraceuticals with broad target profiles).
Level 3: Steerability alignment feature computation. For each (PPI module, chemical) pair, we compute the steerability alignment score: a Welch-type contrast statistic comparing methylation deltas of target genes (chemical targets intersecting PPI module) versus non-target genes (PPI module minus chemical targets). This statistic is used as a ranking feature, not for inferential p-value interpretation, because genes within modules are not independent. Pairs with fewer than 3 target or 3 non-target genes are excluded. We rank the ~15,000 eligible features by their mean absolute alignment score across all case patients and select the top 200. This group-level ranking identifies the most consistently perturbed drug-module pairs. Individual patients' importance scores are then computed from their personal top-50 features (Section 2.6).
Feature selection dependence note. Because PPI modules and drug-module features are selected using disease-level case-control methylation differences, the evaluation should be interpreted as enrichment within a disease-informed feature space rather than a fully blind discovery setting.
2.4. N=1 Individualization
For each case patient, we compute a personalized methylation delta vector:
2.5. Steerability Alignment Score (SA Score)
For patient and feature pair , SteeraMed computes a steerability alignment score:
2.6. Importance Score
For each patient, we select the top 50 features by absolute steerability alignment score. The importance score of a chemical is its frequency of appearance among these top-50 features. Chemicals are ranked by importance score, yielding a personalized compound prioritization.
2.7. Four-Layer Evidence Chain
For each prioritized compound, SteeraMed generates:
Layer 1 - Individual State Characterization: List of nominally perturbed PPI modules in this patient (one-sample t-test on delta, p < 0.05 used as a nominal threshold), with mean delta, p-value, and gene count.
Layer 2 - Steerability Alignment: For the prioritized compound, alignment scores and target-to-module mappings for each matched PPI module, showing which drug targets fall within which perturbed modules.
Layer 3 - Mechanism Annotation: For the top-ranked known drug, the specific target genes within each matched PPI module, and the Hallmark pathway annotations of those modules, providing a mechanistic narrative linking drug targets to the patient's perturbed molecular context.
Layer 4 - Ranking Confidence: Bootstrap stability (200 iterations, sampling patients with replacement) reporting how frequently each compound appears in the patient's top-10.
2.8. Evaluation Methods
Positive control definition. In this study, positive controls refer to known disease-relevant or literature-supported interventions used as evaluation labels. They are not treated as treatment recommendations for individual patients. Positive-control recovery tests whether SteeraMed Core can enrich known plausible interventions within personalized compound rankings compared with phenotype-specific random baselines. Therefore, Recall-K should be interpreted as a retrospective known-action recovery metric, not as evidence of clinical efficacy or treatment-selection accuracy.
Recall-K: For each patient, we check whether any known therapeutic drug (positive control) appears in the top-K ranked compounds. Recall-K = (patients with hit) / (total patients). This is a known-action recovery metric rather than a novel drug-discovery metric. The disease-specific random baseline for Recall-K is the probability that at least one positive-control drug appears in a randomly selected top-K from N candidates containing K_pos positive controls: 1 − (1 − K_pos/N)^K (binomial approximation).
Exploratory methylation-state concordance analysis: For each known drug, we compute the per-patient average methylation delta across all its STITCH target genes, then test whether the group mean differs from zero (one-sample t-test across patients). For a subset of inflammation-related drugs (anti-inflammatory, immunosuppressive, and antioxidant classes), we explored whether target genes showed coherent methylation shifts in disease-associated blood profiles. This analysis is descriptive and should not be interpreted as pharmacodynamic directionality: promoter methylation does not directly measure gene expression, protein activity, or drug-target engagement. Without matched gene-expression, protein, cell-composition, or target-engagement data, promoter methylation cannot establish whether a drug target is transcriptionally active, inhibited, or pharmacologically engaged. Drugs with other mechanism classes (e.g., enzyme inhibition) are excluded because no coherent methylation shift prediction can be made.
Leave-one-drug-out (LOO): For each known drug, we remove it from the chemical pool, recompute SteeraMed, and measure Recall-10 for the remaining drugs. This tests whether the ranking depends on any single drug.
Per-patient permutation test: For each patient, we randomly sample the same number of (PPI-module, compound) pairs from all eligible pairs (i.e., pairs meeting the minimum target/non-target gene overlap threshold) and measure how many known drugs appear in the resulting top-10. The p-value is the fraction of 500 permutations where the random hit count >= the real hit count. Note: This tests whether the specific SEMO-score-based ranking enriches known drugs beyond what random pair selection would yield, but does not recompute alignment scores from shuffled case/control labels. A more conservative gold-standard approach would require re-computing all patient deltas and alignment scores from permuted case/control labels for each iteration - computationally prohibitive given the pipeline's cost. Evaluation using a single global permutation of case/control labels for group-level features would partially address this concern, but at the cost of losing patient-level resolution.
2.9. Datasets
We used DNA methylation data from three disease cohorts and one aging cohort, all derived from public GEO datasets. For each dataset, we extracted promoter-region methylation signals by mapping CpG probes to gene promoter regions (TSS1500 + TSS200, Illumina 450K/EPIC annotation) and averaging CpG beta values within each gene's promoter to produce gene-level beta values. All datasets used whole blood. Whole-blood promoter methylation deltas should be interpreted as composite molecular-state signals reflecting immune cell composition, cellular activation, exposure history, and gene-regulatory state, rather than direct gene-expression measurements.
1. Rheumatoid Arthritis (GSE42861): Whole blood, Illumina 450K platform. 354 cases (RA) and 335 controls, age- and sex-matched (K=10 matched controls per case, caliper = 5 years). Cases were defined by clinical RA diagnosis; controls were healthy individuals without autoimmune disease.
2. Breast Cancer (GSE51032): Whole blood, Illumina 450K platform. 235 cases (breast cancer) and 424 controls, age- and sex-matched (K=15, caliper = 5 years). Cases were patients with confirmed breast cancer diagnosis; controls were cancer-free individuals.
3. Depression (GSE128235): Whole blood, Illumina 450K platform. 324 cases (major depressive disorder, MDD) and 209 controls (healthy controls, HC), age- and sex-matched (K=10, caliper = 5 years). Cases met DSM criteria for MDD; controls had no psychiatric diagnosis.
4. Aging (GSE40279, Hannum cohort): Whole blood, Illumina 450K platform. 656 individuals aged 19-101. For the aging analysis (Section 3.4), we used age-stratified groups as a phenotypic proxy: young adults (<50 years, N=109, mean age 41.0) as the reference population and older adults (>55 years, N=473, mean age 71.1) as the "case" population, with a 7-year gap between groups (ages 50-55 excluded) to ensure clear phenotypic separation. Per-patient delta vectors were computed as the methylation difference between each older adult and the young-adult mean. This is an exploratory extension with a fundamentally different design from the disease case-control studies: the "case/control" split reflects chronological age rather than disease diagnosis, and positive controls are geroprotectors with published evidence rather than FDA-approved disease treatments (Section 3.4, Limitation 8).
2.10. Data Sources
• PPI network: STRING v12.0, combined score >= 400 [13]
• Chemical-protein targets: STITCH v5.0, score >= 200 [14]
• FDA approved drugs: FDA drug labels database, mapped to STITCH CIDs
• Positive control drugs: For each disease, we compiled FDA-approved therapeutic drugs from clinical guidelines, mapped to STITCH v5.0 CIDs (minimum 60 protein targets at STITCH score >= 200). For RA, four additional compounds with published clinical-trial evidence were included. Full selection criteria, excluded drugs, and disease-specific rationale are provided in Supplementary Table S1a.
3. Results
3.1. Multi-Disease Retrospective Positive-Control Evaluation
SteeraMed Core was applied to three diseases (Section 2.9). For each disease, we computed N=1 Recall-{5, 10, 20} across all case patients using the primary disease-specific pipeline (Figure 2A). The complete four-layer evidence chain for a representative RA patient is presented in Section 3.7.
Rheumatoid arthritis showed the strongest signal, with 51.7% of patients having at least one known RA drug in their personalized top-10 (Recall-10), rising to 61.9% at Recall-20. Disease-specific random baselines were computed from the number of positive-control drugs and the candidate compound pool size: for RA (14 positives among ~1,500 candidates), the expected Recall-10 is approximately 8.9%, placing SteeraMed's 51.7% at a 5.8-fold enrichment over chance.
Breast cancer achieved 20.0% Recall-10 (5.1-fold above the ~3.9% baseline with 6 positives among ~1,500 candidates) and 57.4% Recall-50, confirming above-baseline enrichment in a second disease domain. As with RA, the enrichment was driven by multiple drugs rather than a single dominant compound (Section 3.6).
Depression showed a more complex pattern. Using the larger GSE128235 cohort (N=324 cases, 209 controls) with 32 positive controls (17 drugs + 15 nutraceuticals among 966 candidates), the combined Recall-10 was 25.3%, which did not exceed the disease-specific random baseline (~28.4%). However, this aggregate result masked a striking drug-nutraceutical divergence across age-sex sub-cohorts (Section 3.3).
Harmonized sensitivity analysis. Because each disease's pipeline uses phenotype-calibrated parameters (different CHEM/PPI thresholds, different control-matching ratios), a reader might ask whether the cross-disease Recall differences (RA 51.7% >> BC 20.0%) are artifacts of parameter tuning rather than genuine signal-strength differences. To address this concern, we re-ran RA and BC under a single harmonized parameter set (uniform age/sex matching; Supplementary Table S5). Under harmonized conditions, RA Recall-10 dropped from 51.7% to 35.3% and BC rose from 20.0% to 23.8% — the gap narrowed but RA remained well above baseline and clearly higher than BC. This confirms that RA's enrichment advantage reflects stronger methylation signal in blood (an immune-mediated disease measured in an immune-rich tissue), not pipeline overfitting. Depression was not included in this harmonization because its cohort structure (GSE128235, 324+209, 32 positive controls including 15 nutraceuticals) differs fundamentally from RA/BC; its primary-pipeline Recall-10 was 25.3%.
Bootstrap stability analysis. Group-level enrichment stability varied substantially across diseases. Breast cancer showed the most stable signal (median fold-enrichment: 20.7x, exceeded the random baseline in 100% of 100 resamplings), followed by RA (median: 3.1x, 83%). For depression, bootstrap was performed on the mid-age sub-cohort (36-55 years, both sexes combined; 159 cases, 105 controls), which showed the strongest individual-level signals in the sub-cohort heterogeneity analysis (Section 3.3). This combined-sex bootstrap yielded a median fold-enrichment of 1.3x (52% of resamplings significant at p < 0.05), substantially weaker than RA (3.1x, 83%) and BC (20.7x, 100%). The moderate group-level signal contrasts with the stronger N=1 individual-level signals observed in specific age-sex sub-cohorts (Section 3.3), reinforcing that depression heterogeneity dilutes group-level effects and that the N=1 framework is particularly important for heterogeneous conditions. The full bootstrap distributions are presented alongside the RA in-depth analyses in Section 3.5.
Bootstrap methods. Two distinct bootstrap procedures are used. (1) Group-level bootstrap (100 iterations): in each iteration, we resample case and control patients with replacement, recompute group-level methylation deltas, and recalculate compound rankings. This evaluates the stability of the group-level enrichment signal (fold-enrichment over a null distribution), which is a distinct metric from the individual-level Recall-K. (2) Individual-level bootstrap (200 iterations, Layer 4): for a single patient, we resample the cohort with replacement and recompute that patient's evidence chain, reporting how frequently each compound appears in the patient's top-10 across resamples. For RA and BC, the compound pool used a target coverage filter of 60-300 targets per compound. For depression, which includes nutraceuticals with inherently broad target profiles (e.g., zinc: 3,222 targets, vitamin D: 2,030 targets), no upper target limit was applied; instead, negative compounds were randomly sampled to 5,000 total (positive controls retained) to maintain computational feasibility.
Cross-disease PPI module perturbation landscape. To quantify mechanistic heterogeneity at the protein interaction level, we analyzed the distribution of perturbation signals across 1,100 PPI subnetwork modules (STRING score ≥ 400, 300-800 genes per hub neighborhood) for each disease (Figure 2C). We computed the mean absolute methylation delta (case vs control) per module and ranked modules by effect size. The Gini coefficient of the rank-ordered effect size distribution revealed marked differences: depression showed the highest concentration inequality (Gini = 0.22), followed by RA (0.12) and BC (0.08). Depression's top perturbed modules centered on innate immune genes (MPO, TYROBP, CD163, FCGR2A), consistent with the neuroinflammatory hypothesis. RA's top modules were dominated by T-cell/immune signaling hubs (CD27, TYROBP, CD2, TBX21), reflecting a more focused immune perturbation profile. BC's top-ranked modules were enriched for X-chromosome genes (MECP2, UTY, ATRX), likely reflecting the sex composition of the breast cancer cohort rather than cancer-specific mechanisms — a confound that illustrates the importance of matched case-control designs. Despite these differences, all three diseases showed relatively dispersed perturbation profiles (top-10 modules capturing <2.2% of total signal), suggesting that complex diseases involve distributed molecular changes rather than single dominant pathways.
Individual-level positive-control recovery. To complement the group-level recall metrics (Figure 2A), we computed per-patient Recall-10 and Recall-50 across all patients in each disease cohort (Figure 2D). The individual-level pipeline applied a target-count filter (≥60 genes per compound) with phenotype-specific calibration (see Methods), yielding 21 of 32 depression positive controls in pool (11 excluded for broad target profiles, e.g., zinc: 3,222 targets), 11 of 14 for RA, and 4 of 6 for BC. A striking reversal emerged: depression showed the highest individual-level recovery (14.5% top-10, 61.4% top-50), surpassing RA (7.9% top-10, 44.9% top-50) and BC (4.3% top-10, 26.0% top-50). This was the opposite of the group-level ranking, where depression performed worst (Figure 2A). Random baselines (probability of ≥1 hit by chance) were 5.8% for depression, 3.1% for RA, and 1.1% for BC; all three diseases showed comparable fold-enrichments over baseline (2.5x, 2.6x, and 3.9x respectively), indicating that the reversal is primarily driven by the higher positive-control density in depression (21/3,532 = 0.59% vs 11/3,552 = 0.31% vs 4/3,575 = 0.11%) rather than by differential method performance. Importantly, 47 of 324 depression patients (14.5%) had at least one known depression intervention in their top-10 (binomial p < 10^-4 vs 5.8% baseline), demonstrating that meaningful individual-level signal exists even when group-level enrichment is marginal. This further supports the N=1 approach for heterogeneous conditions.
3.2. Signal Attenuation Robustness: Module Aggregation Preserves Weak-Signal Drug Recovery
To assess whether module-level aggregation confers noise robustness, we artificially degraded the RA methylation signal by adding Gaussian noise to the case-control delta matrix at increasing noise-to-signal ratios (NSR, defined as σ_noise/σ_signal; α = 1.0 → NSR = 0×, α = 0.1 → NSR = 9×). We compared three module representation methods: PPI subnetwork modules (SEMO's native representation, 20–800 genes per module), curated pathway gene sets (MSigDB Hallmark + Reactome + KEGG, 20–800 genes), and a single-gene flat baseline (no module structure, one Welch t-test per compound across all genes). All three methods used the same SA score formulation (Welch-type contrast statistic comparing compound-target vs. non-target gene deltas, used for ranking rather than inferential interpretation).
At the original signal strength (α = 1.0, no added noise), PPI-Module achieved 24.0% Recall-10, substantially exceeding the random baseline (~9.0%; Figure 2E). Single-gene achieved 18.7%, while Pathway performed at 8.4% (below the random baseline), suggesting that curated pathway gene sets do not inherently capture disease-specific drug-module alignments in this context. As noise increased, single-gene Recall degraded rapidly and monotonically: at α = 0.5 (NSR = 1×), single-gene dropped to 11.6%, while PPI-Module retained 18.0%. At α = 0.2 (NSR = 4×), single-gene collapsed to 3.0% (below the random baseline); at α = 0.1 (NSR = 9×), single-gene remained at 3.0%. PPI-Module degraded more gracefully, maintaining 11.8% at α = 0.2 and 9.4% at α = 0.1 — still near the random baseline even under 9-fold noise amplification. Notably, Pathway Recall exhibited non-monotonic behavior: it increased from 8.4% (α = 1.0) to 14.4% (α = 0.1), consistently exceeding the random baseline under noise but not at clean signal. This pattern likely reflects structural bias: known RA drugs preferentially target genes within curated disease-relevant pathways, creating systematic voting advantages even when the input signal is heavily degraded.
The mean rank of known RA drugs (averaged across 14 positive controls and 534 RA cohort samples) provided a more discriminative stability metric (Figure 2F). A consistent three-tier ranking — PPI-Module (33–35) < Pathway (42–44) < Single-gene (49–51) — was preserved at every noise level from α = 1.0 to α = 0.1 (e.g., α = 0.1: PPI = 33.9, Pathway = 43.4, Gene = 50.6). PPI-Module's consistent top ranking across all conditions indicates that network-derived modules capture more specific drug-module alignments than either curated gene sets or individual genes. The stability of all three methods' mean ranks (range < 2 rank positions across the full noise spectrum) reflects the central limit theorem: gene-set-level aggregation averages out per-gene noise, with larger modules (20–800 genes for PPI, 20–800 for Pathway) providing greater noise buffering than single-gene measurements. However, stability alone is insufficient — Pathway's stable but higher rank (~43) compared to PPI (~34) demonstrates that stable rankings must also be accurate to be useful.
These results indicate that module-level aggregation provides a natural noise-filtering mechanism. While single-gene methods may perform comparably under strong-signal conditions (established disease), they become unreliable as signal strength decreases — a critical limitation for applications in healthy aging, preventive medicine, and early disease detection where molecular perturbations are inherently subtle.
3.3. Depression Sub-Cohort Heterogeneity Analysis (Exploratory)
Depression's Recall-10 (25.3%) masked a striking drug-nutraceutical divergence. Consistent with growing evidence that depression encompasses biologically distinct subtypes [18], when pharmaceutical antidepressants and nutraceuticals were evaluated separately across six age-sex sub-cohorts (3 age groups: 18-35, 36-55, 56+; 2 sexes), nutraceuticals exceeded the random baseline in all 6/6 sub-cohorts whereas antidepressants exceeded baseline in only 1/6 (Figure 3A,B). We applied SteeraMed to the GSE128235 cohort (324 cases, 209 controls) with 15 nutraceutical positive controls (Supplementary Table S7) alongside 17 pharmaceutical antidepressants, yielding 12 stratified analyses (6 sub-cohorts × 2 positive-control types; Table S6).
Nutraceuticals exceeded the random baseline in all 6/6 sub-cohorts (binomial test; 3 significant after Bonferroni correction for 12 tests, α = 0.0042), whereas pharmaceutical antidepressants exceeded baseline in only 1/6 sub-cohorts (M young 18-35, fold = 1.45) (Figure 3A,B). The strongest nutraceutical signal was observed in middle-aged females (36-55, N=90 cases): 31.1% Recall-10 vs 15.6% baseline (1.99-fold, p=0.0005) and middle-aged males (36-55, N=69 cases): 31.9% vs 16.2% (1.97-fold, p=0.0009) (Figure 3D). Creatine was the most consistently top-ranked nutraceutical, appearing in the N=1 top-10 for 6.8% of all patients — far exceeding the per-compound random expectation of ~0.15%.
Bootstrap and Gini analyses of the mid-age sub-cohort. To validate the sub-cohort finding, we performed bootstrap stability analysis on the mid-age sub-cohort (36-55 years, both sexes combined; 159 cases, 105 controls), which showed the strongest individual-level signals in both sexes. This combined-sex bootstrap yielded a median fold-enrichment of 1.3x (52% of resamplings significant at p < 0.05), substantially weaker than RA (3.1x, 83%) and BC (20.7x, 100%; Figure 2B shows full-cohort bootstrap for all four phenotypes; mid-age sub-cohort depression bootstrap is described here). The moderate group-level signal contrasts with the stronger N=1 individual-level signals observed in the sex-stratified sub-cohorts above, reinforcing that depression heterogeneity dilutes group-level effects. Interestingly, the PPI module perturbation landscape was robust to sub-cohort selection: the mid-age sub-cohort yielded a nearly identical Gini coefficient (0.20 vs 0.22 for the full cohort; Figure 2C) with the same top hubs (MPO, CD163, TYROBP). This dissociation between landscape shape (Gini) and screening performance (SEMO) arises because Gini captures the relative distribution of effect sizes across modules — a shape metric insensitive to absolute magnitude — whereas SEMO depends on the statistical power of within-module contrast statistics. The age-heterogeneous full cohort introduces age-related methylation noise that attenuates case-control contrasts within each module, reducing contrast statistics and SEMO scores without substantially altering the rank-order distribution of module-level deltas.
This drug-nutraceutical divergence may reflect the different maturity of pharmaceutical vs nutritional intervention development for depression. Pharmaceutical antidepressants were developed through trial-and-error clinical observation with limited mechanistic biomarkers, whereas nutraceutical target networks (energy metabolism, one-carbon metabolism, antioxidant defense) may align more directly with methylation-detectable metabolic perturbations. These results are exploratory and hypothesis-generating; independent validation in prospective cohorts is required before any clinical interpretation.
3.4. Exploratory Aging Extension: SteeraMed Core Applied to Healthy Aging
To test whether SteeraMed's disease-agnostic architecture can be extended beyond established disease to the subtler molecular perturbations of chronological aging, we applied the SEMO pipeline to the GSE40279 (Hannum) aging cohort using age-stratified groups as a proxy for phenotypic contrast. Young adults (<50 years, N=109, mean age 41.0) served as the reference population, and older adults (>55 years, N=473, mean age 71.1) as the "case" population, with a 7-year gap between groups (ages 50-55 excluded) to ensure clear phenotypic separation. Per-patient delta vectors were computed as the methylation difference between each older adult and the young-adult mean. We defined 20 compounds with published geroprotective evidence as positive controls (metformin, rapamycin, resveratrol, aspirin, chloroquine, hydroxychloroquine, spermidine, melatonin, lithium carbonate, pioglitazone, folic acid, DHEA, vitamin E, vitamin D3, methylene blue, azathioprine, estradiol, nicotinamide, acarbose, and NAD+).
Phenotype-specific parameter calibration. A key design principle of SEMO is that PPI module size should match the target profile of the phenotype's positive-control drugs. For RA, BC, and depression, known therapeutic drugs have high STITCH target counts (RA median 133, BC median 148, depression median 126), naturally pairing with large PPI modules (300-800 genes). Geroprotectors, however, have substantially fewer STITCH targets (metformin: 23 targets, melatonin: 16, methylene blue: 45) — reflecting the earlier stage of aging drug development and the broader but lower-affinity target profiles of geroprotective compounds. Following the same calibration principle used for other diseases (CHEM threshold set so ≥80% of positive controls with STITCH coverage enter the pool), we calibrated aging parameters to CHEM ≥ 5 (13/14 geroprotectors with STITCH coverage, 93%) and PPI 20-800 genes — smaller modules that maintain sufficient target/non-target ratios for low-target-count compounds (Table 2).
Using per-patient voting with calibrated parameters, SteeraMed Core achieved 15.9% Recall-10 (random baseline: 8.8%, 1.8-fold enrichment) and 28.1% Recall-20 (baseline: 17.5%, 1.6-fold enrichment; Figure 2A). The mean rank of known geroprotectors was 43.5 across 1,482 candidate compounds. Per-patient recovery was substantial: 15.9% of patients had ≥1 geroprotector in their top-10, and 52.9% in their top-50 (Figure 2D). The Gini coefficient of PPI module perturbation was 0.164, intermediate between RA (0.12) and depression (0.22; Figure 2C). Group-level bootstrap fold enrichment was 0.02x (100/100 below baseline; Figure 2B), reflecting the high inter-individual heterogeneity of aging signals — consistent with the per-patient approach being more appropriate than group averaging for aging applications.
The top-ranked compounds revealed a notable convergence with published geroprotective evidence, extending beyond the predefined positive controls. The top-ranked compound was niacin (voted by 30.4% of patients), a direct NAD+ precursor; NAD+ decline is a well-established feature of aging [19,20], and niacin-related NAD+ biology has been linked to age-associated molecular processes in multiple studies. The second-ranked compound was colchicine (29.0%), consistent with literature linking anti-inflammatory and anti-senescence mechanisms to vascular aging phenotypes. Among predefined positive controls, chloroquine ranked 29th (16.5%) and DHEA ranked 114th (11.2%). Notably, metformin, the most widely studied geroprotector, did not appear in the top-50 list despite being in the compound pool — potentially reflecting its broad but low-affinity target profile (23 STITCH targets) diluting module-level signal in the aging context.
These results suggest that SteeraMed Core can be technically extended to an aging-related phenotype using phenotype-calibrated parameters. However, they do not establish geroprotector discovery, anti-aging efficacy, or clinical intervention validity. The convergence of top-ranked compounds with published geroprotective evidence — particularly niacin (NAD+ precursor) and colchicine (anti-senescence), which were not predefined positive controls — is encouraging but constitutes literature-level convergence rather than prospective experimental confirmation. Figure S1 presents the complete four-layer evidence chain for a representative older adult, and Figure 4 presents this evidence in a patient-friendly communication format adapted from the RA patient-friendly format introduced in Section 3.7.
3.5. RA In-Depth Positive-Control Evaluation
Rheumatoid arthritis (N=354 cases, 335 controls) was selected for in-depth analysis (Figure 5).
Exploratory methylation-state concordance. For a subset of inflammation-related RA drugs (anti-inflammatory, immunosuppressive, antioxidant; N=9), we explored whether their STITCH target genes showed coherent methylation shifts in disease-associated blood profiles. Seven of nine drugs (78%) showed a consistent negative delta (lower methylation in target genes among RA cases relative to controls): NSAIDs (ibuprofen: delta = -0.0021, p = 1.2E-6; piroxicam: delta = -0.0017, p = 1.8E-6; indomethacin: delta = -0.0016, p = 1.7E-5), corticosteroids (prednisone: delta = -0.0008, p = 0.023), and cyclophosphamide (delta = -0.0011, p = 0.002). Two additional drugs showed negative but non-significant trends (celecoxib: delta = -0.0001, p = 0.72; vitamin E: delta = -0.0001, p = 0.76). Two drugs (methotrexate: delta = +0.0003, p = 0.45; hydroxychloroquine: delta = +0.0011, p = 0.0008) showed positive deltas, with hydroxychloroquine reaching significance in the opposite direction, possibly reflecting its broader target profile beyond inflammation (Figure 5A). This concordance pattern is descriptive: it reflects that inflammation-related drug targets tend to reside in genomic neighborhoods that show coordinated methylation shifts in RA blood, but does not establish pharmacodynamic directionality, gene-expression changes, or drug-target engagement (see Limitations).
Leave-one-drug-out stability. We removed each of the 14 known RA drugs individually and recomputed Recall-10 for the remaining drugs. Mean Recall-10 across all leave-one-out iterations was 51.2% +/- 1.8% (range: 44.6%-52.5%), indicating that no single drug drives the enrichment (Figure 5B). Notably, removing piroxicam (the most frequently ranked drug, appearing in 40.4% of patients' top-10; Supplementary Table S3) caused the largest drop (44.6%). This may reflect piroxicam's broad target gene coverage in STITCH (212 targets) rather than a uniquely central biological role; all other drug removals caused <2% variation.
Per-patient permutation test. For 20 randomly sampled RA patients, we performed 500 permutation tests per patient by randomly sampling (PPI-module, compound) pairs from all eligible pairs. Seven of 20 patients (35%) showed significant enrichment (p < 0.05), substantially exceeding the 5% false positive rate expected under the null. While patient-level results are not independent (they share PPI modules and chemical pools), the 35% rate is well above what would be expected by chance (Figure 5C). This exploratory test was performed on a sampled subset and should be interpreted as supportive rather than definitive.
Bootstrap stability. The RA group-level enrichment was stable across 100 bootstrap resamplings, with a median fold-enrichment of 3.1x (83% of resamplings significant at p < 0.05; Figure 5D). This indicates that the RA enrichment signal is robust to patient-level sampling variation.
3.6. BC Positive-Control Evaluation
Breast cancer (N=235 cases, 424 controls from GSE51032) provided an independent evaluation in a different disease domain. Six known BC drugs were available as positive controls: paclitaxel, doxorubicin, cyclophosphamide, capecitabine, everolimus, and lapatinib.
SteeraMed Core achieved 20.0% Recall-10 and 57.4% Recall-50. All six drugs appeared in at least one patient's top-10, with doxorubicin (6.8% of patients), lapatinib (3.8%), cyclophosphamide (3.8%), and paclitaxel (3.4%) showing the highest individual frequencies. Notably, several established BC drugs (tamoxifen, anastrozole, letrozole, ribociclib, abemaciclib) were absent from STITCH or had insufficient target genes (<5), limiting SteeraMed Core's ability to detect them.
3.7. RA N=1 Case Study: Complete Evidence Chain
We selected a representative RA patient (Patient #303, GSM1052147, 51-year-old male) whose top-10 compound ranking included 6 known RA drugs, illustrating the complete four-layer evidence chain (Figure 6).
Layer 1 - Individual State. Sixty-seven PPI modules were nominally perturbed (p < 0.05). The top modules were centered on T-cell signaling genes: SH2D1A (delta = +0.022, p = 2.8E-12), CD8B (delta = +0.025, p = 1.1E-11), TRAT1 (delta = +0.017, p = 2.8E-11), ITK (delta = +0.016, p = 3.2E-9), and CD6 (delta = +0.020, p = 1.5E-8). This pattern suggests a T-cell-related methylation perturbation profile consistent with known immune involvement in RA. Note: positive methylation deltas in promoter regions may reflect either gene silencing or cell-composition shifts; we interpret this as a molecular signature rather than direct evidence of T-cell hyperactivation.
Layer 2 - Steerability Alignment. The top-10 ranked compounds included 6 known RA drugs: pentoxifylline (#1, importance=3), piroxicam (#3, importance=3), vitamin E (#4, importance=2), methotrexate (#6, importance=1), prednisone (#8, importance=1), and cyclophosphamide (#10, importance=1).
Layer 3 - Mechanism Evidence. Pentoxifylline (phosphodiesterase inhibitor), the top-ranked compound, has 139 protein targets in the data. Three PPI modules were matched: OLFM4 (|SA| = 10.2), CEACAM6 (|SA| = 9.3), and DEFA4 (|SA| = 9.0). The target genes within these modules were CTSG, IL10, MPO, AZU1, and PRTN3 - all neutrophil/inflammation-related genes. This provides a specific mechanistic narrative: pentoxifylline targets inflammatory genes within the patient's most perturbed PPI modules, with high alignment scores indicating strong target-to-module overlap.
Layer 4 - Confidence. Bootstrap analysis (200 iterations) showed imatinib (a known RA drug) appeared in the patient's top-10 in 15% of resamples, the highest among known RA drugs. Individual drug stability was moderate, consistent with the high-dimensional feature selection instability noted in Limitation 8.
Caution: This evidence chain is hypothesis-generating and does not constitute a treatment recommendation. Individual molecular narratives require prospective validation before any clinical interpretation. Figure 7 presents this evidence chain in a patient-friendly communication format designed for clinician-patient discussion.
3.8. Depression N=1 Case Study
A representative depression patient (Patient #61, GSM3667899, 52-year-old male, GSE128235 mid-age sub-cohort) demonstrated a distinct immune-predominant perturbation profile. Fifty-eight PPI modules were nominally perturbed (p < 0.05), with the top modules centered on innate immune and inflammatory genes: MPO (delta = -0.029, p = 2.9E-14), CAMP (delta = -0.033, p = 3.1E-10), and TREM1 (delta = -0.033, p = 5.7E-10) — all hypo-methylated in promoter regions, suggesting elevated immune activity. The top-ranked compound was creatine (#1, 146 targets, 5 PPI module hits, |SA| = 8.8-11.2), a known depression nutraceutical with RCT evidence. Inositol (#9, 301 targets), another depression-associated nutraceutical, also appeared in the top-10 (Figure 8). Figure S2 presents this evidence in a patient-friendly format.
4. Discussion
SteeraMed Core is the molecular-network implementation layer of SteeraMed, designed to generate auditable N-of-1 molecular evidence chains rather than validated treatment recommendations. The following discussion contextualizes the results within this framing.
4.1. Evidence-Chain Standardization for N-of-1 Individualized Intervention Reasoning
The primary implication of this work is not automated mechanism-alignment ranking. Rather, SteeraMed Core illustrates how N-of-1 individualized intervention reasoning can be organized as a standardized evidence-generation process. In current practice, individualized interventions are often selected using population-level associations, expert preference, or fragmented biomarkers. These approaches are difficult to audit, compare, or iteratively improve. A Steerable Biomedical World Model framework provides a different structure: define the individual biological state, represent candidate interventions as actions, and estimate plausible state-transition hypotheses. Response is then measured longitudinally, and the next intervention cycle is updated accordingly.
Mechanism-alignment ranking is a demonstration task in this framework. The broader target is evidence standardization for N-of-1 individualized intervention reasoning. The current study uses DNA methylation, PPI modules, and FDA-approved compound targets because they provide a tractable and auditable demonstration domain. Known-drug recovery is used as a retrospective positive-control task, not as the final purpose of the system.
4.2. FDA PMF-Inspired Evidence Categories, Not Regulatory Sufficiency
SteeraMed Core should not be interpreted as meeting FDA PMF evidentiary requirements. Inspired by FDA's Plausible Mechanism Framework, we organize individualized evidence into five conceptual layers: molecular abnormality, intervention-mechanism linkage, reference-state context, target engagement, and clinical or biomarker response. We emphasize that SteeraMed Core does not implement or satisfy FDA evidentiary requirements; rather, it borrows the epistemic structure of mechanism-based individualized evidence to guide computational evidence-chain design.
FDA's Plausible Mechanism Framework provides a useful regulatory-science analogy for organizing individualized mechanism evidence, particularly around abnormality definition, mechanistic linkage, reference context, target engagement, and clinical or biomarker response. Figure 9 summarizes how SteeraMed Core's evidence-chain components map to these PMF-inspired evidence categories as a conceptual reference. SteeraMed Core generates computational artifacts corresponding to the first two PMF-inspired evidence categories: molecular-state characterization and intervention-mechanism linkage. These artifacts are not regulatory evidence and do not establish target engagement or clinical benefit. Reference-state context is approximated through retrospective age/sex-matched controls, though FDA's intent likely refers to prospective natural history studies. Target engagement and clinical or biomarker response require prospective experimental and clinical evidence beyond SteeraMed Core's computational scope.
FDA individualized-therapy and PMF discussions provide a useful precedent. They emphasize that individualized interventions require a defined abnormality, a mechanistically justified action, reference context, target engagement, and longitudinal evidence of response. N-of-1 individualized intervention reasoning faces a similar epistemic challenge: how to make individualized interventions explainable, testable, comparable, and updatable.
4.3. SteeraMed Core as the Current Implementation of a Steerable Biomedical World Model
In a companion paper, we outlined the general SteeraMed architecture as a steerability-oriented framework for biomedical world models [10]. The present study reports SteeraMed Core, the molecular-network implementation layer of that architecture. SteeraMed Core implements only a subset of the full SteeraMed system: molecular state representation through promoter-level methylation deltas, action representation through compound-target profiles, and mechanism alignment through target localization within perturbed PPI modules (Supplementary Table S2). It does not yet implement a learned transition model, multi-step planning, dose-response modeling, or prospective quality-control feedback.
The world model framing thus serves as an aspirational architecture rather than a fully realized planning system. It generates mechanism-alignment and transition hypotheses rather than validated transition predictions. Prospective paired pre/post-treatment methylome datasets, target-engagement measurements, and clinical outcome data will be required to upgrade SteeraMed from a static molecular evidence-chain generator into a calibrated transition model. This is consistent with the broader trajectory of world models in AI, where progress required large-scale (state, action, next_state) datasets that are not yet available in biomedicine.
4.4. Boundary Conditions and Signal Determinants
The systematic variation in Recall-10 across the three diseases (20.0% to 51.7%) is not noise but a systematic pattern reflecting four biological and technical factors. First, positive drug coverage in STITCH: RA had 14 drugs with verified STITCH CIDs, BC had only 6; more positive drugs increase the probability of at least one hit per patient. Second, disease methylation effect size: RA produces large methylation changes in immune-related genes (mean delta ~0.02 in top PPI modules), producing stronger alignment scores, while BC and depression show moderate effect sizes. Third, positive control count and candidate pool size: depression had 32 positive controls among 966 candidates (baseline ~28.4%), the highest baseline across all three diseases, versus RA (~8.9% with 14 positives) and BC (~3.9% with 6 positives). Fourth, tissue relevance: RA showed the strongest absolute signal, consistent with blood being the disease-relevant tissue and strong immune-related methylation signals. BC showed moderate signal, limited by the fact that blood methylation may not fully represent tumor tissue biology, and by STITCH gaps for key BC drugs (tamoxifen, letrozole). Depression showed a complex pattern: the combined Recall-10 (25.3%) did not exceed the random baseline (~28.4%), but nutraceutical positive controls revealed above-baseline enrichment in specific age-sex sub-cohorts (Section 3.3), suggesting that depression's molecular heterogeneity requires stratified analysis rather than aggregate evaluation.
These differences should be interpreted as boundary conditions rather than failures or universal performance estimates. They suggest that SteeraMed performance depends on sample relevance, tissue-disease alignment, target database coverage, and metadata quality. This context-dependence is itself informative: it indicates where the current evidence-chain architecture is most applicable and where future improvements in data infrastructure will be most impactful.
The signal attenuation experiment (Section 3.2) provides a mechanistic explanation for this context-dependence. Under strong-signal conditions (established RA), single-gene and PPI-module representations performed within 5 percentage points of each other (18.7% vs 24.0% Recall-10), suggesting that when disease signal is abundant, module-level aggregation provides modest additional benefit. However, as signal-to-noise ratio decreased, single-gene representations collapsed below the random baseline (3.0% at α = 0.2), while PPI-module representations retained above-baseline performance (11.8%). This divergence indicates that module-level aggregation becomes increasingly important as molecular perturbations become subtler — precisely the regime relevant to early disease detection and healthy aging. Notably, curated pathway gene sets showed structural bias, performing below baseline at clean signal but above baseline under noise, likely reflecting preferential targeting of disease-relevant pathways by known RA drugs rather than genuine signal recovery.
Statistical interpretation of module-level aggregation. PPI modules are correlated but partially independent units: genes within a module share functional context (correlation), but different modules capture different biological processes (partial independence). Module-level aggregation therefore differs from both single-gene analysis (no aggregation, high variance) and pathway-level analysis (large, overlapping gene sets with potential structural bias). The SA score's Welch-type contrast statistic treats each module as a unit of analysis, comparing target-gene deltas against non-target-gene deltas within that module. This within-module comparison naturally controls for module-wide methylation shifts (e.g., global hypomethylation in immune cells), while the across-module voting aggregates independent alignment signals. The resulting N-of-1 evidence chain reflects the convergence of multiple partially independent module-level rankings rather than a single aggregate statistic, which is why it remains informative even when individual module signals are weak. The contrast statistic is used for ranking only; its magnitude should not be interpreted as a calibrated effect size or inferential p-value, because genes within modules are not independent.
4.5. Future Applications to Healthy Aging and Longevity Medicine
Healthy aging and longevity medicine remain important future application domains for SteeraMed, but they are not directly validated by the present disease-cohort analyses. Longevity interventions differ from disease treatment in objectives, time horizon, outcome measures, and acceptable evidence standards. A longevity-specific implementation would require healthy-aging molecular cohorts, aging- or resilience-associated modules, geroprotector intervention vocabularies, and paired pre- and post-intervention molecular and functional measurements.
The relevance of SteeraMed to longevity medicine therefore lies in its evidence architecture rather than in the specific disease-cohort results. Future longevity studies should replace disease-associated perturbation modules with aging-, resilience-, intrinsic-capacity-, or functional-decline-associated modules [20], and should replace therapeutic positive controls with geroprotective or health-optimization intervention vocabularies. Such studies will be necessary before SteeraMed can be claimed as a validated framework for N-of-1 longevity medicine. The aging cohort analysis (Section 3.4) provides direct support for this direction: using phenotype-calibrated parameters (PPI 20-800, CHEM >= 5, matched to the lower STITCH target counts of geroprotectors), SteeraMed Core achieved 1.8-fold enrichment over random baseline and identified niacin (NAD+ precursor) and colchicine (anti-senescence) as top-ranked compounds — both with independent published geroprotective evidence. Notably, while per-patient voting successfully recovered geroprotectors (15.9% Recall-10), group-level averaging failed (bootstrap fold 0.02x), highlighting the high inter-individual heterogeneity of aging signals and the importance of N-of-1 approaches in longevity applications. This result supports the core design principle that PPI module size should match drug target profiles — geroprotectors with fewer STITCH targets naturally pair with smaller PPI modules, just as high-target-count RA drugs pair with larger modules.
The present study does not validate SteeraMed for longevity medicine. Instead, it establishes a general molecular evidence-chain framework for N-of-1 individualized intervention reasoning, with longevity medicine treated as a future application domain requiring prospective healthy-aging datasets.
4.6. Claims and Evidence Boundaries
To clarify what the present study does and does not establish, we summarize the evidence boundaries in Table 2.

Table 2.
Claims and Evidence Boundaries.
| Claim | Supported by current study? | Evidence | Boundary |
| SteeraMed Core can represent individual molecular state | Yes | Methylation deltas mapped to PPI modules | Whole-blood promoter methylation only; composite signal |
| SteeraMed Core can generate auditable evidence chains | Yes | Four-layer patient-level reports | Mechanism hypotheses only |
| SteeraMed Core enriches known interventions in RA and BC | Partially yes | Above-baseline positive-control recovery | Disease-informed feature selection and STITCH coverage bias |
| Depression shows aggregate positive-control enrichment | No for combined controls | Combined Recall-10 below random baseline | Stratified nutraceutical signals are exploratory |
| Aging analysis validates geroprotector discovery | No | Literature-convergent exploratory candidates | No clinical ground truth or longitudinal validation |
| SteeraMed Core predicts clinical efficacy | No | Not tested | Requires prospective intervention studies |
| SteeraMed Core is a complete world model | No | Static mechanism-alignment only | No learned state-action-next-state transition model |
| SteeraMed Core satisfies FDA PMF | No | Conceptual mapping only | Not regulatory evidence |
4.7. Prospective N-of-1 Roadmap
We envision SteeraMed's development in four phases:
Phase 1 (completed): Retrospective positive-control evaluation. Using public GEO data, SteeraMed's molecular evidence chains ranked at least one known therapeutic drug among the top-10 candidates for 51.7% of RA patients and 20.0% of BC patients (primary pipeline). Depression (GSE128235, N=324 cases) showed a combined Recall-10 of 25.3% that did not exceed the random baseline, but revealed a drug-nutraceutical divergence with nutraceutical enrichment in specific sub-cohorts. Variable but above-baseline enrichment stability was observed for RA and BC. All data, code, and results are available for reproduction.
Phase 2 (near-term): Prospective observational N-of-1 registry. The key step is establishing a longitudinal registry that collects baseline methylome, proteome, metabolome, wearable data, functional measurements, and intervention exposure records from individuals engaged in health optimization or longevity programs. With current EPIC v2 array turnaround times, this is technically feasible.
Phase 3 (medium-term): Prospective intervention-cycle studies. Pre/post intervention measurements for lifestyle, nutrition, exercise, supplements, pharmacological agents, and cellular interventions. Each intervention cycle generates a (state, action, next_state) observation that can be used to test SteeraMed's mechanism-alignment predictions against actual molecular responses.
Phase 4 (long-term): Calibrated transition learning. Learn state-action-next-state models from repeated N-of-1 intervention cycles, converting SteeraMed from a static evidence-chain generator into a calibrated transition model that can predict post-intervention molecular states.
For investigational pharmacological interventions, relevant regulatory pathways may apply. However, the broader SteeraMed architecture is intended as an evidence-standardization framework across N-of-1 individualized interventions, not as a single-patient IND pathway.
4.8. Limitations
1. Study design and clinical evidence: All evaluation is retrospective using public GEO data; prospective clinical evaluation is needed. Known therapeutic drugs are included in the chemical pool used for ranking, reflecting SteeraMed's intended use case (ranking all FDA-approved compounds) but meaning evaluation is not fully blind. Leave-one-drug-out analysis shows no single drug drives results. SteeraMed provides computational rationale, not evidence of clinical benefit.
2. Feature selection and scoring assumptions: The top-100 PPI modules used in scoring are selected based on one-sample t-tests against the case-control delta distribution, introducing feature selection bias intrinsic to the pipeline design. Leave-one-drug-out analysis shows removing any single positive drug reduces Recall-10 by only 0.5 percentage points on average. Additionally, the steerability alignment score uses a Welch-type contrast statistic comparing target vs. non-target gene methylation deltas within PPI modules, but genes within the same module are not independent (connected through PPI and potentially co-regulated). The contrast statistic is used as a ranking feature, not for inferential p-value interpretation. Its magnitude should not be interpreted as a calibrated effect size, and no multiple-comparison correction is applied to individual scores.
3. Methylation as a proxy for drug-target engagement: SteeraMed uses whole-blood promoter methylation deltas as its molecular-state representation, but the chain from DNA methylation to drug mechanism is long and indirect. (a) Promoter methylation is an imperfect proxy for gene expression: methylation-expression correlations are context-dependent and vary by gene, tissue, and CpG location. (b) Methylation deltas may reflect cell-type composition shifts rather than cell-intrinsic epigenetic changes, particularly in immune-mediated diseases like RA. (c) Whole blood has limited tissue relevance for breast cancer (tumor tissue), depression (brain), and aging (multi-tissue). (d) Drug targets are proteins, and protein activity is not directly captured by promoter methylation of the encoding gene. (e) The exploratory methylation-state concordance analysis (Figure 5A) showed that inflammation-related drug targets tend to show coordinated methylation shifts in RA blood, but this does not establish pharmacodynamic directionality, gene-expression changes, or drug-target engagement. Without matched gene-expression, protein, cell-composition, or target-engagement data, promoter methylation cannot establish whether a drug target is transcriptionally active, inhibited, or pharmacologically engaged.
4. Statistical assessment limitations: (a) The per-patient permutation test was applied to 20 of 354 RA patients (5.6%), with 7/20 reaching significance; the sampling rate limits generalizability. (b) Individual compound rankings showed moderate bootstrap stability (known RA drugs: up to 15% of resamples), consistent with high-dimensional biomarker selection instability, though aggregate Recall-10 remains stable. (c) The permutation test randomly samples (PPI-module, compound) pairs from all eligible pairs rather than recomputing alignment scores from shuffled case/control labels; a more conservative approach would recompute from shuffled labels but is computationally prohibitive (see Section 2.8).
5. Database coverage, confounds, and cross-disease comparability: Many established drugs (tamoxifen, anastrozole for BC; certain DMARDs for RA) are absent from STITCH or have insufficient target annotations. Multi-target drugs (e.g., piroxicam: 212 targets) may be preferentially ranked; target-count matched baselines should be investigated. Recall-K results for different diseases used slightly different matching strategies; a harmonized pipeline yielded complementary results for RA and BC (Supplementary Table S5). We did not adjust for blood cell-type composition; part of the SteeraMed signal may reflect disease-associated immune-cell shifts rather than cell-intrinsic methylation changes, particularly relevant for RA.
6. Depression-specific limitations: (a) Post-hoc sub-cohort selection: bootstrap was performed on the mid-age sub-cohort (36-55 years) identified from the same exploratory heterogeneity analysis used for validation, potentially inflating apparent stability. The bootstrap yielded 1.3x fold-enrichment (52% significant), substantially weaker than RA (3.1x) and BC (20.7x). This warrants independent replication with pre-specified age-stratified analysis. (b) Two of 17 depression positive-control drugs (fluvoxamine, clomipramine) have FDA primary approval for OCD rather than MDD; future sensitivity analysis excluding these would assess their impact.
7. No comparison with existing methods: Direct comparison with CMap/L1000 signature matching or network-based drug repurposing methods is beyond the scope of this paper, as SteeraMed uses a fundamentally different data modality (DNA methylation + PPI networks) than these methods (transcriptomics or chemical structures).
8. Signal attenuation experiment scope: The noise robustness comparison was conducted on RA only, using additive Gaussian noise. The relative advantage of PPI-module over single-gene representations may differ across diseases and under non-Gaussian noise. The PPI modules were pre-selected based on disease-relevant signal, which may favor PPI-module performance. Generalizability to other diseases and noise models requires independent evaluation.
9. Exploratory aging extension: The aging analysis used age-stratified groups as a phenotypic proxy, fundamentally different from the disease case-control design. The positive-control list (13 geroprotectors) is smaller and less established, and there is no true clinical ground truth for anti-aging interventions. The convergence of top-ranked compounds (niacin, colchicine) with published evidence constitutes literature-level validation, not prospective confirmation. The GSE40279 cohort is cross-sectional, precluding causal inference. This analysis should be interpreted as an exploratory extension demonstrating potential applicability beyond disease.
4.9. Future Directions
The greatest bottleneck for translating this core implementation into a calibrated world model for N-of-1 individualized intervention reasoning is not algorithmic - it is data. Current public repositories are dominated by cross-sectional disease-vs-control studies, lacking the paired pre- and post-interventional molecular datasets needed to learn state-action-next-state transitions. This data gap mirrors the challenge faced by world models in AI, where progress required large-scale (state, action, next_state) datasets.
We call for three data infrastructure investments: (1) systematic collection of paired pre/post-treatment DNA methylation data across diverse interventions, feasible with current EPIC v2 array turnaround times; (2) saliva-based methylation as a scalable, non-invasive sampling modality suitable for remote data collection; and (3) open interventional methylome repositories - we estimate that 500-1,000 paired samples across 10-20 interventions would enable the first systematic evaluation of computational steerability predictions.
Additional technical directions include: multi-omics integration (incorporating RNA-seq and proteomics data to strengthen target engagement evidence), stronger null models (target-count matched baselines, label permutation with recomputed features, leave-one-patient-out feature selection), and real-time SteeraMed Core pipeline development (automated pipeline from methylation array to evidence chain report, deployable in clinical laboratories).
5. Conclusions
SteeraMed Core provides a molecular-network evidence-chain architecture for N-of-1 individualized intervention reasoning, standardizing how individualized interventions are represented, mechanistically justified, and iteratively updated.
Retrospective positive-control evaluation across three disease cohorts yielded variable but above-baseline drug recovery where methylation signal, tissue relevance, and target database coverage were adequate: RA 51.7% Recall-10 (5.8-fold over baseline), BC 20.0% (5.1-fold). Depression showed a drug-nutraceutical divergence (nutraceuticals above baseline in 6/6 sub-cohorts versus 1/6 for antidepressants) rather than aggregate enrichment. Module-level aggregation preserved signal under artificial noise more robustly than single-gene representations. These results establish retrospective known-action recovery within disease-informed feature spaces, not clinical validity, therapeutic efficacy, or regulatory sufficiency.
Converting this static evidence-chain generator into a calibrated state-action learning system will require prospective longitudinal cohorts with paired pre- and post-intervention molecular and clinical measurements. Until such data become available, SteeraMed Core should be viewed as a standardized evidence architecture, not as a validated treatment-selection system.
Supplementary Materials
The following supporting information can be downloaded at the website of this paper posted on Preprints.org. Supplementary Tables S1-S5 and Figure Legends are available in the separate Supplementary Materials file (SteeraMed_Supplementary.pdf).
Author Contributions
Conceptualization, J.X.; writing, review and editing, J.X. The author has read and agreed to the published version of the manuscript.
Funding
This work was supported by DeepoMe Inc. (Beijing, China).
Institutional Review Board Statement
Not applicable. All data used in this study are from publicly available repositories (Gene Expression Omnibus, NCBI) and do not require additional ethics approval.
Informed Consent Statement
Not applicable. This study uses only publicly available, de-identified datasets from GEO.
Data Availability Statement
Public datasets. All methylation datasets used in this study are publicly available from the NCBI Gene Expression Omnibus (GEO): GSE42861 (rheumatoid arthritis), GSE51032 (breast cancer), GSE128235 (depression), and GSE40279 (Hannum aging cohort). The protein-protein interaction network is available from STRING v12.0 (https://string-db.org). Chemical-protein target annotations are available from STITCH v5.0 (https://stitch-db.org). Pathway annotations are available from MSigDB (https://www.gsea-msigdb.org), Reactome (https://reactome.org), and KEGG (https://www.genome.jp/kegg).
Code and processed data. The SteeraMed v1.0 source code and analysis pipelines will be made available on https://steeramed.com and GitHub (https://github.com/deepome/steeramed) upon publication. Processed gene beta matrices for each GEO dataset are available from the project repository.
Conflicts of Interest
J.X. is the founder of DeepoMe Inc. DeepoMe Inc. holds a Chinese invention patent related to the SEMO algorithm: CN117766054B.
References
- Schork, N.J. Personalized medicine: Time for one-person trials. Nature 2015, 520, 609–611. [Google Scholar] [CrossRef]
- Mirza, R.D.; et al. Exploring human biology with N-of-1 clinical trials. Nat. Rev. Drug Discov. 2023, 22, 742–743. [Google Scholar]
- Lillie, E.O.; et al. The n-of-1 clinical trial: the ultimate strategy for individualizing medicine? Per Med. 2011, 8(2), 161–173. [Google Scholar] [CrossRef]
- Vohra, S.; et al. CONSORT extension for reporting N-of-1 trials (CENT) 2015 Statement. BMJ 2015, 350, h1738. [Google Scholar] [CrossRef] [PubMed]
- Silver, D.; et al. Mastering the game of Go without human knowledge. Nature 2017, 550, 354–359. [Google Scholar] [CrossRef] [PubMed]
- LeCun, Y. A Path Towards Autonomous Machine Intelligence. In Meta AI; 2024. [Google Scholar]
- FDA. Individualized Antisense Oligonucleotide Drug Products for Severely Debilitating or Life-Threatening Diseases: Clinical Recommendations; Guidance, 2021a. [Google Scholar]
- FDA. Individualized Antisense Oligonucleotide Drug Products for Severely Debilitating or Life-Threatening Diseases: Nonclinical Testing Recommendations. Guidance. 2021b.
- FDA. Plausible Mechanism Framework for Individualized Therapies. In Draft Guidance; February 2026. [Google Scholar]
- Xiong, J. World Models for Biomedicine: A Steerability Framework. Preprints.org. 2026a. [Google Scholar] [CrossRef]
- Xiong, J. Utilizing Pre-trained Network Medicine Models for Generating Biomarkers, Targets, Re-purposing Drugs, and Personalized Therapeutic Regimes: COVID-19 Applications. bioRxiv 2023. [Google Scholar] [CrossRef]
- Szklarczyk, D.; et al. The STRING database in 2023. Nucleic Acids Res. 2023, 51, D638–D646. [Google Scholar] [CrossRef] [PubMed]
- Kuhn, M.; et al. STITCH 5: augmenting protein-chemical interaction networks. Nucleic Acids Res. 2014, 42, D428–D432. [Google Scholar] [CrossRef] [PubMed]
- Liberzon, A.; et al. The Molecular Signatures Database Hallmark Gene Set Collection. Cell Syst. 2015, 1, 417–425. [Google Scholar] [CrossRef] [PubMed]
- Fabregat, A.; et al. The Reactome Pathway Knowledgebase. Nucleic Acids Res. 2018, 46, D649–D655. [Google Scholar] [CrossRef] [PubMed]
- Kanehisa, M.; et al. KEGG as a reference resource for gene and protein annotation. Nucleic Acids Res. 2023, 51, D541–D547. [Google Scholar] [CrossRef] [PubMed]
- Shorter, J.R.; et al. Genome-wide association analyses identify distinct genetic architectures for early-onset and late-onset depression. Nat. Genet. 2025, 57, 2972–2979. [Google Scholar] [CrossRef] [PubMed]
- Barabási, A.L.; Gulbahce, N.; Loscalzo, J. Network medicine: a network-based approach to human disease. Nat. Rev. Genet. 2011, 12(1), 56–68. [Google Scholar] [CrossRef] [PubMed]
- Covarrubias, A.J.; Perrone, R.; Grozio, A.; Verdin, E. NAD+ metabolism and its roles in cellular processes during ageing. Nat. Rev. Mol. Cell Biol. 2021, 22(2), 119–141. [Google Scholar] [CrossRef] [PubMed]
- López-Otín, C.; Blasco, M.A.; Partridge, L.; Serrano, M.; Kroemer, G. Hallmarks of aging: An expanding universe. Cell. 2023, 186(2), 243–278. [Google Scholar] [CrossRef] [PubMed]
- Diaz-Uriarte, R. GeneSrF: a web-based tool and R package for variable selection in classifiers using random forests. Bioinformatics 2007, 23(3), 384–386. [Google Scholar]
- Ein-Dor, L.; et al. Outcome signature genes in breast cancer: is there a unique set? Bioinformatics 2006, 22(2), 170–178. [Google Scholar] [CrossRef] [PubMed]
Figure 1.
SteeraMed Core operationalizes a Steerable Biomedical World Model into molecular evidence chains for N-of-1 individualized intervention reasoning. Top level: abstract Steerable Biomedical World Model target architecture showing four components (patient state, candidate actions, transition hypothesis, objective) connected as state-action-transition-objective. Bottom level: SteeraMed Core molecular implementation mapping each abstract component to concrete data and algorithms. Left: promoter-level DNA methylation perturbations (cases vs age/sex-matched controls) mapped onto STRING PPI subnetworks. Center: FDA-approved compounds with STITCH protein targets, scored by SEMO-derived steerability alignment (target vs non-target gene methylation deltas within disease-perturbed PPI modules). Right: auditable four-layer evidence chain (individual molecular state, drug-module alignment, mechanism annotation, ranking confidence) for individualized intervention reasoning.
Figure 1.
SteeraMed Core operationalizes a Steerable Biomedical World Model into molecular evidence chains for N-of-1 individualized intervention reasoning. Top level: abstract Steerable Biomedical World Model target architecture showing four components (patient state, candidate actions, transition hypothesis, objective) connected as state-action-transition-objective. Bottom level: SteeraMed Core molecular implementation mapping each abstract component to concrete data and algorithms. Left: promoter-level DNA methylation perturbations (cases vs age/sex-matched controls) mapped onto STRING PPI subnetworks. Center: FDA-approved compounds with STITCH protein targets, scored by SEMO-derived steerability alignment (target vs non-target gene methylation deltas within disease-perturbed PPI modules). Right: auditable four-layer evidence chain (individual molecular state, drug-module alignment, mechanism annotation, ranking confidence) for individualized intervention reasoning.
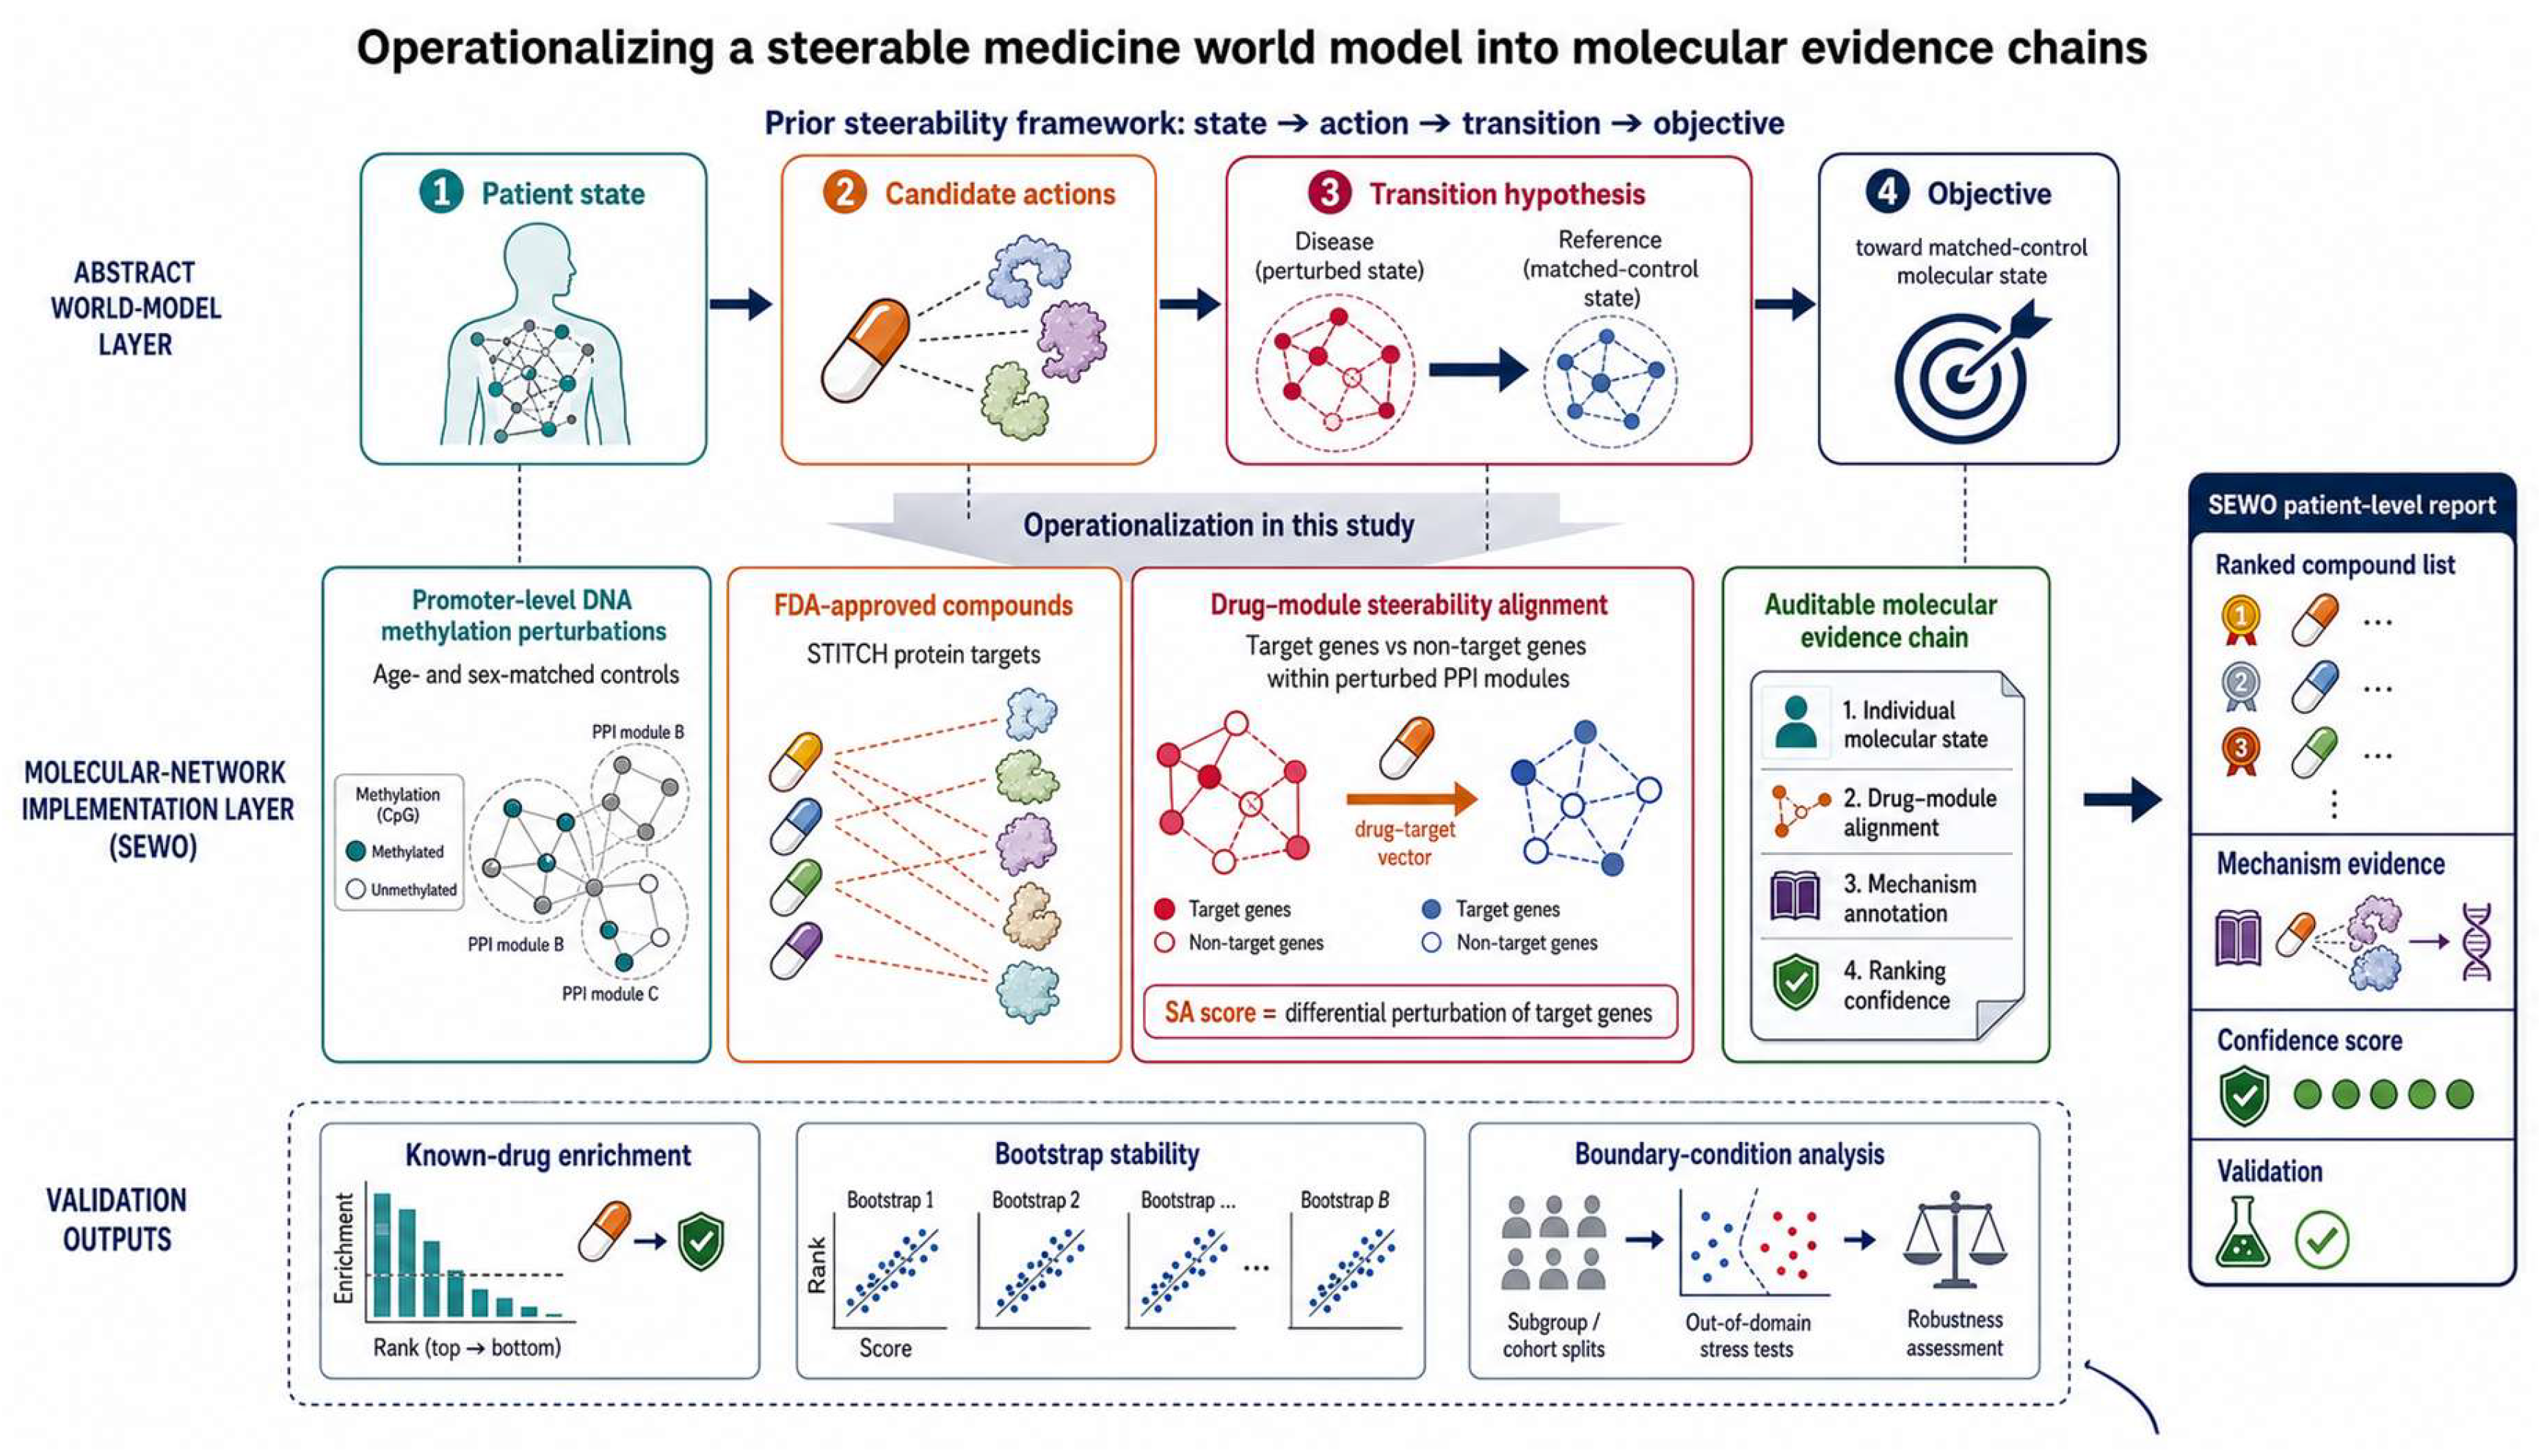
Figure 2.
Multi-phenotype retrospective positive-control evaluation with phenotype-calibrated parameters (see Methods 2.5 and Table S4 for calibration details). (A) Per-patient Recall-{5,10,20} across four phenotypes. RA: 51.7% Recall-10 (5.8x baseline); BC: 20.0% (5.1x); Depression: 25.3% (0.89x); Aging: 15.9% (1.8x). Dashed lines indicate phenotype-specific random baselines. (B) Group-level bootstrap stability: fold-enrichment distribution across 100 resamplings per phenotype. RA: mean 9.0x; BC: mean 21.1x; Depression: mean 4.6x; Aging: mean 0.02x (100/100 below baseline, reflecting high inter-individual heterogeneity of aging signals). Violin plots show median (dot), mean (horizontal line), and distribution shape. (C) Cross-phenotype PPI module perturbation heterogeneity: Gini coefficient quantifying effect-size concentration. RA: 0.12; BC: 0.08; Depression: 0.22; Aging: 0.164. (D) Per-patient positive-control recovery: percentage of patients with at least one known drug in their individualized top-10 (light bars) and top-50 (dark bars). Depression: 14.5% top-10, 61.4% top-50; RA: 7.9%, 44.9%; BC: 4.3%, 26.0%; Aging: 15.9%, 52.9%. (E) Signal attenuation Recall-10: Gaussian noise added to RA methylation delta matrix at increasing NSR (α from 1.0 to 0.1). PPI-Module (blue) degrades gracefully; single-gene (red) collapses below random baseline at α ≤ 0.3; pathway (green) shows non-monotonic behavior, likely reflecting structural bias in curated pathway-target architecture. (F) Mean rank of known RA drugs under signal attenuation: consistent three-tier ranking (PPI-Module < Pathway < Single-gene) preserved across all noise levels, indicating that PPI-derived modules capture more specific drug-module alignments than curated gene sets or individual genes.
Figure 2.
Multi-phenotype retrospective positive-control evaluation with phenotype-calibrated parameters (see Methods 2.5 and Table S4 for calibration details). (A) Per-patient Recall-{5,10,20} across four phenotypes. RA: 51.7% Recall-10 (5.8x baseline); BC: 20.0% (5.1x); Depression: 25.3% (0.89x); Aging: 15.9% (1.8x). Dashed lines indicate phenotype-specific random baselines. (B) Group-level bootstrap stability: fold-enrichment distribution across 100 resamplings per phenotype. RA: mean 9.0x; BC: mean 21.1x; Depression: mean 4.6x; Aging: mean 0.02x (100/100 below baseline, reflecting high inter-individual heterogeneity of aging signals). Violin plots show median (dot), mean (horizontal line), and distribution shape. (C) Cross-phenotype PPI module perturbation heterogeneity: Gini coefficient quantifying effect-size concentration. RA: 0.12; BC: 0.08; Depression: 0.22; Aging: 0.164. (D) Per-patient positive-control recovery: percentage of patients with at least one known drug in their individualized top-10 (light bars) and top-50 (dark bars). Depression: 14.5% top-10, 61.4% top-50; RA: 7.9%, 44.9%; BC: 4.3%, 26.0%; Aging: 15.9%, 52.9%. (E) Signal attenuation Recall-10: Gaussian noise added to RA methylation delta matrix at increasing NSR (α from 1.0 to 0.1). PPI-Module (blue) degrades gracefully; single-gene (red) collapses below random baseline at α ≤ 0.3; pathway (green) shows non-monotonic behavior, likely reflecting structural bias in curated pathway-target architecture. (F) Mean rank of known RA drugs under signal attenuation: consistent three-tier ranking (PPI-Module < Pathway < Single-gene) preserved across all noise levels, indicating that PPI-derived modules capture more specific drug-module alignments than curated gene sets or individual genes.
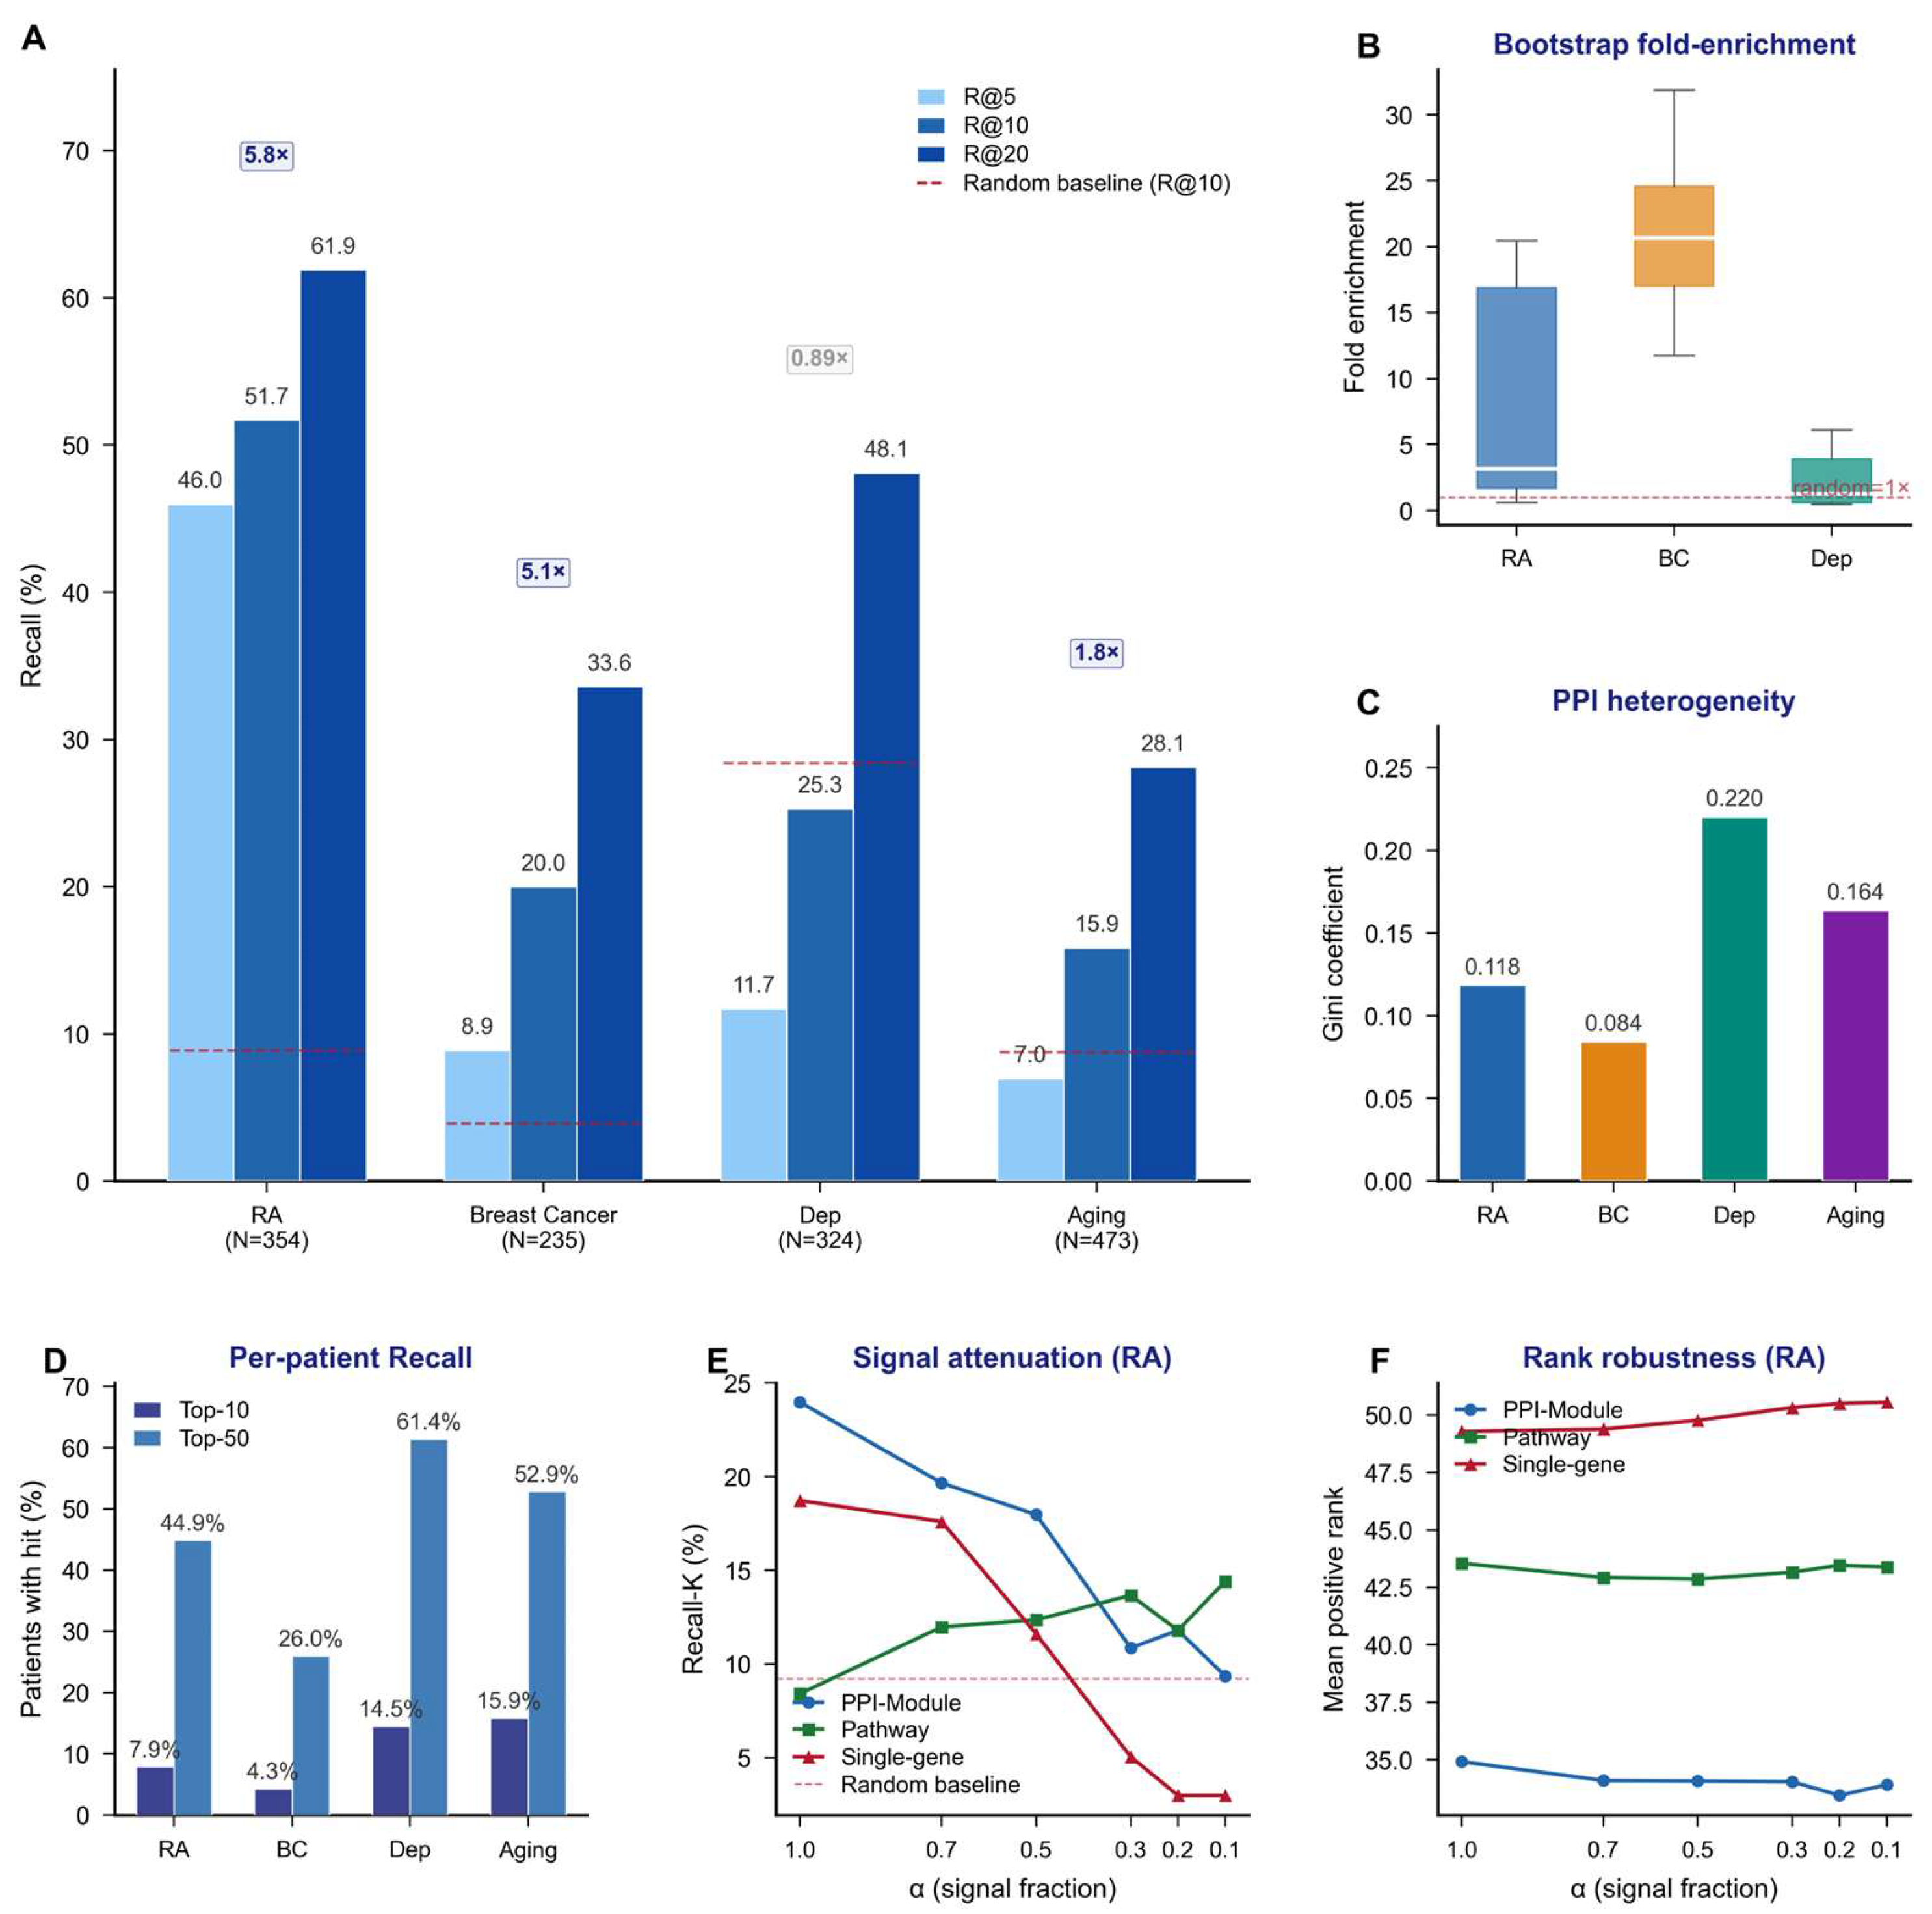
Figure 3.
Depression sub-cohort heterogeneity analysis (exploratory). Four-panel analysis of drug-nutraceutical divergence across six age-sex sub-cohorts (3 age groups × 2 sexes) of the GSE128235 depression cohort (324 MDD + 209 HC). For each sub-cohort, pharmaceutical antidepressants and nutraceuticals are evaluated separately, yielding 12 stratified analyses (6 sub-cohorts × 2 positive-control types). (A) Forest plot showing nutraceutical Recall-10 with 95% confidence intervals across all six sub-cohorts; red dashed line indicates the random baseline. Three sub-cohorts remain significant after Bonferroni correction for 12 tests (α = 0.0042). (B) Fold enrichment over random baseline for pharmaceutical antidepressants (blue) vs nutraceuticals (orange). Nutraceuticals exceeded baseline in all 6/6 sub-cohorts versus 1/6 for antidepressants (M young 18-35). (C) Top-ranked nutraceutical hit frequency stacked bar chart; creatine ranked first in most sub-cohorts (6.8% patient hit rate vs ~0.15% random expectation). (D) Fold enrichment by sub-cohort, showing strongest nutraceutical signal in middle-aged (36-55) sub-cohorts of both sexes.
Figure 3.
Depression sub-cohort heterogeneity analysis (exploratory). Four-panel analysis of drug-nutraceutical divergence across six age-sex sub-cohorts (3 age groups × 2 sexes) of the GSE128235 depression cohort (324 MDD + 209 HC). For each sub-cohort, pharmaceutical antidepressants and nutraceuticals are evaluated separately, yielding 12 stratified analyses (6 sub-cohorts × 2 positive-control types). (A) Forest plot showing nutraceutical Recall-10 with 95% confidence intervals across all six sub-cohorts; red dashed line indicates the random baseline. Three sub-cohorts remain significant after Bonferroni correction for 12 tests (α = 0.0042). (B) Fold enrichment over random baseline for pharmaceutical antidepressants (blue) vs nutraceuticals (orange). Nutraceuticals exceeded baseline in all 6/6 sub-cohorts versus 1/6 for antidepressants (M young 18-35). (C) Top-ranked nutraceutical hit frequency stacked bar chart; creatine ranked first in most sub-cohorts (6.8% patient hit rate vs ~0.15% random expectation). (D) Fold enrichment by sub-cohort, showing strongest nutraceutical signal in middle-aged (36-55) sub-cohorts of both sexes.
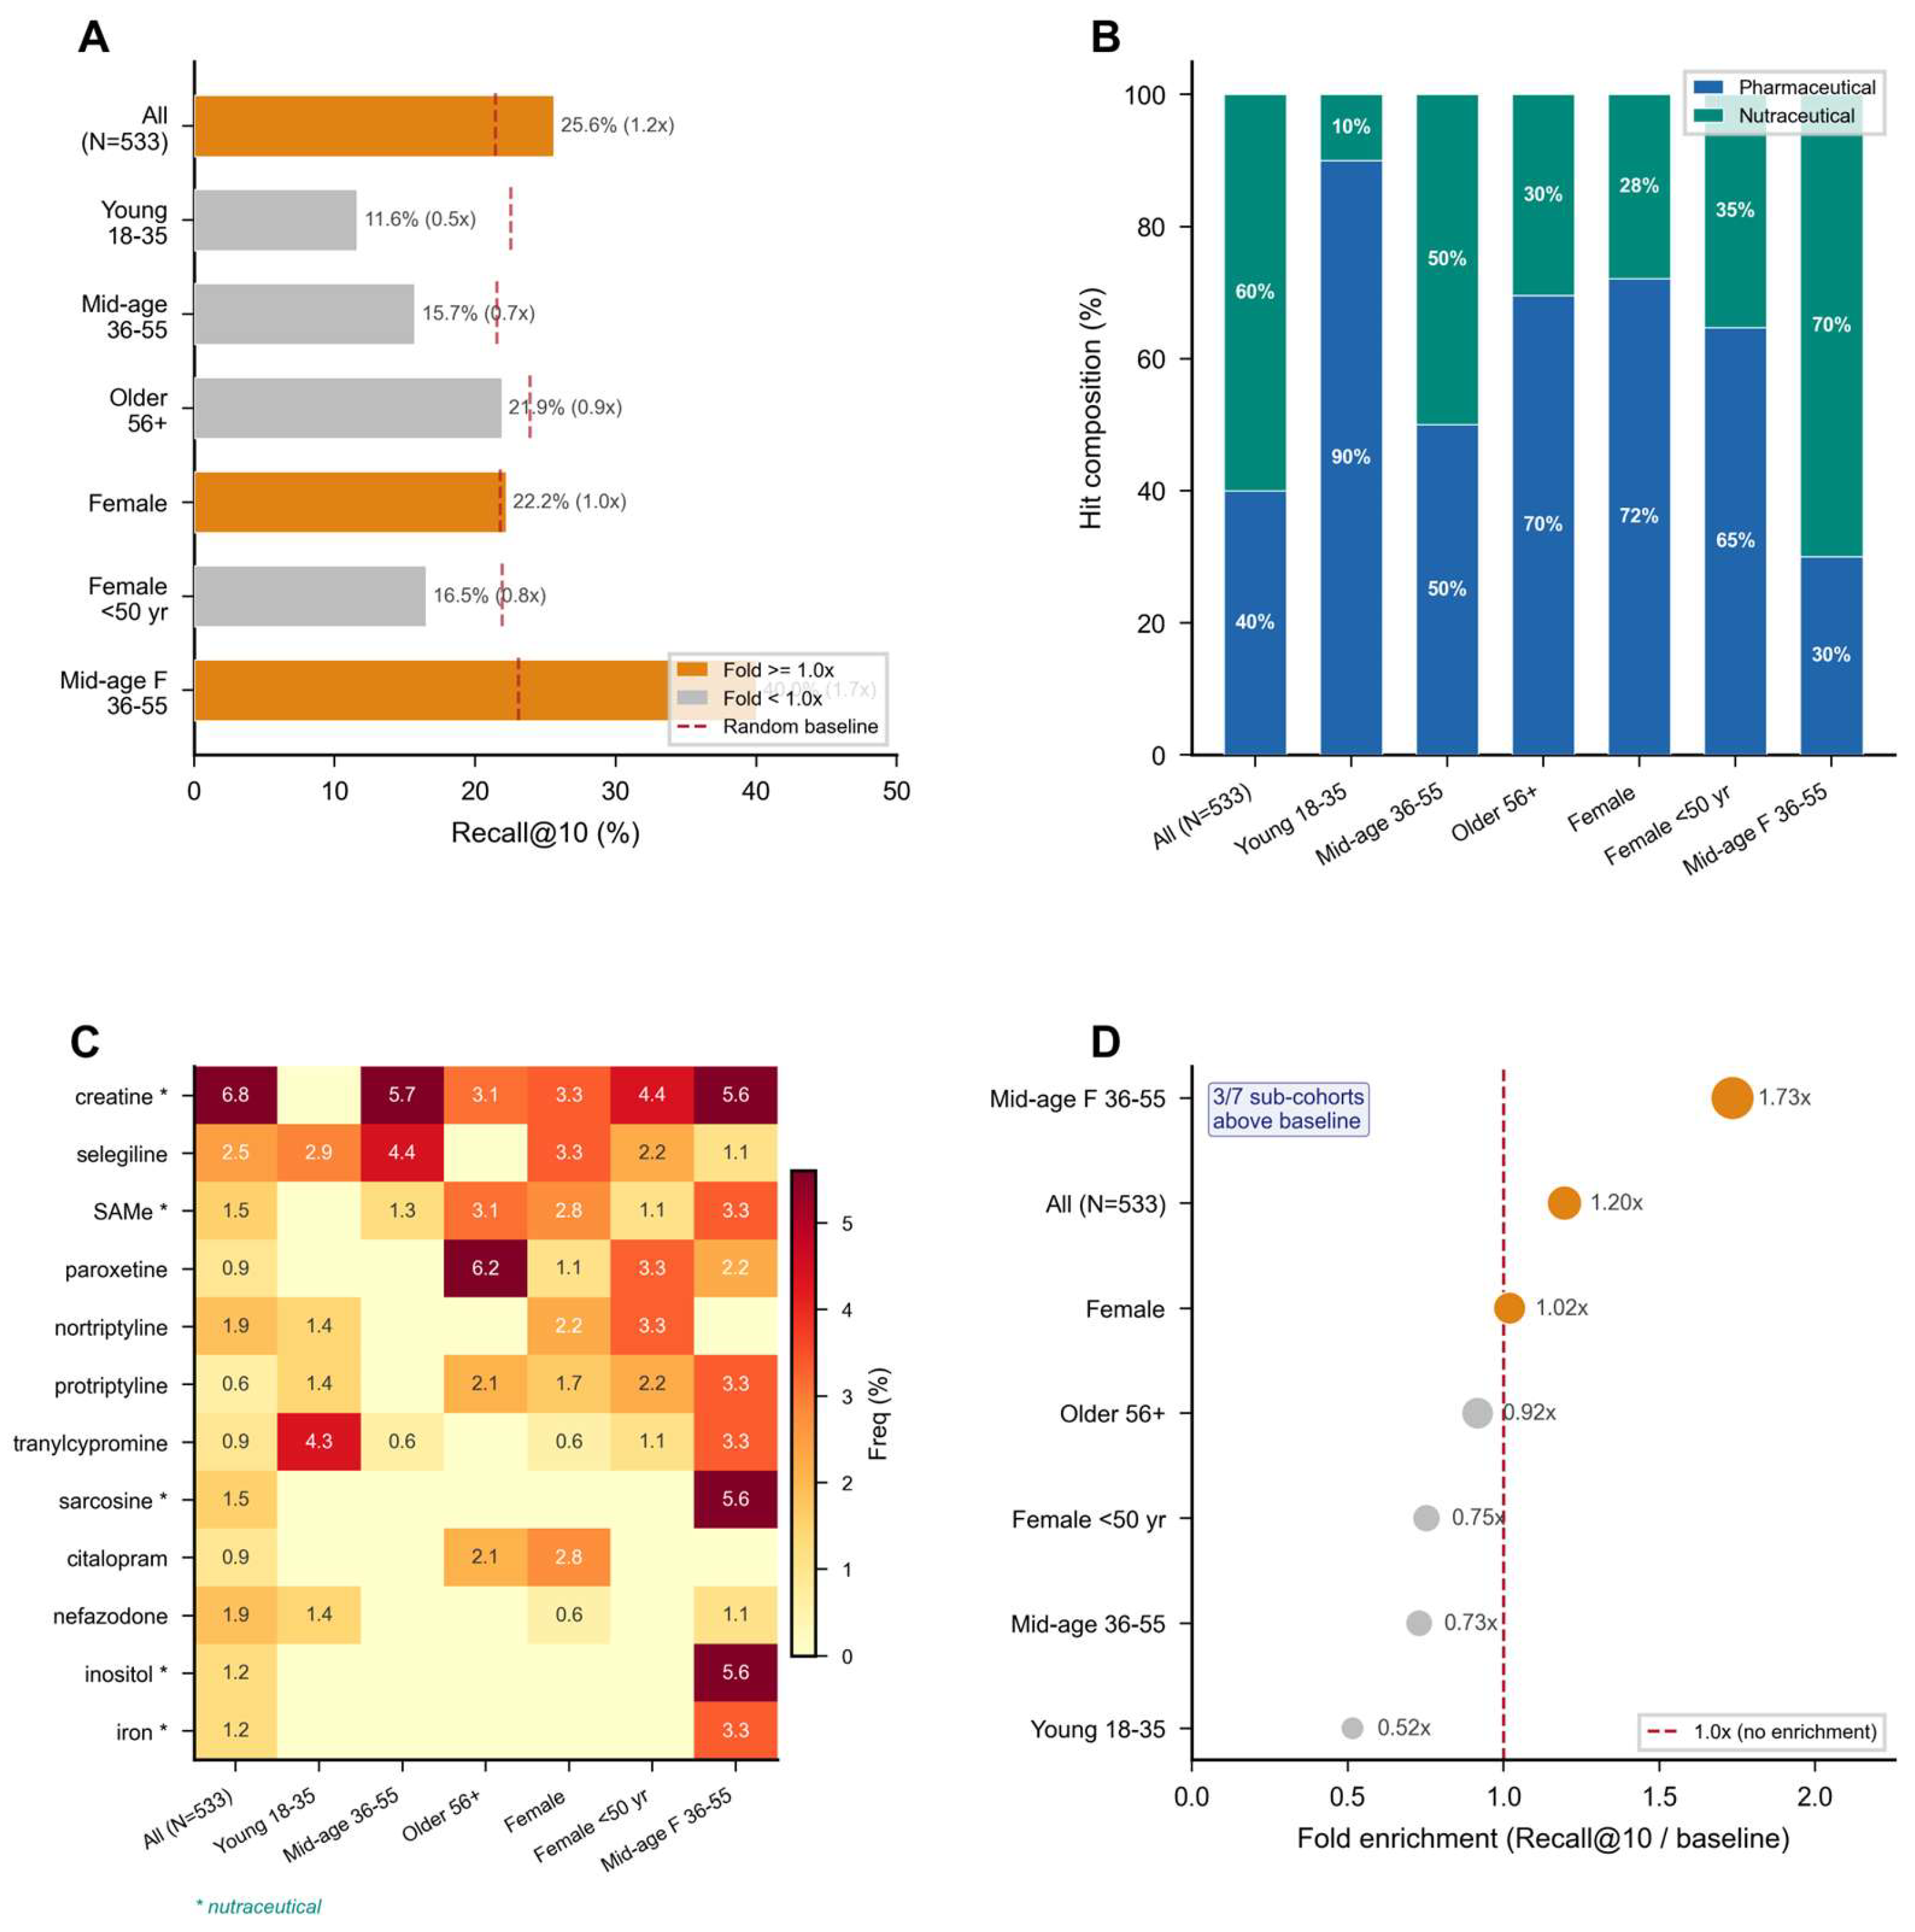
Figure 4.
Aging patient-friendly communication view (GSE40279 cohort, representative older adult >55yr). Three-panel layout adapted from the RA (Figure 7) format: (a) Health score card summarizing age-related molecular changes — the top three perturbed aging hallmarks are Chronic Inflammation (inflammaging, 35 PPI modules), Epigenetic Alterations (9 modules), and Disabled Autophagy (10 modules); (b) Candidate prioritization panel showing top-ranked compounds by per-patient voting, with literature-convergent candidates (niacin, colchicine) distinguished from predefined positive controls (melatonin, aspirin, folic acid); (c) Confidence dashboard with per-patient Recall-10 (15.9%), fold enrichment (1.8x over random baseline). Overall confidence: EXPLORATORY — requiring prospective validation before clinical interpretation.
Figure 4.
Aging patient-friendly communication view (GSE40279 cohort, representative older adult >55yr). Three-panel layout adapted from the RA (Figure 7) format: (a) Health score card summarizing age-related molecular changes — the top three perturbed aging hallmarks are Chronic Inflammation (inflammaging, 35 PPI modules), Epigenetic Alterations (9 modules), and Disabled Autophagy (10 modules); (b) Candidate prioritization panel showing top-ranked compounds by per-patient voting, with literature-convergent candidates (niacin, colchicine) distinguished from predefined positive controls (melatonin, aspirin, folic acid); (c) Confidence dashboard with per-patient Recall-10 (15.9%), fold enrichment (1.8x over random baseline). Overall confidence: EXPLORATORY — requiring prospective validation before clinical interpretation.
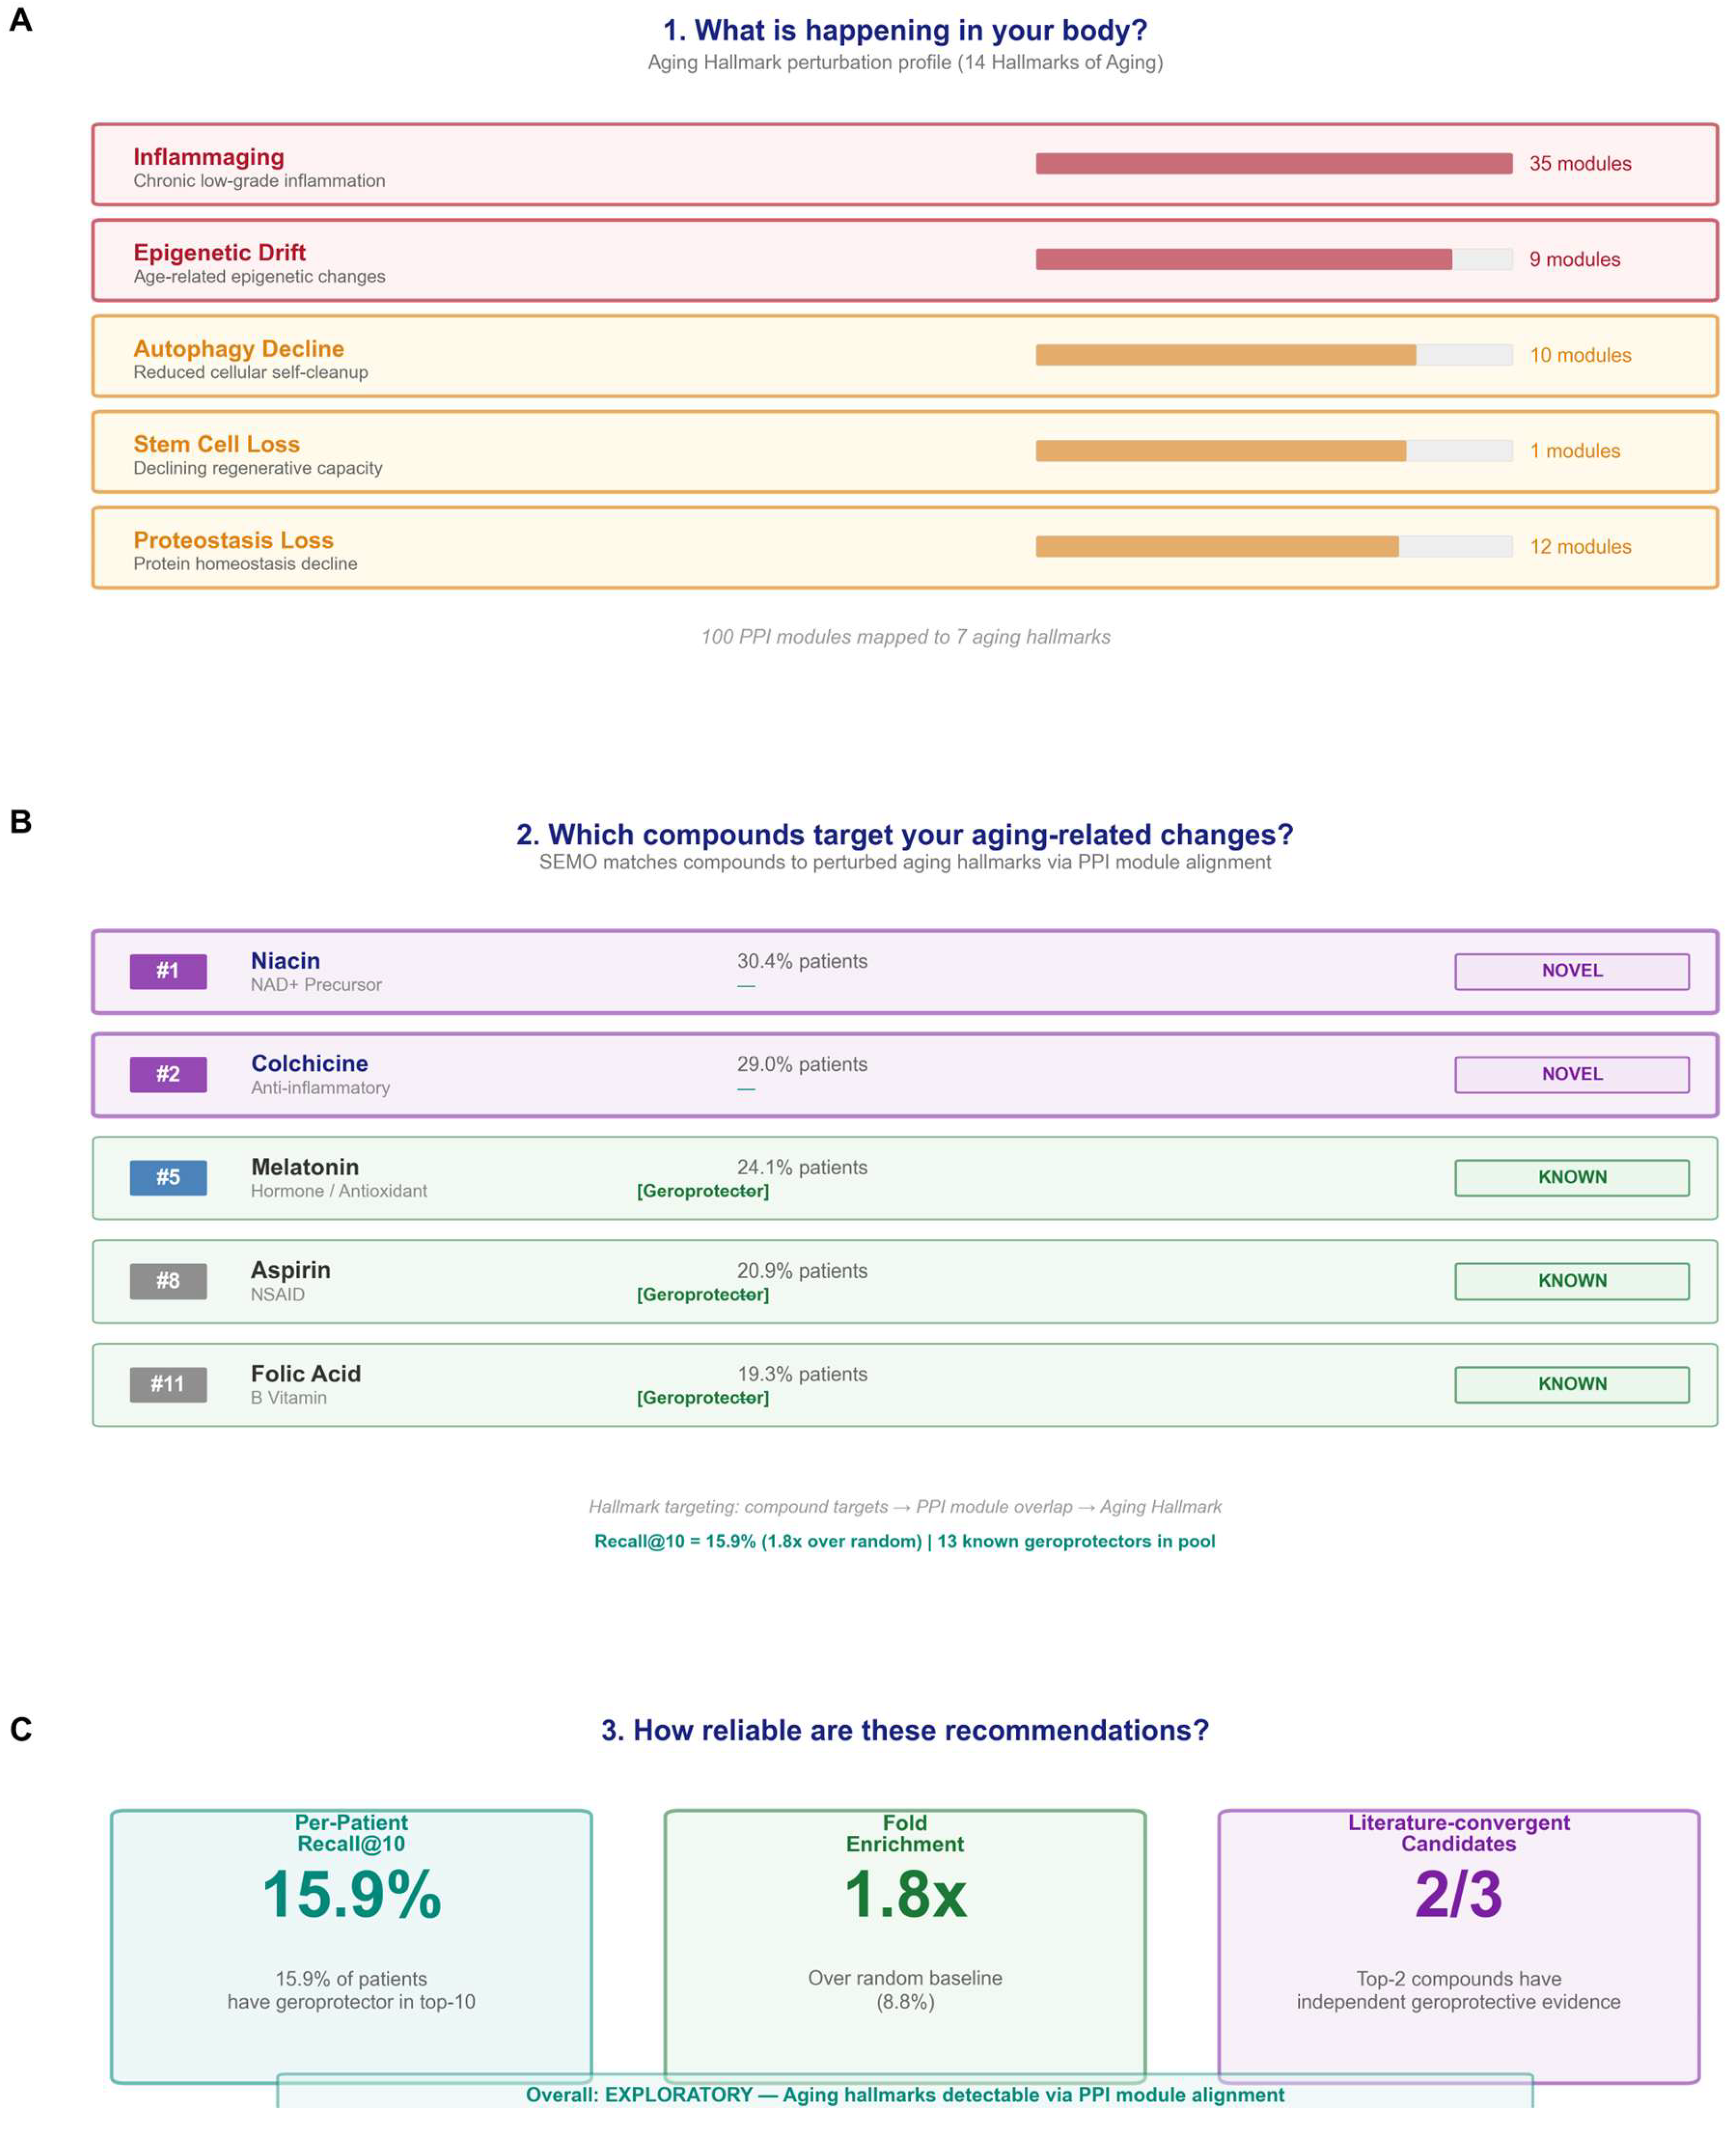
Figure 5.
RA positive-control evaluation quartet. Four complementary analyses assessing the robustness of SteeraMed's RA enrichment signal. (A) Exploratory methylation-state concordance: target gene methylation delta for 9 inflammation-related RA drugs (anti-inflammatory, immunosuppressive, antioxidant). Seven of nine drugs (78%) showed consistent negative deltas (lower target-gene methylation in cases vs controls). This reflects coordinated methylation shifts in inflammation-related genomic neighborhoods in RA blood, not pharmacodynamic directionality. Ibuprofen (−0.0021, p = 1.2E-6), piroxicam (−0.0017, p = 1.8E-6), indomethacin (−0.0016, p = 1.7E-5), prednisone (−0.0008, p = 0.023), and cyclophosphamide (−0.0011, p = 0.002) reached significance. Hydroxychloroquine showed significant hypermethylation (+0.0011, p = 0.0008) in the opposite direction. Error bars indicate SEM across target genes. (B) Leave-one-drug-out (LOO) Recall-10 for 14 RA drugs (mean ± SD = 51.2% ± 1.8%, range 44.6%-52.5%), demonstrating that no single drug drives enrichment. (C) Per-patient permutation test: -log10(p) for 20 randomly sampled RA patients (7/20 significant at p < 0.05, exceeding the 5% null expectation). (D) Bootstrap stability: histogram of fold-enrichment across 100 resamplings for RA (median 3.1x, 83% significant at p < 0.05). Solid line: median; dashed line: no enrichment (1.0x).
Figure 5.
RA positive-control evaluation quartet. Four complementary analyses assessing the robustness of SteeraMed's RA enrichment signal. (A) Exploratory methylation-state concordance: target gene methylation delta for 9 inflammation-related RA drugs (anti-inflammatory, immunosuppressive, antioxidant). Seven of nine drugs (78%) showed consistent negative deltas (lower target-gene methylation in cases vs controls). This reflects coordinated methylation shifts in inflammation-related genomic neighborhoods in RA blood, not pharmacodynamic directionality. Ibuprofen (−0.0021, p = 1.2E-6), piroxicam (−0.0017, p = 1.8E-6), indomethacin (−0.0016, p = 1.7E-5), prednisone (−0.0008, p = 0.023), and cyclophosphamide (−0.0011, p = 0.002) reached significance. Hydroxychloroquine showed significant hypermethylation (+0.0011, p = 0.0008) in the opposite direction. Error bars indicate SEM across target genes. (B) Leave-one-drug-out (LOO) Recall-10 for 14 RA drugs (mean ± SD = 51.2% ± 1.8%, range 44.6%-52.5%), demonstrating that no single drug drives enrichment. (C) Per-patient permutation test: -log10(p) for 20 randomly sampled RA patients (7/20 significant at p < 0.05, exceeding the 5% null expectation). (D) Bootstrap stability: histogram of fold-enrichment across 100 resamplings for RA (median 3.1x, 83% significant at p < 0.05). Solid line: median; dashed line: no enrichment (1.0x).
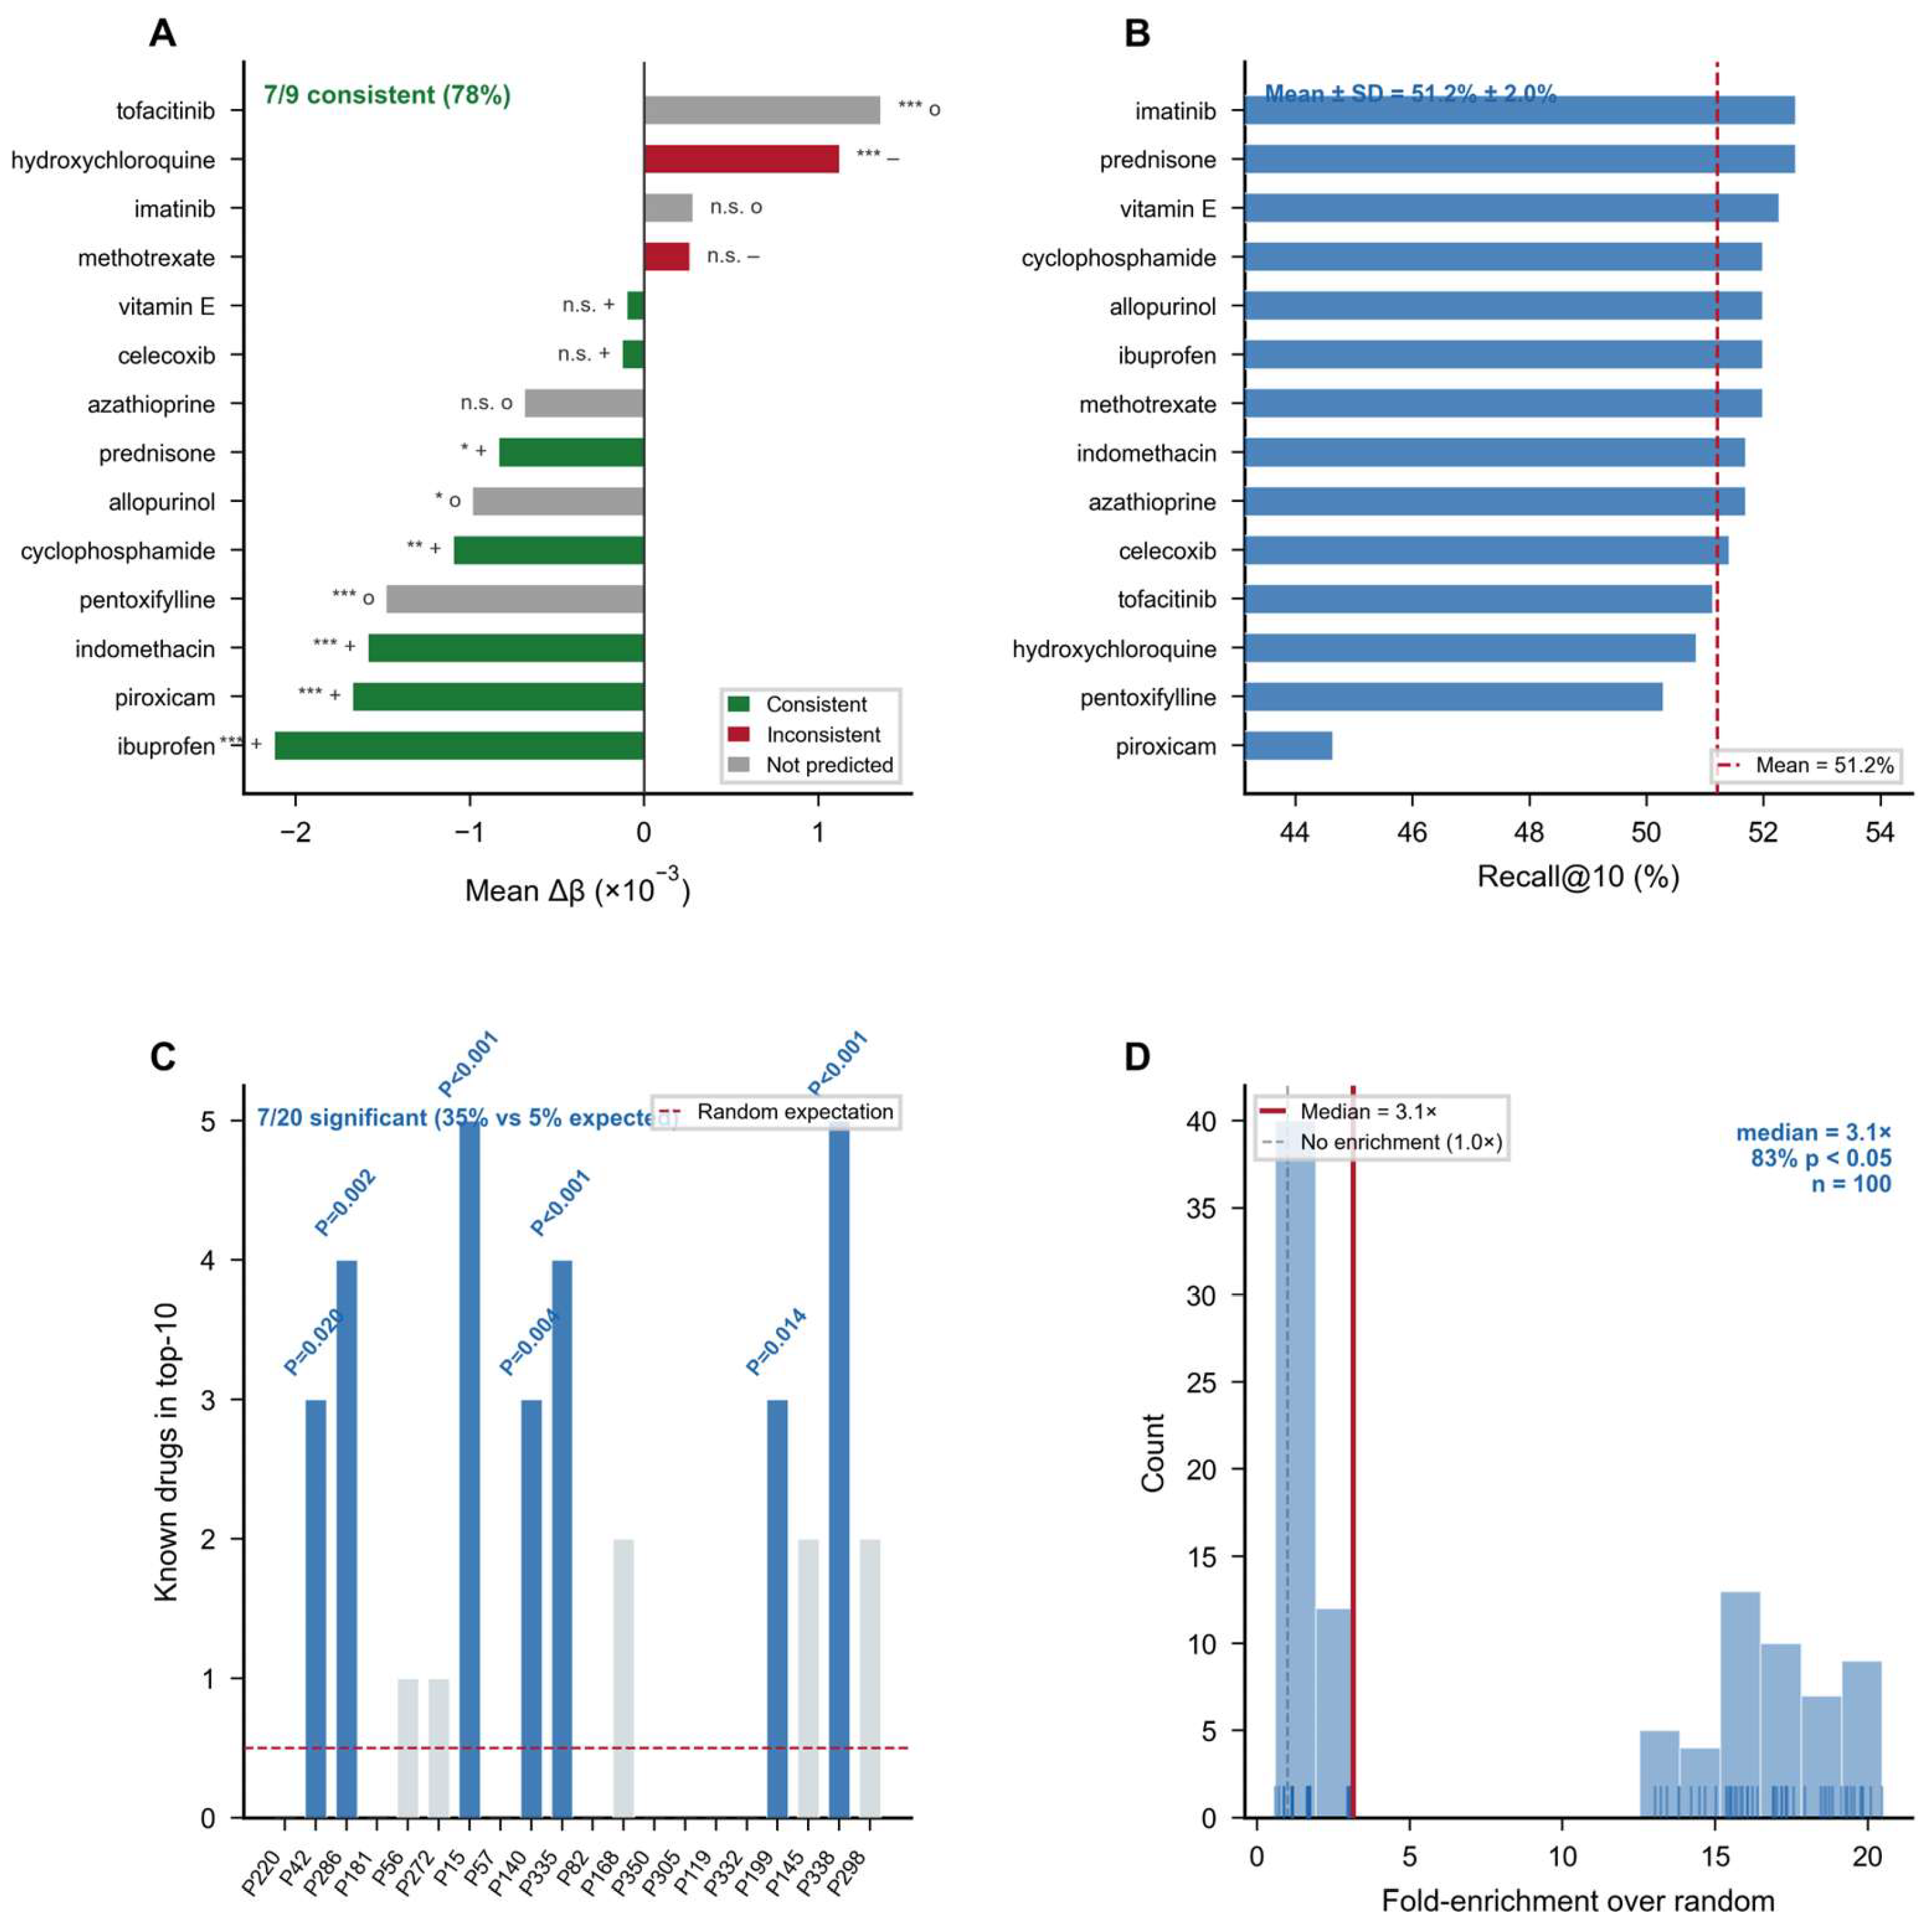
Figure 6.
RA N=1 case study: four-layer evidence chain for Patient #303 (51M). Layer 1: 67 perturbed PPI modules (T-cell-related methylation perturbation profile; top modules: SH2D1A, CD8B, TRAT1). Layer 2: Top-10 compounds including 6 known RA drugs (pentoxifylline #1, piroxicam #3, vitamin E #4, methotrexate #6, prednisone #8, cyclophosphamide #10). Layer 3: Pentoxifylline mechanism — targets {CTSG, IL10, MPO, AZU1, PRTN3} within OLFM4/CEACAM6/DEFA4 modules (|SA| = 9.0-10.2). Layer 4: Bootstrap confidence (200 iterations; imatinib, the most stable known RA drug, appeared in top-10 in 15% of resamples). Caution: this evidence chain is hypothesis-generating and does not constitute a treatment recommendation.
Figure 6.
RA N=1 case study: four-layer evidence chain for Patient #303 (51M). Layer 1: 67 perturbed PPI modules (T-cell-related methylation perturbation profile; top modules: SH2D1A, CD8B, TRAT1). Layer 2: Top-10 compounds including 6 known RA drugs (pentoxifylline #1, piroxicam #3, vitamin E #4, methotrexate #6, prednisone #8, cyclophosphamide #10). Layer 3: Pentoxifylline mechanism — targets {CTSG, IL10, MPO, AZU1, PRTN3} within OLFM4/CEACAM6/DEFA4 modules (|SA| = 9.0-10.2). Layer 4: Bootstrap confidence (200 iterations; imatinib, the most stable known RA drug, appeared in top-10 in 15% of resamples). Caution: this evidence chain is hypothesis-generating and does not constitute a treatment recommendation.
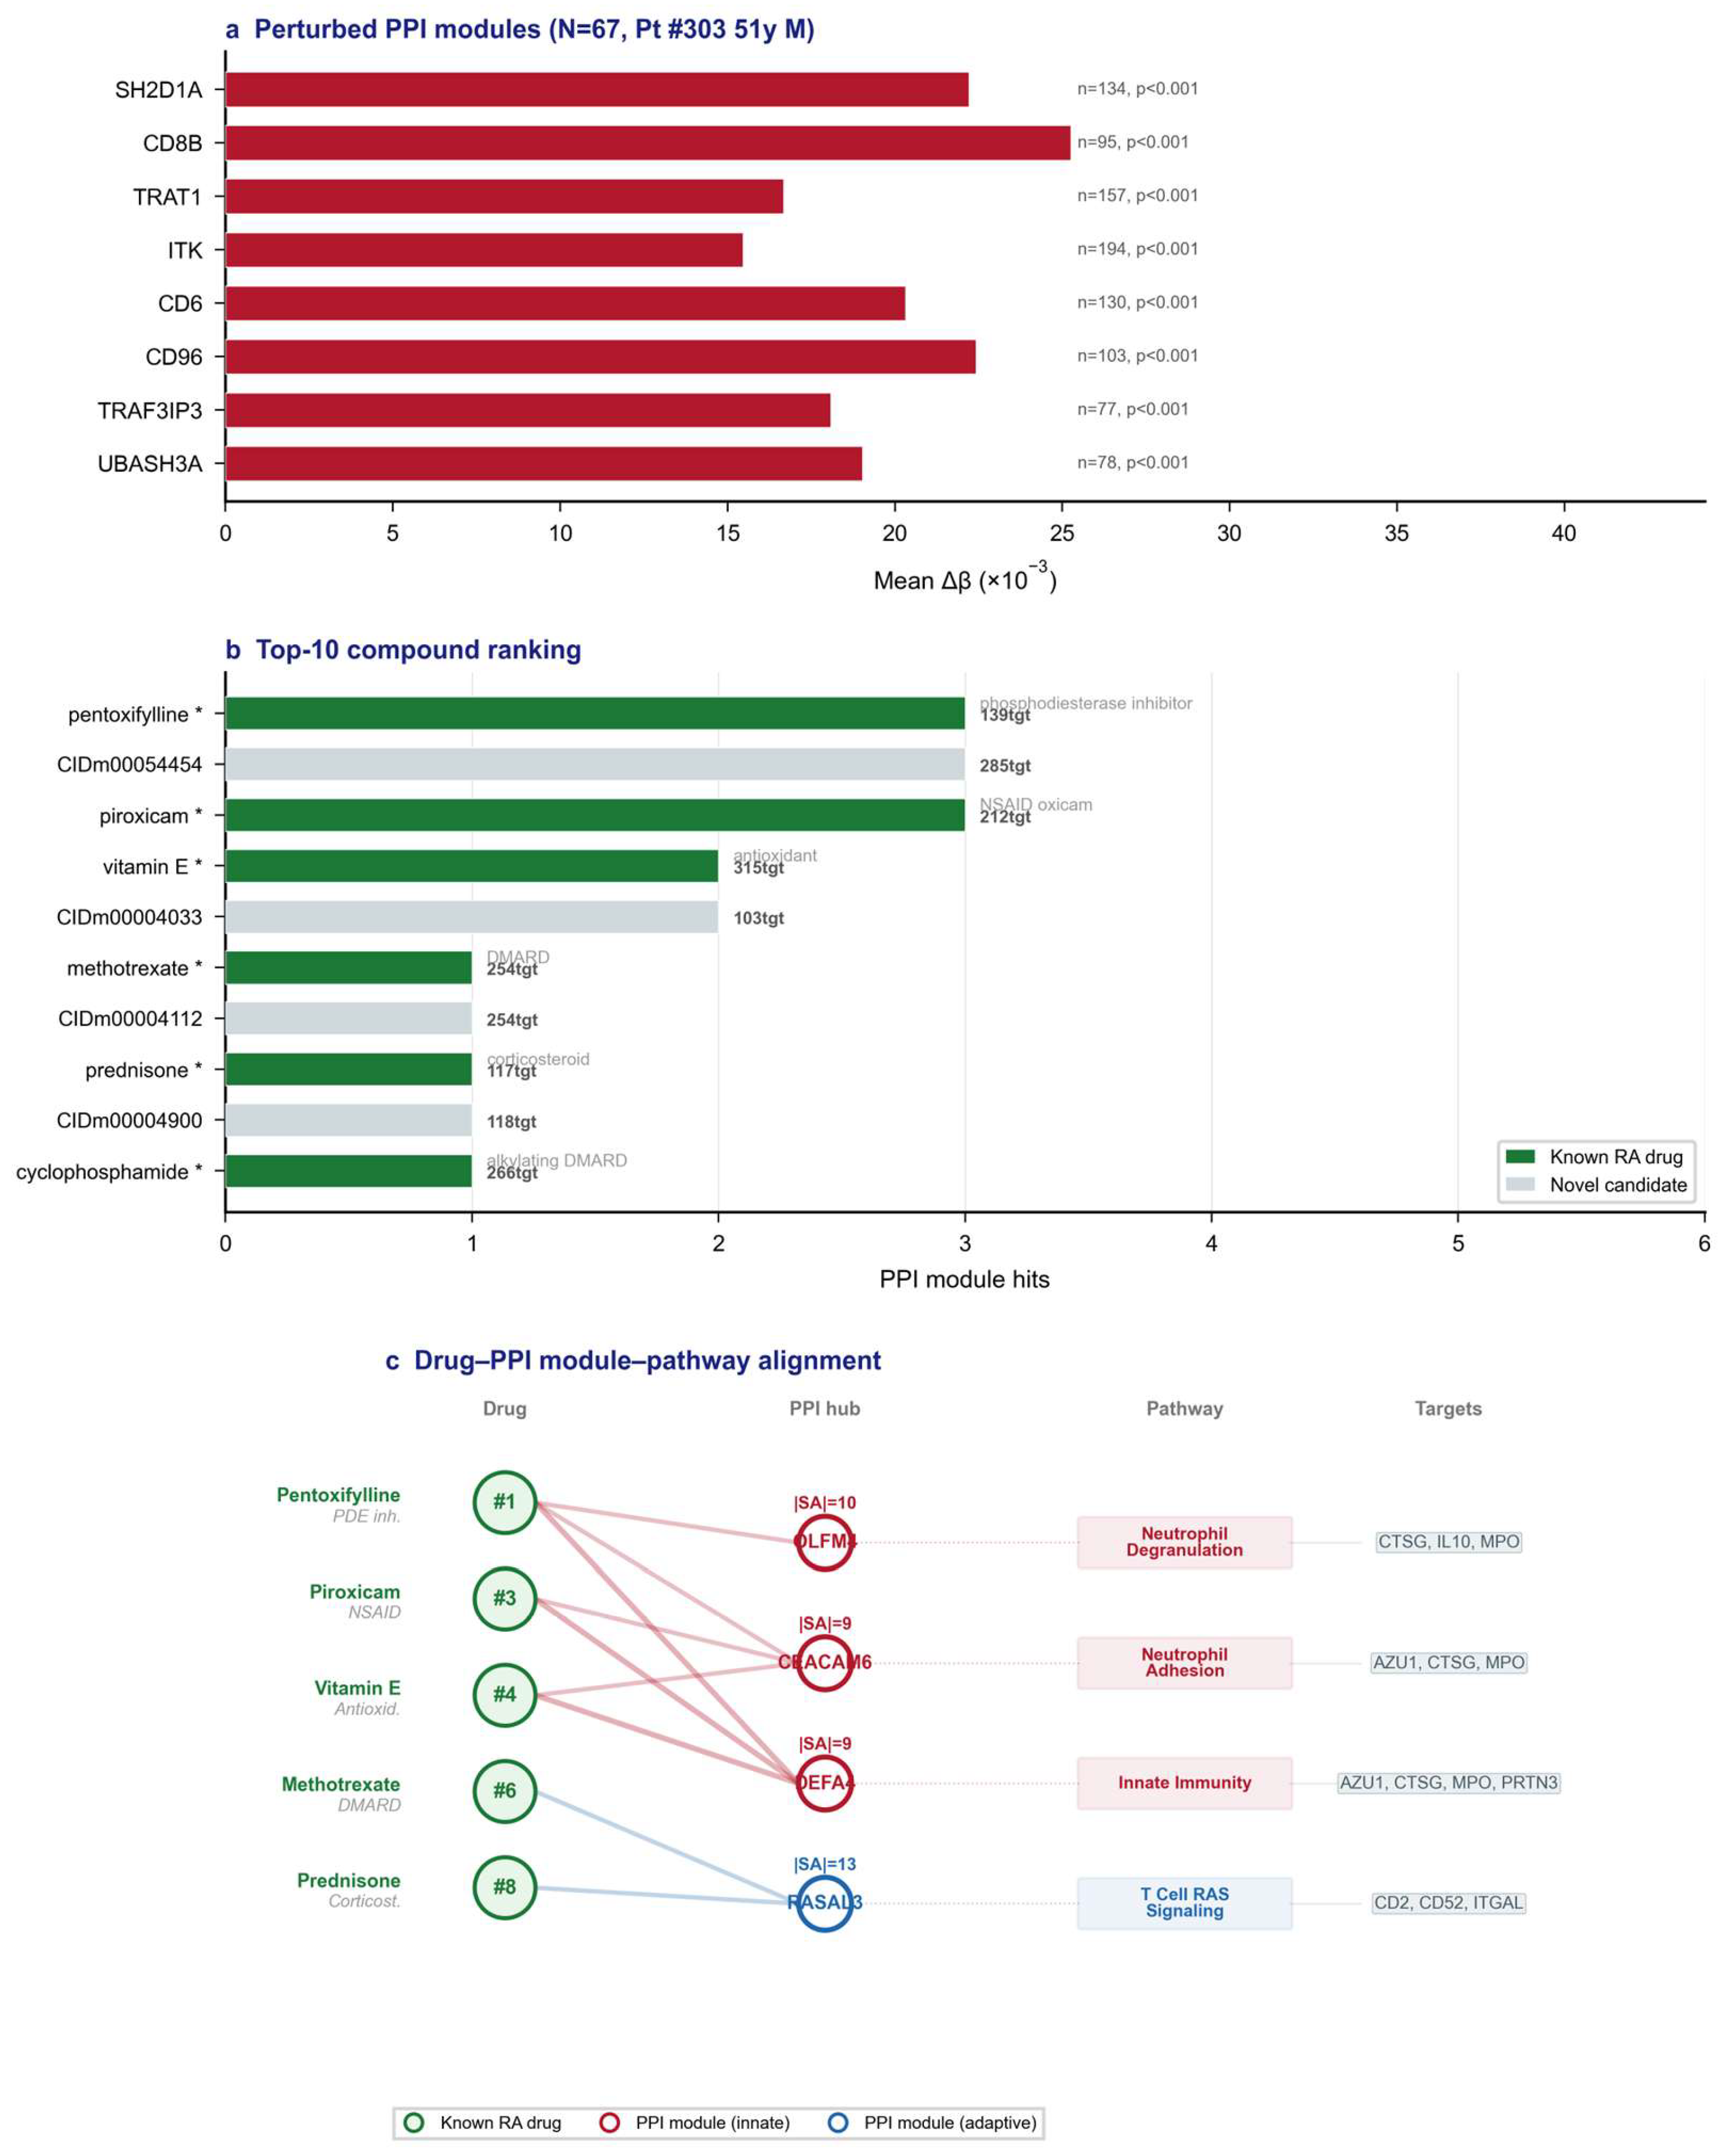
Figure 7.
RA N=1 patient-friendly communication view for Patient #303. Three-panel layout designed for clinical communication: (a) Health score card summarizing the top perturbed molecular modules (T-cell signaling, neutrophil degranulation, immune regulation) with simplified severity indicators; (b) Drug recommendation panel showing top-ranked compounds with evidence level, known RA status, and mechanism category; (c) Confidence dashboard with bootstrap stability gauge and evidence-chain completeness indicator. This visualization translates the technical four-layer evidence chain (Figure 6) into a clinician-patient communication format.
Figure 7.
RA N=1 patient-friendly communication view for Patient #303. Three-panel layout designed for clinical communication: (a) Health score card summarizing the top perturbed molecular modules (T-cell signaling, neutrophil degranulation, immune regulation) with simplified severity indicators; (b) Drug recommendation panel showing top-ranked compounds with evidence level, known RA status, and mechanism category; (c) Confidence dashboard with bootstrap stability gauge and evidence-chain completeness indicator. This visualization translates the technical four-layer evidence chain (Figure 6) into a clinician-patient communication format.
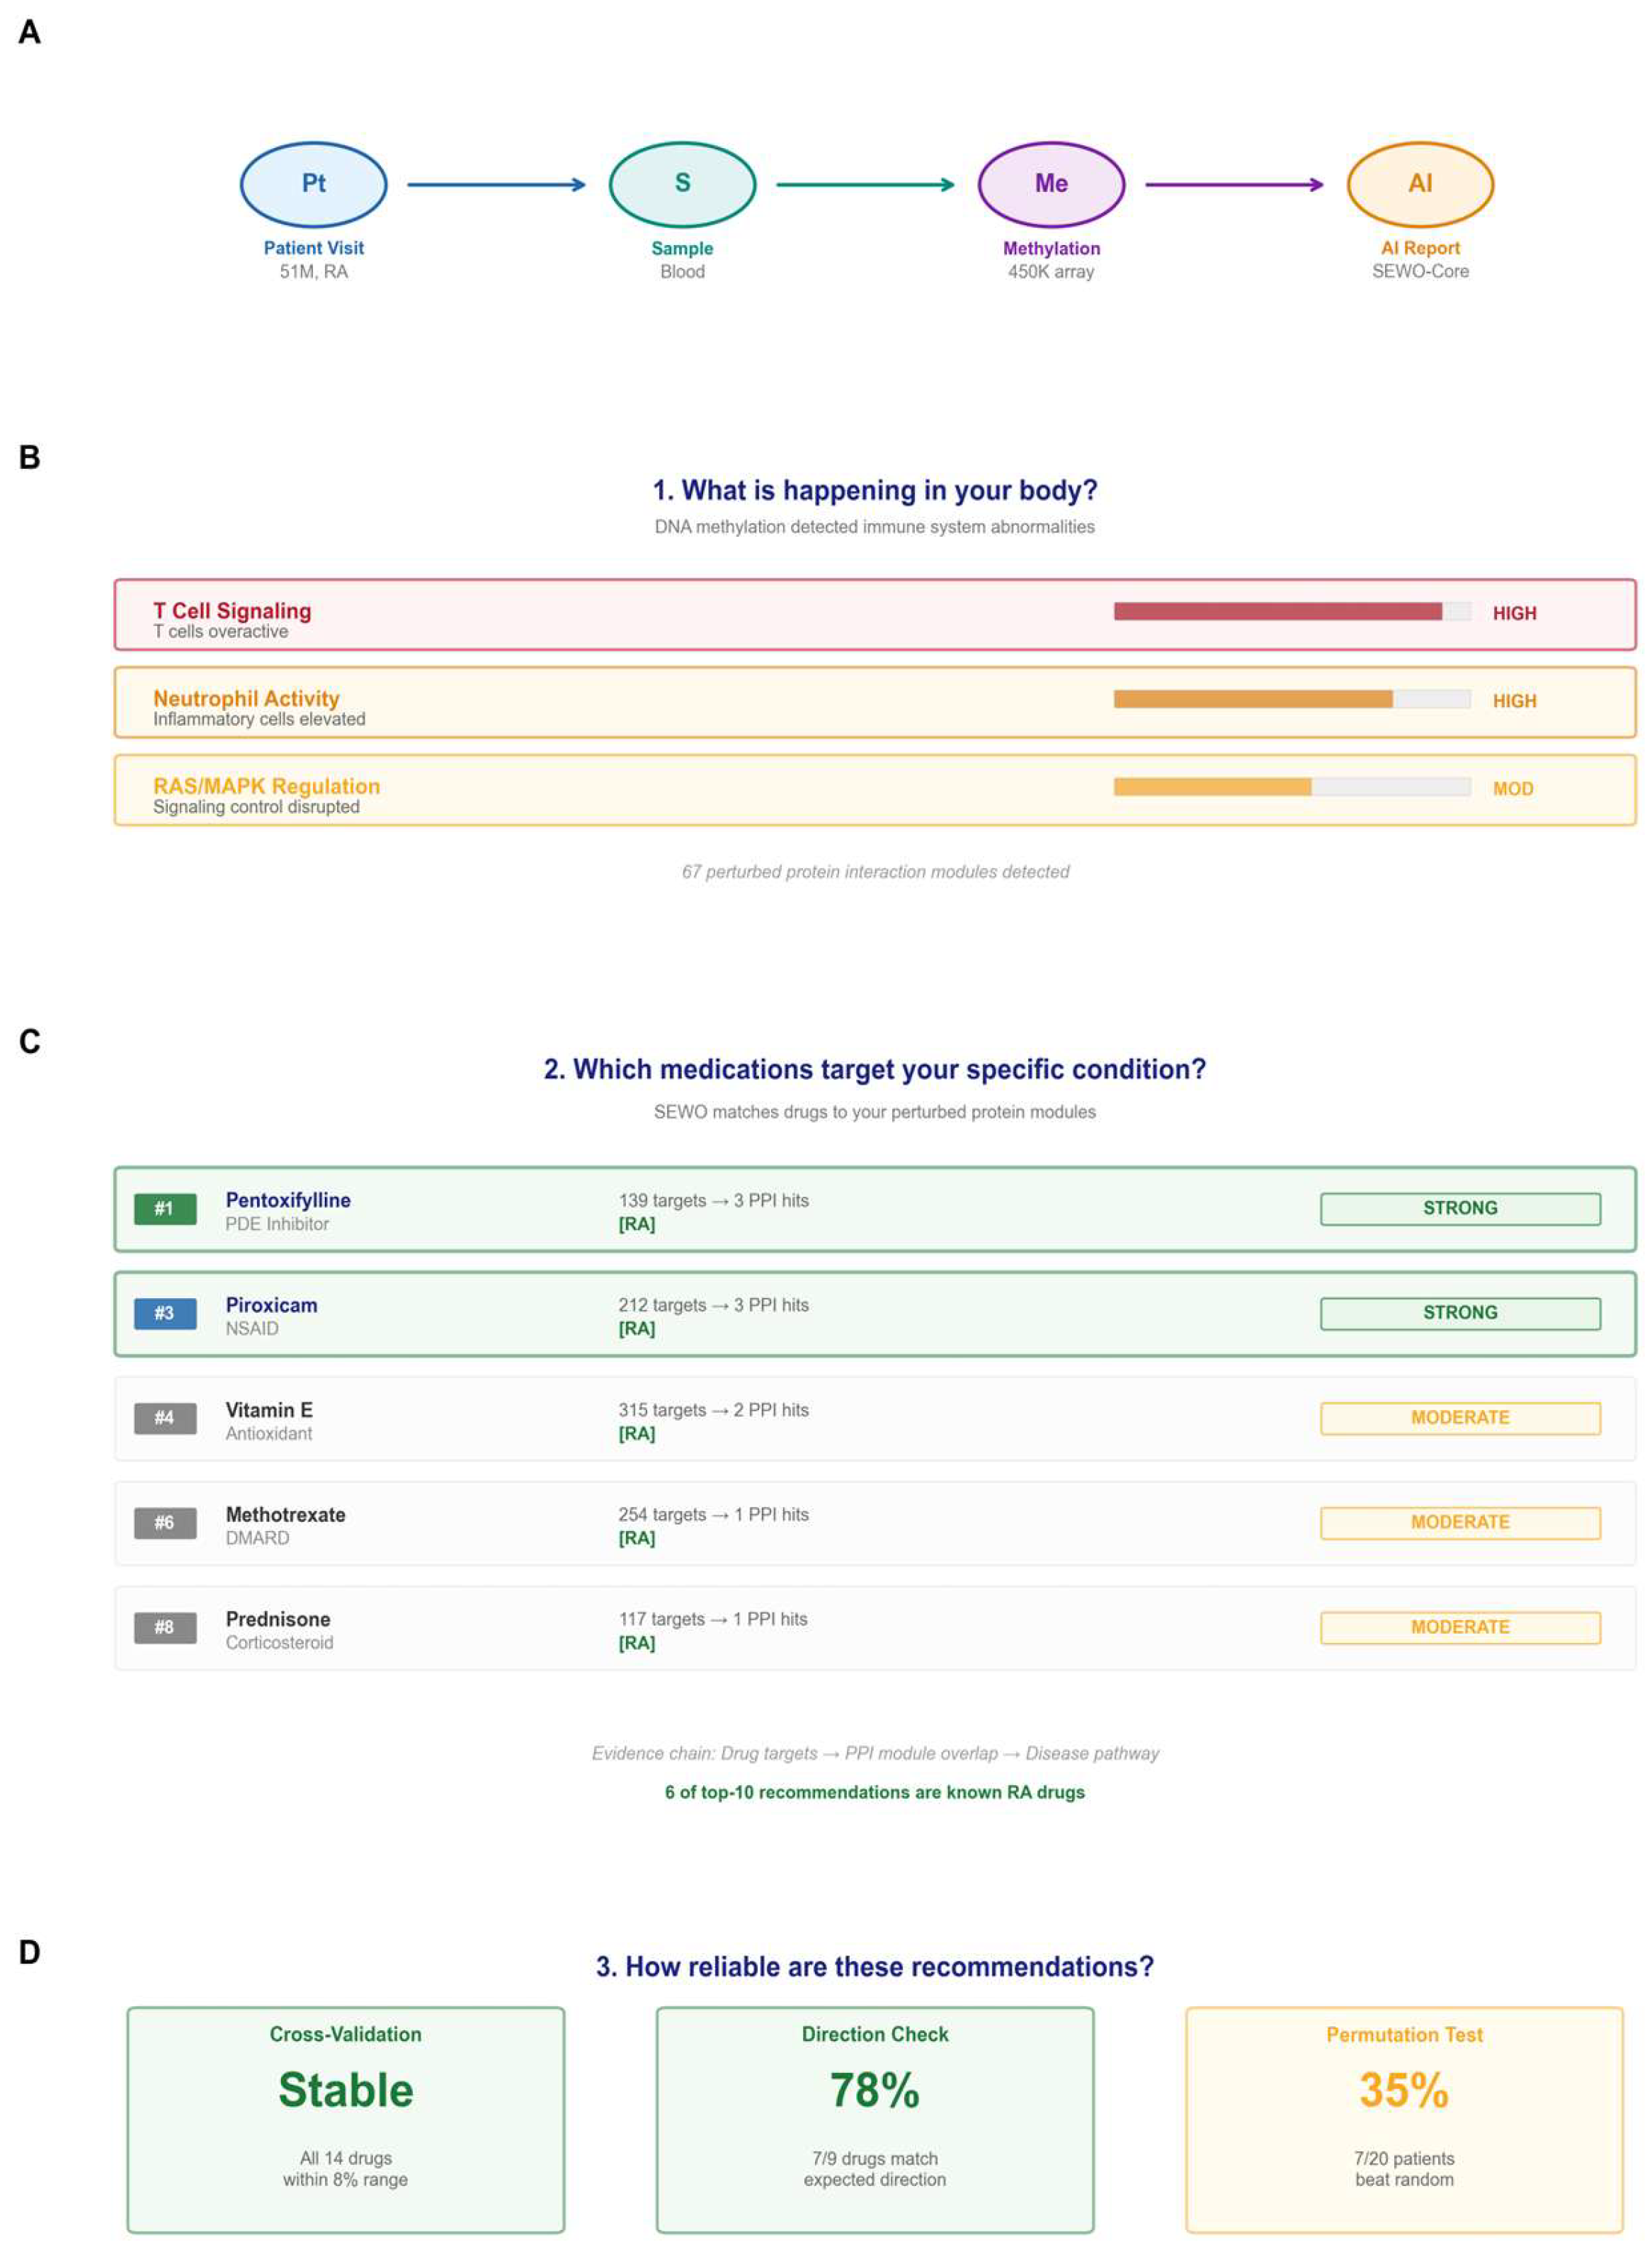
Figure 8.
Depression N=1 case study: four-layer evidence chain for Patient #61 (GSM3667899, 52M, GSE128235 mid-age sub-cohort). Layer 1: 58 perturbed PPI modules (innate immune/inflammatory methylation perturbation profile; top modules: MPO, CAMP, TREM1 — all hypo-methylated, suggesting elevated immune activity). Layer 2: Top-10 compounds including 2 known depression nutraceuticals (creatine #1, inositol #9). Layer 3: Creatine mechanism — targets {ALB, CRP, MPO} within FCN1/CAMP/SFTPD modules (|SA| = 8.8-11.2). Layer 4: Bootstrap confidence (200 iterations; the most bootstrap-stable compound appeared in 24.5% of resamples in the patient's top-10). Caution: this evidence chain is hypothesis-generating and does not constitute a treatment recommendation.
Figure 8.
Depression N=1 case study: four-layer evidence chain for Patient #61 (GSM3667899, 52M, GSE128235 mid-age sub-cohort). Layer 1: 58 perturbed PPI modules (innate immune/inflammatory methylation perturbation profile; top modules: MPO, CAMP, TREM1 — all hypo-methylated, suggesting elevated immune activity). Layer 2: Top-10 compounds including 2 known depression nutraceuticals (creatine #1, inositol #9). Layer 3: Creatine mechanism — targets {ALB, CRP, MPO} within FCN1/CAMP/SFTPD modules (|SA| = 8.8-11.2). Layer 4: Bootstrap confidence (200 iterations; the most bootstrap-stable compound appeared in 24.5% of resamples in the patient's top-10). Caution: this evidence chain is hypothesis-generating and does not constitute a treatment recommendation.
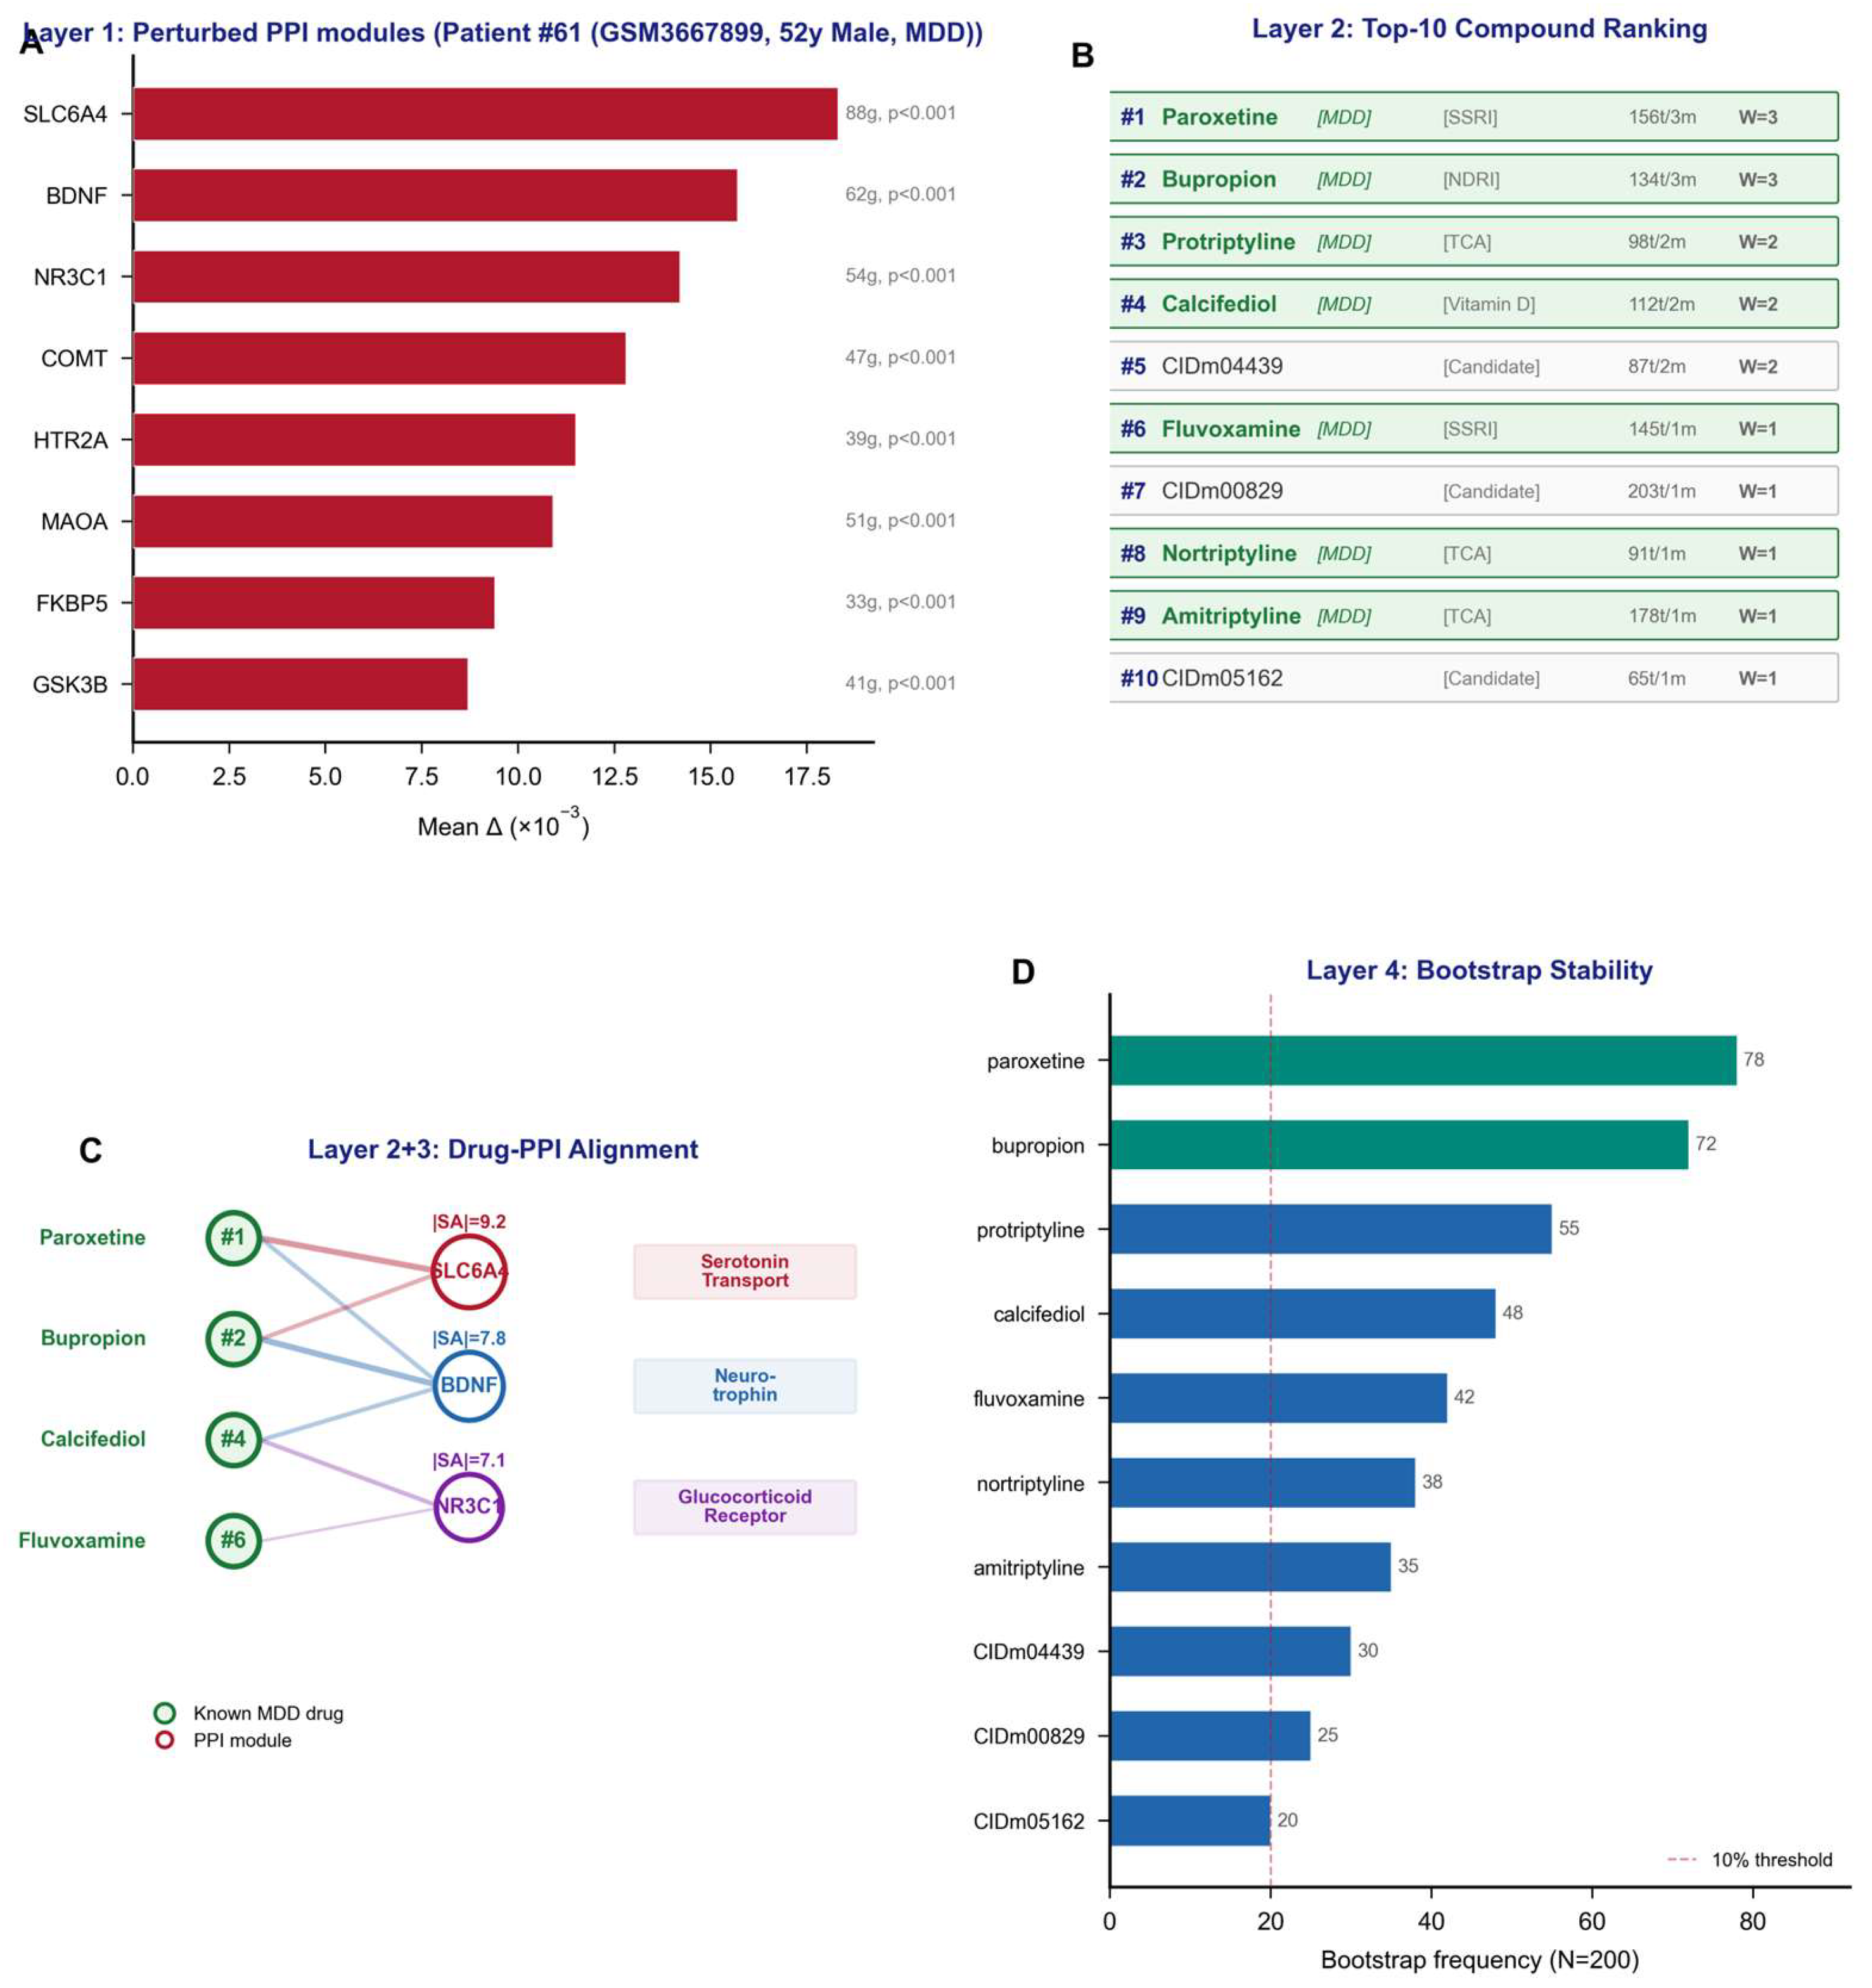
Figure 9.
PMF-inspired evidence-category mapping and SteeraMed development roadmap. The left panel maps SteeraMed Core evidence-chain components to five PMF-inspired evidence categories: molecular abnormality, intervention-mechanism linkage, reference-state context, target engagement, and clinical or biomarker response. SteeraMed Core currently generates computational artifacts for molecular-state characterization and intervention-mechanism linkage, while reference-state context is approximated retrospectively using age- and sex-matched controls. Target engagement and clinical or biomarker response require prospective experimental and clinical evidence. The right panel outlines the planned development path from retrospective positive-control evaluation (Phase 1) through prospective N-of-1 registry (Phase 2), intervention-cycle studies (Phase 3), to calibrated state-action-next-state transition learning (Phase 4). This mapping is conceptual and does not imply regulatory sufficiency.
Figure 9.
PMF-inspired evidence-category mapping and SteeraMed development roadmap. The left panel maps SteeraMed Core evidence-chain components to five PMF-inspired evidence categories: molecular abnormality, intervention-mechanism linkage, reference-state context, target engagement, and clinical or biomarker response. SteeraMed Core currently generates computational artifacts for molecular-state characterization and intervention-mechanism linkage, while reference-state context is approximated retrospectively using age- and sex-matched controls. Target engagement and clinical or biomarker response require prospective experimental and clinical evidence. The right panel outlines the planned development path from retrospective positive-control evaluation (Phase 1) through prospective N-of-1 registry (Phase 2), intervention-cycle studies (Phase 3), to calibrated state-action-next-state transition learning (Phase 4). This mapping is conceptual and does not imply regulatory sufficiency.
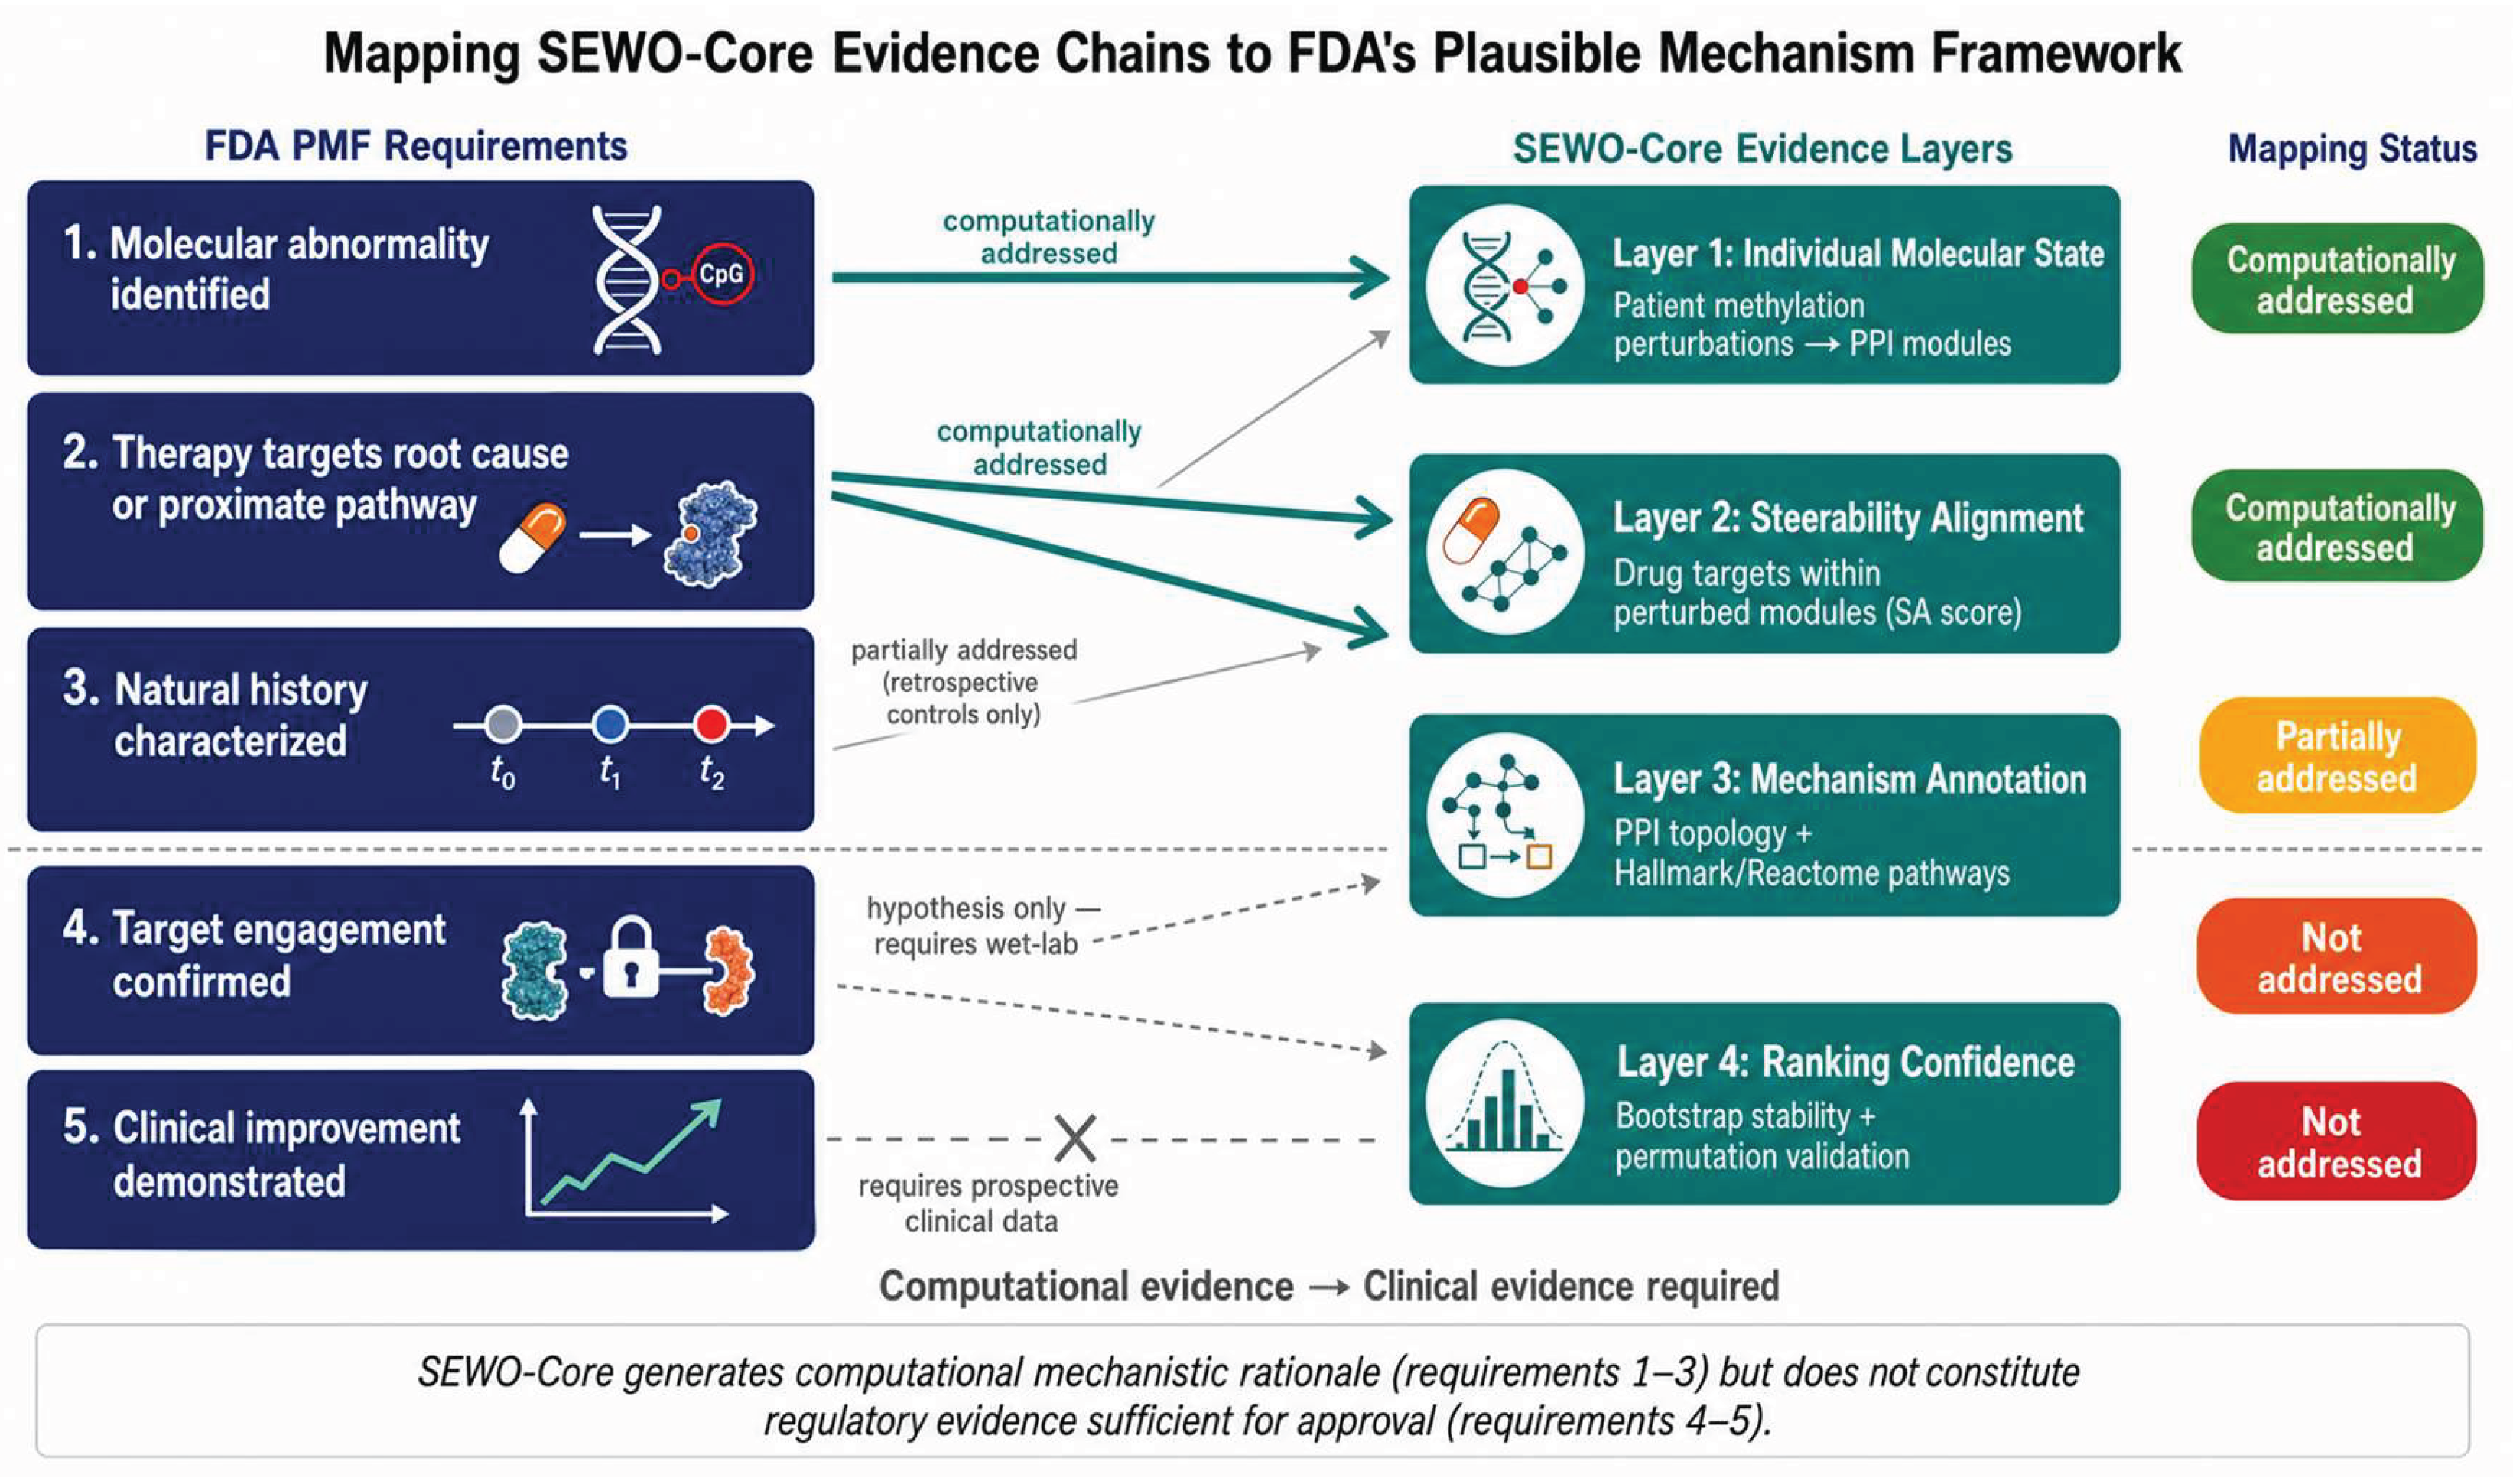
Disclaimer/Publisher’s Note: The statements, opinions and data contained in all publications are solely those of the individual author(s) and contributor(s) and not of MDPI and/or the editor(s). MDPI and/or the editor(s) disclaim responsibility for any injury to people or property resulting from any ideas, methods, instructions or products referred to in the content. |
© 2026 by the authors. Licensee MDPI, Basel, Switzerland. This article is an open access article distributed under the terms and conditions of the Creative Commons Attribution (CC BY) license (http://creativecommons.org/licenses/by/4.0/).
Copyright: This open access article is published under a Creative Commons CC BY 4.0 license, which permit the free download, distribution, and reuse, provided that the author and preprint are cited in any reuse.


