

Submitted:
22 May 2026
Posted:
22 May 2026
You are already at the latest version
Abstract
Family enterprises are a significant component of developed and emerging economies. However, the factors influencing their performance remain inadequately explored, particularly regarding social-emotional wealth (SEW). This study aimed to investigate whether the dimensions of SEW, as delineated by the FIBER model, serve as predictors of family firms' self-assessment concerning their economic status. Utilizing data from 365 Polish family-owned enterprises, gathered through Computer-Assisted Telephone Interviewing (CATI) and Computer-Assisted Web Interviewing (CAWI) methods, six algorithms of over-patterned machine learning were employed: the naive Bayes classifier, linear and nonlinear support vector machines, decision trees, the k-nearest neighbours algorithm, and logistic regression. Model efficacy was assessed through cross-validation, with relevance (accuracy) identified as the principal evaluative criterion. The findings revealed that SEW variables exhibited a robust predictive capability for softer performance indicators, such as customer satisfaction, product/service quality, and employee retention. Conversely, their explanatory power for hard financial metrics was constrained. The results underscore the value of integrating behavioural constructs with mathematical models to enhance the understanding of organisational performance, offering fresh theoretical and practical insights into machine learning applications within family business research.
Keywords:
machine learning applications
; socioemotional wealth
; business performance
; family firms
1. Introduction
Family firms represent the most widespread form of business organization globally, exerting a substantial influence on both emerging and developed economies (La Porta et al., 1999), contributing to GDP creation and employment of workforce in well-developed countries and worldwide significantly (KPMG, 2015; Villalonga et al., 2015; Villalonga & Amit, 2010). Despite the heterogeneity, the different scale and modus operandi and the economic effects achieved (Chua et al., 2012; Neubaum et al., 2019), the specificity of family businesses is unquestionably determined by the involvement of family members in the running of the business, the emotional ties that exist between relatives and the social-emotional wealth (SEW) in a broader sense (Berrone et al., 2012; Chrisman et al., 2012; Razzak & Jassem, 2019). To validate SEW, P. Berrone, C. Cruz and L.R. Gomez-Mejia (2012) proposed adopting the FIBER scale, which assumes the existence of five main dimensions of SEW after the English names of each.
Family firm researchers argue that socio-emotional wealth is the most important distinguishing feature of the family firm as a unique entity, which helps to explain why these entities behave distinctly from non-family firms (Berrone et al., 2012). It involves the desire for family members to exercise unlimited power in the company, to benefit from family influence, to appoint trusted family members to important positions, and above all, to maintain a strong identity with the company, which usually includes the family name in its name, and to continue the family dynasty (Gómez-Mejía et al., 2007). The desire to preserve socio-emotional wealth influences the decision-making of family businesses, which may impact their performance. Under the premise of SEW preservation, decision-makers often prioritize non-financial objectives, accepting suboptimal economic outcomes to safeguard SEW (Gómez-Mejía et al., 2007; King et al., 2022). However, empirical research suggests that SEW functions as a dual-edged construct, simultaneously serving as an asset and a liability depending on contextual factors (Kellermanns et al., 2012; Naldi et al., 2013). It means that certain dimensions of SEW may constrain firm performance while others can enhance it (Miller & Le Breton-Miller, 2014; Razzak & Jassem, 2019).
The evidence underscores the contingent nature of SEW’s influence, necessitating further contextual and mechanistic analysis to elucidate its role in family firm performance. The presented state of knowledge and the identified research gaps constitute the article’s aim to identify indicators of self-assessment of the economic situation of family businesses for which SEW indicators are predictors using machine learning. Several machine learning algorithms were used to achieve the article’s objective: naive Bayes classifier, support vector machine - linear and nonlinear, decision trees, KNN algorithm, and logistic regression. The paper’s contribution to theory is twofold. First, it identifies new and promising applications of machine learning algorithms in the social sciences. Secondly, it contributes to the theory and state of the art regarding new predictors of the self-assessment of the economic situation of family businesses. In this article, the first section is followed by a narrative review of the literature in the field of family entrepreneurship and the structure of selected machine learning algorithms is presented. Section three presents the research methodology based on machine learning. Section four presents and discusses the research results obtained. The article concludes with a summary in which the main conclusions are presented and further research directions are indicated.
2. Literature Review
2.1. Family Firms in Economy
Family firms represent the most widespread form of business organization globally, substantially influencing emerging and developed economies (La Porta et al., 1999). Research by B. Villalonga, R. Amit, M.-A. Trujillo, M.-A. and A. Guzmán (2015) indicate that family businesses account for 80% to 98% of all enterprises worldwide, contributing roughly 49% of the global GDP and employing more than 75% of the global workforce. Family firms constitute 33% of large publicly listed corporations in the United States and approximately 90% of all businesses (Villalonga & Amit, 2006, 2010). Similarly, in Europe, family businesses serve as a foundational pillar of the private sector, generating over 60 million jobs and comprising between 55% and 90% of all companies, irrespective of their size (KPMG, 2015). The ubiquity of family firms highlights their critical role in the global economic landscape, underscoring the necessity for scholarly inquiry into their leadership and governance dynamics.
Attempts to formulate a definition of a family business have been made since these businesses were identified as a separate research area. More than two hundred definitional concepts can be identified in the literature and expert studies (Hernández-Linares et al., 2018). However, none of these has been universally accepted by the research community and other stakeholder groups. Also, the definition proposed by the European Union (European Commission, 2009) has not gained acceptance among the legislative bodies of individual Member States. It is worth noting, however, that some countries, such as Austria, Hungary, Italy, Lithuania and Bulgaria, have introduced the notion of family enterprise into their legal system (Mandl, 2008), which, however, is the exception rather than the rule. The multitude of unique characteristics that characterise this group of businesses is the subject of an ongoing debate, with numerous attempts to answer the question of which attributes should be taken into account when defining them. However, the lack of consensus in this area suggests that defining a family business acceptable to all stakeholder groups and recognised in different cultural circles is currently an unsolvable problem (Safin & Zajkowski, 2021). Therefore, a relatively common method of separation found in research is self-classification. This approach is based on W.I. Thomas’ theorem that “if men define situations as real, they are real in their consequences” (Bornmann & Marx, 2020). Hence, it is assumed that if an entrepreneur or entrepreneurs consider their company to be family-owned, they manage it in a manner typical of this group of actors.
Despite the heterogeneity, the different scale and modus operandi and the economic effects achieved (Chua et al., 2012; Neubaum et al., 2019), the specificity of family businesses is unquestionably determined by the involvement of family members in the running of the business, the emotional ties that exist between relatives and the social-emotional wealth in a broader sense (Berrone et al., 2012; Chrisman et al., 2012; Razzak & Jassem, 2019).
2.1.1. Socio-Emotional Wealth of Family Firms
In response to the need for a theoretical construct suitable for research on family firms, a new formulation has been proposed, which researchers have called socio-emotional wealth (SEW) (Berrone et al., 2010; Gomez-Mejia et al., 2010; Gómez-Mejía et al., 2007). It builds on the foundations of previous research on family firms. At the same time, it is firmly rooted in the field of management science, as it is an extension of behavioural agency theory (Gomez-Mejia, L. R., Welbourne & Wiseman, 2000; Wiseman & Gomez-Mejia, 1998), which in turn integrates elements of prospect theory, behavioural firm theory and agency theory (Berrone et al., 2012)
Family firm researchers argue that socio-emotional wealth is the most important distinguishing feature of the family firm as a unique entity, which helps to explain why these entities behave in a distinct way from non-family firms (Berrone et al., 2012). It involves the desire for family members to exercise unlimited power in the company, to benefit from family influence, to appoint trusted family members to important positions, and above all, to maintain a strong identity with the company, which usually includes the family name in its name, and to continue the family dynasty (Gómez-Mejía et al., 2007). It means that the business becomes an integral and unavoidable part of families’ lives. In contrast, for non-family owners or external managers, the relationship with the company is more distant, transitory, individualistic and utilitarian (Block, 2011; Chua et al., 2003).
The desire to preserve socio-emotional wealth influences the decision-making of family businesses. For example, they will diversify their activities less for fear of having to hire people from outside the family, so the family’s influence on the entity’s operation may decrease and decentralisation may occur (Gomez-Mejia et al., 2010). The family business approach also has a positive impact on sustainability issues. P. Berrone, C. Cruz and L.R. Gomez-Mejia (2010) found that family-controlled businesses tend to pollute less in order to improve their image. Such actions are common, even when there is no apparent economic benefit. In addition, family firms are particularly concerned about their employees (Carrigan & Buckley, 2008; Teal et al., 2003), as well as their relationships with their customers, suppliers and other external stakeholders, as they are characterised by a high sensitivity to their external image (Micelotta & Raynard, 2011). It also determines a more outstanding commitment to corporate social responsibility (Craig & Dibrell, 2006; Dyer & Whetten, 2006). Family businesses are deeply rooted in their communities and often sponsor associations, charities, special events and local sports teams (Berrone et al., 2010).
For this reason, it was decided to verify socio-emotional wealth in the companies studied. For this purpose, the approach adopted was that of P. Berrone, C. Cruz and L.R. Gomez-Mejia (2012), which assumes the existence of five main dimensions of SEW, which were termed FIBER, after the English names of the dimensions. The first dimension relates to the control and influence of family members, as one of the key distinguishing characteristics of family firms is that the family exercises control over strategic decisions (Chua et al., 1999; Schulze et al., 2003). The second manifestation of SEW relates to the family’s identification with the firm due to the formation of special bonds that give rise to a unique identity in family firms (Berrone et al., 2010; Dyer & Whetten, 2006).
Another element is related to social ties since, through relationships, family firms are characterised by specific social capital (Coleman, 1990) and a sense of closeness and interpersonal solidarity (Uzzi, 2018). Interaction does not only take place between family members. The sense of belonging and identity with the company is often shared by non-family employees, which affects the stability and commitment to the company (Miller & Le Breton-Miller, 2005). The fourth dimension of SEW relates to emotional attachment, as shared experiences and past events shape actions, events and relationships in family businesses (Eddleston & Kellermanns, 2007; Tagiuri & Davis, 1996). Furthermore, the emotions that accompany the family influence the subject (Baron, 2008; Shepherd et al., 2009). The final element of socio-emotional wealth, i.e. the renewal of family ties through dynastic succession, refers to the desire to pass the business on to future generations (Zellweger et al., 2012; Zellweger & Astrachan, 2008). In family businesses, the desire to preserve the longevity of the entity implies longer time horizons in the decision-making process, as family members view the business as a long-term family investment (Berrone et al., 2010). The social-emotional richness scale used in the study was developed by P. Berrone, C. Cruz and L.R. Gomez-Mejia (2012) based on previous publications (Allen & Meyer, 1990; Carlock & Ward, 2001; Cruz et al., 2010; Klein et al., 2005; O’Reilly & Chatman, 1986).
2.1.2. Socio-Emotional Wealth and Family Firm’s Performance
Given the substantial economic significance of family firms and their pivotal role in driving national economic growth (Rachmawati et al., 2020), extensive scholarly attention has been directed toward examining their performance and associated determinants (Palalić & Smajić, 2021). Among the diverse factors influencing family firm performance—such as gender composition, entrepreneurial orientation, and managerial practices—socioemotional wealth (SEW) emerges as a particularly critical variable. Under the premise of SEW preservation, decision-makers often prioritize non-financial objectives, accepting suboptimal economic outcomes to safeguard SEW (Gómez-Mejía et al., 2007; King et al., 2022). According to SEW theory, SEW’s gains and losses will be considered a chief reference factor when family members make decisions (Wu, 2018). However, empirical research suggests that SEW functions as a dual-edged construct, simultaneously serving as an asset and a liability depending on contextual factors (Kellermanns et al., 2012; Naldi et al., 2013). Specific dimensions of SEW may constrain firm performance, while others can enhance it (Miller & Le Breton-Miller, 2014; Razzak & Jassem, 2019). For instance, P.Y. Ng, M. Dayan and A. Di Benedetto (2019) demonstrated that while SEW strengthens employment relationships and financial performance in family firms within industrial districts, it may impede entrepreneurial dynamism and performance in publicly listed family enterprises. Prior studies have documented the positive performance implications of SEW (Barros et al., 2017; Davila et al., 2023; Lasio et al., 2024; Razzak et al., 2019; Razzak & Jassem, 2019), though its effects are nuanced. Specifically, Ng et al. (2019) found that family control and influence, social capital, and intergenerational continuity directly improve return on assets (ROA). In contrast, these dimensions exhibit mixed effects when mediated by managerial capabilities—family control becomes insignificant, and family member identification exerts a negative impact. Family firms demonstrate distinct behavioural patterns in uncertain environments, exhibiting both resilience to adversity and heightened vulnerability to performance declines relative to non-family enterprises (Minichilli et al., 2016). This paradox stems from their prioritization of socioemotional wealth (SEW) preservation and organizational continuity, even when such priorities conflict with financial optimization (Berrone et al., 2012). Chrisman and Patel (2012) further established that family owners intensify their focus on firm sustainability when actual performance falls below aspirations. However, family firms’ risk orientation is not uniformly conservative but varies systematically with the nature of encountered risks (Wu, 2018). According to P. Berrone, C. Cruz and L.R. Gomez-Mejia (2012), firms should establish a threshold for their performance, as suggested by D.R. Detienne, F. E. Chirico (2013). Because the firm is the source of SEW, decision-makers establish or accept a threshold performance beyond which the firm may be willing to incur venturing risk and act proactively and innovatively to save the firm instead of dissolving it. To resume, the evidence underscores the contingent nature of SEW’s influence, necessitating further contextual and mechanistic analysis to elucidate its role in family firm performance.
2.2. The Essence of Selected Machine Learning Algorithms
Machine learning (ML) is a field of artificial intelligence that enables computers to acquire knowledge independently through data analysis without the need for direct programming (Ling, 2023). It is an interdisciplinary research area combining statistical, probabilistic, and algorithmic methods to automatically detect patterns and make data-based decisions (Ray, 2019). Depending on the learning approach, ML models are divided into three main categories: supervised learning, unsupervised learning, and reinforcement learning (Nowak, 2024). Each of these types encompasses a wide range of algorithms tailored to various types of problems. Supervised learning uses labeled datasets to train predictive models such as linear regression, decision trees, or neural networks (Mahesh, 2020). Unsupervised learning, which analyzes patterns in unlabeled data, includes techniques such as clustering and dimensionality reduction algorithms. Reinforcement learning involves optimizing action strategies in a dynamic environment through rewards and penalties, finding application in control systems and computer games (Kawahara, 2020). Each of these methods has broad applications in data analysis, image recognition, and natural language processing (Dhall et al., 2020). This section of the article will present the mathematical formulations of selected machine learning algorithms—specifically those employed in the empirical part.
The first algorithm discussed is the Naive Bayes classifier. The Naive Bayes classifier is a probabilistic machine learning algorithm based on Bayes’ theorem, which assumes mutual independence of input features. Despite this simplification, it often achieves high accuracy in classification tasks, particularly in text analysis and spam filtering, due to its computational efficiency and ability to handle large datasets (Zhang & Gao, 2013). Assuming a training set , where and y, the Bayes classifier calculates the conditional probability of a class:
In the case of the Naive Bayes classifier, we assume the conditional independence of features:
Classification is performed according to the maximum a posteriori (MAP) principle:
In practice, and are estimated based on the training data, for example, as relative frequencies (for discrete features) or by fitting distributions (e.g., Gaussian for continuous features).
Another popular machine learning algorithm is the linear support vector machine (SVM). The linear support vector machine (SVM-LIN) is a machine learning algorithm that finds a hyperplane maximizing the margin between classes in the feature space, which enables effective data separation. Due to its generalization capability and robustness to high-dimensional data, it is widely used in text classification, bioinformatics, and problems involving linearly separable data (Murty & Raghava, 2016). For a training set ,, where and , the linear SVM finds a separating hyperplane , by solving:
Subject to the constraint:
This is therefore a quadratic programming (QP) optimization problem.
The nonlinear support vector machine also enjoys great popularity. The nonlinear support vector machine (SVM-RBF) is a machine learning algorithm that uses a kernel function (e.g., RBF – radial basis function) to map data into a higher-dimensional space, enabling effective separation of nonlinear patterns. Owing to its ability to model complex relationships, it is frequently used in image classification, bioinformatics, and anomaly detection (Liu et al., 2011). In the case of nonlinearly separable data, a kernel function is applied, which leads to a dual formulation of the solution:
subject to the constraints: ;
Classification of a new point x is performed by:
Linear SVM uses raw input features, whereas nonlinear SVM transforms data into a higher-dimensional space using a kernel function. Another algorithm presented here is the decision tree. Due to their interpretability and ability to handle data of mixed types, decision trees are applied in medical diagnosis, risk analysis, and decision support systems (Abdulqader & Abdulazeez, 2023). Decision trees classify data by recursively partitioning the feature space into subsets. A node is split by selecting a feature j and a threshold τ so as to maximize a quality criterion, e.g., for classification, by minimizing the Gini impurity:
Minimizing the Gini impurity leads to selecting the split that best separates the classes. The splitting criterion for a given node S is:
A new point x is classified according to the majority class in the leaf node it reaches. A lower value of G(S) indicates a more homogeneous class distribution within the node, which is desirable in classification. A very popular machine learning mechanism is also the k-nn algorithm. The k-nn algorithm classifies a new observation x based on its k nearest neighbors in the training set . Due to its simplicity and effectiveness in detecting local patterns, it is frequently used in recommendation systems, image recognition, and anomaly detection (Najwaini et al., 2023). A key component of the algorithm is the distance metric. The most commonly used is the Euclidean metric:
The decision rule in the k-nn algorithm involves assigning the class that occurs most frequently among the k nearest neighbors:
Where is the set of the k nearest neighbors of point x, and 1() is the indicator function. The weighted version assigns greater importance to closer neighbors, for example by using the inverse of the distance as the weight. The final machine learning algorithm presented is logistic regression. Logistic regression is a machine learning algorithm used for binary classification, which models the probability of class membership using the sigmoid function. Due to its interpretability and effectiveness in analyzing linearly separable data, it is widely used in medicine, economics, and fraud detection (Sailusha et al., 2020). For binary classification , the logistic regression model describes the probability of belonging to class using the sigmoid function:
We maximize the log-likelihood function:
which leads to an optimization solution, typically obtained using the gradient method.
3. Materials and Methods
3.1. Sample and Sampling Procedure
Primary data were collected from 4 May to 18 August using computer-assisted telephone interviews (CATI) and computer-assisted web Interviews (CAWI) techniques. The sample encompasses Polish private family firms. Business entities were included in the sample based on self-definition as family firms (Zajkowski & Życzyński, 2014). Such an approach is frequently adopted in family business research as suitable for examining the uniqueness of these firms (Domańska et al., 2023; Gallo et al., 2004; Zajkowski & Żukowska, 2020; Zellweger et al., 2012; Żukowska et al., 2021). It also aligns with Thomas’s theorem, which states, “If men define situations as real, they are real in their consequences” (Bornmann & Marx, 2020). Hence, it is assumed that if an entrepreneur or entrepreneurs consider their company a family business, they manage it in a manner typical for this group of entities. To the sample, exclusive partnerships and capital companies were included. In businesses established in these legal forms, companies’ assets are separated from the family’s assets, isolating the family’s actual impact on entrepreneurship equity (Żukowska et al., 2021). To collect the final sample, 13,696 contacts with family businesses were initially triggered. During data collection,13,055 family firms refused participation, and 41 resigned after starting questionnaire fulfilment. A total of 600 surveys were completed, which resulted in an initial response rate of 4.38%. After reducing non-completely filled questionnaires and incorrect responses, the sample totalled 365 items, transferring to the final response rate of 2.66%. A low response rate could be a potential reason for non-response bias (Hudson et al., 2004). A sample was divided into early and late responses, and t-tests were employed to prove it. Tests did not show significant differences; therefore, non-response bias was not a subject of the sample (Groves, 2006).
The youngest of the surveyed family companies had been operating on the market for 2 years, and the oldest company was 141 years old. The average age was just almost 22 years (SD=15.4 n=365). Average employment in surveyed family firms counted 55 persons in total, and 19 females. On average, 3 family members were engaged in business, and 1 female was isolated. Most frequently surveyed family businesses represent the services sector (n=263, 37%), industry declared 58 businesses (16%), and trade 47 (13%). In the sample, 54 (15%) entities operate as trade and services, and 69 (19%) are declared a mix of service, trade and industry. Considering the legal form of family firms, mostly there were LLC 240 (66%) and various forms of partnerships 83 (23%). Only 18 (5%) were companies and listed companies, and 21 (6%) declared other legal forms under the Polis legal regulations.
3.2. Variables and Measurement Scales
3.2.1. Measurement of Socioemotional Wealth
The socioemotional wealth of family firms was measured by employing a scale proposed by P. Berrone, C. Cruz and L.R. Gomez-Mejia (2012) which assumes the existence of five main dimensions of SEW, referred to as FIBER. The scale is composed of 27 items divided into 5 groups as follows: Family Control and Influence, Identification of Family Members with the Firm, Binding Social Ties, Emotional Attachment of Family Members and Renewal of Family Bonds Through Dynastic Succession (detailed list of items see Appendix A.1). The scale was used to directly in the studies (Barros et al., 2017; Filser et al., 2018; Gast et al., 2018; Laffranchini et al., 2020; Lasio et al., 2024; Razzak et al., 2019) while some authors extracted given components to analyze e.g. family commitment (Razzak & Jassem, 2019), innovativeness context (Lazzarotti et al., 2020), succession intention (Ine et al., 2019) or managerial capabilities (Ng et al., 2019). It was also the subject evaluation in several studies (Gerken et al., 2022; Hauck et al., 2016; Kallmuenzer et al., 2018; Ng et al., 2019). Due to the variety of SEW measurement and assessment approaches, this paper employs the proposed initial scale (Berrone et al., 2012). Family member owner-managers responded to statements describing their firm’s SEW using a five-point Likert-type scale ranging from 1 (strongly disagree) to 5 (strongly agree).
3.2.2. Measurement of Family Firms Performance
There are a variety of approaches how to measuring business performance (Laitinen & Chong, 2006; Zajkowski & Domańska, 2019). With M. Orlitzky, F. Schmidt and S. Rynes (2003), corporate finance performance can be assessed through the market, accounting and survey measurement. The first refers to the satisfaction of the shareholders, the second is connected with the company’s internal efficiency, and the third is based on a subjective estimation of financial performance that refers to as part of a broader definition of performance (Wallace et al., 2019). In this paper, the family firms’ performance was measured through self-rating, i.e. respondents assessed whether they were worse or better than competitors. This approach is supported by previous studies that demonstrated the usefulness of subjective performance assessment in studies on family businesses (Alonso-Dos-Santos & Llanos-Contreras, 2019; Hernández-Linares et al., 2019; Ng et al., 2019; Utherford et al., 2008). Additionally, there is a strong correlation between objective and subjective performance measures (Ling & Kellermanns, 2010). In addition, it is suggested that an assessment of the company’s performance be used compared to competitors, which provides a better insight into the company’s situation (Stenholm et al., 2019).
The scale of performance measurement was adopted by (Hernández-Linares et al., 2019; Santos & Brito, 2012) that consists of 12 items (see Appendix A.2). The items were split into two groups that were labelled as ‘hard performance’ (items 1-7) and ‘soft performance’ (items 8-12) employing principal components analysis (PCA) with promax rotation with Kaiser Normalization (Dean, 2009) (see Appendix A.3).
3.2.3. Controls
To isolate potential indirect effects, the set of control variables was implemented to analyses encompassing the percentage of family shares in equity capital, generations of family members in shareholders, total board members, total family members on board, CEO family member, CEO gender, generations of family members on board, number of females in a board, business age, total employment, number of female employments, employment of family members, employment of family female.
3.3. Methods
The method aims to determine which of the dependent variables—namely, the variables concerning the self-assessment of the economic situation (both hard and soft) of family businesses—are effectively explained by the independent variables, i.e., the SEW (socioemotional wealth) dimensions (a set of 29 indicators) of family businesses. It is assumed that effective explanation will be considered to occur when at least 75% of the explanation is achieved, defined as the average accuracy metric value across one hundred training models.
Step 1. Dataset Development
In this methodological step, a database must be constructed containing, first, the SEW (socioemotional wealth) dimensions, which include indicators related to family control and influence over management, family identification with the firm, social ties and relationships within the family firm, the family’s emotional attachment, and dynastic succession for a set of family businesses. Second, indicators of self-assessment of the economic situation of the family business are included, divided into so-called “hard” factors (return on capital, asset profitability, sales profitability, increase in sales, liquidity, size of investment activity, market share) and “soft” factors (product/service quality, development of new products/services, ability to attract and retain key employees, customer satisfaction, increased competitive position). It is assumed that the compiled database should include data from no fewer than 100 family businesses.
Step 2. Specification of Applied Machine Learning Algorithms
In the second step of the presented method, a set of algorithms to be used in the machine learning process must be specified. Among the considered algorithms may be, for example, the Naive Bayes classifier, linear and nonlinear support vector machines, decision trees, the k-NN algorithm, logistic regression, or others. These algorithms will be applied in the training process of various dimensions of the self-assessment of the economic situation of family businesses, encompassing both its soft and hard aspects.
Step 3. Implementation of Selected Machine Learning Algorithms
Dividing the dataset into training and test sets is a crucial stage in the machine learning process, aimed at evaluating the model’s performance (Joseph, 2022). This involves splitting the available data into two subsets (Tan et al., 2021):
- -
- training set – used for training the model, i.e., adjusting the model parameters in such a way that it best reflects the relationships in the data.
- -
- test set – used to evaluate the model’s performance on data not seen during training, allowing assessment of its generalization ability and helping to avoid the problem of overfitting.
Typically, the dataset is randomly split, with the test set constituting less than one-third of the entire dataset. During this stage, machine learning models are trained on specifically assigned datasets using algorithms suited to each method. The primary aim is to ensure the best possible adaptation to the training data while adhering to predefined hyperparameter settings. As the models process the data, they identify underlying structures and dependencies. Their performance is then tested on a separate dataset to evaluate their accuracy on previously unseen data. To further verify their ability to handle new examples, an independent validation dataset is used. This assessment phase is critical for understanding how well the models generalize beyond their training environment. Various evaluation metrics exist for measuring classification performance (Turri et al., 2020), with accuracy being among the most frequently employed, as shown in formula (1) (Nowak & Pawłowska-Nowak, 2024).
Where:
- -
- Accuracy – accuracy of the machine learning model,
- -
- TP – True Positives (value correctly classified as True),
- -
- FP – False Positives (value not correctly classified as True),
- -
- TN – True Negatives (value correctly classified as False),
- -
- FN – False Negatives (value not correctly classified as False).
Step 4. Selecting the Most Effective Machine Learning Model
The final step of the methodology focuses on evaluating multiple machine learning algorithms to identify the one that yields the highest performance. The most frequently used metric for this assessment is accuracy, as it provides a clear measure of how well the model generalizes to new data. If the chosen model does not meet the predefined performance criteria, such as achieving at least 70% accuracy, additional refinements may be necessary. One common approach to improving model performance is hyperparameter tuning, which involves systematically adjusting key settings to enhance predictive accuracy. This process can be facilitated by machine learning frameworks like scikit-learn, which offer tools for automated optimization. In some cases, if tuning does not lead to sufficient improvement, alternative techniques such as feature engineering or selecting a more complex model may be considered. The goal of this step is to ensure that the final model is not only accurate but also robust and reliable for real-world applications.
4. Results
Step 1. Dataset Development
The detailed methodology for assembling the machine learning database is presented in Section 3.1 and Section 3.2. The variables describing these enterprises can be divided into the following categories:
-
Control Variables:
- -
- Percentage of capital owned directly or indirectly by the entrepreneur’s family
- -
- Generation of the family that owns shares in the company
- -
- Board members – total
- -
- Board members – family members
- -
- Board members – non-family members
- -
- Board members – females
- -
- CEO gender
- -
- CEO is a family member
- -
- Generation of the family on the board
- -
- Age of the business entity
- -
- Total employment
- -
- Employment – female
- -
- Employment – family members
- -
- Employment – female family members
-
SEW Dimensions (Socioemotional Wealth):
- -
- Family control and influence – 5 indicators
- -
- Family identification with the firm – 7 indicators
- -
- Social ties and relationships – 5 indicators
- -
- Emotional attachment of the family – 6 indicators
- -
- Dynastic succession – 6 indicators
-
Self-assessment of Economic Situation (Hard Factors):
- -
- Return on capital
- -
- Asset profitability
- -
- Sales profitability
- -
- Increase in sales
- -
- Liquidity
- -
- Size of investment activity
- -
- Market share
-
Self-assessment of Economic Situation (Soft Factors):
- -
- Product/service quality
- -
- Development of new products/services
- -
- Ability to attract and retain key employees
- -
- Customer satisfaction
- -
- Increased competitive position
Table 1 presents data for a sample family business from the compiled database.
The target learning model does not include the values of the control variables.
Step 2. Specification of Applied Machine Learning Algorithms
The following machine learning algorithms were applied in the study: Naive Bayes classifier, support vector machine—both linear and nonlinear, decision trees, the KNN algorithm, and logistic regression. Table 2 presents the key hyperparameters of the applied machine learning algorithms. It should be noted that the Naive Bayes classifier in scikit-learn does not have hyperparameters requiring tuning; its operation is based on the assumption of normally distributed features.
Step 3. Implementation of Selected Machine Learning Algorithms
The first stage of machine learning, regardless of the algorithm used, involves splitting the dataset into training and testing data. The initial dataset contained data from 498 family businesses. After removing records with at least one missing value, 365 records remained for further analysis. These were randomly split into a training set comprising 75% of the data and a testing set comprising 25%. The split was performed using the train_test_split function from the scikit-learn library in Python.
This random data splitting process was repeated iteratively one hundred times using the cross-validation mechanism. For each split, the training process was carried out using each of the algorithms: Naive Bayes classifier, Linear Support Vector Machine, Nonlinear Support Vector Machine, Decision Tree, K-Nearest Neighbors (KNN) algorithm, and Logistic Regression. For example, when the model label was defined as the factor “customer satisfaction” (y11), the machine learning process was performed 100 times for each learning model. Figure 1 presents histograms of the average accuracy metrics for the respective models.
The best-performing model in predicting the label “customer satisfaction” (y11) turned out to be the nonlinear Support Vector Machine, achieving an accuracy metric of 0.855 (with a mean standard deviation of 0.014). These results indicate that the label “customer satisfaction” (y11) is very well explained by the variables representing the SEW dimensions of family businesses when using the nonlinear Support Vector Machine model. The distribution of accuracy scores for individual models in explaining the sample label “customer satisfaction” (y11) is presented in Figure 2.
The box plot illustrates the accuracy distribution of various machine learning models in predicting the label y11, highlighting both the median and the variability of results. SVM-RBF, SVM-LIN, and Logistic Regression (LR) demonstrate the highest accuracy along with the lowest variability, indicating their stability and strong generalization capabilities. KNN achieves comparable performance but with greater dispersion. Decision Trees (DT) exhibit the highest variability and numerous outliers, which may suggest overfitting or sensitivity to data fluctuations. Naive Bayes (NB) shows the widest range of outcomes, with a lower mean accuracy compared to most models. SVM-RBF and SVM-LIN stand out as the most stable and efficient, while NB and DT appear less predictable and more prone to variability.
Step 4. Selecting the Most Effective Machine Learning Model
In Table 3, for each label, the machine learning model demonstrating the highest prediction accuracy is listed along with the standard deviation of the accuracy metric.
It turns out that the explanatory variables in the form of socioemotional wealth (SEW) dimensions of family businesses explain the hard factors of self-assessment of economic condition only to a negligible extent. This means that the level of identification of a family business with SEW factors does not enable the prediction of hard aspects of economic condition (self-assessment). However, in the case of soft factors, prediction is effective and justified to a certain extent. Three soft factors of self-assessed economic condition are very well explained by the socioemotional wealth dimensions of family businesses. The most accurately predicted is the customer satisfaction (with mean accuracy exceeding 0.85), followed by product/service quality (mean accuracy exceeding 0.84), and ability to attract and retain key employees (mean accuracy exceeding 0.76). The remaining soft factors of economic self-assessment are explained less effectively, with mean accuracy ranging from 0.67 to 0.71. Interestingly, all soft factors of economic self-assessment are better explained than all hard factors of economic self-assessment.
5. Discussion
As it is seesn, fife out of six best predictible outcomes of family firms are those of soft factores. It seems to go in line with the premise of SEW preservation which indicate that decision-makers often prioritize non-financial objectives, accepting suboptimal economic outcomes to safeguard SEW (Gómez-Mejía et al., 2007; King et al., 2022). The analyses conducted in this study facilitate the isolation of the predictive capacity of Socioemotional Wealth (SEW) concerning both tangible and intangible performance indicators. While the findings do not conclusively determine whether SEW functions as an enhancing or inhibiting factor, they provide insights suggesting its potential as a predictor of non-financial performance outcomes. This aligns with existing literature, which predominantly emphasises the positive influence of SEW on self-perceived dimensions of business success.
Customer satisfaction
Considering the different dimensions of SEW in family firms, it is observable that customer and business-customer relationships are one of several pivotal values of these businesses (Duran et al., 2015). From the prospect of family business specificity, new customers can be acquired through family relations (Debicki et al., 2016), family members care about the image projected to customers, suppliers, and the local community (Bauweraerts et al., 2022) and routinely develop relational trust with business partners (Palalić & Smajić, 2021) thanks to high-quality ties with financers, better customer service or brand identity (Minichilli et al., 2016). More generally, family firms benefit from positive word-of-mouth recommendations as well as closer connections to customers (Bargoni et al., 2023). Considering several SEW dimensions, it seems to be neutral values that could strongly impact customer satisfaction.
Product/service quality
Literature suggests that a family firm’s identity increases customer trust in the firm’s product offerings (Bargoni et al., 2023), and a positive reputation contributes to the signalling of commitment to offer adequate product quality (Alonso Dos Santos et al., 2022) or use family heritage to market products (Cleary et al., 2019). Chirico and Nordqvist (2010) studied how knowledge generates dynamic capabilities, driving business performance in terms of product innovation and strategic adaptation and facilitating a family business to be competitive in situations where it is necessary to react quickly.
Ability to attract and retain key employees
Family firms recognise the significance of social relationships for their existence and operations (Ramadani et al., 2018; Schmid & Sender, 2021). Therefore, the development of close and long-lasting relationships with the suppliers and employees that are not part of the family. Especially employees from outside are accepted and feel like family members (Palalić & Smajić, 2021) and earn adequately (Waldkirch, 2020). To resume, this SEW dimension has been manifested in family businesses’ fervent desire to engage, i.e. in human resource practices for employees (Christensen-Salem et al., 2021) and may strengthen employee relationships within the business (Ng et al., 2019).
Increased competitive position
Family firms presenting formidable reputations may strengthen their crucial competitive advantage, and critical stakeholders would be more inclined to trust highly respected family businesses than any other formal institution (Noor et al., 2020). Hence, family firms are interested in combining and managing SEW and economic dimensions to ensure competitive firm survival (Gomez-Mejia et al., 2023). As Lan (2025) stated, family-based brand identity does not directly influence firm performance; instead, family identity influences firm performance via the firm’s competitive orientation.
Development of new products/services
Some scholars have demonstrated that family firms tend to exhibit scepticism when it comes to investing in other companies and developing new products and processes (Hernández-Perlines et al., 2021). Nevertheless, many examples of family businesses are beacons of innovation in their respective industries, and their business-owning families appear to embrace an entrepreneurial mindset, as well as change and risk (Duran et al., 2015). It is transferred into new products and services, identifying new business opportunities that fasten time to new products and services commercialization (Barros et al., 2017). Through such behaviour, family firms achieve greater innovative output from their innovation input than non-family firms, suggesting that family firms do more with less (Block et al., 2023).
Given these findings, further empirical investigation is warranted to delineate the directionality of influence. In addition to conventional analytical methods such as structural equation modelling (SEM) and regression analysis, advanced simulations employing machine learning techniques may offer valuable insights into the mechanisms through which socioemotional wealth translates into organisational performance.
6. Conclusions
This study makes an important contribution to the literature on family businesses by integrating the concept of social-emotional wealth (SEW) with state-of-the-art supervised machine learning methods to assess the predictive power of soft and hard indicators of economic performance. In theoretical terms, the article makes two key contributions. Firstly, it operationalises the FIBER model (Berrone et al., 2012) within a quantitative predictive approach, which combines the qualitative theories of family entrepreneurship (Razzak & Jassem, 2019; Sharma et al., 2012) with a quantitative computational approach (Ray, 2019). Second, it presents a formalised methodology using machine learning algorithms to test the explanatory power of individual SEW dimensions, demonstrating mathematical tools’ potential to model complex social constructs in organisational settings.
On a practical level, the results of the study indicate that soft aspects of economic evaluation - such as customer satisfaction, product/service quality or the ability to attract and retain employees - are much better predicted by the SEW dimensions than traditional complex indicators such as return on capital or liquidity. It has important managerial implications, especially for family business owners who are driven not only by financial goals but also by emotional and social values. The results also suggest that stakeholders assessing the quality of family businesses should consider soft indicators as full-fledged performance measures, especially where the role of SEW is decisive.
This study also has implications for owners, boards and managers because the research results indicate the crucial role of SEW, which potentially impacts long-term family business performance. Our findings may spark a debate on how to use and strengthen this resource to adapt the company to the dynamically changing environment.
Nevertheless, several limitations of the study should be pointed out. The data was based on subjective assessments of family entrepreneurs in Poland, which may lead to a bias effect and limit the generalizability of the results to other cultural and institutional contexts. Although the algorithms used effectively capture nonlinear and high-dimensional relationships, they are sensitive to the quality and size of the sample. A sample of 365 family firms, although sufficient for exploratory analyses, may limit the complexity of the modelling and its external validation.
Further research should develop the approach presented, considering panel or time-series data, which would enable the analysis of dynamic changes in SEW and firm performance over time. It is also worth exploring unsupervised algorithms and ensemble models, which can reveal hidden patterns not visible in classical classification models. Extending the proposed methodology to non-family businesses would also allow for a comparative perspective and a deeper understanding of structural dissimilarities in determining firm efficiency.
These findings can be further explored to delineate the specific impact of Socioemotional Wealth (SEW) on family business performance. Identifying the factors that act as enhancers or constraints on performance may contribute to a deeper understanding of the distinctive characteristics of family enterprises.
In conclusion, this study provides an example of how mathematical machine-learning tools can be effectively applied to the quantitative modelling of abstract constructs in organisational behaviour while offering new avenues for both the theory and practice of family entrepreneurship research.
Data Availability Statement
The data that support the findings of this study are proprietary and are not publicly available due to commercial confidentiality and privacy restrictions on handling customer data. However, summarized or aggregated results are presented within the manuscript. For questions related to the data, please contact the corresponding author.
Acknowledgments
Data gathering was covered by the Ministry of Education and Science (Poland) within the project: Social responsibility of science - Popularisation of science and promotion of sport, no SONP/SN/548457/2022 (Robert Zajkowski). “Marketing, development, and quality in management sciences using quantitative and qualitative research in the context of strategic, processual, and organizational approaches” (0811/SBAD/1100) (Marcin Nowak).
Conflicts of Interest
The authors have no competing interests to declare that are relevant to the content of this article.
Appendix A
Appendix A.1. Scale of Socioemotional Wealth Measurement
Family Control And Influence
- The majority of the shares in my family business are owned by family members
- In my family business, family members exert control over the company’s strategic decisions
- In my family business, most executive positions are occupied by family members
- In my family business, non-family managers and directors are named by family members
- The board of directors is mainly composed of family members
- Preservation of family control and independence are important goals for my family business
Identification of Family Members with the Firm
- 7.
- Family members have a strong sense of belonging to my family business
- 8.
- Family members feel that the family business’s success is their own success
- 9.
- My family business has a great deal of personal meaning for family members
- 10.
- Being a member of the family business helps define who we are
- 11.
- Family members are proud to tell others that we are part of the family business
- 12.
- Customers often associate the family name with the family business’s products and services
Binding Social Ties
- 13.
- My family business is very active in promoting social activities at the community level
- 14.
- In my family business, non-family employees are treated as part of the family
- 15.
- In my family business, contractual relationships are mainly based on trust and norms of reciprocity
- 16.
- Building strong relationships with other institutions (i.e., other companies, professional associations, government agents, etc.) is important for my family business
- 17.
- Contracts with suppliers are based on enduring long-term relationships in my family business
- 18.
- Emotional Attachment of Family Members
- 19.
- Emotions and sentiments often affect decision-making processes in my family business
- 20.
- Protecting the welfare of family members is critical to us, apart from personal contributions to the business
- 21.
- In my family business, the emotional bonds between family members are very strong
- 22.
- In my family business, affective considerations are often as important as economic considerations
- 23.
- Strong emotional ties among family members help us maintain a positive self-concept
- 24.
- In my family business, family members feel warmth for each other
- 25.
- Renewal ff Family Bonds Through Dynastic Succession
- 26.
- Continuing the family legacy and tradition is an important goal for my family business
- 27.
- Family owners are less likely to evaluate their investment on a short-term basis
- 28.
- Family members would be unlikely to consider selling the family business
- 29.
- Successful business transfer to the next generation is an important goal for family members
Source: (Berrone et al., 2012).
Appendix A.2. Scale of Performance Measurement
- Return on capital
- Asset profitability
- Sales profitability
- Increase in sales
- Liquidity
- Size of investment activity
- Market share
- Product/service quality
- Development of new products/services
- Ability to attract and retain key employees
- Customer satisfaction
- Increased competitive position
Source: (Ketokivi & Schroeder, 2025; Williams et al., 2007)
Appendix A.3. Results of Principal Components Analysis (PCA) for Performance Items
| Items | Hard performance | Soft performance |
| Return on capital | 0.883 | 0.324 |
| Asset profitability | 0.881 | 0.364 |
| Sales profitability | 0.834 | 0.365 |
| Increase in sales | 0.67 | 0.553 |
| Liquidity | 0.686 | 0.477 |
| Size of investment activity | 0.645 | 0.493 |
| Market share | 0.629 | 0.576 |
| Product/service quality | 0.377 | 0.676 |
| Development of new products/services | 0.43 | 0.703 |
| Ability to attract and retain key employees | 0.374 | 0.713 |
| Customer satisfaction | 0.237 | 0.819 |
| Increased competitive position | 0.461 | 0.736 |
| Source: own elaboration | ||
References
- Abdulqader, H. A.; Abdulazeez, A. M. A Review on Decision Tree Algorithm in Healthcare Applications. Indonesian Journal of Computer Science 2023, 12(2), 284–301. [Google Scholar] [CrossRef]
- Allen, N. J.; Meyer, J. P. The measurement and antecedents of affective, continuance and normative commitment to the organization. Journal of Occupational Psychology 1990, 63(1), 1–18. [Google Scholar] [CrossRef]
- Alonso-Dos-Santos, M.; Llanos-Contreras, O. Family business performance in a post-disaster scenario: The influence of socioemotional wealth importance and entrepreneurial orientation. Journal of Business Research 2019, 101, 492–498. [Google Scholar] [CrossRef]
- Alonso Dos Santos, M.; Llanos Contreras, O.; Calabuig Moreno, F.; Augusto Felicio, J. Should a family firm communicate their family identity and country of origin? A cross-cultural study from Chile and Spain. International Journal of Emerging Markets 2022, 17(3), 725–746. [Google Scholar] [CrossRef]
- Bargoni, A.; Kliestik, T.; Jabeen, F.; Santoro, G. Family firms’ characteristics and consumer behaviour: An enquiry into millennials’ purchase intention in the online channel. Journal of Business Research 2023, 156, 113462. [Google Scholar] [CrossRef]
- Baron, R. A. The role of affect in the entrepreneurial process. Academy of Management Review 2008, 33(2), 328–340. [Google Scholar] [CrossRef]
- Barros, I.; Hernangómez, J.; Martin-Cruz, N. Familiness and socioemotional wealth in Spanish family firms: An empirical examination. European Journal of Family Business 2017, 7(1–2), 14–24. [Google Scholar] [CrossRef]
- Bauweraerts, J.; Rondi, E.; Rovelli, P.; De Massis, A.; Sciascia, S. Are family female directors catalysts of innovation in family small and medium enterprises? Strategic Entrepreneurship Journal 2022, 16(2). [Google Scholar] [CrossRef]
- Berrone, P.; Cruz, C.; Gomez-Mejia, L. R. Socioemotional Wealth in Family Firms: Theoretical Dimensions, Assessment Approaches, and Agenda for Future Research. Family Business Review 2012, 25(3), 258–279. [Google Scholar] [CrossRef]
- Berrone, P.; Cruz, C.; Gomez-Mejia, L. R.; Larraza-Kintana, M. Socioemotional wealth and corporate responses to institutional pressures: Do family-controlled firms pollute less? Administrative Science Quarterly 2010, 55(1), 82–113. [Google Scholar] [CrossRef]
- Block, J. H. How to Pay Nonfamily Managers in Large Family Firms: A Principal – Agent Model. Family Business Review 2011, 24(1), 9–27. [Google Scholar] [CrossRef]
- Block, J.; Hansen, C.; Steinmetz, H. Are Family Firms Doing More Innovation Output With Less Innovation Input? A Replication and Extension. Entrepreneurship Theory and Practice 2023, 47(4), 1496–1520. [Google Scholar] [CrossRef]
- Bornmann, L.; Marx, W. Thomas theorem in research evaluation. Scientometrics 2020, 123(1), 553–555. [Google Scholar] [CrossRef]
- Carlock, R.; Ward, J. Strategic planning for the family business: Parallel planning to unify the family and business; Springer, 2001. [Google Scholar]
- Carrigan, M.; Buckley, J. ‘What’s so special about family business?’ An exploratory study of UK and Irish consumer experiences of family businesses. International Journal of Consumer Studies 2008, 32(6), 656–666. [Google Scholar] [CrossRef]
- Chirico, F.; Nordqvist, M. Dynamic capabilities and transgenerational value creation in family firms. The role of organizational culture. International Small Business Journal 2010, 28(5), 487–504. [Google Scholar] [CrossRef]
- Chrisman, J. J.; Chua, J. H.; Pearson, A. W.; Barnett, T. Family Involvement, Family Influence, and Family-Centered Non-Economic Goals in Small Firms. Entrepreneurship: Theory and Practice 2012, 36(2), 267–293. [Google Scholar] [CrossRef]
- Chrisman, J. J.; Patel, P. C. Variations in R&D investments of family and nonfamily firms: Behavioral agency and myopic loss aversion perspectives. Academy of Management Journal 2012, 55(4), 976–997. [Google Scholar] [CrossRef]
- Christensen-Salem, A.; Mesquita, L. F.; Hashimoto, M.; Hom, P. W.; Gomez-Mejia, L. R. Family firms are indeed better places to work than non-family firms! Socioemotional wealth and employees’ perceived organizational caring. Journal of Family Business Strategy 2021, 12(1), 1–51. [Google Scholar] [CrossRef]
- Chua, J. H.; Chrisman, J. J.; Sharma, P. Defining the Family Business by Behavior. Entrepreneurship Theory and Practice 1999, 23(4), 19–39. [Google Scholar] [CrossRef]
- Chua, J. H.; Chrisman, J. J.; Sharma, P. Succession and Nonsuccession Concerns of Family Firms and Agency Relationship with Nonfamily Managers. Family Business Review 2003, 16(2), 89–108. [Google Scholar] [CrossRef]
- Chua, J. H.; Chrisman, J. J.; Steier, L. P.; Rau, S. B. Sources of Heterogeneity in Family Firms: An Introduction. Entrepreneurship: Theory and Practice 2012, 36(6), 1103–1113. [Google Scholar] [CrossRef]
- Cleary, P.; Quinn, M.; Moreno, A. Socioemotional wealth in family firms: A longitudinal content analysis of corporate disclosures. Journal of Family Business Strategy 2019, 10(2), 119–132. [Google Scholar] [CrossRef]
- Coleman, J. S. Foundations of Social Theory; Belknap Press of Harvard University Press, 1990. [Google Scholar]
- Craig, J.; Dibrell, C. The Natural Environment, Innovation, and Firm Performance: A Comparative Study. Family Business Review 2006, 19(4), 275–288. [Google Scholar] [CrossRef]
- Cruz, C. C.; Gómez-Mejia, L. R.; Becerra, M. Perceptions of benevolence and the design of agency contracts: CEO-TMT relationships in family firms. Academy of Management Journal 2010, 53(1), 69–89. [Google Scholar] [CrossRef]
- Davila, J.; Duran, P.; Gómez-Mejía, L.; Sanchez-Bueno, M. J. Socioemotional wealth and family firm performance: A meta-analytic integration. Journal of Family Business Strategy 2023, 14(2), 1–8. [Google Scholar] [CrossRef]
- Dean, J. Choosing the Right Type of Rotation in PCA and EFA. JALT Testing & Evaluation SIG Newsletter 2009, 13, 20–25. [Google Scholar]
- Debicki, B. J.; Kellermanns, F. W.; Chrisman, J. J.; Pearson, A. W.; Spencer, B. A. Development of a socioemotional wealth importance (SEWi) scale for family firm research. Journal of Family Business Strategy 2016, 7(1), 47–57. [Google Scholar] [CrossRef]
- Detienne, D. R.; Chirico, F. Exit strategies in family firms: How socioemotional wealth drives the threshold of performance. Entrepreneurship: Theory and Practice 2013, 37(6), 1297–1318. [Google Scholar] [CrossRef]
- Dhall, D.; Kaur, R.; Juneja, M. Machine learning: a review of the algorithms and its applications. In Proceedings of ICRIC 2019 Lecture Notes in Electrical Engineering; Singh, P., Kar, A., Singh, Y., Kolekar, M., Tanwar, S., Eds.; Springer, 2020; pp. 47–63. [Google Scholar] [CrossRef]
- Domańska, A.; Hernández-linares, R.; Zajkowski, R.; Żukowska, B. Family firm entrepreneurship and sustainability initiatives: Women as corporate change agents. Business Ethics, the Environment & Responsibility 2023, 33(2), 217–240. [Google Scholar] [CrossRef]
- Duran, P.; Kammerlander, N.; van Essen, M.; Zellweger, T. Doing More with Less: Innovation Input and Output in Family Firms. Academy of Management Journal 2015, 59(4), 1224–1264. [Google Scholar] [CrossRef]
- Dyer, G. W.; Whetten, D. A. Family firms and social responsibility: Preliminary evidence from the S & P 500. Entrepreneurship: Theory and Practice 2006, 30(6), 785–802. [Google Scholar] [CrossRef]
- Eddleston, K. A.; Kellermanns, F. W. Destructive and productive family relationships: A stewardship theory perspective. Journal of Business Venturing 2007, 22(4), 545–565. [Google Scholar] [CrossRef]
- European Commission. Overview of Family–Business–Relevant Issues: Research, Networks, Policy Measures and Existing Studies. In Enterprise and Industry Directorate-General (Issue November); 2009. [Google Scholar]
- Filser, M.; De Massis, A.; Gast, J.; Kraus, S. Tracing the Roots of Innovativeness in Family SMEs: The Effect of Family Functionality and Socioemotional Wealth. Journal of Product Innovation Management 2018, 35(4), 609–628. [Google Scholar] [CrossRef]
- Gallo, M. Á.; Tàpies, J.; Cappuyns, K. Comparison of Family and Nonfamily Business: Financial Logic and Personal Preferences. Family Business Review 2004, XVII(4), 303–318. [Google Scholar] [CrossRef]
- Gast, J.; Filser, M.; Rigtering, J. P. C.; Harms, R.; Kraus, S.; Chang, M. Socioemotional Wealth and Innovativeness in Small- and Medium-Sized Family Enterprises: A Configuration Approach. Journal of Small Business Management 2018, 56, 53–67. [Google Scholar] [CrossRef]
- Gerken, M.; Hülsbeck, M.; Ostermann, T.; Hack, A. Validating the FIBER scale to measure family firm heterogeneity – A replication study with extensions. Journal of Family Business Strategy 2022, 13(4), 100497. [Google Scholar] [CrossRef]
- Gomez-Mejia, L. R.; Welbourne, T. M.; Wiseman, R. M. The Role of Risk Sharing and Risk Taking Under Gainsharing. Academy of Management Review 2000, 25(3), 492–507. [Google Scholar] [CrossRef] [PubMed]
- Gómez-Mejía, L. R.; Haynes, K. T.; Núñez-Nickel, M.; Jacobson, K. J. L.; Moyano-Fuentes, J. Socioemotional wealth and business risks in family-controlled firms: Evidence from Spanish olive oil mills. Administrative Science Quarterly 2007, 52(1), 106–137. [Google Scholar] [CrossRef]
- Gomez-Mejia, L. R.; Makri, M.; Kintana, M. L. Diversification decisions in family-controlled firms. Journal of Management Studies 2010, 47(2), 223–252. [Google Scholar] [CrossRef]
- Gomez-Mejia, L. R.; Mendoza-Lopez, A.; Cruz, C.; Duran, P.; Aguinis, H. Socioemotional wealth in volatile, uncertain, complex, and ambiguous contexts: The case of family firms in Latin America and the Caribbean. Journal of Family Business Strategy 2023, 15(1), 100551. [Google Scholar] [CrossRef]
- Groves, R. M. Nonresponse Rates and Nonresponse Bias in Household Surveys. Public Opinion Quarterly 2006, 70(5), 646–675. [Google Scholar] [CrossRef]
- Hauck, J.; Suess-Reyes, J.; Beck, S.; Prügl, R.; Frank, H. Measuring socioemotional wealth in family-owned and -managed firms: A validation and short form of the FIBER Scale. Journal of Family Business Strategy 2016, 7(3), 133–148. [Google Scholar] [CrossRef]
- Hernández-Linares, R.; Kellermanns, F. W.; López-Fernández, M. C.; Sarkar, S. The effect of socioemotional wealth on the relationship between entrepreneurial orientation and family business performance. BRQ Business Research Quarterly 2019. [Google Scholar] [CrossRef]
- Hernández-Linares, R.; Sarkar, S.; Cobo, M. J. Inspecting the Achilles heel: a quantitative analysis of 50 years of family business definitions. Scientometrics 2018, 115(2), 929–951. [Google Scholar] [CrossRef]
- Hernández-Perlines, F.; Covin, J. G.; Ribeiro-Soriano, D. E. Entrepreneurial orientation, concern for socioemotional wealth preservation, and family firm performance. Journal of Business Research 2021, 126, 197–208. [Google Scholar] [CrossRef]
- Hudson, D.; Seah, L. H.; Hite, D.; Haab, T. Telephone presurveys, self-selection, and non-response bias to mail and Internet surveys in economic research. Applied Economics Letters 2004, 11(4), 237–240. [Google Scholar] [CrossRef]
- Ine, U.; Nadine, L.; Tensie, S. The influence of transgenerational succession intentions on the succession planning process: the moderatingrole of high-quality relationships. Journal of Family Business Strategy 2019, 12(2), 1–13. [Google Scholar] [CrossRef]
- Joseph, V. R. Optimal ratio for data splitting. Statistical Analysis and Data Mining 2022, 15(4), 531–538. [Google Scholar] [CrossRef]
- Kallmuenzer, A.; Strobl, A.; Peters, M. Tweaking the entrepreneurial orientation–performance relationship in family firms: the effect of control mechanisms and family-related goals. Review of Managerial Science 2018, 12(4), 855–883. [Google Scholar] [CrossRef]
- Kawahara, Y. Understanding the underlying algorithms and theories of machine learning. Impact 2020, 2020(2), 40–42. [Google Scholar] [CrossRef]
- Kellermanns, F. W.; Eddleston, K. A.; Zellweger, T. M. Extending the Socioemotional Wealth Perspective: A Look at the Dark Side. Entrepreneurship: Theory and Practice 2012, 36(6), 1175–1182. [Google Scholar] [CrossRef]
- Ketokivi, M. A.; Schroeder, R. G. Perceptual measures of performance: fact or fiction ? Journal of Operations Management 2025, 22(3), 1–7. [Google Scholar] [CrossRef]
- King, D. R.; Meglio, O.; Gomez-Mejia, L.; Bauer, F.; De Massis, A. Family Business Restructuring: A Review and Research Agenda. Journal of Management Studies 2022, 59(1), 197–235. [Google Scholar] [CrossRef]
- Klein, S. B.; Astrachan, J. H.; Smyrnios, K. X. The F-PEC scale of family influence: Construction, validation, and further implication for theory. Entrepreneurship: Theory and Practice 2005, 29(3), 321–339. [Google Scholar] [CrossRef]
- KPMG. European Family Business Trends. European Family Business Trends 2015, 1, 24. [Google Scholar]
- La Porta, R.; Lopez-de-Silanes, F.; Shleifer, A. Corporate ownership around the world. Journal of Finance 1999, 54(2), 471–517. [Google Scholar] [CrossRef]
- Laffranchini, G.; Hadjimarcou, J. S.; Kim, S. H. The Impact of Socioemotional Wealth on Decline-Stemming Strategies of Family Firms. Entrepreneurship Theory and Practice 2020, 44(2), 185–210. [Google Scholar] [CrossRef]
- Laitinen, E. K.; Chong, G. How do small companies measure their performance? Problems and Perspectives in Management 2006, 4(3), 49–68. [Google Scholar]
- Lan, Q. Understanding socioemotional wealth - examining SEW and its effect on internationalization; 2015; pp. 1–68. [Google Scholar]
- Lasio, V.; Rosso, J.; Alejandro, S. Entrepreneurial orientation and socioemotional wealth as enablers of the impact of digital transformation in family firms. Journal of Family Business Management 2024, 14(6), 1268–1294. [Google Scholar] [CrossRef]
- Lazzarotti, V.; Gjergji, R.; Visconti, F. Socio-emotional wealth and innovativeness in Italian family firms: what happens when the leader is a latest-generation member? International Journal of Entrepreneurship and Small Business 2020, 40(1), 54–82. [Google Scholar] [CrossRef]
- Ling, Q. Machine learning algorithms review. Applied and Computational Engineering 2023, 4(1), 91–98. [Google Scholar] [CrossRef]
- Ling, Y.; Kellermanns, F. W. The Effects of Family Firm Specific Sources of TMT Diversity: The Moderating Role of Information Exchange Frequency. Journal of Management S 2010, 47(2), 322–344. [Google Scholar] [CrossRef]
- Liu, Q.; Chen, C.; Zhang, Y.; Hu, Z. Feature selection for support vector machines with RBF kernel. Artificial Intelligence Review 2011, 36(2), 99–115. [Google Scholar] [CrossRef]
- Mahesh, B. Machine Learning Algorithms - A Review. International Journal of Science and Research (IJSR) 2020, 9(1), 381–386. [Google Scholar] [CrossRef]
- Mandl, I. Overview of Family Business Relevant Issues Contract No. 30-CE-0164021/00-51 Final Report; Austrian Institute for SME Research, 2008. [Google Scholar]
- Micelotta, E. R.; Raynard, M. Concealing or revealing the family?: Corporate brand identity strategies in family firms. Family Business Review 2011, 24(3), 197–216. [Google Scholar] [CrossRef]
- Miller, D.; Le Breton-Miller, I. Managing for the long run: Lessons in competitive advantage from great family businesses; Harvard Business Press, 2005. [Google Scholar]
- Miller, D.; Le Breton-Miller, I. Deconstructing socioemotional wealth. Entrepreneurship: Theory and Practice 2014, 38(4), 713–720. [Google Scholar] [CrossRef]
- Minichilli, A.; Brogi, M.; Calabrò, A. Weathering the Storm: Family Ownership, Governance, and Performance Through the Financial and Economic Crisis. Corporate Governance: An International Review 2016, 24(6), 552–568. [Google Scholar] [CrossRef]
- Murty, M. N.; Raghava, R. Linear Support Vector Machines. In Support Vector Machines and Perceptrons: Learning, Optimization, Classification, and Application to Social Networks; Springer, 2016; pp. 41–56. [Google Scholar] [CrossRef]
- Najwaini, E.; Tarigan, T. E.; Putra, F. P.; Sulistyowati. Application of the K-Nearest Neighbors (KNN) Algorithm on the Brain Tumor Dataset. International Journal of Artificial Intelligence in Medical Issues 2023, 1(1), 18–26. [Google Scholar] [CrossRef]
- Naldi, L.; Cennamo, C.; Guido, C.; Gomez-Mejia, L. Preserving Socioemotional Wealth in Family Firms: Asset or Liability? The Moderating Role of Business Context. Entrepreneurship: Theory and Practice 2013, 37(6), 1341–1360. [Google Scholar] [CrossRef]
- Neubaum, D. O.; Kammerlander, N.; Brigham, K. H. Capturing Family Firm Heterogeneity: How Taxonomies and Typologies Can Help the Field Move Forward. Family Business Review 2019, 32(2), 106–130. [Google Scholar] [CrossRef]
- Ng, P. Y.; Dayan, M.; Di Benedetto, A. Performance in family firm: influences of socioemotional wealth and managerial capabilities. Journal of Business Research 2019, 102, 178–190. [Google Scholar] [CrossRef]
- Noor, S.; Saeed, A.; Baloch, M. S.; Awais, M. CSR permanency, family ownership, and firm value: Evidence from emerging economies. Corporate Social Responsibility and Environmental Management 2020, 27(5), 2135–2149. [Google Scholar] [CrossRef]
- Nowak, M. Prediction of Voluntary Employee Turnover. Scientific Papers of Silesian University of Technology. Organization & Management 2024, 201. [Google Scholar] [CrossRef]
- Nowak, M.; Pawłowska-Nowak, M. Dynamic Pricing Method in the E-Commerce Industry Using Machine Learning. Applied Sciences 2024, 14(24), 11668. [Google Scholar] [CrossRef]
- O’Reilly, C. A.; Chatman, J. Organizational commitment and psychological attachment: The effects of compliance, identification, and internalization on prosocial behavior. Journal of Applied Psychology 1986, 71(3), 492. [Google Scholar] [CrossRef]
- Orlitzky, M.; Schmidt, F. L.; Rynes, S. L. Corporate social and financial performance: A meta-analysis. Organization Studies 2003, 24(3), 403–441. [Google Scholar] [CrossRef]
- Palalić, R.; Smajić, H. Socioemotional wealth (SEW) as the driver of business performance in family businesses in Bosnia and Herzegovina: the mediating role of transformational leadership. Journal of Family Business Management 2021. ahead-of-print. [Google Scholar] [CrossRef]
- Rachmawati, E.; Suliyanto; Suroso, A. Direct and indirect effect of entrepreneurial orientation, family involvement and gender on family business performance. Journal of Family Business Management 2020. [Google Scholar] [CrossRef]
- Ramadani, V.; Ademi, L.; Ratten, V.; Palalić, R.; Krueger, N. Knowledge creation and relationship marketing in family businesses: A case-study approach. Contributions to Management Science 2018. [Google Scholar] [CrossRef]
- Ray, S. A quick review of machine learning algorithms. In 2019 International Conference on Machine Learning, Big Data, Cloud and Parallel Computing (COMITCon); 2019; pp. 35–39. [Google Scholar] [CrossRef]
- Razzak, M. R.; Bakar, R. A.; Mustamil, N. Socioemotional wealth and family commitment. Journal of Family Business Management 2019, 9(4), 393–415. [Google Scholar] [CrossRef]
- Razzak, M. R.; Jassem, S. Socioemotional wealth and performance in private family firms. Journal of Family Business Management 2019, 9(4), 468–496. [Google Scholar] [CrossRef]
- Safin, K.; Zajkowski, R. Przedsiębiorstwa rodzinne w Polsce: stan i perspektywy rozwoju; C.H.Beck, 2021. [Google Scholar]
- Sailusha, R.; Gnaneswar, V.; Ramesh, R.; Rao, G. R. Credit card fraud detection using machine learning. In 2020 4th International Conference on Intelligent Computing and Control Systems (ICICCS); 2020; pp. 1264–1270. [Google Scholar] [CrossRef]
- Santos, J. B.; Brito, L. A. L. Toward a subjective measurement model for firm performance. BAR - Brazilian Administration Review 2012, 9, 95–117. [Google Scholar] [CrossRef]
- Schmid, A.; Sender, A. How social capital influences performance in family firms: the moderating role of nepotism. International Journal of Human Resource Management 2021, 32(18), 3973–3993. [Google Scholar] [CrossRef]
- Schulze, W. S.; Lubatkin, M. H.; Dino, R. N. Toward a theory of agency and altruism in family firms. Journal of Business Venturing 2003, 18(4), 473–490. [Google Scholar] [CrossRef]
- Sharma, P.; Chrisman, J. J.; Gersick, K. E. 25 Years of Family Business Review: Reflections on the Past and Perspectives for the Future; 2012. [Google Scholar] [CrossRef]
- Shepherd, D. A.; Wiklund, J.; Haynie, J. M. Moving forward: Balancing the financial and emotional costs of business failure. Journal of Business Venturing 2009, 24(2), 134–148. [Google Scholar] [CrossRef]
- Stenholm, P.; Pukkinen, T.; Heinonen, J. Firm Growth in Family Businesses — The Role of Entrepreneurial Orientation and the Entrepreneurial Activity. Journal of Small Business Management 2019, 54(2), 697–713. [Google Scholar] [CrossRef]
- Tagiuri, R.; Davis, J. A. Bivalent Attributes of the Family Firm. Family Business Review 1996, 9(2). [Google Scholar] [CrossRef]
- Tan, J.; Yang, J.; Wu, S.; Chen, G.; Zhao, J. A critical look at the current train/test split in machine learning. Arxiv 2021, arXiv:2106.04525. [Google Scholar] [CrossRef]
- Teal, E. J.; Upton, N.; Seaman, S. L. A comparative analysis of strategic marketing practices of high-growth US family and non-family firms. Journal of Developmental Entrepreneurship 2003, 8(2), 177–195. [Google Scholar]
- Turri, V.; Dzombak, R.; Heim, E.; Vanhoudnos, N.; Palat, J.; Sinha, A. Measuring AI Systems Beyond Accuracy. ArXiv 2020, arXiv:2204.04211. [Google Scholar] [CrossRef]
- Utherford, M. W.; Kuratko, D. F.; Holt, D. T. Examining the Link between “Familiness” and Performance: Can the F–PEC Untangle the Family Business Theory Jungle? Entrepreneurship Theory and Practice 2008, 32(6), 1089–1109. [Google Scholar] [CrossRef]
- Uzzi, B. Social structure and competition in interfirm networks: The paradox of embeddedness. In The sociology of economic life; Routledge, 2018; pp. 213–241. [Google Scholar]
- Villalonga, B.; Amit, R. How Do Family Ownership, Management, and Control Affect Firm Value? Journal of Financial Economics 2006, 80(2), 385–417. [Google Scholar] [CrossRef]
- Villalonga, B.; Amit, R. Family Control of Firms and Industries. Financial Management 2010, 39(3), 863–904. [Google Scholar] [CrossRef]
- Villalonga, B.; Amit, R.; Trujillo, M.-A.; Guzmán, A. Governance of Family Firms. Annual Review of Financial Economics 2015, 7(1), 635–654. [Google Scholar] [CrossRef]
- Waldkirch, M. Non-family CEOs in family firms: Spotting gaps and challenging assumptions for a future research agenda. Journal of Family Business Strategy 2020, 11(1), 100305. [Google Scholar] [CrossRef]
- Wallace, J. C.; Little, L. M.; Hill, A. D.; Ridge, J. W.; Wallace, J. C.; Little, L. M.; Hill, A. D.; Ceo, J. W. R.; Wallace, J. C.; Little, L. M.; Hill, A. D.; Ridge, J. W. CEO Regulatory Foci, Environmental Dynamism, and Small Firm Performance. Journal of Small Business Management 2019, 48, 580–604. [Google Scholar] [CrossRef]
- Williams, R.; Bertsch, B.; Van Der Wiele, A.; Van Iwaarden, J.; Dale, B.; Bertsch, B.; Van Der Wiele, A.; Van Iwaarden, J.; Dale, B. Self-Assessment Against Business Excellence Models: A Critiqueand Perspective. Total Quality Management & Business Excellence 2007, 17, 1287–1300. [Google Scholar] [CrossRef]
- Wiseman, R. M.; Gomez-Mejia, L. R. A Behavioral Agency Model of Managerial Risk Taking. The Academy of Management Review 1998, 23(1), 133–153. [Google Scholar] [CrossRef] [PubMed]
- Wu, J. The Theoretical Framework and Application Frontier of Socioemotional Wealth Theory: A Literature Review from the Perspective of Family Firm. Modern Economy 2018, 09(01), 190–202. [Google Scholar] [CrossRef]
- Zajkowski, R.; Domańska, A. The Directions of Interrelations Between the Company’s Performance and Corporate Social Responsibility (CSR) Activities. Acta Universitatis Lodziensis. Folia Oeconomica 2019, 4(343), 211–233. [Google Scholar] [CrossRef]
- Zajkowski, R.; Żukowska, B. Family Businesses during the COVID-19 Crisis – Evidence from Poland. Annales Universitatis Mariae Curie-Skłodowska, Sectio H – Oeconomia 2020, 54(3), 101–116. [Google Scholar] [CrossRef]
- Zajkowski, R.; Życzyński, N. Percepcja a rzeczywiste wyróżniki przedsiębiorstw rodzinnych. Economics and Management 2014, 6(3), 236–247. [Google Scholar] [CrossRef]
- Zellweger, T. M.; Astrachan, J. H. On the Emotional Value of Owning a Firm. Family Business Review 2008, 21(4), 347–363. [Google Scholar] [CrossRef]
- Zellweger, T. M.; Kellermanns, F. W.; Chrisman, J. J.; Chua, J. H. Family control and family firm valuation by family CEOs: The importance of intentions for transgenerational control. Organization Science 2012, 23(3), 851–868. [Google Scholar] [CrossRef]
- Zhang, W.; Gao, F. Performance analysis and improvement of naïve Bayes in text classification application. IEEE Conference Anthology 2013, 1–4. [Google Scholar] [CrossRef]
- Żukowska, B.; Martyniuk, O.; Zajkowski, R. Mobilisation of survivability capital – family firm response to the coronavirus crisis. International Journal of Entrepreneurial Behavior & Research 2021, 27(9), 48–81. [Google Scholar] [CrossRef]
Figure 1.
Histograms of Machine Learning Models for the Label “Customer Satisfaction” (y11).
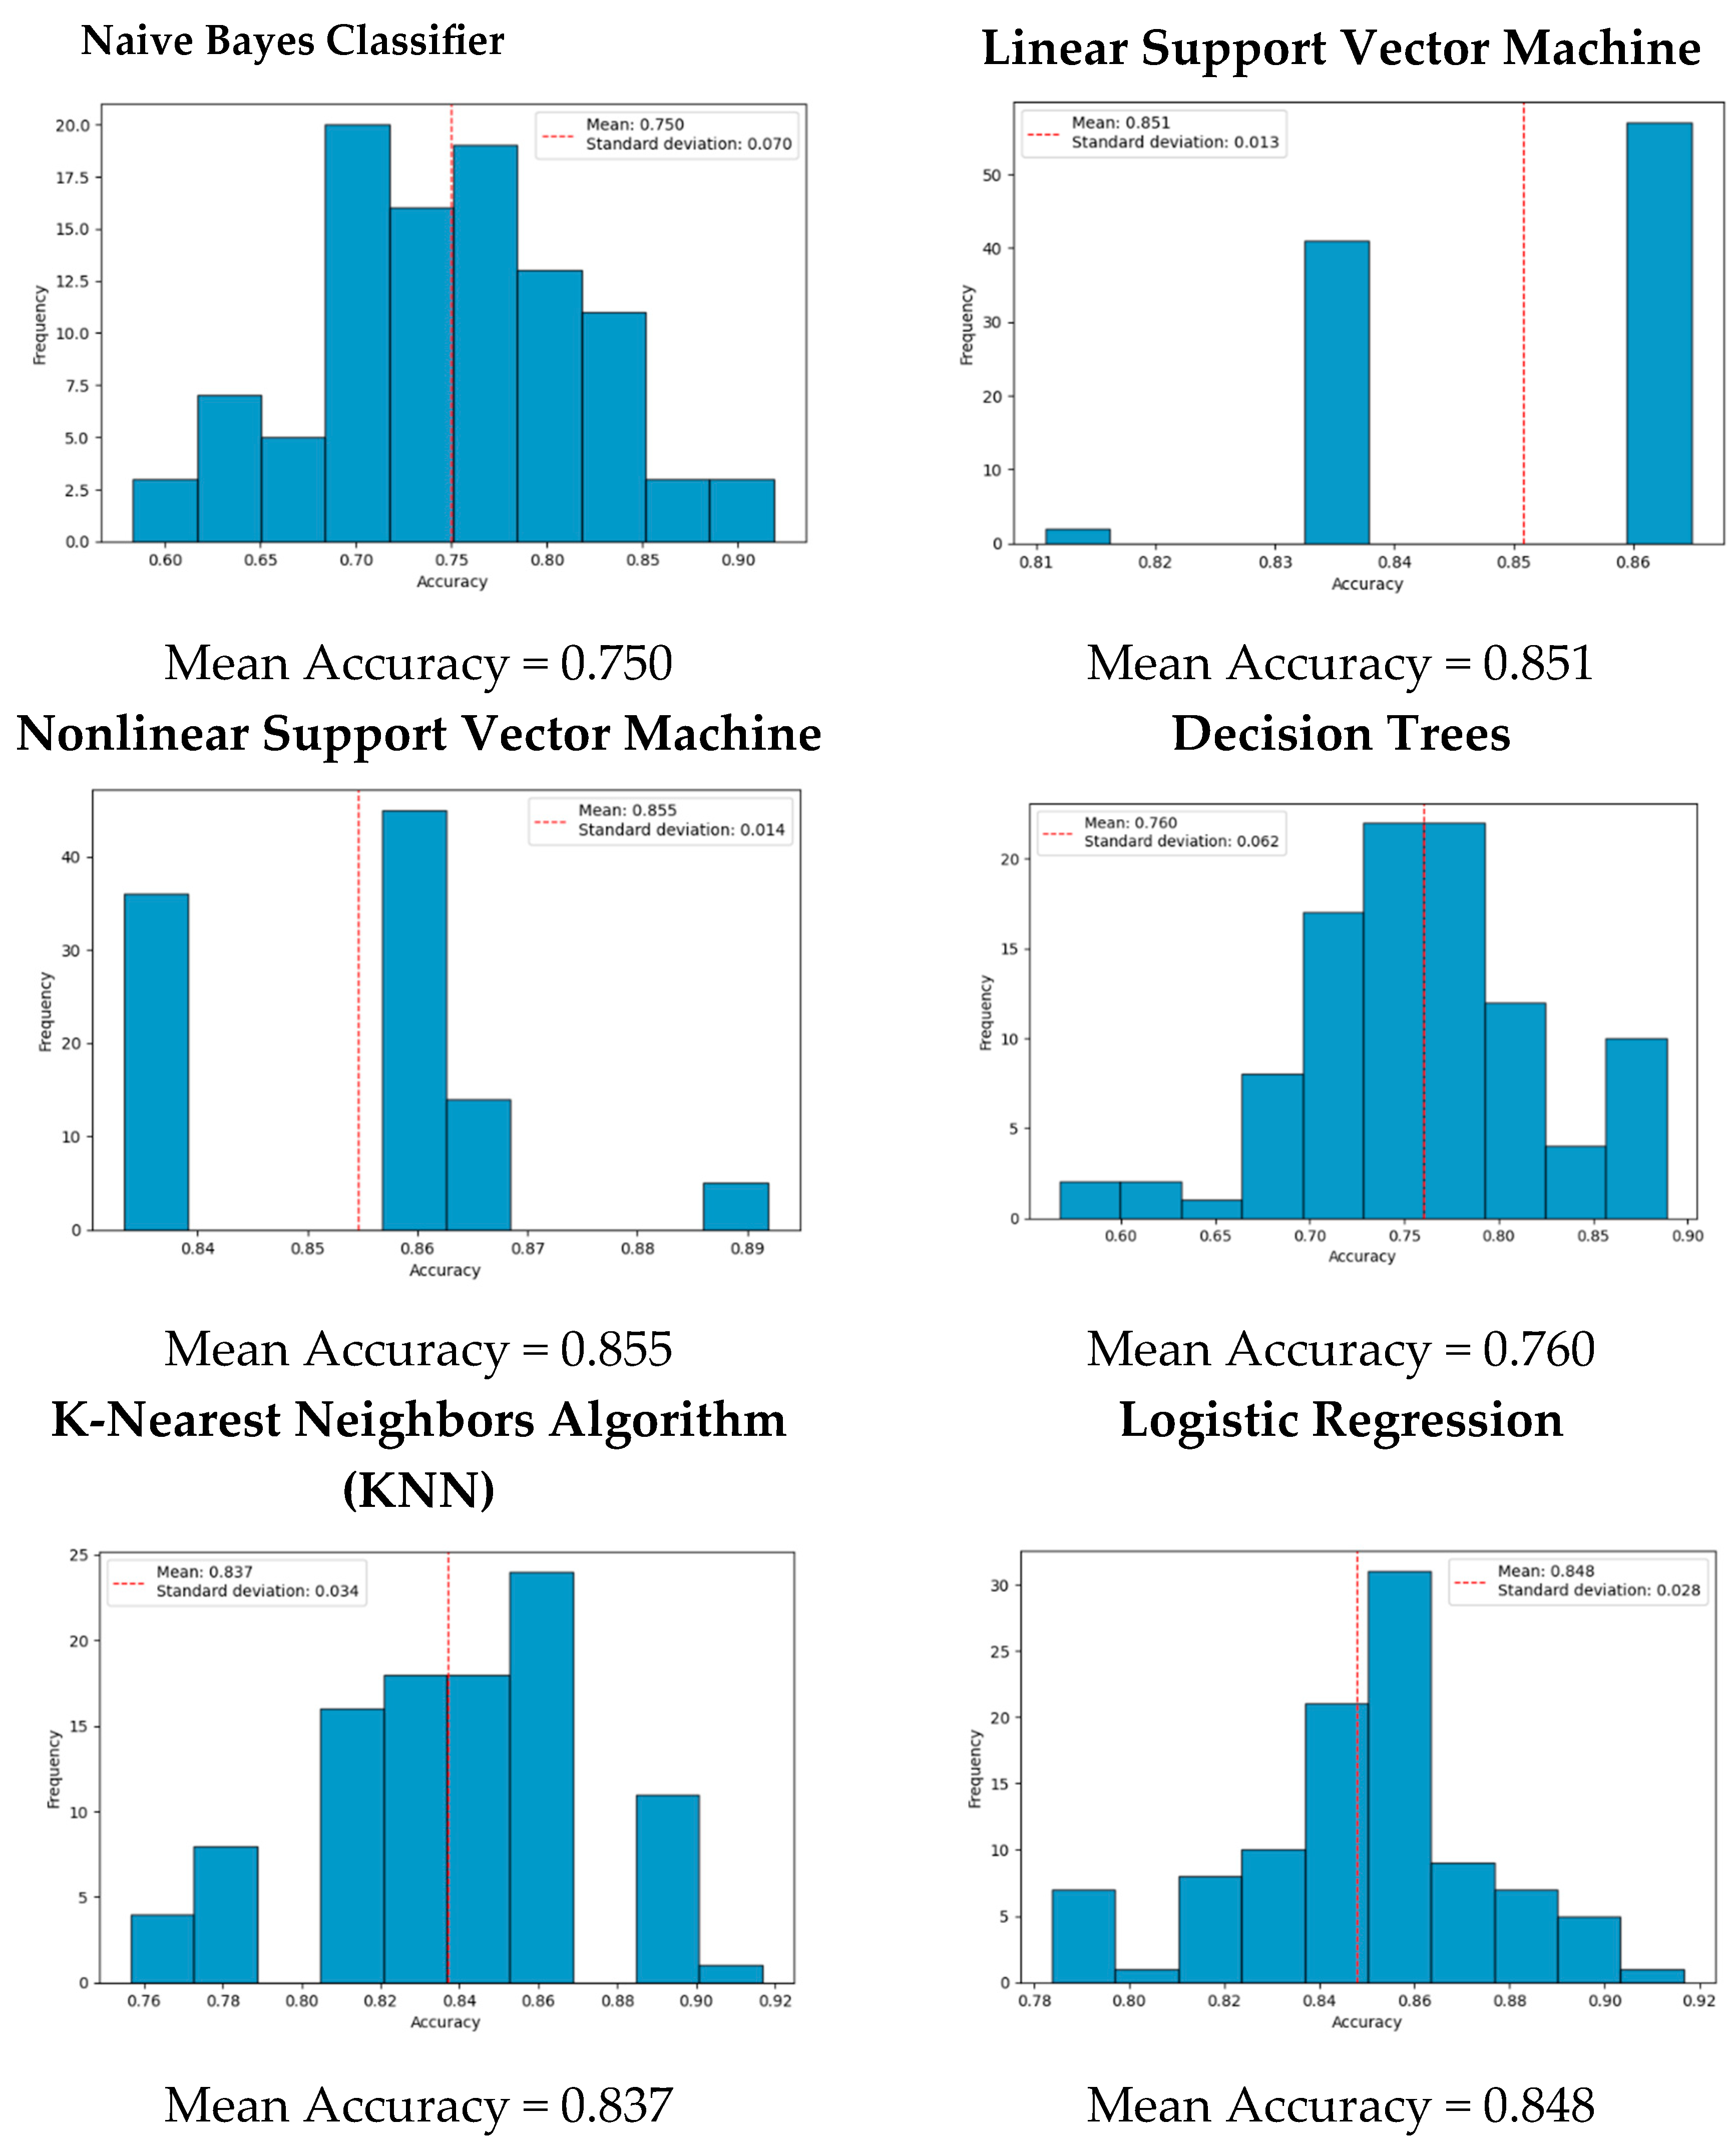
Figure 2.
Accuracy Distribution of Applied Machine Learning Models in Predicting the Sample Label y11.
Figure 2.
Accuracy Distribution of Applied Machine Learning Models in Predicting the Sample Label y11.
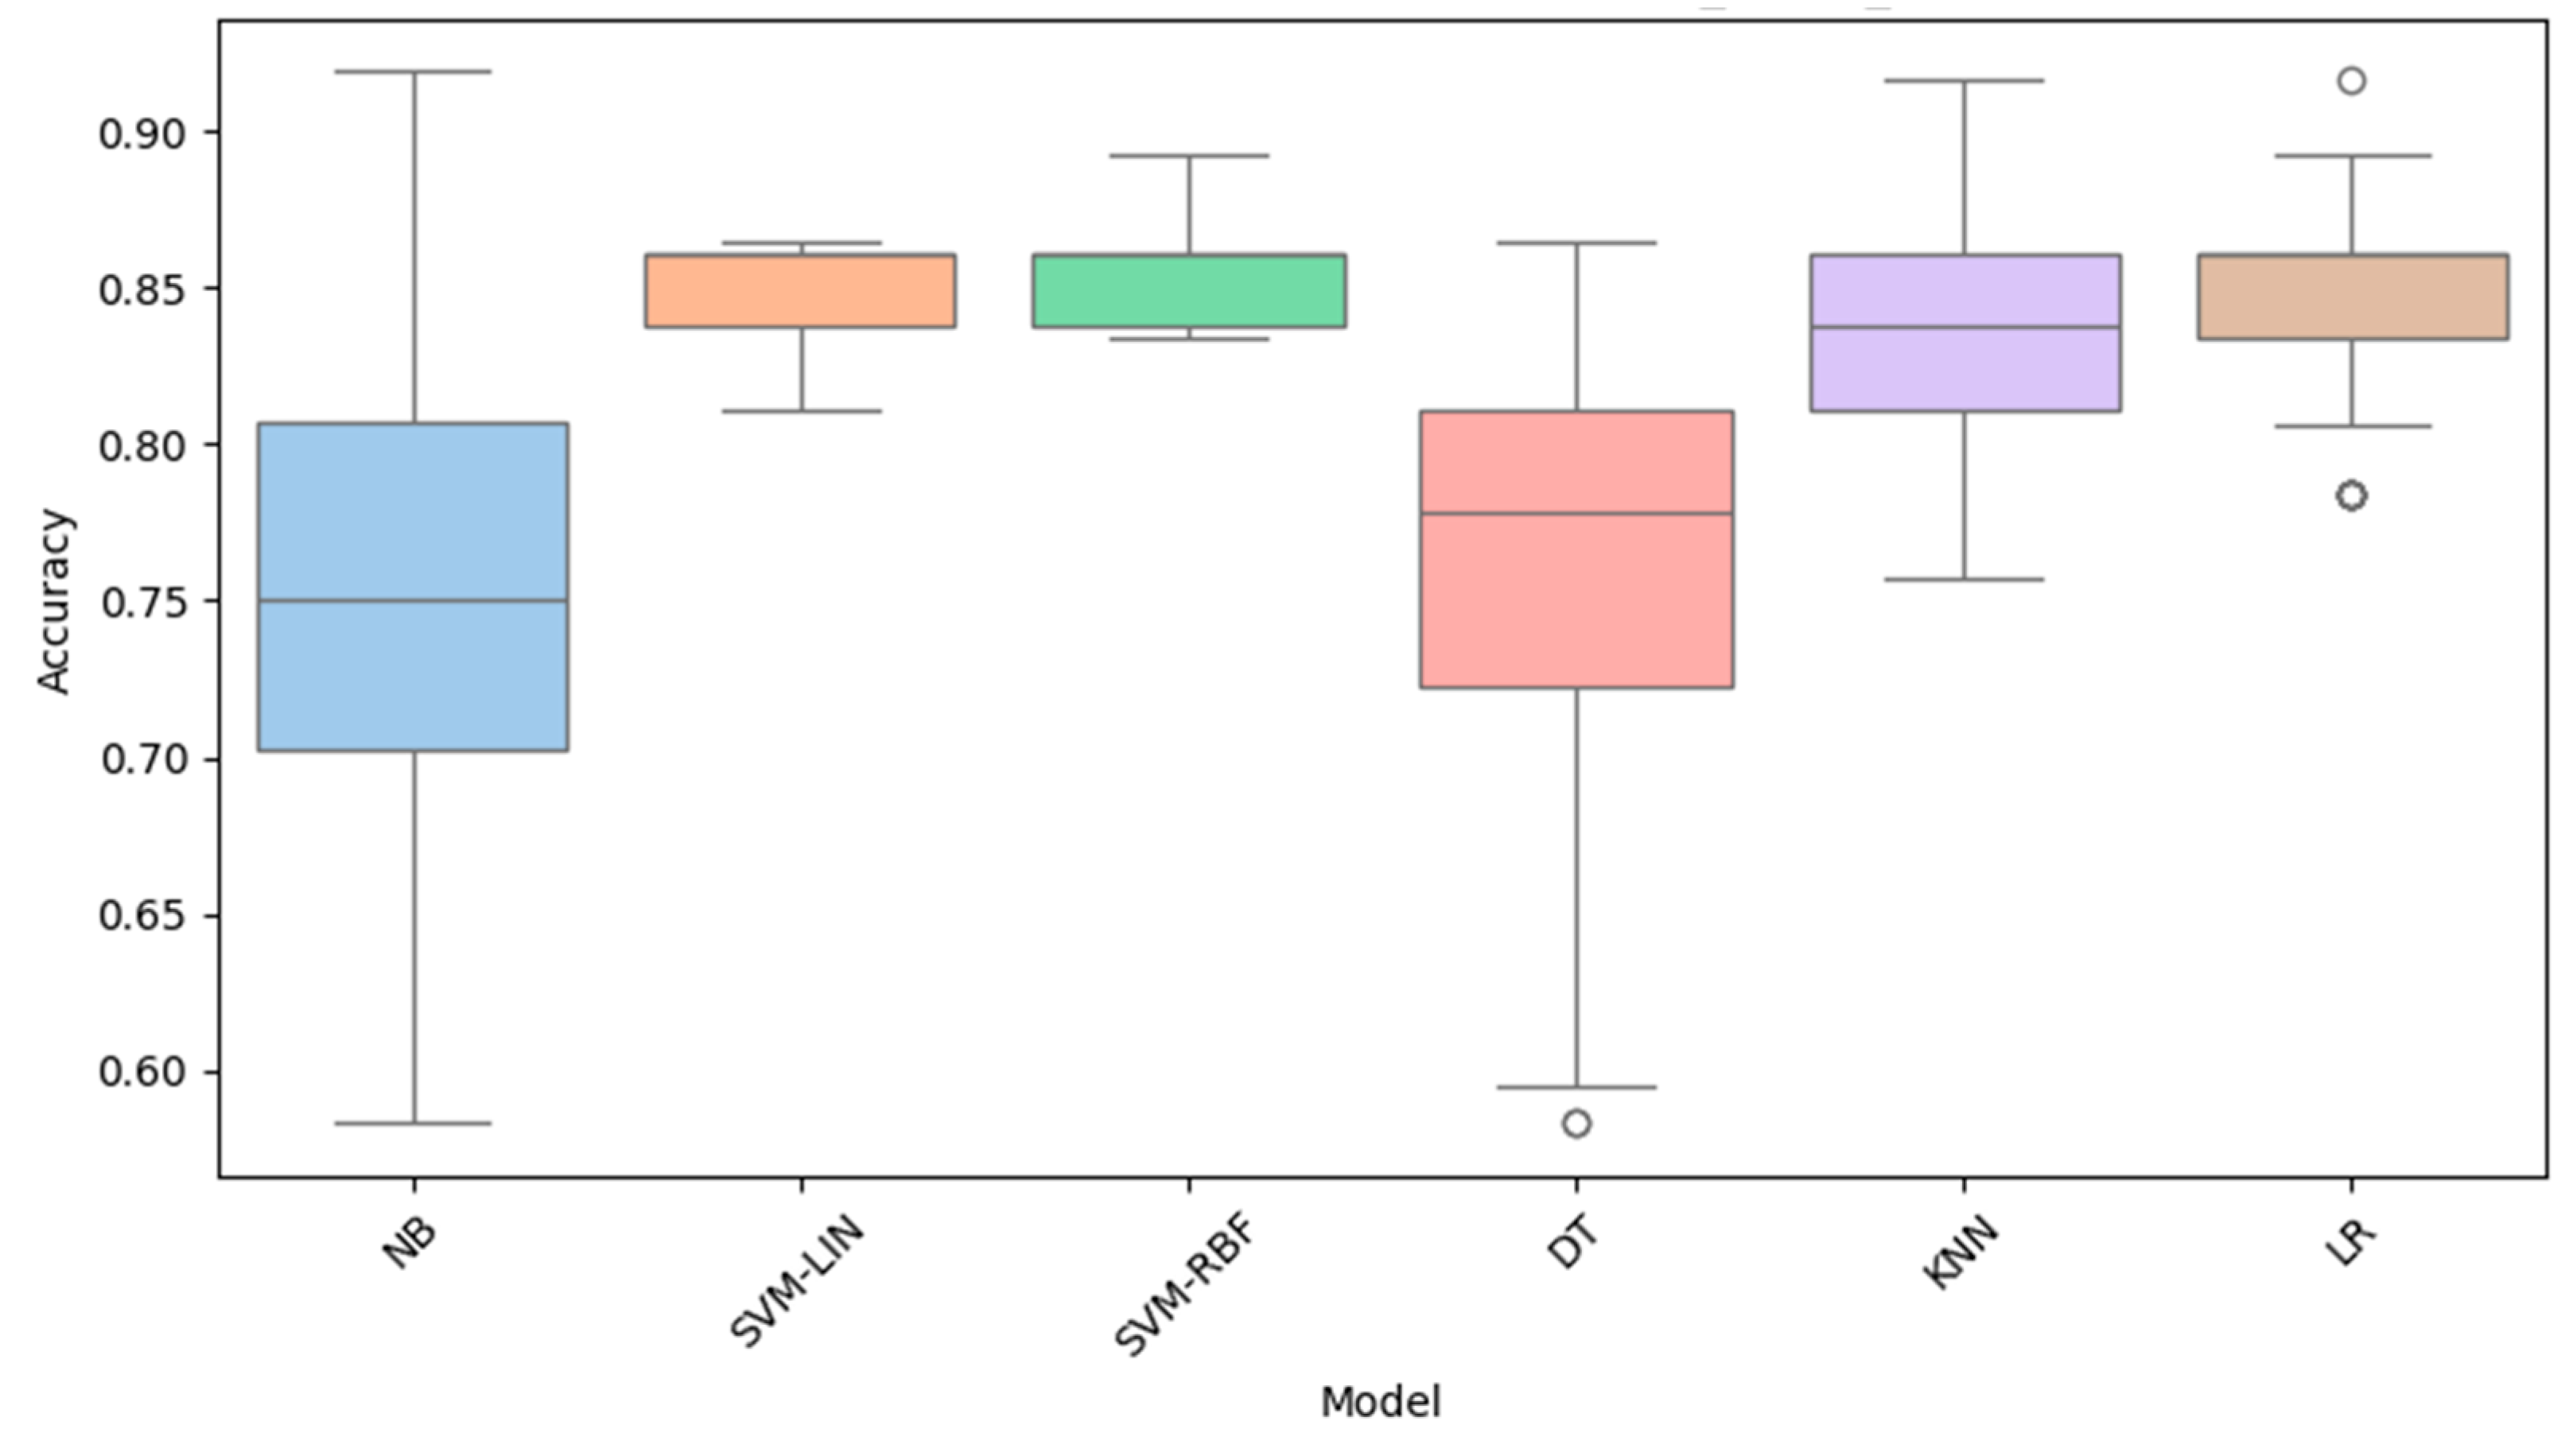

Table 1.
Excerpt from the database originating from a sample family business.
| Control Variables | |||
|---|---|---|---|
| Percentage of capital owned directly or indirectly by the entrepreneur’s family (x1) | Generation of the family owns shares in the company (x2) | Board members - total (x3) | Board members - family members (x4) |
| 100 | 2 | 1 | 1 |
| Board members - non-family members (x5) | Board members - females (x6) | CEO gender (x7) | CEO is family member (x8) |
| 0 | 0 | 1 | 1 |
| Generation of the family on board (x9) | Age of business entity (x10) | Total employment (x11) | Employment - female (x12) |
| 2 | 18 | 280 | 150 |
| Employment - family members (x13) | Employment - female family members (x14) | ||
| 8 | 5 | ||
| SEW Dimensions (Socioemotional Wealth) | |||
| family ownership share (x15) | family control over decisions (x16) | family presence in governance (x17) | family-appointed management (x18) |
| 4 | 4 | 5 | 4 |
| priority of retaining control (x19) | sense of belonging (x20) | company’s success as family’s success (x21) | personal significance of the company (x22) |
| 5 | 5 | 5 | 5 |
| company as part of identity (x23) | pride in being a family business (x24) | family name in the brand (x25) | care for the company’s reputation (x26) |
| 5 | 5 | 4 | 5 |
| involvement in the local community (x27) | treating employees like family (x28) | trust in business relationships (x29) | relationships with the institutional environment (x30) |
| 3 | 4 | 4 | 4 |
| long-term ties with suppliers (x31) | emotions in business decisions (x32) | caring for the family’s well-being (x33) | strong emotional bonds within the family (x34) |
| 4 | 3 | 5 | 4 |
| affirmation vs. economics (x35) | positive self-image through the company (x36) | family “warmth” at work (x37) | continuation of family tradition (x38) |
| 4 | 4 | 4 | 4 |
| long-term perspective (x39) | reluctance to sell the company (x40) | succession to the next generation (x41) | business longevity (x42) |
| 4 | 4 | 5 | 5 |
| building intergenerational capital (x43) | |||
| 4 | |||
| Self-assessment of Economic Situation (Hard Factors) | |||
| return on capital (y1) | asset profitability (y2) | sales profitability (y3) | increase in sales (y4) |
| 5 | 5 | 5 | 5 |
| liquidity (y5) | size of investment activity (y6) |
market share (y7) | |
| 4 | 5 | 4 | |
| Self-assessment of Economic Situation (Soft Factors) | |||
| product/service quality (y8) | development of new products/services (y9) | ability to attract and retain key employees (y10) | customer satisfaction (y11) |
| 3 | 3 | 2 | 3 |
| increased competitive position (y12) | |||
| 2 | |||
Table 2.
Hyperparameters of Machine Learning Models.
| Hyperparameter | Assigned Value | Explanation |
|---|---|---|
| Support Vector Machine – Linear | ||
| kernel | linear | Kernel function that transforms input data into a higher-dimensional space (linear). |
| C | 1 | Regularization parameter; controls the trade-off between maximizing the margin and minimizing classification error.. |
| gamma | 0.5 | Kernel coefficient for ‘rbf’ function; affects the reach of influence of a single sample (0.5 for linear model). |
| Support Vector Machine – Nonlinear | ||
| kernel | rbf | Kernel function that transforms input data into a higher-dimensional space (nonlinear). |
| C | 1 | Regularization parameter; controls the trade-off between maximizing the margin and minimizing classification error. |
| gamma | scale | Kernel coefficient for the ‘rbf’ function; affects the reach of influence of a single sample. The ‘scale’ value means 1 / (n_features * X.var()). |
| degree | 3 | Degree of the polynomial for the ‘poly’ kernel; ignored for ‘linear’ and ‘rbf’ kernels. |
| coef0 | 0.0 | Independent term in the kernel function; relevant for ‘poly’ and ‘sigmoid’ kernels. |
| shrinking | True | Indicates whether to use the shrinking heuristic; may affect the algorithm’s performance. |
| probability | False | Whether to enable probability estimates; requires additional model fitting. |
| tol | 0.001 | Tolerance for the stopping criterion; lower values may lead to more accurate solutions at the cost of computation time. |
| cache_size | 200 | Size of the kernel cache in MB; larger values may speed up computation at the cost of memory usage. |
| max_iter | -1 | Maximum number of iterations; -1 indicates no limit. |
| Decision Trees | ||
| criterion | gini | Function measuring the quality of a split. |
| splitter | best | Strategy used to split a node; ‘best’ chooses the best split. |
| max_depth | None | Maximum depth of the tree. |
| min_samples_split | 2 | Minimum number of samples required to split a node. |
| min_samples_leaf | 1 | Minimum number of samples required to be at a leaf node. |
| K-Nearest Neighbors (KNN) | ||
| n_neighbors | 5 | Number of neighbors to use in classification. |
| weights | uniform | Weighting method for neighbors; ‘uniform’ means equal weights. |
| algorithm | auto | Algorithm used to compute neighbors; ‘auto’ selects the best one based on the data. |
| leaf_size | 30 | Leaf size for the search tree. |
| p | 2 | Power parameter for the Minkowski metric. |
| Logistic Regression | ||
| penalty | I2 | Norm used in regularization; ‘l2’ indicates ridge regularization. |
| dual | False | Dual formulation of the optimization problem; used when the number of features > number of samples. |
| tol | 0.0001 | Tolerance for the stopping criterion; lower values may lead to more accurate solutions at the cost of computation time. |
| C | 1.0 | Regularization parameter; lower values of C imply stronger regularization. |
| fit_intercept | True | Whether to fit the intercept term. |
| solver | lbfgs | Optimization algorithm. |
| max_iter | 1000 | Maximum number of iterations for the solver; higher values may be needed for convergence in difficult cases. |
| multi_class | auto | Strategy for multi-class problems; ‘auto’ selects the appropriate strategy based on the solver. |
Table 3.
Selection of the Best Machine Learning Models for Predicting Labels Related to the Self-Assessment of the Economic Condition of Polish Family Businesses.
Table 3.
Selection of the Best Machine Learning Models for Predicting Labels Related to the Self-Assessment of the Economic Condition of Polish Family Businesses.
| Rating | Explained Variable | Best Model | Mean Accuracy of Best Model | Standard Deviation of Mean Accuracy of Best Model |
|---|---|---|---|---|
| 1 | customer satisfaction (y11) | SVM-RBF | 0.8546 | 0.014 |
| 2 | product/service quality (y8) | SVM-LIN | 0.8411 | 0.010 |
| 3 | ability to attract and retain key employees (y10) | SVM-RBF | 0.7653 | 0.059 |
| 4 | increased competitive position (y12) | KNN | 0.7080 | 0.063 |
| 5 | market share (y7) | SVM-RBF | 0.6843 | 0.056 |
| 6 | development of new products/services (y9) | SVM-LIN | 0.6700 | 0.054 |
| 7 | liquidity (y5) | SVM-RBF | 0.6690 | 0.055 |
| 8 | size of investment activity(y6) | SVM-RBF | 0.6390 | 0.067 |
| 9 | increase in sales (y4) (y4) | SVM-RBF | 0.6325 | 0.066 |
| 10 | asset profitability (y2) | SVM-RBF | 0.6082 | 0.077 |
| 11 | return on capital (y1) | SVM-RBF | 0.6004 | 0.075 |
| 12 | sales profitability (y3) | SVM-RBF | 0.5954 | 0.081 |
Disclaimer/Publisher’s Note: The statements, opinions and data contained in all publications are solely those of the individual author(s) and contributor(s) and not of MDPI and/or the editor(s). MDPI and/or the editor(s) disclaim responsibility for any injury to people or property resulting from any ideas, methods, instructions or products referred to in the content. |
© 2026 by the authors. Licensee MDPI, Basel, Switzerland. This article is an open access article distributed under the terms and conditions of the Creative Commons Attribution (CC BY) license.
Copyright: This open access article is published under a Creative Commons CC BY 4.0 license, which permit the free download, distribution, and reuse, provided that the author and preprint are cited in any reuse.


