
Submitted:
22 May 2026
Posted:
22 May 2026
You are already at the latest version
Abstract
The article aims to determine the dynamics of international trade in cultural goods, using the European Union market in the years 2016–2024 as a case study. The analysis takes into account changes in the total value of transactions as well as the shares of individual Member States in imports and exports. The research is based on a desk research method (secondary data analysis), drawing primarily on data from the Statistical Office of the European Union (Eurostat) and selected secondary sources.
The main thesis assumes that trade in cultural goods within the EU was characterised by significant dynamics in the period 2016–2024, revealing substantial differences between national markets in terms of transaction value and, consequently, their shares in the structure of EU imports and exports.
The findings confirm considerable quantitative transformations in international trade in cultural goods within the EU during the analysed period. Until 2019, the total value of trade increased markedly, while the temporary decline resulted from the United Kingdom’s withdrawal from the EU in January 2020. Growth dynamics became visible again in the years 2020–2023, with exports exceeding imports. Germany, France and Italy maintained their leading positions in trade in cultural goods. At the same time, particular attention should be paid to the dynamic rise in the role of countries such as Ireland and Romania, both in the structure of EU imports and exports.
Keywords:
cultural security
; cultural goods
; trade
; EU market
1. Introduction
The international exchange of cultural goods in the European Union brings together legal, economic and cultural security issues. An interdisciplinary approach to this topic is still relatively rare in the scholarly literature. International trade in cultural goods covers the import and export of works of art, books, antiques, CDs, DVDs and vinyl records, textiles and embroidery, newspapers, dailies and periodicals, musical instruments, films, consoles and video games, photographic film, maps, as well as architectural plans and drawings.1
The scope of this article lies within the field of the economics of cultural security, understood as a field that helps to explain how economic conditions and factors influence the preservation and development of culture, heritage and cultural diversity in contemporary EU societies.2 Economic issues are a key element in analysing the dynamics of phenomena that affect cultural security in Europe in the twenty-first century. International trade in cultural goods contributes to public revenues and, at the same time, facilitates the sharing of products that make up the cultural heritage of individual nations
So far, international exchange of cultural goods in the EU context has mostly been mentioned in studies of the overall level and dynamics of intra-EU trade [3]. In the academic literature, it has also appeared in analyses of the impact of EU law on the Polish legal order after 2004, addressing both intra-Community trade and trade beyond the EU’s external borders [4]. Scholars have also examined bilateral trade in cultural goods, taking into account factors such as regulatory liberalisation and cultural proximity between particular states [5]. For the years 2002–2015, S. Boutsiouki and N. Koutsoupias note that research on international trade in cultural goods forms an important part of the debate on the legal, economic, social and cultural dimensions of cooperation within the EU and often focuses on the benefits that such cooperation yields for states, economies and societies [6].
The literature also discusses changes in EU law on the import of cultural goods from outside the Union, in particular in connection with Regulation (EU) 2019/880 of the European Parliament and of the Council of 17 April 2019 on the introduction and the import of cultural goods [7]. These issues concern highly dynamic phenomena that unfold against a backdrop of frequent legal changes affecting the market. The 2019 Regulation is primarily aimed at countering the illicit trade in cultural goods, especially in the context of armed conflicts.3 Combating the illegal trade in cultural goods is closely linked to research on international trade in such goods and on the crossing of state borders within the EU [9]. The scope of this research can also be situated within cultural economics, including the economic determinants of cultural security in the EU. A similar approach has already been adopted by the author in an earlier article [10].
This article focuses on the dynamics of EU trade in cultural goods,4 considering the overall value of transactions, imports and exports, as well as the share of individual states in the EU’s trade in cultural goods with all its partners in international trade. The discussion builds on an article published in issue 3/2019 of the Scientific Journal of the Military University of Land Forces [11]. Since the relevant EU legislation was examined in that earlier piece, the present article does not revisit the legal framework, although it should be noted that in the period under review it had a significant impact on the dynamics of trade in cultural goods. The period analysed also includes the COVID-19 pandemic, which had a negative effect on international trade in cultural goods.5
2. International Trade in Cultural Goods in the EU in 2016–2024: Overall Trade Volumes
This section begins by presenting data that illustrate changes in international trade in cultural goods for EU countries in the years 2016–2024 (Figure 1).
As shown in Figure 1, in the period under review the value of international trade in cultural goods for all EU Member States changed substantially. Between 2016 and 2019, turnover on this market grew steadily by 19.8% (from EUR 93.8 billion to EUR 112.4 billion). As in other sectors of the global economy, the COVID-19 pandemic may have contributed, at least to some extent, to a slowdown in the dynamics of international trade in cultural goods in EU countries [13]. The downturn primarily concerned the first full pandemic year, namely 2020. A major factor behind the decline in trade volumes was also the withdrawal of the United Kingdom from the European Union in January 2020.6 Geopolitics and the short-term disruption of global supply chains thus played a role in shaping the dynamics of international trade in cultural goods on the market examined here. Other phenomena that constrained transactions included the development of e-commerce and competition from non-EU streaming platforms (SVOD – Subscription Video On Demand).7 These challenges did not, however, lead to a lasting collapse in trade, since total turnover increased markedly in 2020–2023 (from EUR 71.5 billion to over EUR 102 billion).
The next step is to trace changes in the value of import and export transactions in international trade in cultural goods for EU countries in 2016–2024 (Figure 2).
Figure 2 shows that the value of imports of cultural goods to EU countries in the years studied essentially did not change, remaining at EUR 41.7 billion (a decline of 0.1%). Over the same period, exports fell by 7.6% (from just over EUR 52 billion to just under EUR 56 billion). It is worth underlining that in every year exports clearly exceeded imports, although the gap between them narrowed over the period as a whole (especially from the first full pandemic year, 2020, onwards). The strength of EU exports, particularly in transactions beyond the internal market, was largely underpinned by the growth in jewellery sales, in the luxury segment (fine jewellery), affordable luxury and the mass-market (fashion) segment alike [16,17]. In the period analysed, an important driver of export growth was the sale of jewellery from Italy to Türkiye, which in 2024 accounted for almost 26% of total EU jewellery exports to non-EU countries8.
An additional factor helping to sustain a persistent export surplus was the introduction of stricter rules on the import of cultural goods into the EU from third countries following the entry into force of the 2019 regulation of the European Parliament and of the Council on the introduction and import of cultural goods. While the regulation was primarily intended to prevent the illicit trade in cultural goods, it also reinforced administrative and customs barriers and licensing requirements for imports of such goods in general [19]. Political and legal factors therefore played an important role in increasing the weight of exports in the EU’s trade in cultural goods after 2019.
The downturn in international trade in cultural goods in the EU between 2019 and 2020 affected exports (a decline of 41.5%) more strongly than imports (a decline of 29.6%). This was due in particular to the deterioration of the EU’s export capacity after the United Kingdom’s withdrawal from the Union [20]. In the year preceding Brexit, the value of UK exports of cultural goods exceeded EUR 20.6 billion, more than twice that of France, which ranked second [21] Despite this substantial change, the EU retained the capacity to generate surpluses in exports of cultural goods on the international market.
Structure of products in international trade in cultural goods: the case of the EU
International trade in cultural goods in the EU must also be considered in terms of the product structure of the transactions carried out. Table 1 presents changes in the share of individual types of cultural goods in EU imports and exports in 2016, 2020 and 2024, that is, at the beginning, in the middle and at the end of the period analysed.
As Table 1 shows, in the structure of imports of cultural goods to EU countries, jewellery ranked first (on average one third of imports), followed by video game consoles (depending on the year, one in four or one in five imported cultural goods), books (on average one in ten imported items) and works of art (almost 9% in 2016 and just under 16% in 2024). Musical instruments accounted for around 7% of these imports, while the remaining product categories had smaller shares.
In the structure of EU exports of cultural goods, jewellery clearly dominated, with its share rising from 48.5% to almost 65%. The EU played a key role in international trade in jewellery, particularly thanks to exports from countries such as Italy, Spain and Germany [22]. Works of art accounted for an average of 14% of exports, and products in the category of printing and reproduction of recorded media for around 10%, despite the decline in the latter from 10.7% to about 5%.
It is also important to note the marked disparity between exports and imports of video game consoles, in favour of imports. This can be explained by purchases made by Member States from non-EU countries, in particular imports from the United States and Japan. Since the beginning of the twenty-first century, the EU market has been one of the main markets worldwide in terms of purchases of such products. The absence of a European alternative among producers has meant that EU countries have effectively been compelled to import video game consoles from American and Japanese markets [23].
3. Geographical Structure of Trade in Cultural Goods in the EU by Individual Member States
It is necessary to examine the value of turnover in international trade in cultural goods across EU Member States by comparing data from the beginning and the end of the adopted period. This comparison is presented in Table 2.
Table 2 indicates that significant disparities in the value of turnover in international trade in cultural goods persisted among EU Member States. The largest shares were recorded by the United Kingdom (just under EUR 22.2 billion in 2016), Germany (approximately EUR 15 billion), France (with an increase from EUR 15.2 billion to EUR 19.5 billion), and Italy (with nearly a twofold increase, from EUR 10.3 billion to EUR 20.5 billion). As noted above, however, the United Kingdom’s withdrawal from the European Union substantially weakened the potential of the EU market as both an importer and, above all, an exporter of cultural goods.
Moreover, the group of countries with the highest growth dynamics in turnover included Romania and Ireland (in both cases more than a threefold increase in value), as well as Italy (almost a twofold increase). Trade turnover increased by more than half in Cyprus (61.7%), Portugal (62%), and Bulgaria (71.8%). A comparison of 2024 with 2016 shows that turnover increased in 22 out of 27 Member States. The exceptions were Denmark, Finland, Luxembourg, Latvia, and Poland.
Romania recorded the highest increase in the number of people employed in culture (10.4% between 2023 and 2024) and the highest share of full-time employment in the cultural sector among EU economies (97.3% in 2024), which supported the country’s growing engagement in international trade in cultural goods [24]. Between 2016 and 2024, Romania remained one of the fastest-growing economies in the EU, while growth in cultural goods imports was driven by rising income levels and household consumption. High economic growth was accompanied by structural economic changes, including the strengthening of the creative industries. A high proportion of intra-EU transactions in both imports and exports enabled Romania to benefit from uniform legal, administrative, and customs frameworks. The country remained relatively resilient to negative phenomena affecting international trade in cultural goods (and other categories of goods), including in transactions with third countries [25].
In Ireland’s case, growth dynamics were associated with the expanding cooperation of Irish enterprises with foreign corporations (particularly American ones), the growing importance of exports of luxury goods (including jewellery and works of art), and trade in digital carriers and products. The improvement of export infrastructure after the COVID-19 pandemic was accompanied by export support and promotion programmes, such as Showcase Ireland and Enterprise Ireland, facilitating the expansion of Irish cultural goods in foreign markets [26]. Legal changes also played an important role: in 2022 Ireland introduced the Digital Games Tax Credit, offering tax relief for projects related to the development of digital gaming technologies and including digital games within the legal classification of cultural goods [27].
Finally, the significant growth in international trade in cultural goods in Italy was largely driven by rising jewellery exports, both within the EU and to non-EU markets. A report prepared by the industry association Confindustria Federorafi for the years 2019–2023 identified the internationalisation of Italian jewellery producers as a strategic objective, particularly with regard to geographic and product diversification, as well as maintaining Italy’s leading position in EU jewellery exports [28].
In addition to Table 2, reference should be made to the values of imports (Table 3) and exports (Table 4) in the international trade in cultural goods in EU Member States over the period 2016–2024.
Table 3 shows that in the majority of EU Member States the value of imports increased in 2024 compared with 2016. The opposite trend was observed in Finland, Luxembourg, Latvia and Hungary.
In terms of growth dynamics, the most significant increases were recorded in Romania (317.7%), Ireland (289.9%), Bulgaria (192.9%), Cyprus (192.3%), Estonia (169.5%) and Portugal (160.3%). The rise in the importance of Romania and Ireland resulted from analogous phenomena to those previously discussed in the context of overall trade turnover growth.
In the case of Bulgaria, one of the leading factors was rising private consumption and economic growth supporting the development of the creative industries. The country joined the Schengen Area in 2024 (maritime and air borders) and additionally in 2025 (land borders). A significant role was also played by relatively low tax rates: Bulgaria’s VAT stands at 20%, while both personal and corporate income tax rates are 10%9.
The growing importance of Cyprus may be explained by its well-developed luxury goods and services sector, strong market absorption capacity, and dynamic growth in the video game console segment. Cyprus remained the EU leader in terms of the gross value added of the cultural sector to the economy (5.4%, compared with the EU average of 2.0%) and the sector’s share in total national turnover (5.4% compared with the EU average of 1.3% in 2022) [30].
Additional data published by Eurostat indicate that more than half of EU imports of cultural goods during this period concerned intra-EU trade. For example, in 2021 this share amounted to 54.6%, particularly in Slovakia (93.8%), Poland (85.4%), Croatia (84.1%), Portugal (83.3%) and Romania (82.8%).
By contrast, among the countries with the largest share of imports of cultural goods from partners outside the EU were the Netherlands (79.3%), Ireland (54.6%), Italy (49.8%), France (49.4%), Germany (48.3%) and Belgium (46.6%) [31].
Countries with a dominant share of intra-EU transactions are primarily those with negligible or limited transit roles in the trade of cultural goods within the internal market. A different role should be attributed to states functioning as international transport hubs, such as the Netherlands and Ireland (particularly in maritime transport) and Germany and France (especially in air transport), which have greater capacity to balance intra-EU imports with purchases from third countries [32].
Moreover, the overall predominance of intra-EU transactions in the Union’s cultural goods market results from the absence of customs barriers within the EU internal market and the associated simplified border procedures. It is further determined by lower logistical costs and reduced risks of theft or damage to what are typically high-value consignments. Lower regulatory risk constitutes another factor supporting the predominance of intra-EU transactions, covering not only imports but also exports of cultural goods within the European single market. This was indirectly reinforced by restrictions imposed on imports from third countries under Regulation (EU) 2019/880 [33].
It should also be noted that imports of cultural goods from outside the Member States were largely concentrated on a limited number of markets. Specifically, 90% of trade turnover was generated through exchanges with China, Switzerland, the United States, the United Kingdom, Turkey, Thailand, Japan, India and Malaysia [34].
Table 4 indicates that in the majority of countries the value of exports in 2024 increased compared to 2016. The opposite trend was observed in seven countries: Croatia, Cyprus, Denmark, Estonia, Finland, Germany and Poland. The value of cultural goods exports increased more than threefold in Romania and Ireland, and by more than half in Portugal, the Netherlands and Slovakia. These were the countries with the highest export growth dynamics in cultural goods within the EU.
Taking into account additional Eurostat data, it should be emphasised that in 2021, 52.6% of EU exports of cultural goods concerned intra-EU trade. The leading countries in this export segment were Slovakia (96.2%), Poland (89.3%), Czechia (84%), Romania (81.2%) and the Netherlands (81%). Particular attention should be paid to the Netherlands, which played a major role in intra-EU exports of cultural goods, although on the import side its trade in these goods was more strongly oriented towards non-EU countries. The specific character of Dutch exports resulted from the country’s role as an international logistics and distribution hub for cultural goods on the EU market. Goods were distributed via the ports of Rotterdam, Amsterdam Airport Schiphol, and the road network connecting the Dutch market with other EU countries. The Netherlands also hosts TEFAF on a regular basis, one of the most prestigious events dedicated to cultural goods and the largest sales event of this type on the European market [35].
Among the countries with the highest share of cultural goods exports outside the EU were Malta (90.8%), Ireland (89.7%), France (72.4%), Italy (70.7%), Finland (60.6%), Sweden (60.3%) and Luxembourg (58.1%) [36]. Moreover, on the extra-EU export side, the leading trade partners were Switzerland, Türkiye, the United States, the United Kingdom, the United Arab Emirates, China, Japan, South Korea and Mexico, accounting for approximately 83% of export value [36]. Exports of cultural goods outside the EU market were therefore clearly concentrated, although to a slightly lesser extent than imports.
In order to complement the analysis of the dynamics of international trade in cultural goods in the EU, it is worth examining the shares of individual countries in imports (Table 5) and exports (Table 6) within the EU internal market in the selected years.
- – to ensure data continuity for each country across the years, the United Kingdom was excluded from the comparison
Table 5 shows that, on average, the German market accounted for approximately one fifth of the value of cultural goods import transactions in the EU in each of the analysed years. The share of the French market was comparable (at 17–18%). The Italian market accounted for slightly less than one tenth of imports. Moreover, in the case of 16 out of 27 EU Member States, their share in EU imports of cultural goods in 2024 increased compared to 2016. Particular emphasis should be placed on the marked increase in Ireland’s share (from 0.65% to 3.38%), taking into account the previously presented examples explaining this development.
- – to ensure data continuity for each country across the years, the United Kingdom was excluded from the comparison
As can be seen from Table 6, the largest shares in intra-EU exports of cultural goods were held by four markets: Germany (maximum 26.13%), the Netherlands (maximum 20.41%), Italy (maximum 14.84%) and France (maximum 12%), although only the German market gradually lost share over the analysed years. During the period under consideration, an overall increase in the significance of cultural goods exports within the EU was recorded for 14 out of 27 Member States: Belgium, Cyprus, Czechia, Finland, France, Spain, the Netherlands, Lithuania, Portugal, Romania, Slovakia, Slovenia, Sweden and Italy. Particular attention should be paid to the proportional increase in Romania’s role in intra-EU exports of cultural goods (from 0.33% to 1.05%).
| 1 | It should be noted that the methodology for classifying cultural goods developed for the purposes of EU statistical reporting differs somewhat from the classifications adopted by national statistical offices or by international organisations such as UNESCO. In EU reporting, a clear distinction is made between trade in cultural goods and trade in cultural services (see: [1]). This distinction is important, as the following analysis focuses exclusively on the international exchange of cultural goods, rather than on cultural services. |
| 2 | For a more extensive discussion of attempts to provide a synthetic account of the essence of the economics of security across various areas of state security management, see: [2]. |
| 3 | Regulation (EU) 2019/880 additionally provides for the protection of Member States against the financing of terrorism and money laundering through the sale of looted cultural goods to purchasers within the EU, as well as for the protection of cultural goods themselves against destruction or loss. Such measures undertaken by EU Member States are intended to contribute to strengthening the protection of humanity’s cultural heritage [8]. |
| 4 | Excluding cultural services, which are classified separately in EU statistical reporting. |
| 5 | Economic indicators demonstrate that the cultural sector was among the most severely affected and at the same time the slowest to recover areas of the economy impacted by the COVID-19 pandemic [12]. This is a general conclusion referring to the condition of culture in a broad sense, rather than exclusively to the dynamics of international trade in cultural goods after 2019. |
| 6 | Data from Arts Council England indicate that this particularly concerned the export side, which predominated in the structure of the United Kingdom’s foreign trade in cultural goods in the first and second decades of the twenty-first century [14]. |
| 7 | It is assessed that during the analysed years similar phenomena prompted many countries to adapt their national cultural policies to new requirements for promoting the diversity of cultural expressions in a globalised economy. Additional importance was attached to counteracting tax avoidance by enterprises trading in cultural goods in connection with transactions on the EU market [15]. |
| 8 | In the context of rising inflation and the depreciation of the Turkish lira, as well as the introduction in 2023 of an additional 20% tariff on imported jewellery under Presidential Decree No. 7480, many Turkish citizens began, at an early stage, to treat purchases of jewellery (gold and silver) as a form of capital investment under difficult macroeconomic conditions. In 2023, a ban was also introduced on the import of unprocessed gold by non-professional individuals, with the exception of jewellery for personal use up to a value limit of USD 15,000. The Italian market became the primary destination for the dynamically growing purchases of jewellery by both Turkish citizens and Turkish institutions, which translated into the trade balance also in the sphere of international trade in cultural goods, as illustrated by the EU market. Cf. [18]. |
| 9 | It is worth noting that the National Statistical Institute of the Republic of Bulgaria classified trade in cultural goods under the category “Miscellaneous manufactured articles.” [29] |
References
- International Trade in Cultural Goods, Agenda point 6, European Commission – DG Eurostat, Brussels 2015, p. 6.
- Z. Stachowiak, “Ekonomika bezpieczeństwa. Dylematy powstania, rozwoju i poszukiwania swego paradygmatu,” Roczniki Nauk Rolniczych. Seria G, 2010, vol. 97, no. 2, pp. 121–132.
- R. Stehrer et al., The Evolving Composition of Intra-EU Trade, The Vienna Institute for International Economic Studies, Research Report, 2016, no. 414, pp. 59–71.
- M. Niedźwiedź, “Obrót dobrami kultury w Unii Europejskiej – konsekwencje dla Polski” [Trade in Cultural Goods in the European Union – Consequences for Poland], Kultura Współczesna, 2004, no. 2, pp. 120–139.
- A.-C. Disdier, S.H.T. Tai, L. Fontagné, and T. Mayer, “Bilateral Trade of Cultural Goods,” Review of World Economics, 2009, vol. 145, no. 4, pp. 575–595.
- S. Boutsiouki and N. Koutsoupias, “Exploring European Cultural Goods Trade: A Multidimensional Perspective,” in: A. Bitzenis and P. Kontakos (eds.), Proceedings of the International Conference on International Business. Thessaloniki, 18–21 May 2017 & 17–20 May 2018, Nikopolis, Thessaloniki 2018, pp. 121–135.
- D. Dobosz, “Pierwsza regulacja unijna w zakresie przywozu dóbr kultury spoza Unii Europejskiej – jej znaczenie dla rodzimego rynku i krajowego porządku prawnego” [The First EU Regulation on the Import of Cultural Goods from Outside the European Union – Its Significance for the Domestic Market and National Legal Order], Wiadomości Konserwatorskie, 2021, no. 67, pp. 171–180.
- Regulation (EU) 2019/880 of the European Parliament and of the Council of 17 April 2019 on the introduction and the import of cultural goods (OJ L 151/1, 7 June 2019).
- Cf. S. Manacorda and D. Chappell (eds.), Crime in the Art and Antiquities World: Illegal Trafficking in Cultural Property, Springer, New York 2011; T. Landmann, “Criminal Law and Practical Approaches to Fighting Crime in the Area of Protection of Cultural Property as an Element of Forming the Cultural Security of the Third Polish Republic,” Scientific Journal of the Military University of Land Forces, 2019, vol. 51, no. 2, pp. 238–252; M. Rau, Przestępstwa przeciwko dobrom kultury w międzynarodowym prawie karnym [Crimes against Cultural Goods in International Criminal Law], Instytut Wymiaru Sprawiedliwości, Warsaw 2021; W. Szafrański, “Aktualne problemy i zagrożenia związane z obrotem dobrami kultury na rynku sztuki w Polsce z perspektywy prawnej ochrony zabytków” [Current Problems and Threats Related to the Trade in Cultural Goods on the Polish Art Market from the Perspective of Legal Protection of Monuments], Santander Art and Culture Law Review, 2019, no. 1, pp. 41–68; idem, “Mity i patologie obrotu dziełami sztuki” [Myths and Pathologies of the Art Trade], Santander Art and Culture Law Review, 2015, no. 1, pp. 135–172; M. Trzciński, Przestępczość przeciwko zabytkom archeologicznym. Problematyka prawno-kryminalistyczna [Crime against Archaeological Heritage. Legal and Criminalistic Issues], Wolters Kluwer Polska, Warsaw 2010, pp. 181–184, 272–277; K. Zalasińska, “Przeciwdziałanie nielegalnemu przywozowi, wywozowi i przenoszeniu własności dóbr kultury – wybrane uwagi w związku z wdrożeniem Konwencji UNESCO z 1970 r. w Polsce” [Counteracting the Illegal Import, Export and Transfer of Ownership of Cultural Goods – Selected Remarks in Connection with the Implementation of the 1970 UNESCO Convention in Poland], Santander Art and Culture Law Review, 2015, no. 1, pp. 93–102.
- T. Landmann, “Cultural Security within the European Union in Terms of Selected Conditions of the Cultural Economics,” Scientific Journal of the Military University of Land Forces, 2021, vol. 53, no. 2, pp. 312–327.
- T. Landmann, “International Exchange of Cultural Property within the EU Territory in the Years 2008–2015, from the Legal, Economic and Cultural Security Perspective,” Scientific Journal of the Military University of Land Forces, 2019, vol. 51, no. 3, pp. 488–501.
- A.S.V. Radermecker, “Art and Culture in the COVID-19 Era: For a Consumer-Oriented Approach,” SN Business & Economics, 2020, no. 1, p. 3.
- M. Komańda, “Was It Doomsday? First Wave of the COVID-19 Pandemic Impact on the Polish Cultural Industry,” Economics & Culture, 2022, vol. 13, no. 1, p. 98.
- Cf. The Arts and Culture Contents Sector and Exit from the European Union, Arts Council England, Manchester 2016, p. 17.
- L. Deloumeaux, “Persisting Imbalances in the Flow of Cultural Goods and Services,” in: A. Azoulay (ed.), Reshaping Cultural Policies: Advancing Creativity for Development, UNESCO, Paris 2017, p. 127.
- G. Migliaccio and Ch.C. D’Alelio, “The Economic and Financial Performance of Jewellery in Europe. A Quantitative and Comparative Approach,” International Journal of Globalisation and Small Business, 2024, vol. 14, no. 3, pp. 215–255.
- Eurostat, “Intra and Extra-EU Trade in Cultural Goods by Product,” available at: https://ec.europa.eu/eurostat/databrowser/view/CULT_TRD_PRD/default/table?lang=en [accessed: 10 January 2026].
- Asharq Al-Awsat, “Turkish Gold Demand Lifts Italian Jewellery Exports as Leather Goods Suffer,” available at: https://english.aawsat.com/business/5049904-turkish-gold-demand-lifts-italian-jewellery-exports-leather-goods-suffer [accessed: 10 January 2026].
- S. Sarapani, “The Import of Cultural Goods under EU and Greek Law – A Critical Outlook,” Santander Art and Culture Law Review, 2021, no. 2, pp. 203–228.
- The Arts and Culture Contents Sector and Exit from the European Union, op. cit., p. 17.
- Eurostat, “Intra and Extra-EU Trade in Cultural Goods by Product,” available at: https://ec.europa.eu/eurostat/databrowser/view/CULT_TRD_PRD/default/table?lang=en [accessed: 10 August 2023].
- G. Migliaccio and Ch.C. D’Alelio, “The Economic and Financial Performance of Jewellery in Europe. A Quantitative and Comparative Approach,” op. cit., p. 215.
- V. Cox et al., Impact Assessment Study for Sustainable Product Measures. Lot 3 – Sound and Imaging Equipment. Report for DG Enterprise and Industry, Ricardo-AEA, Harwell 2013, p. 47.
- Pracujący w obszarze kultury w państwach Unii Europejskiej i EFTA w 2024 r. [Employment in the Cultural Sector in the European Union and EFTA Countries in 2024], GUS (Statistics Poland), Warsaw 2025, pp. 1 and 6.
- Chindris-Vasioiu, “Romania's Foreign Trade in a European Context,” Hyperion Economic Journal, 2024, no. 2, pp. 29–30.
- Enterprise Ireland, “Minister Burke Launches Programme to Support New Exporters Grow Their Business in International Markets,” available at: https://www.enterprise-ireland.com/en/news/new-exporters-grow-their-business-in-international-markets [accessed: 10 January 2026].
- M. O’Brien, Tax Credits for Cultural Production in Europe. The Irish Example, Springer, Cham 2025, pp. 179–212.
- Confindustria Federorafi, Study Center, available at: https://www.federorafi.it/en/study-center/ [accessed: 10 January 2026].
- National Statistical Institute of the Republic of Bulgaria, “Foreign Trade,” available at: https://www.nsi.bg/en/statistical-data/402/1159 [accessed: 10 January 2026].
- Eurostat, “Enterprise Statistics on the Whole Business Population,” available at: https://ec.europa.eu/eurostat/databrowser/view/sbs_ovw_act/default/table?lang=en [accessed: 10 January 2026].
- Eurostat, “Intra and Extra-EU Trade in Cultural Goods by Product,” available at: https://ec.europa.eu/eurostat/databrowser/view/CULT_TRD_PRD/default/table?lang=en [accessed: 10 January 2026].
- For further arguments on this issue, with reference to the case of the Netherlands, see: OECD, OECD Economic Surveys: Netherlands 2025, OECD Publishing, Paris 2025, p. 95.
- A. Puskás, “Trade Control and Protection of Cultural Goods in the European Union. An Evolving Approach?” Journal of Strategic Trade Control, 2024, vol. 2, p. 6.
- Eurostat, “Intra and Extra-EU Trade in Cultural Goods by Product,” available at: https://ec.europa.eu/eurostat/databrowser/view/CULT_TRD_PRD/default/table?lang=en [accessed: 10 January 2026].
- Ł. Sawicki, “Ekonomiczna analiza rynku sztuki najnowszej w roku 2014” [Economic Analysis of the Contemporary Art Market in 2014], Studia i Prace Kolegium Zarządzania i Finansów Szkoły Głównej Handlowej, 2015, no. 144, p. 93.
- Eurostat, “Intra and Extra-EU Trade in Cultural Goods by Product,” available at: https://ec.europa.eu/eurostat/databrowser/view/CULT_TRD_PRD/default/table?lang=en [accessed: 10 January 2026].
Figure 1.
Value of Turnover in International Trade in Cultural Goods for EU Countries in 2016–2024 (thousand euro). Source: Author’s own calculations based on Eurostat, Intra and extra-EU trade in cultural goods by product.
Figure 1.
Value of Turnover in International Trade in Cultural Goods for EU Countries in 2016–2024 (thousand euro). Source: Author’s own calculations based on Eurostat, Intra and extra-EU trade in cultural goods by product.
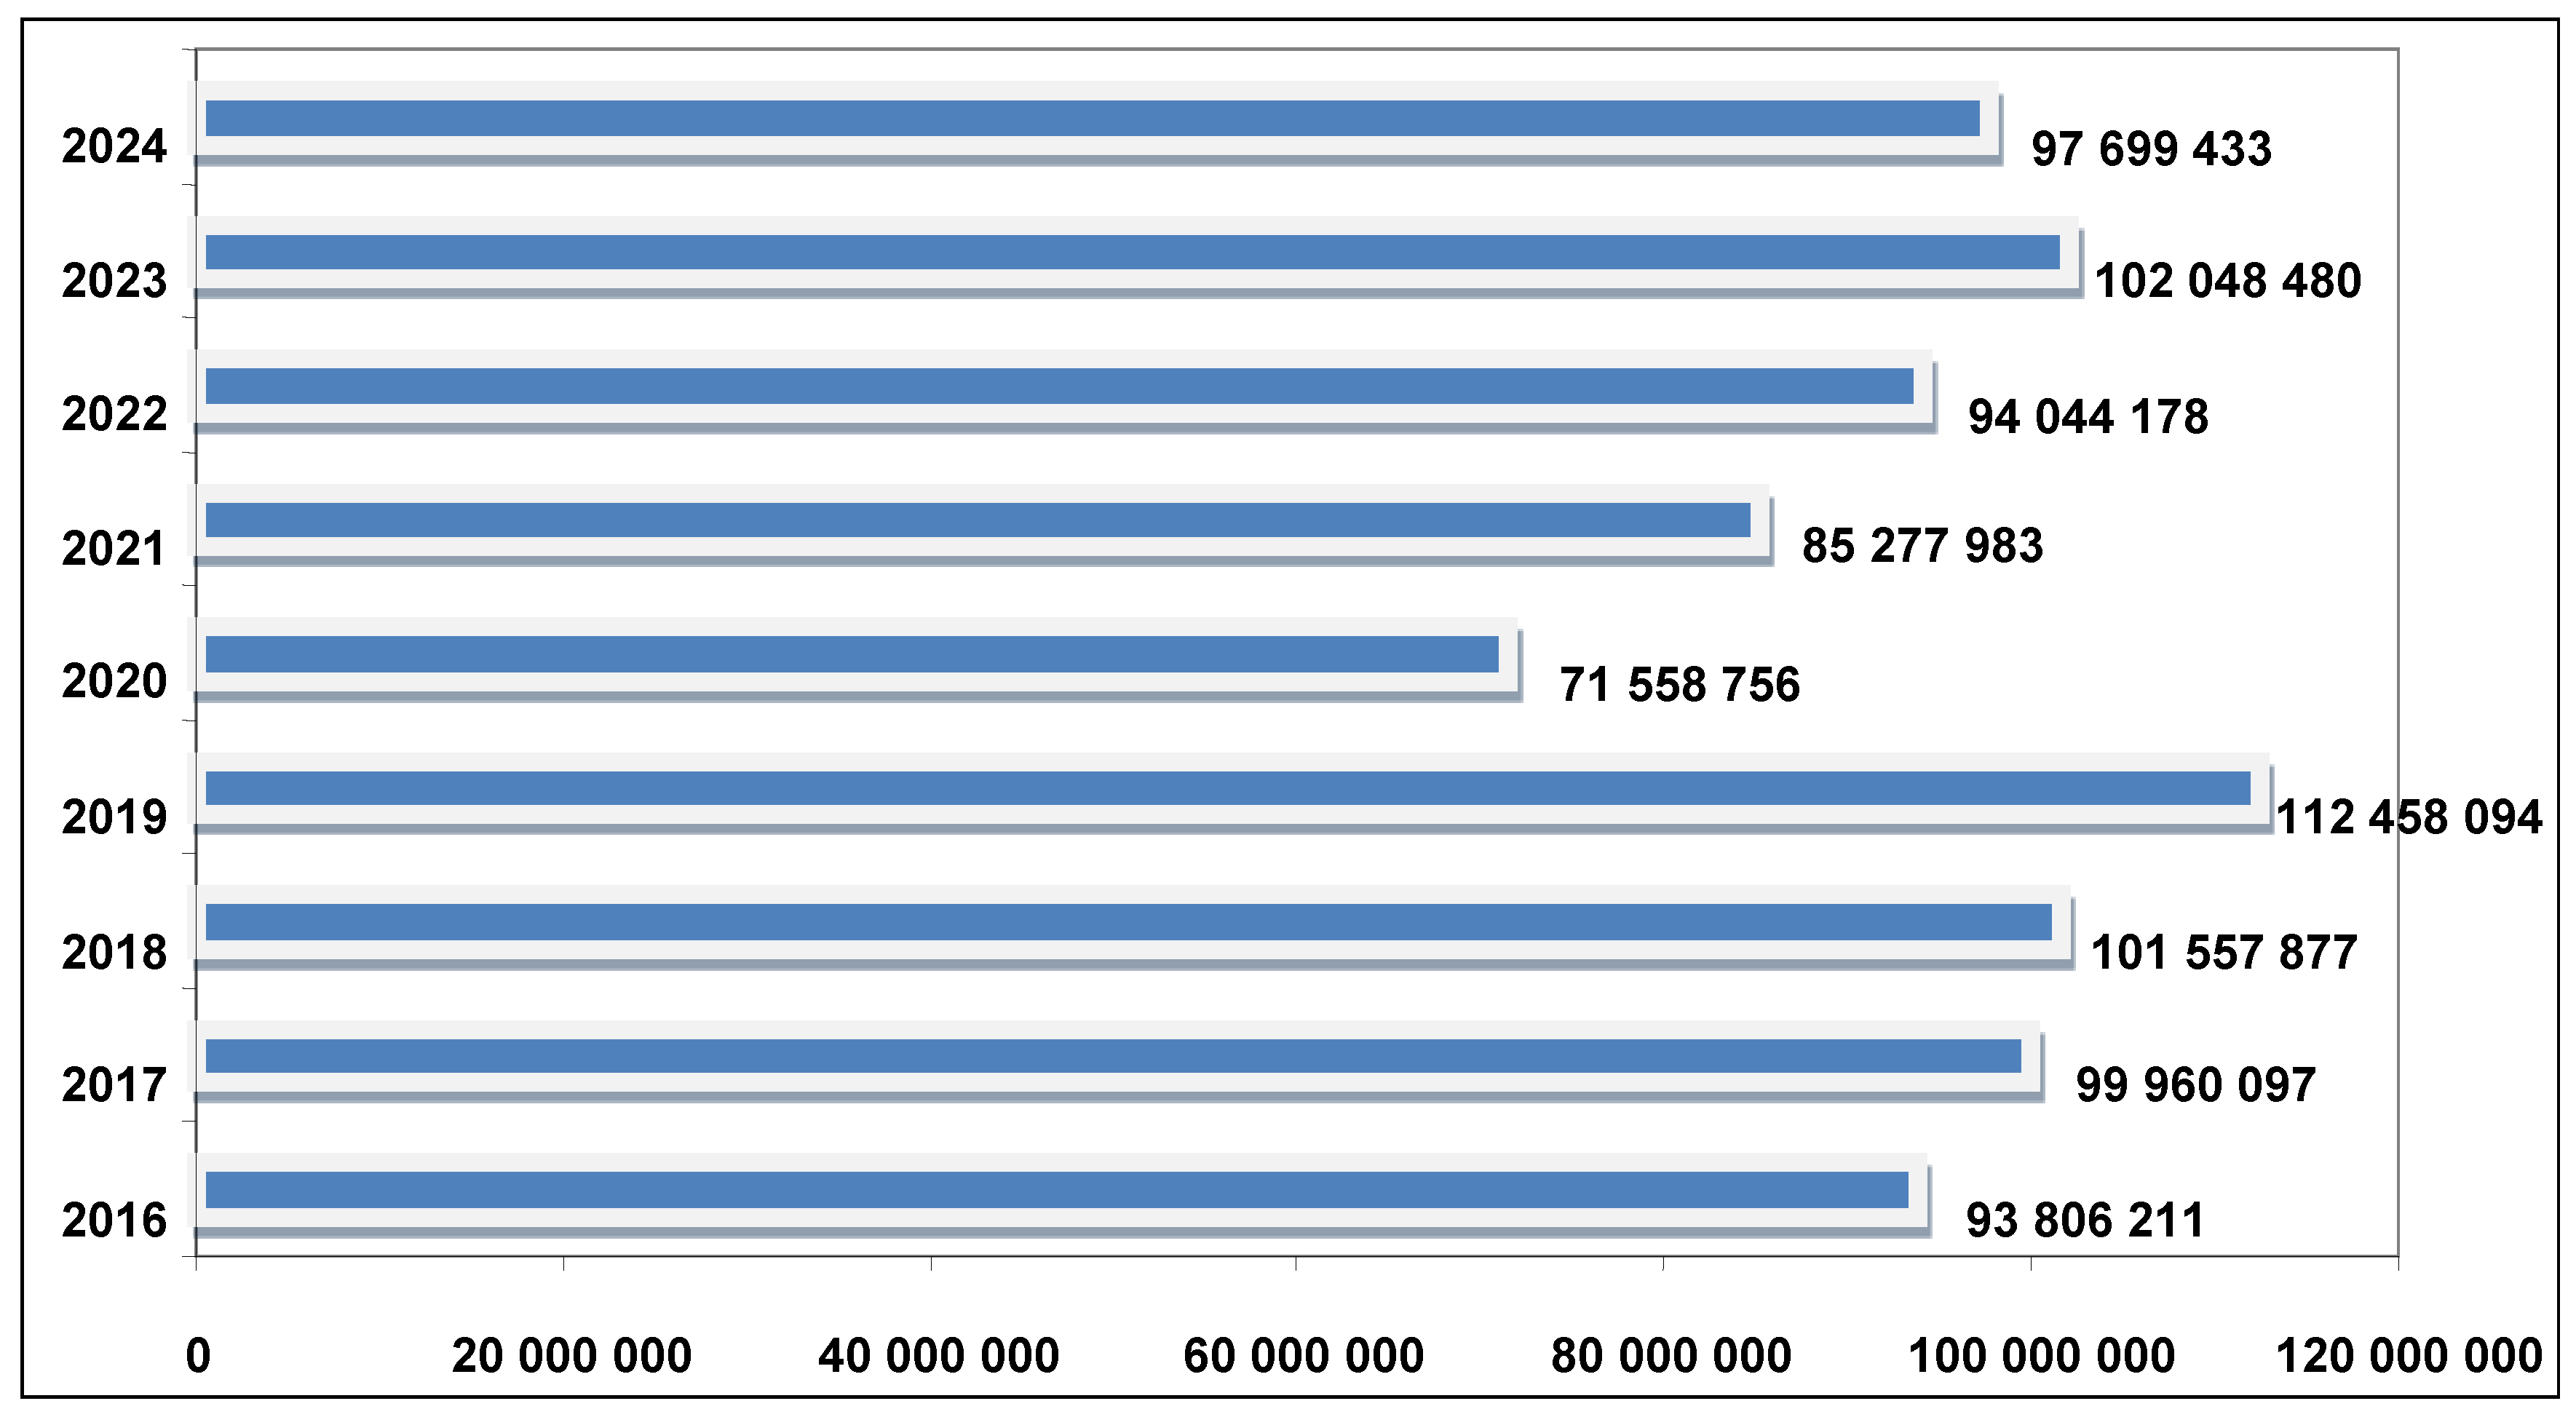
Figure 2.
Value of Imports and Exports in International Trade in Cultural Goods for EU Countries in 2016–2024 (thousand euro). Source: Author’s own calculations based on Eurostat, Intra and extra-EU trade in cultural goods by product.
Figure 2.
Value of Imports and Exports in International Trade in Cultural Goods for EU Countries in 2016–2024 (thousand euro). Source: Author’s own calculations based on Eurostat, Intra and extra-EU trade in cultural goods by product.
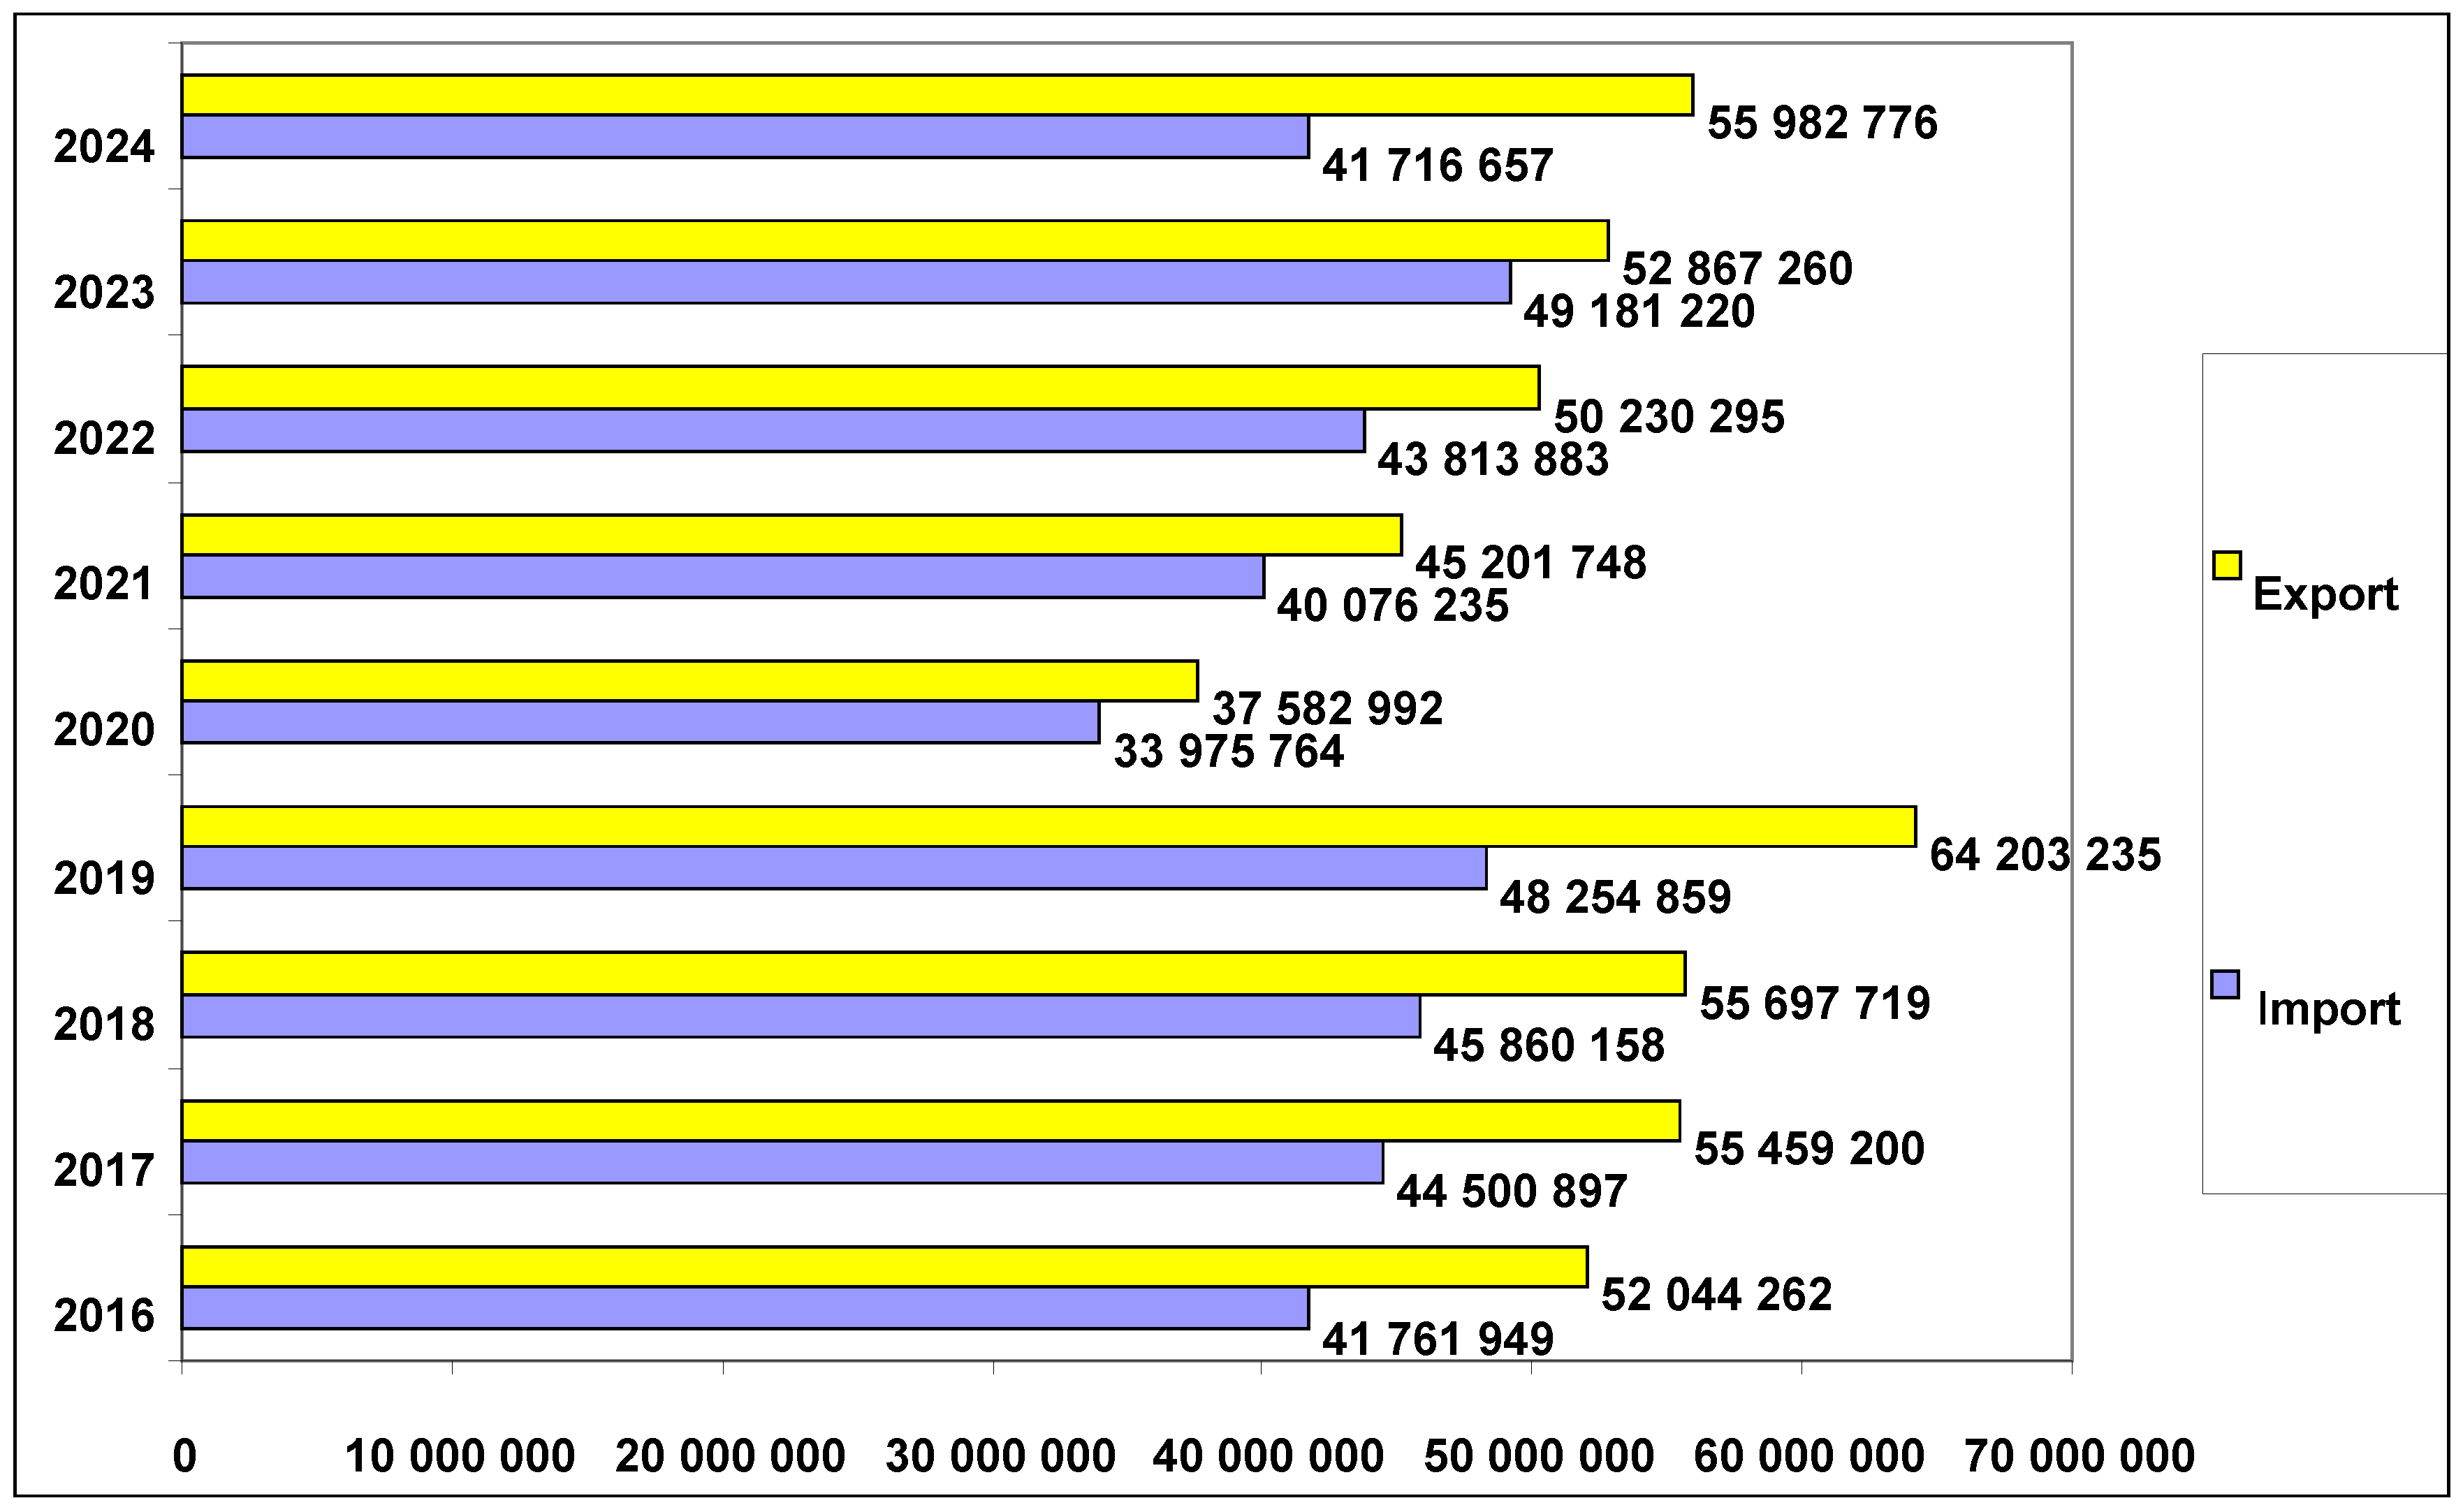

Table 1.
Share of individual products in imports and exports of cultural goods in the EU in 2016, 2020 and 2024 (percent).
Table 1.
Share of individual products in imports and exports of cultural goods in the EU in 2016, 2020 and 2024 (percent).
| CATEGORIES OF CULTURAL GOODS | IMPORT | EXPORT | ||||
|---|---|---|---|---|---|---|
| 2016 | 2020 | 2024 | 2016 | 2020 | 2024 | |
| Antiques | 4.58 | 3.72 | 4.93 | 2.98 | 2.76 | 3.45 |
| Works of art (paintings, prints, sculptures, designs) | 8.64 | 13.31 | 15.79 | 14.35 | 11.98 | 10.63 |
| Crafts | 6.27 | 4.81 | 4.64 | 3.72 | 3.82 | 2.62 |
| Jewellery | 35.55 | 30.68 | 34.58 | 48.63 | 48.45 | 64.99 |
| Books | 10.46 | 10.04 | 9.36 | 9.12 | 9.89 | 5.56 |
| Newspapers and periodicals | 1.96 | 1.26 | 0.95 | 2.89 | 1.72 | 0.84 |
| Maps | 0.31 | 0.21 | 0.08 | 0.16 | 0.10 | 0.04 |
| Architectural plans and drawings | 0.03 | 0.01 | 0.01 | 0.15 | 0.14 | 0.07 |
| Photographic plates and films | 1.14 | 0.91 | 2.43 | 0.70 | 1.18 | 0.88 |
| Printing and reproduction of recorded media (e.g. CDs, DVDs, vinyl records) | 5.04 | 3.82 | 2.19 | 10.75 | 10.35 | 4.92 |
| Video game consoles | 19.65 | 23.87 | 18.71 | 2.95 | 5.43 | 3.34 |
| Musical instruments, parts and accessories | 6.37 | 7.35 | 6.35 | 3.56 | 4.21 | 2.66 |
Source: Author’s own calculations based on Eurostat, Intra and extra-EU trade in cultural goods by product.
Table 2.
Value of turnover in international trade in cultural goods in EU Member States in 2016 and 2024 (in thousand euro).
Table 2.
Value of turnover in international trade in cultural goods in EU Member States in 2016 and 2024 (in thousand euro).
| Country | 2016 | 2024 | Dynamics (%) 2016 = 100 |
|---|---|---|---|
| Austria | 2,877,922 | 3,237,935 | 112.51 |
| Belgium | 2,444,526 | 3,450,293 | 141.14 |
| Bulgaria | 172,096 | 295,723 | 171.84 |
| Croatia | 218,747 | 253,013 | 115.66 |
| Czechia | 1,968,144 | 2,568,370 | 130.50 |
| Cyprus | 65,942 | 106,623 | 161.69 |
| Denmark | 1,182,984 | 1,177,067 | 99.50 |
| Estonia | 150,411 | 167,354 | 111.26 |
| Finland | 357,103 | 304,664 | 85.32 |
| France | 15,280,922 | 19,588,685 | 128.19 |
| Greece | 509,915 | 605,136 | 118.67 |
| Spain | 3,302,427 | 4,711,243 | 142.66 |
| Netherlands | 8,229,623 | 12,249,262 | 148.84 |
| Ireland | 1,155,427 | 3,513,552 | 304.09 |
| Lithuania | 165,245 | 215,110 | 130.18 |
| Luxembourg | 251,048 | 185,536 | 73.90 |
| Latvia | 269,495 | 257,821 | 95.66 |
| Malta | 47,141 | 57,549 | 122.08 |
| Germany | 14,955,804 | 15,254,885 | 102.00 |
| Poland | 4,409,155 | 4,192,777 | 95.09 |
| Portugal | 499,737 | 809,911 | 162.07 |
| Romania | 270,240 | 875,504 | 323.97 |
| Slovakia | 531,190 | 791,163 | 148.95 |
| Slovenia | 221,801 | 301,382 | 135.88 |
| Sweden | 1,287,269 | 1,526,107 | 118.55 |
| Hungary | 397,077 | 429,215 | 108.09 |
| United Kingdom | 22,199,189 | – | – |
| Italy | 10,385,632 | 20,573,553 | 198.10 |
Table 3.
Value of imports in international trade in cultural goods in EU countries in 2016 and 2024 (in thousand euro). Source: Author’s own elaboration based on Eurostat, Intra- and extra-EU trade in cultural goods by product, https://ec.europa.eu/eurostat/databrowser/view/CULT_TRD_PRD/default/table?lang=en [accessed: 10 June 2026].
Table 3.
Value of imports in international trade in cultural goods in EU countries in 2016 and 2024 (in thousand euro). Source: Author’s own elaboration based on Eurostat, Intra- and extra-EU trade in cultural goods by product, https://ec.europa.eu/eurostat/databrowser/view/CULT_TRD_PRD/default/table?lang=en [accessed: 10 June 2026].
| Country | 2016 | 2024 | Dynamics (%) 2016 = 100 |
|---|---|---|---|
| Austria | 1,788,940 | 2,125,284 | 118.80 |
| Belgium | 1,367,065 | 1,844,128 | 134.90 |
| Bulgaria | 108,003 | 208,392 | 192.95 |
| Croatia | 131,364 | 181,574 | 138.22 |
| Czechia | 855,259 | 1,024,266 | 119.76 |
| Cyprus | 50,438 | 97,007 | 192.33 |
| Denmark | 629,753 | 653,440 | 103.76 |
| Estonia | 47,259 | 80,106 | 169.50 |
| Finland | 254,867 | 218,274 | 85.64 |
| France | 7,278,030 | 8,884,679 | 122.08 |
| Greece | 301,343 | 385,447 | 127.91 |
| Spain | 1,762,129 | 2,569,334 | 145.81 |
| Netherlands | 3,999,242 | 5,496,497 | 137.44 |
| Ireland | 612,350 | 1,775,384 | 289.93 |
| Lithuania | 69,881 | 99,119 | 141.84 |
| Luxembourg | 220,744 | 151,553 | 68.66 |
| Latvia | 106,280 | 79,890 | 75.17 |
| Malta | 35,722 | 45,867 | 128.40 |
| Germany | 6,766,154 | 7,456,269 | 110.20 |
| Poland | 1,817,500 | 1,858,000 | 102.23 |
| Portugal | 345,647 | 554,388 | 160.39 |
| Romania | 180,935 | 574,832 | 317.70 |
| Slovakia | 275,173 | 385,431 | 140.07 |
| Slovenia | 109,513 | 136,250 | 124.41 |
| Sweden | 692,432 | 903,408 | 130.47 |
| Hungary | 222,659 | 212,303 | 95.35 |
| United Kingdom | 8,697,731 | – | – |
| Italy | 3,035,536 | 3,715,535 | 122.40 |
Table 4.
Value of exports in international trade in cultural goods in EU countries in 2016 and 2024 (thousand euro).
Table 4.
Value of exports in international trade in cultural goods in EU countries in 2016 and 2024 (thousand euro).
| Country | 2016 | 2024 | Dynamics (%) 2016 = 100 |
|---|---|---|---|
| Austria | 1,088,982 | 1,112,651 | 102.17 |
| Belgium | 1,077,461 | 1,606,165 | 149.07 |
| Bulgaria | 64,093 | 87,331 | 136.26 |
| Croatia | 87,383 | 71,439 | 81.75 |
| Czechia | 1,112,884 | 1,544,104 | 138.75 |
| Cyprus | 15,504 | 9,616 | 62.02 |
| Denmark | 553,231 | 523,627 | 94.65 |
| Estonia | 103,152 | 87,248 | 84.58 |
| Finland | 102,236 | 86,390 | 84.50 |
| France | 8,002,892 | 10,704,006 | 133.75 |
| Greece | 208,572 | 219,689 | 105.33 |
| Spain | 1,540,298 | 2,141,909 | 139.06 |
| Netherlands | 4,230,381 | 6,752,765 | 159.63 |
| Ireland | 543,077 | 1,738,168 | 320.06 |
| Lithuania | 95,364 | 115,991 | 121.63 |
| Luxembourg | 30,304 | 33,983 | 112.14 |
| Latvia | 163,215 | 177,931 | 109.02 |
| Malta | 11,419 | 11,682 | 102.30 |
| Germany | 8,189,650 | 7,798,616 | 95.22 |
| Poland | 2,591,655 | 2,334,777 | 90.09 |
| Portugal | 154,090 | 255,523 | 165.83 |
| Romania | 89,305 | 300,672 | 336.68 |
| Slovakia | 256,017 | 405,732 | 158.48 |
| Slovenia | 112,288 | 165,132 | 147.06 |
| Sweden | 594,837 | 622,699 | 104.68 |
| Hungary | 174,418 | 216,912 | 124.36 |
| United Kingdom | 13,501,458 | – | – |
| Italy | 7,350,096 | 16,858,018 | 229.36 |
Source: Author’s own elaboration based on: Eurostat, Intra and extra-EU trade in cultural goods by product, https://ec.europa.eu/eurostat/databrowser/view/CULT_TRD_PRD/default/table?lang=en [accessed: 10 June 2026].
Table 5.
Share of individual countries in imports of cultural goods on the EU internal market in 2016, 2020 and 2024 (%)*.
Table 5.
Share of individual countries in imports of cultural goods on the EU internal market in 2016, 2020 and 2024 (%)*.
| Country | 2016 | 2020 | 2024 |
|---|---|---|---|
| Austria | 8.91 | 6.76 | 8.27 |
| Belgium | 5.07 | 4.62 | 3.98 |
| Bulgaria | 0.43 | 0.54 | 0.66 |
| Croatia | 0.62 | 0.46 | 0.69 |
| Cyprus | 0.16 | 0.17 | 0.29 |
| Czechia | 3.99 | 4.98 | 3.86 |
| Denmark | 2.28 | 1.79 | 1.66 |
| Estonia | 0.18 | 0.19 | 0.27 |
| Finland | 1.15 | 0.95 | 0.78 |
| France | 18.14 | 17.08 | 17.64 |
| Greece | 0.89 | 0.64 | 1.17 |
| Spain | 5.09 | 4.85 | 7.60 |
| Netherlands | 5.36 | 5.05 | 5.94 |
| Ireland | 0.65 | 2.18 | 3.38 |
| Lithuania | 0.23 | 0.33 | 0.29 |
| Luxembourg | 0.71 | 0.63 | 0.54 |
| Latvia | 0.41 | 0.21 | 0.21 |
| Malta | 0.09 | 0.07 | 0.11 |
| Germany | 21.26 | 21.57 | 17.73 |
| Poland | 8.38 | 11.91 | 6.34 |
| Portugal | 1.64 | 1.62 | 2.10 |
| Romania | 0.69 | 0.96 | 1.77 |
| Slovakia | 1.00 | 1.18 | 1.60 |
| Slovenia | 0.36 | 0.38 | 0.38 |
| Sweden | 2.40 | 3.02 | 2.95 |
| Hungary | 1.02 | 0.72 | 0.71 |
| Italy | 8.91 | 7.14 | 9.09 |
Source: Author’s own elaboration based on: Eurostat, Intra and extra-EU trade in cultural goods by product, https://ec.europa.eu/eurostat/databrowser/view/CULT_TRD_PRD/default/table?lang=en [accessed: 10 January 2026].
Table 6.
Share of individual countries in exports of cultural goods on the EU internal market in 2016, 2020 and 2024 (%)*.
Table 6.
Share of individual countries in exports of cultural goods on the EU internal market in 2016, 2020 and 2024 (%)*.
| Country | 2016 | 2020 | 2024 |
|---|---|---|---|
| Austria | 3.26 | 3.83 | 2.62 |
| Belgium | 3.75 | 3.36 | 3.80 |
| Bulgaria | 0.27 | 0.37 | 0.26 |
| Croatia | 0.32 | 0.17 | 0.16 |
| Cyprus | 0.01 | 0.01 | 0.03 |
| Czechia | 4.78 | 6.59 | 5.26 |
| Denmark | 1.73 | 1.11 | 1.14 |
| Estonia | 0.33 | 0.30 | 0.24 |
| Finland | 0.18 | 0.13 | 0.20 |
| France | 9.12 | 7.87 | 12.00 |
| Greece | 0.64 | 0.33 | 0.53 |
| Spain | 4.37 | 6.41 | 4.58 |
| Netherlands | 17.62 | 15.13 | 20.41 |
| Ireland | 1.21 | 10.70 | 0.83 |
| Lithuania | 0.29 | 0.32 | 0.30 |
| Luxembourg | 0.15 | 0.08 | 0.08 |
| Latvia | 0.60 | 0.53 | 0.56 |
| Malta | 0.02 | 0.01 | 0.02 |
| Germany | 26.13 | 21.99 | 18.53 |
| Poland | 10.97 | 15.60 | 8.22 |
| Portugal | 0.49 | 0.55 | 0.71 |
| Romania | 0.33 | 0.52 | 1.05 |
| Slovakia | 1.22 | 1.41 | 1.25 |
| Slovenia | 0.46 | 0.45 | 0.50 |
| Sweden | 0.93 | 1.36 | 1.25 |
| Hungary | 0.65 | 0.58 | 0.63 |
| Italy | 10.16 | 9.92 | 14.84 |
Source: Author’s own elaboration based on: Eurostat, Intra and extra-EU trade in cultural goods by product, https://ec.europa.eu/eurostat/databrowser/view/CULT_TRD_PRD/default/table?lang=en [accessed: 10 January 2026].
Disclaimer/Publisher’s Note: The statements, opinions and data contained in all publications are solely those of the individual author(s) and contributor(s) and not of MDPI and/or the editor(s). MDPI and/or the editor(s) disclaim responsibility for any injury to people or property resulting from any ideas, methods, instructions or products referred to in the content. |
© 2026 by the authors. Licensee MDPI, Basel, Switzerland. This article is an open access article distributed under the terms and conditions of the Creative Commons Attribution (CC BY) license (http://creativecommons.org/licenses/by/4.0/).
Copyright: This open access article is published under a Creative Commons CC BY 4.0 license, which permit the free download, distribution, and reuse, provided that the author and preprint are cited in any reuse.


