

Submitted:
19 May 2026
Posted:
20 May 2026
You are already at the latest version
Abstract
Managing safety and operational efficiency in large-scale events requires tools capable of capturing complex crowd dynamics while supporting rapid and informed decision-making. This paper presents a Generative AI-powered digital twin framework that integrates agent-based crowd simulation, an API-based execution pipeline, and a Large Language Model (LLM)-driven conversational interface within a unified system. The proposed approach enables dynamic configuration, execution, and analysis of crowd scenarios under varying operational conditions, including high-demand and emergency evacuation contexts. Experimental results demonstrate the system’s ability to reproduce nonlinear crowd dynamics, detect congestion patterns, and evaluate evacuation performance, providing actionable insights for planning and safety assessment. A key contribution lies in the introduction of an API-based execution paradigm that exposes the full simulation lifecycle (configuration, validation, execution, and output retrieval) through programmatic interfaces, enabling reproducible and scalable what-if analysis. Additionally, the integration of an LLM-based conversational interface allows non-technical users to interact with complex simulation models through natural language, significantly improving accessibility and usability. The framework is validated through a TRL-4 prototype, demonstrating robust performance, scalability, and interaction reliability. Overall, the proposed system advances digital twins from static analytical tools to executable, interactive, and user-centric platforms for decision support in complex urban environments.
Keywords:
digital twin
; crowd simulation
; large language models
; generative AI
; API-based systems
; evacuation modeling
; decision support
; smart cities
1. Introduction
1.1. Context and Motivation
Large-scale events (such as music festivals, sporting competitions, and mass gatherings in controlled venues) pose significant operational challenges that go beyond basic crowd control. These events generate high-density scenarios where the efficient management of people, services, and emergency procedures becomes critical to ensuring safety, user experience, and overall operational performance. As urban environments become increasingly complex, these challenges are further amplified by the need to coordinate multiple interconnected systems under dynamic and uncertain conditions.
The problem is inherently complex due to the dynamic and stochastic nature of crowd behavior. Attendee arrivals, movement patterns, and service demand evolve continuously over time, often leading to congestion, long queues, and inefficient use of resources. Furthermore, interactions between individuals and infrastructure introduce nonlinear effects, where small variations in demand or capacity can lead to disproportionate impacts on system performance. Therefore, traditional approaches based on static planning, empirical rules, or post-event analysis are insufficient to capture these dynamics or to support timely and informed decision-making.
A key challenge lies in accurately modeling crowd dynamics within the event environment. This includes the representation of time-dependent arrivals, spatial movement, and interactions with service systems. High-density conditions can lead to critical bottlenecks, reduced mobility, and increased safety risks, especially when service capacity is not properly aligned with demand. Addressing these challenges requires simulation frameworks capable of capturing both individual-level behaviors and system-level emergent phenomena.
Additionally, event management must consider emergency scenarios, where rapid and coordinated evacuation becomes essential. Evaluating evacuation performance under different configurations requires tools capable of representing both infrastructure constraints and collective behavioral responses under stress conditions. This further increases the need for flexible and robust modeling approaches that can support scenario-based analysis.
Recent advances in digital twins, simulation technologies, and artificial intelligence offer new opportunities to address these challenges. In particular, digital twins have evolved from static representations to dynamic, data-driven systems capable of modeling complex urban processes [1,2]. When combined with configurable simulation models and intelligent interfaces, these systems enable the exploration of multiple operational scenarios in a flexible and scalable manner. This integration opens the door to interactive, data-driven decision-making frameworks for the planning and management of large-scale events.
1.2. State of the Art
Recent advances in digital twin technologies have demonstrated significant potential for improving the management of large-scale events and complex urban systems. These systems enable the integration of simulation models with real-world data, enhancing situational awareness and supporting data-driven decision-making processes. In particular, digital twins have been applied to model crowd dynamics, urban infrastructures, and event scenarios, allowing planners to evaluate alternative operational strategies under varying conditions.
Early applications of digital twins in crowd management focused on combining virtual representations with data sources to monitor and analyze event dynamics. For example, Villanueva et al. [3] proposed a framework for managing crowded events through the integration of simulation and sensor data. More broadly, Batty [1] described the evolution of digital twins from static representations to dynamic computational systems capable of capturing complex socio-urban interactions. However, as highlighted by Bettencourt [4], significant challenges remain in the validation of these models and in the accurate representation of emergent behaviors in large-scale urban environments.
Recent reviews further emphasize these limitations. Peldon et al. [2] and Weil et al. [5] identify key challenges related to data integration, interoperability, scalability, and the lack of standardized architectures for urban digital twins. Although these works demonstrate the growing maturity of the field, most existing approaches remain focused on data-oriented representations, with limited support for dynamic interaction, flexible configuration, and iterative scenario exploration.
In parallel, crowd simulation has been widely studied as a tool for modeling pedestrian dynamics and evaluating infrastructure performance. Agent-based modeling approaches have proven particularly effective in capturing individual behaviors and emergent system dynamics [6,7]. These models have been extensively used for evacuation analysis and safety assessment [8,9]. However, traditional simulation frameworks are typically based on predefined scenarios and static parameter configurations, which limits their ability to adapt to changing conditions or to support user-driven interactive exploration.
Despite these advances, a critical gap remains in the integration of simulation-based digital twins with accessible and interactive interfaces. Current systems often require technical expertise to configure models and interpret results, which restricts their usability for non-expert stakeholders. In particular, the application of Large Language Models (LLMs) for configuring and interacting with simulation environments through natural language remains largely unexplored in the context of crowd management and urban event planning.
1.3. Identified Gaps
Based on the analysis of the current state of the art, three key gaps can be identified in existing approaches to crowd management and urban digital twins.
(1) Lack of integrated and operational digital twin frameworks: Existing approaches tend to focus either on data-driven monitoring systems or on isolated simulation models, with limited integration between both paradigms. Although digital twins have been proposed as a unifying concept, most implementations remain fragmented, lacking cohesive architectures that combine crowd simulation, service dynamics, and operational analysis within a single configurable and executable framework. This limitation hinders the transition from descriptive models to operational decision-support systems.
(2) Limited accessibility and user-centered interaction: Current simulation and digital twin platforms typically require significant expert knowledge, including familiarity with configuration schemas, programming interfaces, or specialized tools. As a result, their use is largely restricted to technical users, limiting their adoption in real-world planning contexts. Although recent advances in Large Language Models (LLMs) have demonstrated their potential for natural language interaction [10,11], their application to the configuration and control of simulation-based digital twins remains largely unexplored in the domain of crowd management.
(3) Limited flexibility and scalability for scenario exploration: Traditional simulation tools are generally based on static configurations and predefined scenarios, which restricts their ability to support iterative and exploratory analysis. In particular, there is a lack of systems that enable dynamic reconfiguration, reproducible execution, and scalable what-if analysis through programmatic interfaces. This limitation constrains the practical applicability of simulation models in time-sensitive and decision-critical environments.
Overall, these gaps highlight the need for digital twin frameworks that are not only accurate in representing system dynamics, but also executable, accessible, and adaptable to dynamic operational requirements.
1.4. Proposed Approach
To address the identified gaps, this work proposes a digital twin framework driven by Generative Artificial Intelligence that integrates simulation, execution, and interaction within a unified, operation-oriented architecture. The approach combines a discrete-time crowd simulation engine, an API-based execution pipeline, and an LLM-based conversational interface, enabling the definition, modification, execution, and analysis of large-scale event scenarios in a dynamic and reproducible manner. By decoupling simulation from user interaction and exposing the full lifecycle through programmatic services, the system advances toward an executable, scalable, and user-centered digital twin model capable of supporting operational planning, resource management, and emergency scenario evaluation in large-scale events.
(1) Simulation-based virtual sensing: The core of the system is a discrete-time crowd simulation engine that models attendee arrivals, movement, and interactions with service systems. The simulator generates spatiotemporal data representing occupancy, density, queue dynamics, and resource utilization, effectively acting as a network of virtual sensors. This virtual sensing layer enables continuous monitoring and analysis of crowd behavior, capturing both individual-level dynamics and system-level emergent phenomena.
(2) API-based execution pipeline: The simulation framework is exposed as an external service through an API-based execution pipeline, enabling programmatic access to the full simulation lifecycle. This includes configuration, validation, execution, and result retrieval. This design supports reproducible and scalable simulation workflows, facilitates integration with external systems, and enables dynamic scenario evaluation through automated what-if analysis. By decoupling system components, the architecture ensures modularity and extensibility, aligning with emerging service-oriented digital twin paradigms.
(3) AI-based conversational configuration interface: To enhance accessibility and usability, a Large Language Model (Gemini 2.5 Flash) provides a natural language interface to interact with the system. The LLM translates user inputs into structured YAML configurations, which are validated and executed through the API-based pipeline. This approach enables non-technical users to define, modify, and execute complex simulation scenarios through intuitive interaction, effectively bridging the gap between human intent and system execution.
By integrating these components, the proposed architecture enables dynamic scenario definition, rapid reconfiguration, and interactive exploration of operational strategies. Unlike traditional simulation frameworks, the system operates as an executable, user-centered digital twin platform, supporting reproducible analysis and informed decision-making in large-scale event management.
1.5. Research Objectives
Based on the identified research gaps and the proposed system architecture, this work pursues three main objectives aimed at advancing the state of the art in digital twin-based crowd management:
- Objective 1: Develop a digital twin framework capable of modeling and analyzing crowd dynamics in large-scale event scenarios, capturing both steady-state behavior and critical conditions such as congestion formation and emergency evacuation, taking into account emergent and interaction-driven phenomena.
- Objective 2: Design and implement an API-based execution layer that enables dynamic, reproducible, and scalable scenario configuration and simulation, supporting systematic what-if scenario analysis and its integration into operational decision-making workflows.
- Objective 3: Enable accessible and user-centered interaction with complex simulation models through the integration of a Large Language Model (LLM), allowing non-technical users to configure, execute, and interpret simulation workflows using natural language.
Overall, these objectives establish a direct link between the limitations identified in existing approaches and the contributions proposed in this work, guiding the system design and ensuring that the experimental validation addresses both technical performance and practical applicability.
1.6. Key Contributions
This paper makes several key contributions to the field of crowd management and digital twin systems. First, it proposes an operational digital twin framework for crowd management that unifies simulation-based virtual sensing, service system modeling, and operational analysis within a single configurable and executable platform tailored to large-scale event scenarios. In addition, the paper introduces an API-based execution paradigm that exposes the complete simulation lifecycle (including configuration, validation, execution, and result retrieval) through programmatic interfaces. This approach enables reproducible, modular, and scalable simulation workflows while supporting systematic what-if scenario analysis.
Another important contribution is the integration of a Large Language Model (Gemini 2.5 Flash) as a conversational interface, allowing users to configure, execute, and interpret simulation scenarios using natural language. This significantly lowers the technical barrier for non-expert users and improves the accessibility of complex simulation environments. Furthermore, the proposed framework incorporates a discrete-time crowd simulation engine capable of representing stochastic arrivals, mobility patterns, service interactions, and queue dynamics. The model also includes realistic behavioral mechanisms such as balking and reneging, enabling the analysis of both steady-state operations and critical crowd conditions.
The framework additionally supports dynamic scenario analysis and emergency evaluation, including evacuation modeling under different operational and emergency conditions. This flexibility allows decision-makers to assess system performance across a wide range of what-if situations. Finally, the feasibility and robustness of the proposed approach are demonstrated through the implementation and validation of a TRL-4 prototype, providing quantitative evidence of system performance, scalability, and interaction reliability.
The remainder of this paper is structured as follows. Section 2 presents the materials and methods, including the system architecture, the simulation engine, and the LLM-based configuration interface. Section 3 presents the experimental results and performance evaluation. Section 4 discusses the implications of the proposed approach, its limitations, and possible extensions. Finally, Section 5 concludes the paper and outlines future research directions.
2. Materials and Methods
2.1. System Architecture Overview
The proposed system architecture is composed of three main subsystems that, together, enable simulation-based decision support for the management of large-scale events.
The Crowd simulation engine models attendee arrivals, movements, and interactions through a discrete-time agent-based framework, generating spatiotemporal data on occupancy, density, and service dynamics. The API-Based Execution Layer provides a programmatic interface for configuring, executing, and retrieving simulation results, enabling scalable, decoupled, and reproducible workflows aligned with service-oriented digital twin architectures [13]. The Conversational AI Interface, powered by a Large Language Model (Gemini 2.5 Flash Lite), enables natural language interaction by translating user inputs into structured YAML configurations processed by the simulation engine.
These subsystems are integrated within a unified architecture that ensures consistent data exchange and supports dynamic scenario definition, rapid system reconfiguration, and efficient decision support, as illustrated in Figure 1, positioning the digital twin as an operational and user-centered platform.
2.2. Crowd Simulation Engine
2.2.1. Digital Twin Construction
The digital twin of the event environment is constructed as an abstract yet operational representation of the venue, focused on crowd dynamics, service systems, and aggregated spatial interactions rather than detailed geospatial networks.
The model defines an effective event space characterized by its usable area, average distances to key services (e.g., bars, bathrooms, exits), and system capacity constraints. This abstraction prioritizes computational efficiency and scalability while preserving system-level crowd dynamics, in line with recent digital twin approaches [1,5].
Within this framework, attendees interact with distributed service systems, while movement is approximated through mean travel times derived from average distances and density-dependent mobility conditions. This simplified spatial representation balances realism and computational tractability, which is consistent with established practices in agent-based modeling [6].
The digital twin captures the macroscopic behavior of the system, including occupancy evolution, density, congestion effects, queue formation, service utilization, and evacuation flows, enabling large-scale scenario analysis without the overhead of detailed spatial modeling.
2.2.2. Discrete-time Agent-Based Simulation
The crowd simulation engine follows a discrete-time agent-based simulation scheme in which the system evolves in fixed time steps . At each step, the global state is updated synchronously, focusing on the aggregated behavior of agents and their interactions with service systems.
Attendees are represented as stochastic agents governed by probabilistic decision rules. At each time step, agents may: (i) arrive at the venue according to a temporal arrival profile, (ii) request a service, (iii) join queues subject to balking behavior, (iv) leave queues due to excessive waiting times (reneging), or (v) remain within the venue contributing to occupancy and density.
This behavioral formulation enables the reproduction of emergent collective dynamics while maintaining a tractable computational structure [6]. The model includes a single attendee type segmented into behavioral groups (e.g., calm, party, vulnerable), each characterized by service demand multipliers and behavioral parameters.
The simulation records a time series of system snapshots, including occupancy, density, queue sizes, waiting times, and accumulated demand (served, unserved, balked, and reneged). These snapshots are later used to compute KPIs such as service levels, congestion ratios, dwell time, and evacuation performance.
2.2.3. Configuration Management
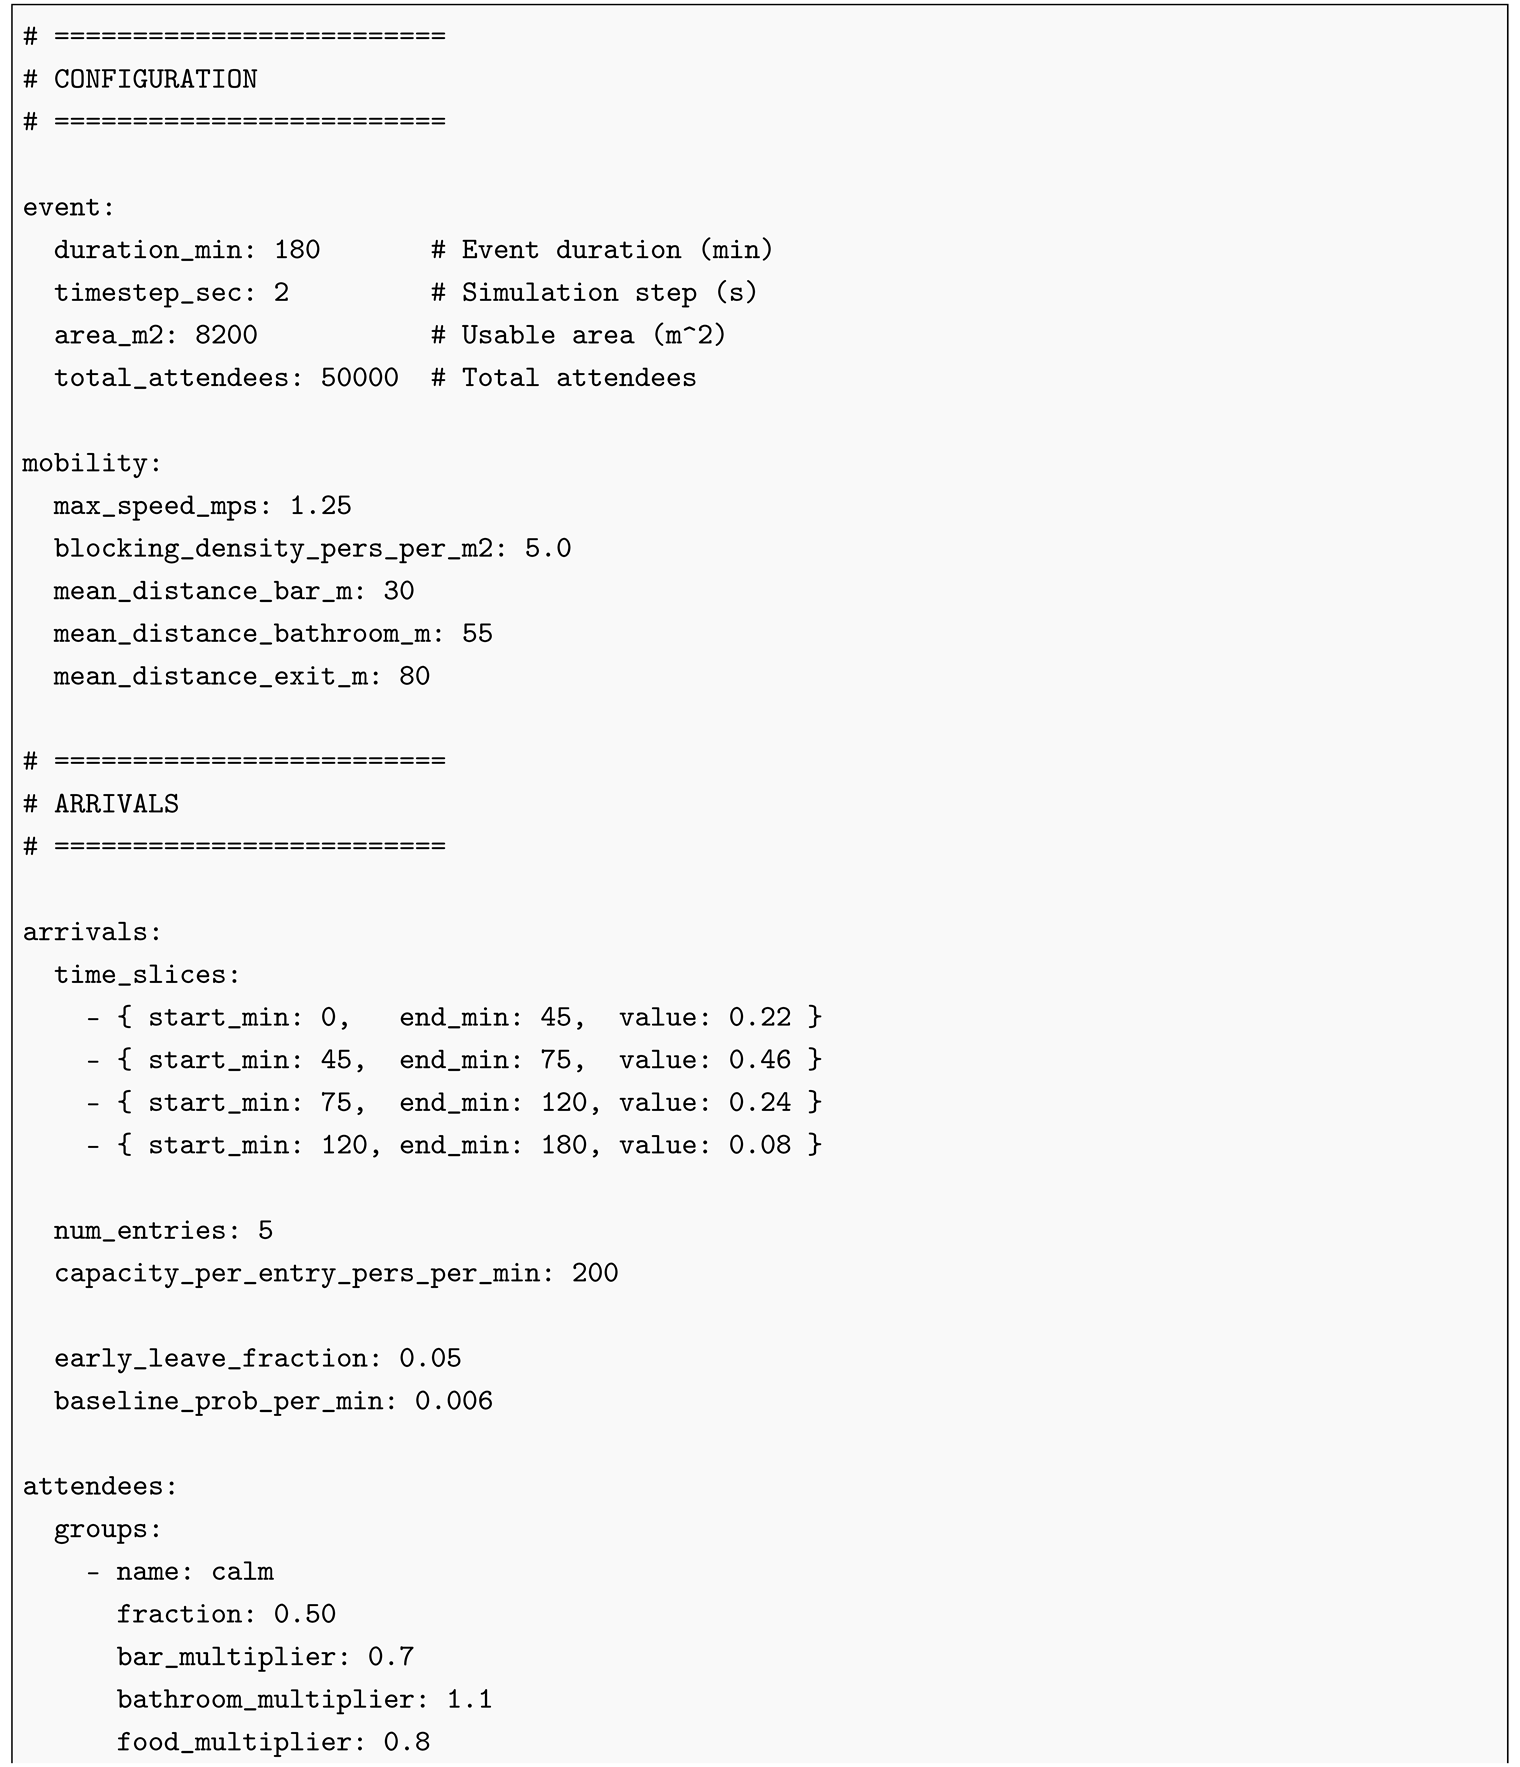
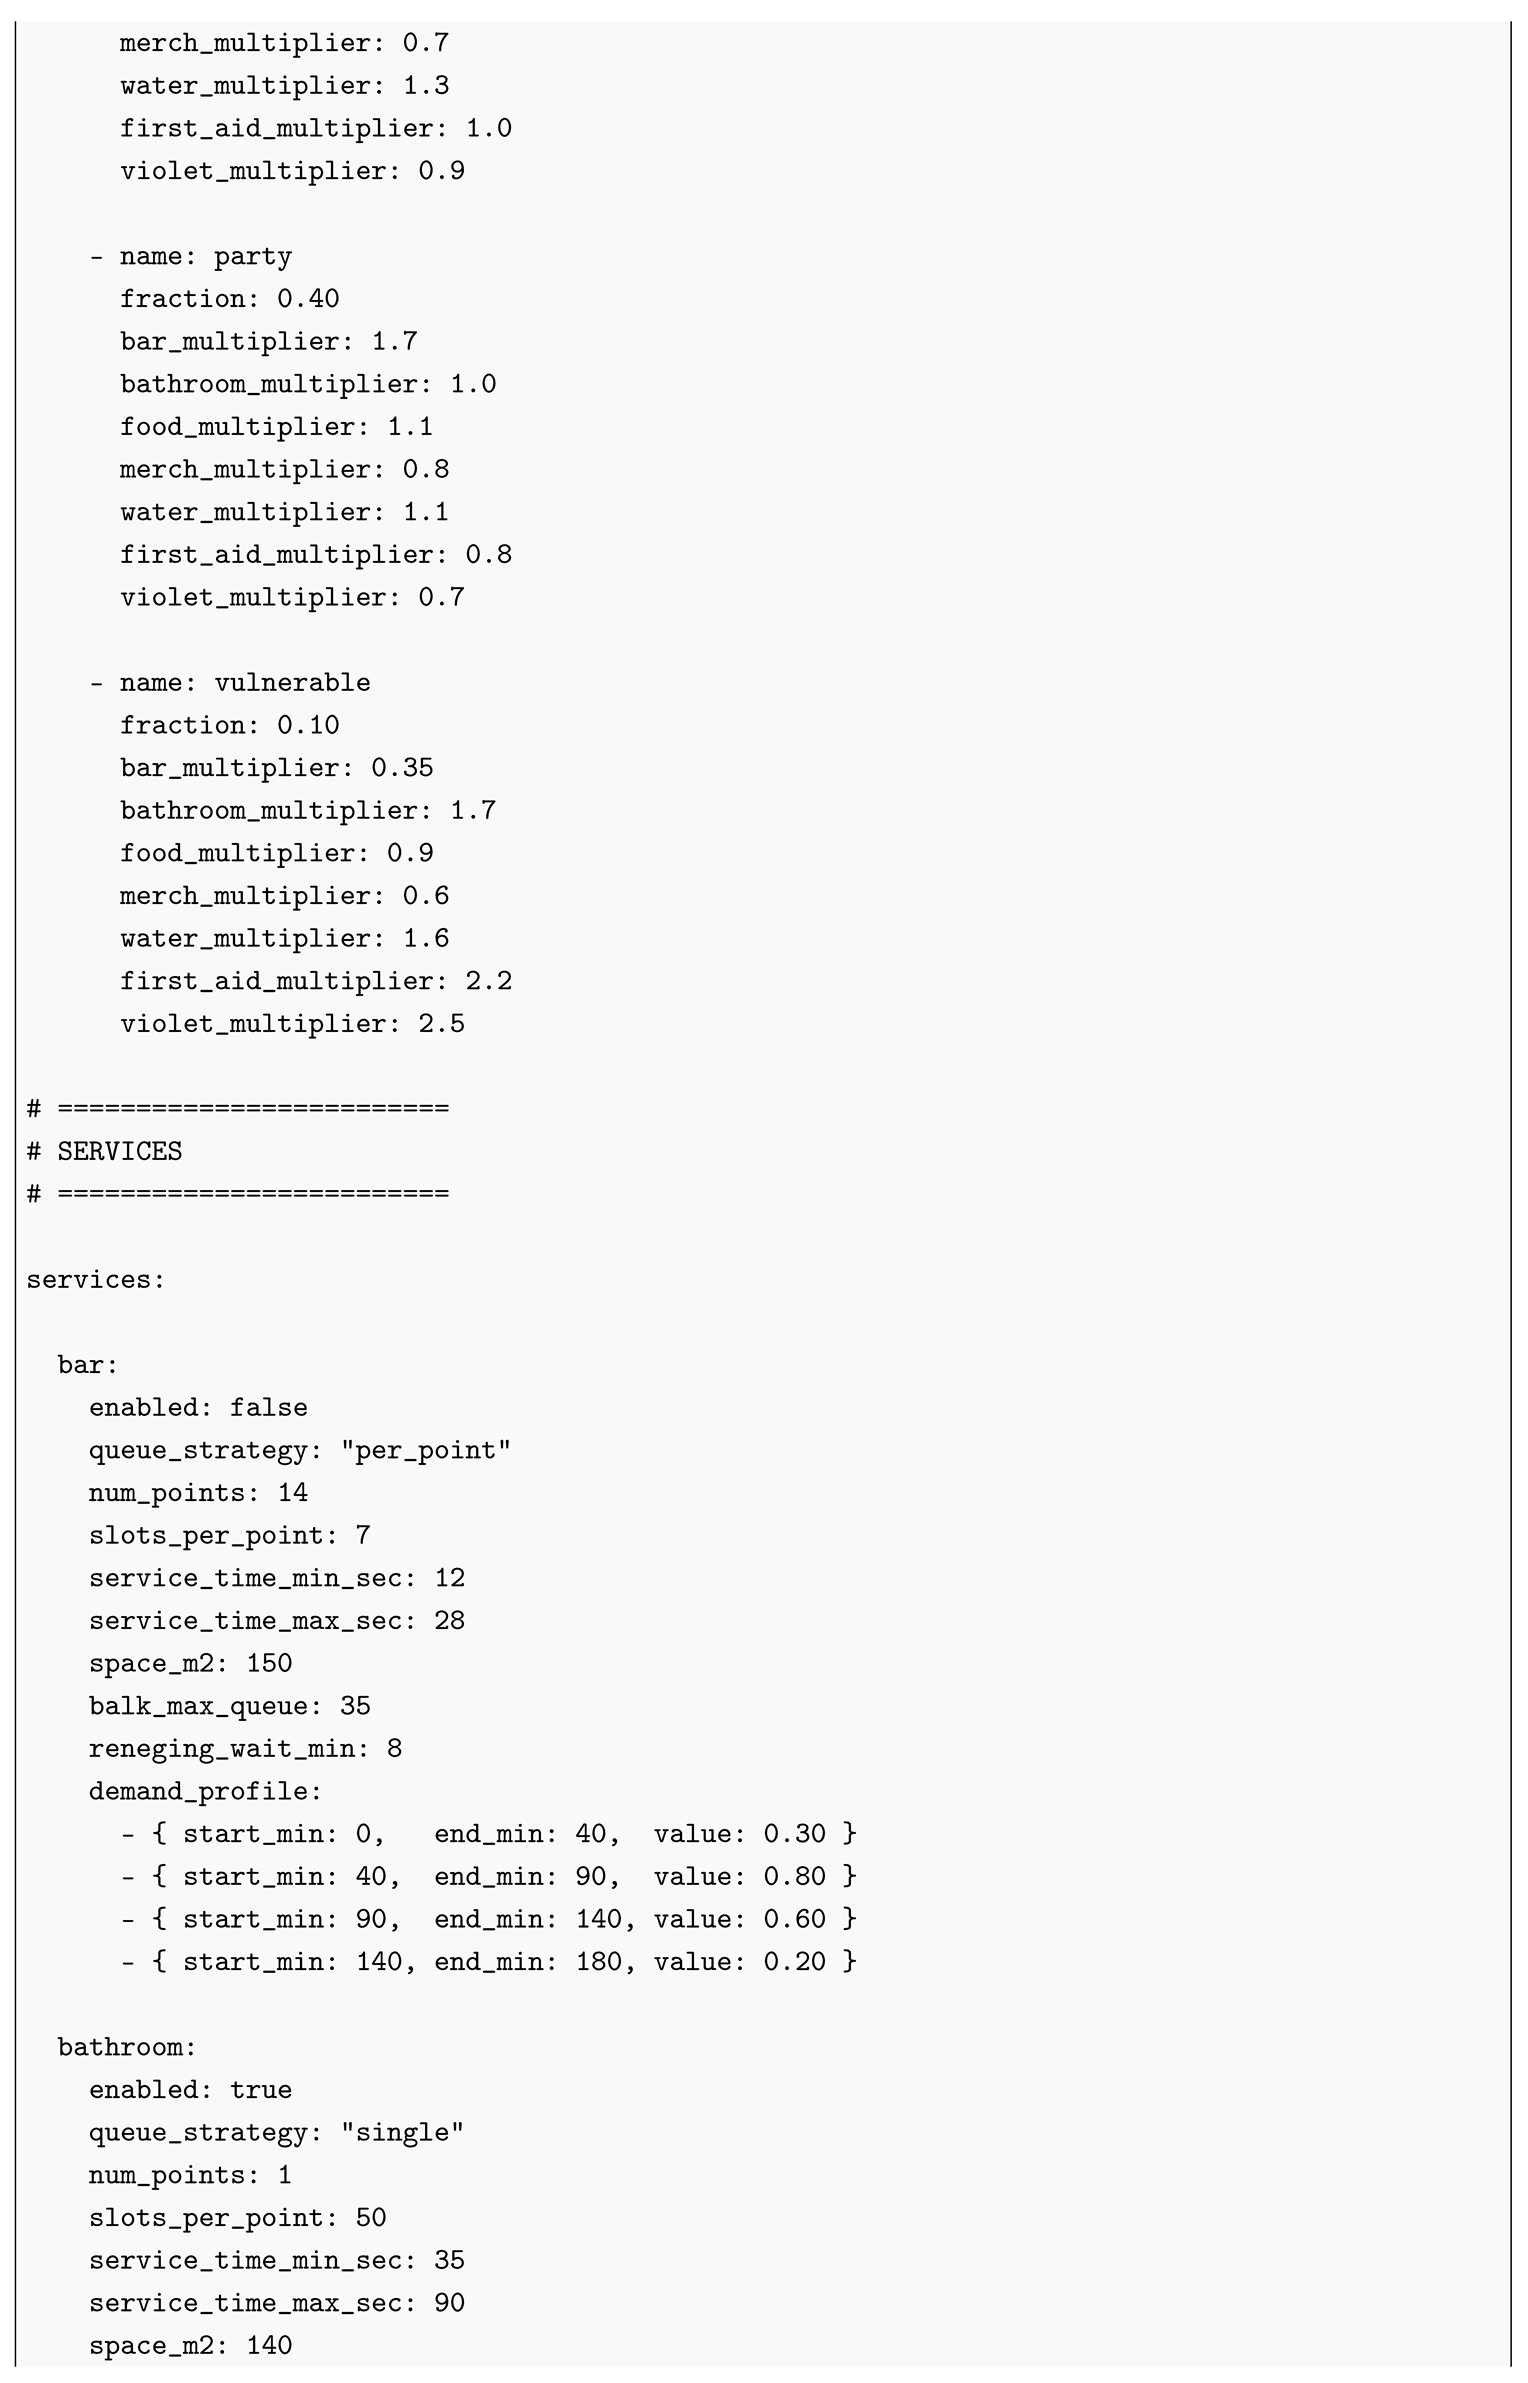
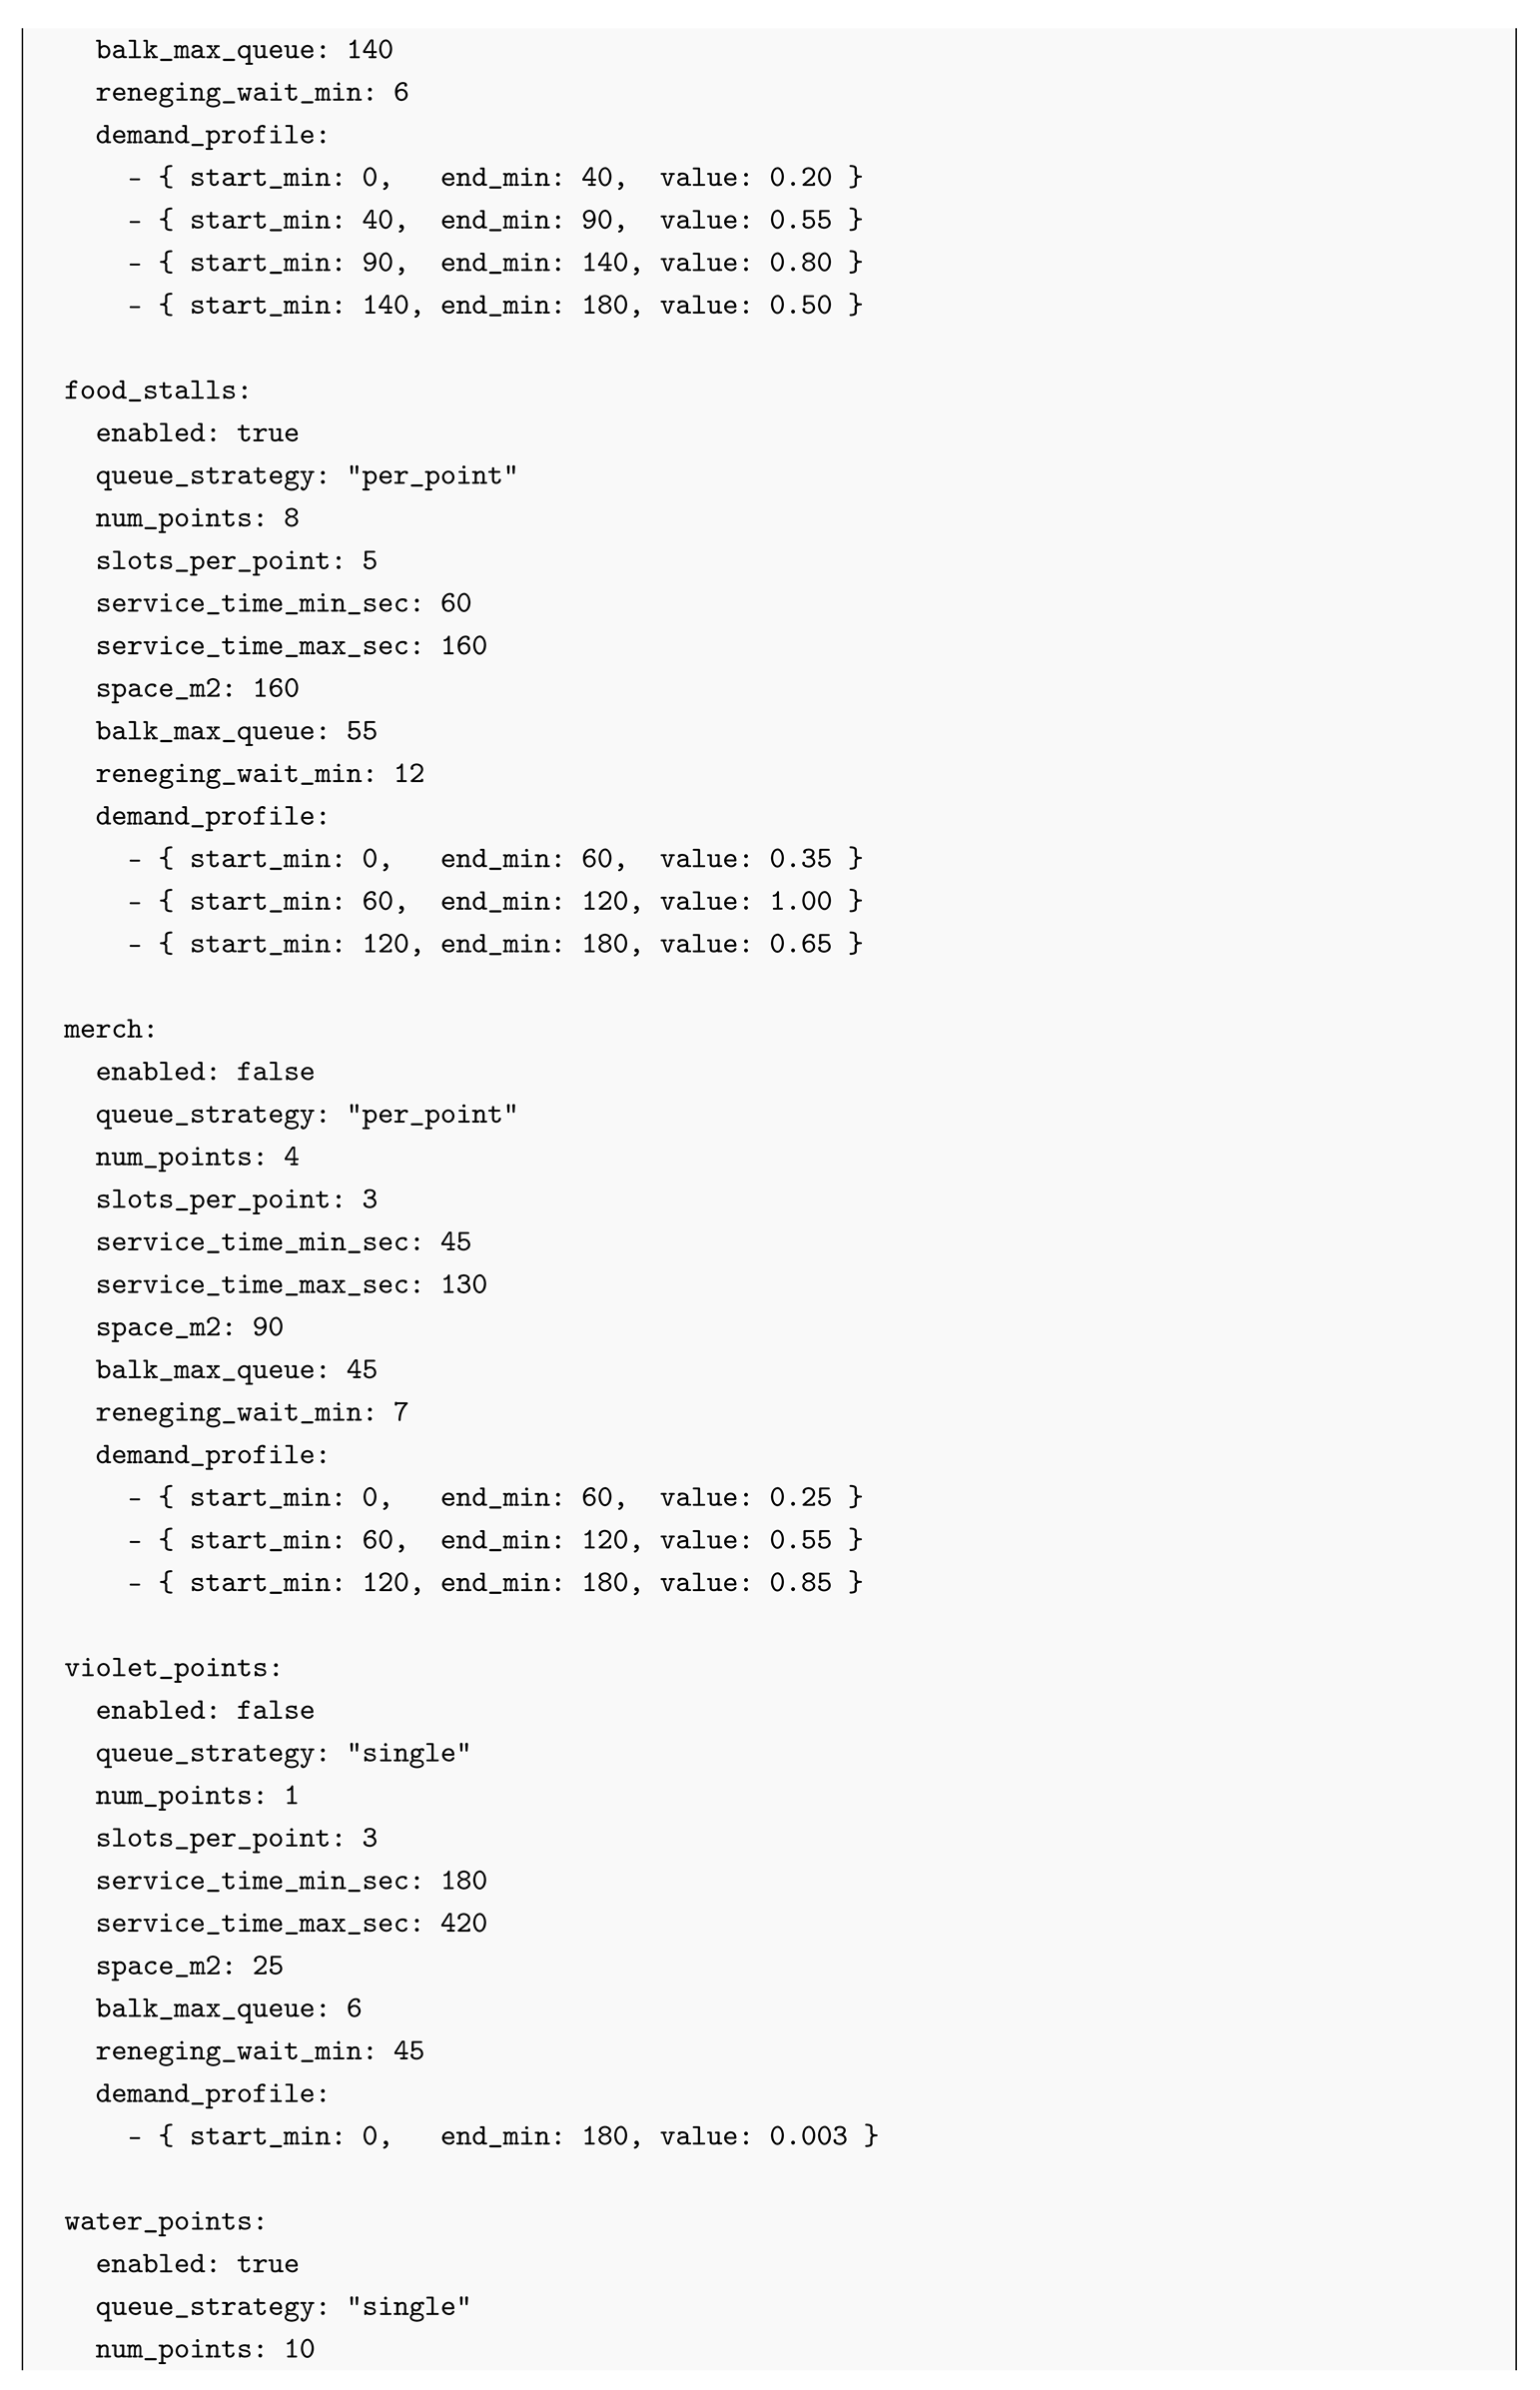
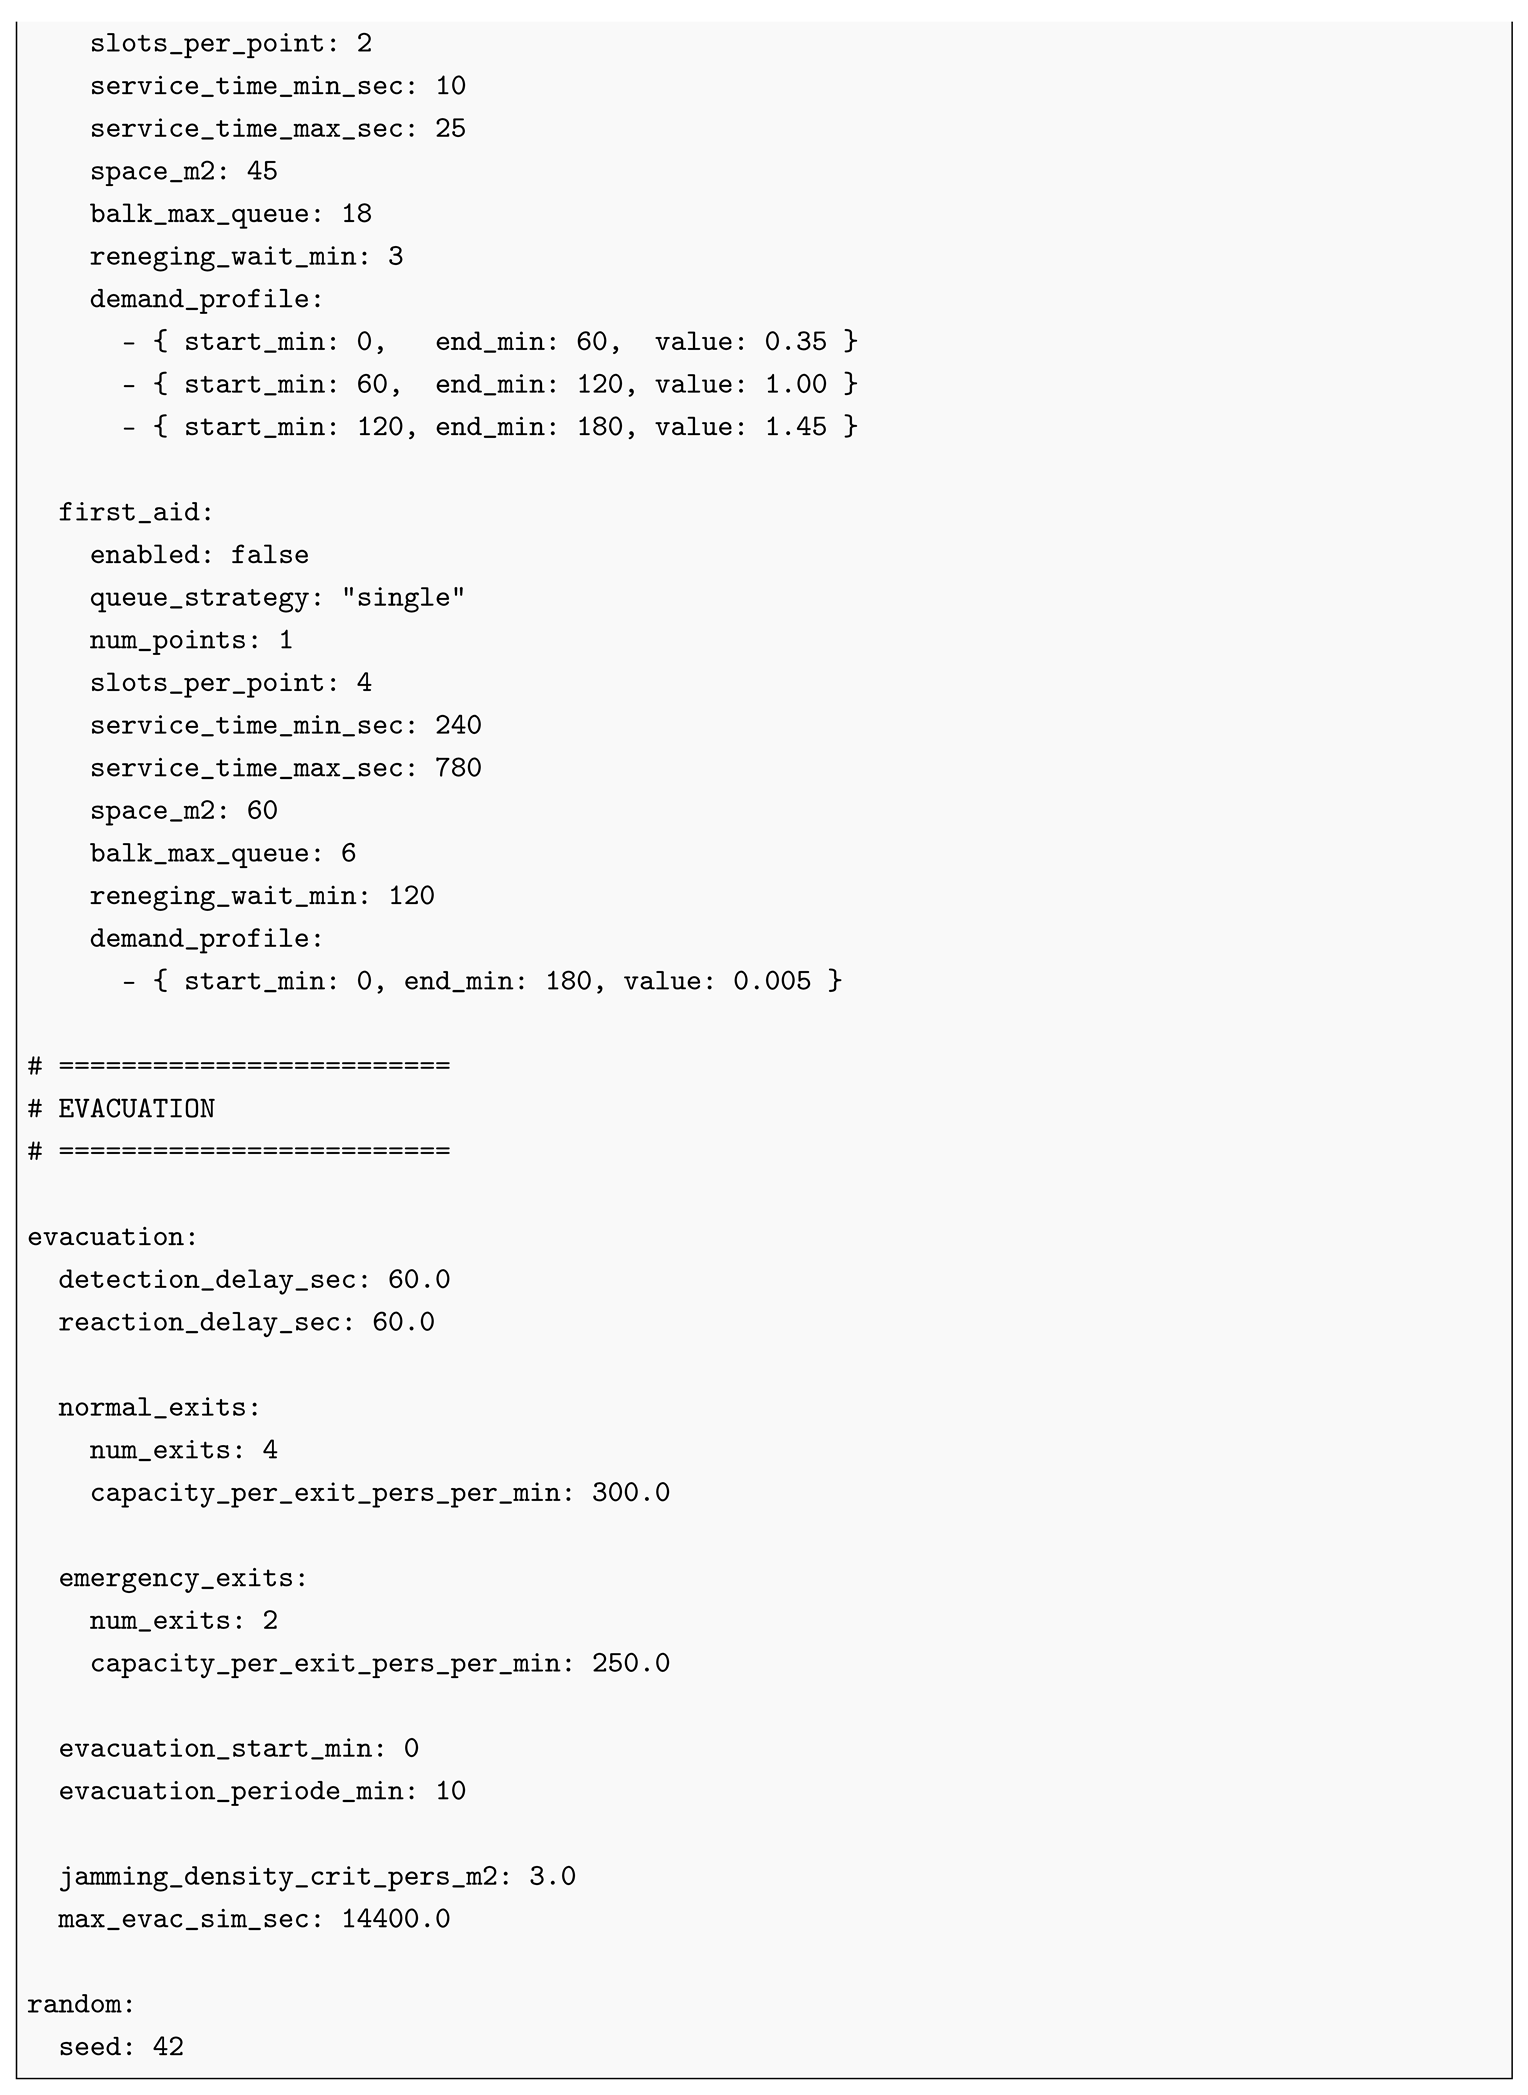
Simulation configuration is managed through structured YAML files that define event characteristics, crowd behavior, service capacities, mobility parameters, and evacuation settings. A complete example of the configuration file used in the experiments is included in Appendix A.2, enabling reproducibility of the evaluated scenarios.
These files act as the single source of truth for initializing the digital twin, ensuring reproducibility, traceability, and controlled scenario definition. The configuration schema is validated using typed data models, ensuring parameter consistency and preventing invalid configurations, which aligns with modular digital twin design principles [13].
Although configuration files can be edited directly, the proposed system enables user-driven modification through the conversational interface and the API-based execution layer. This allows parameters such as attendance levels, arrival profiles, service capacities, and evacuation settings to be updated dynamically while maintaining validation and reproducibility [14,15].
2.3. API-based Execution Layer
The system incorporates an API-based execution layer designed for scalable, modular, and interactive digital twin operation. Such architectures are increasingly recognized as essential for executable and interoperable digital twins in complex urban systems [13,16].
2.3.1. Configuration Management and Validation Layer
All simulation parameters are stored in YAML files and mapped to strongly typed data models using Pydantic [19]. Configuration updates are applied through controlled methods that parse user-provided values, update nested attributes, validate schema constraints, and maintain a temporary state before changes are committed.
This validation layer ensures configuration integrity prior to simulation execution and prevents inconsistent configurations, improving robustness and reproducibility in the decision-support workflow [13].
2.3.2. Simulation Orchestration Via External APIs
The simulation is performed through independent REST APIs, separating configuration, execution, and result processing. Each simulation request receives a unique identifier, enabling traceability, asynchronous retrieval, and management of multiple simulation runs.
This orchestration mechanism supports modular deployment and integration with distributed or cloud-based infrastructures, in line with scalable digital twin execution frameworks [13].
2.3.3. Result Retrieval and Reporting
Simulation outputs are retrieved through dedicated API endpoints and returned as structured data or compressed reports. These outputs include time-series KPIs, performance metrics, visualizations, and downloadable ZIP files.
By associating each result with a simulation identifier, the system ensures traceability and supports iterative analysis. Results are integrated into the user interaction workflow, allowing users to evaluate outcomes and refine scenarios dynamically [14].
2.3.4. End-to-end Execution Pipeline
The complete system operates as an end-to-end API-based execution pipeline:
- 1.
- The user submits a request in natural language.
- 2.
- The LLM interprets the request and selects the appropriate tools.
- 3.
- Configuration parameters are updated, validated, and serialized.
- 4.
- The simulation is launched through external API endpoints.
- 5.
- Results are retrieved, processed, and presented to the user.
2.4. Conversational AI Interface
The conversational AI interface provides a natural language layer that allows users to configure, execute, and analyze simulations without direct access to the underlying system components.
2.4.1. Large Language Model Integration
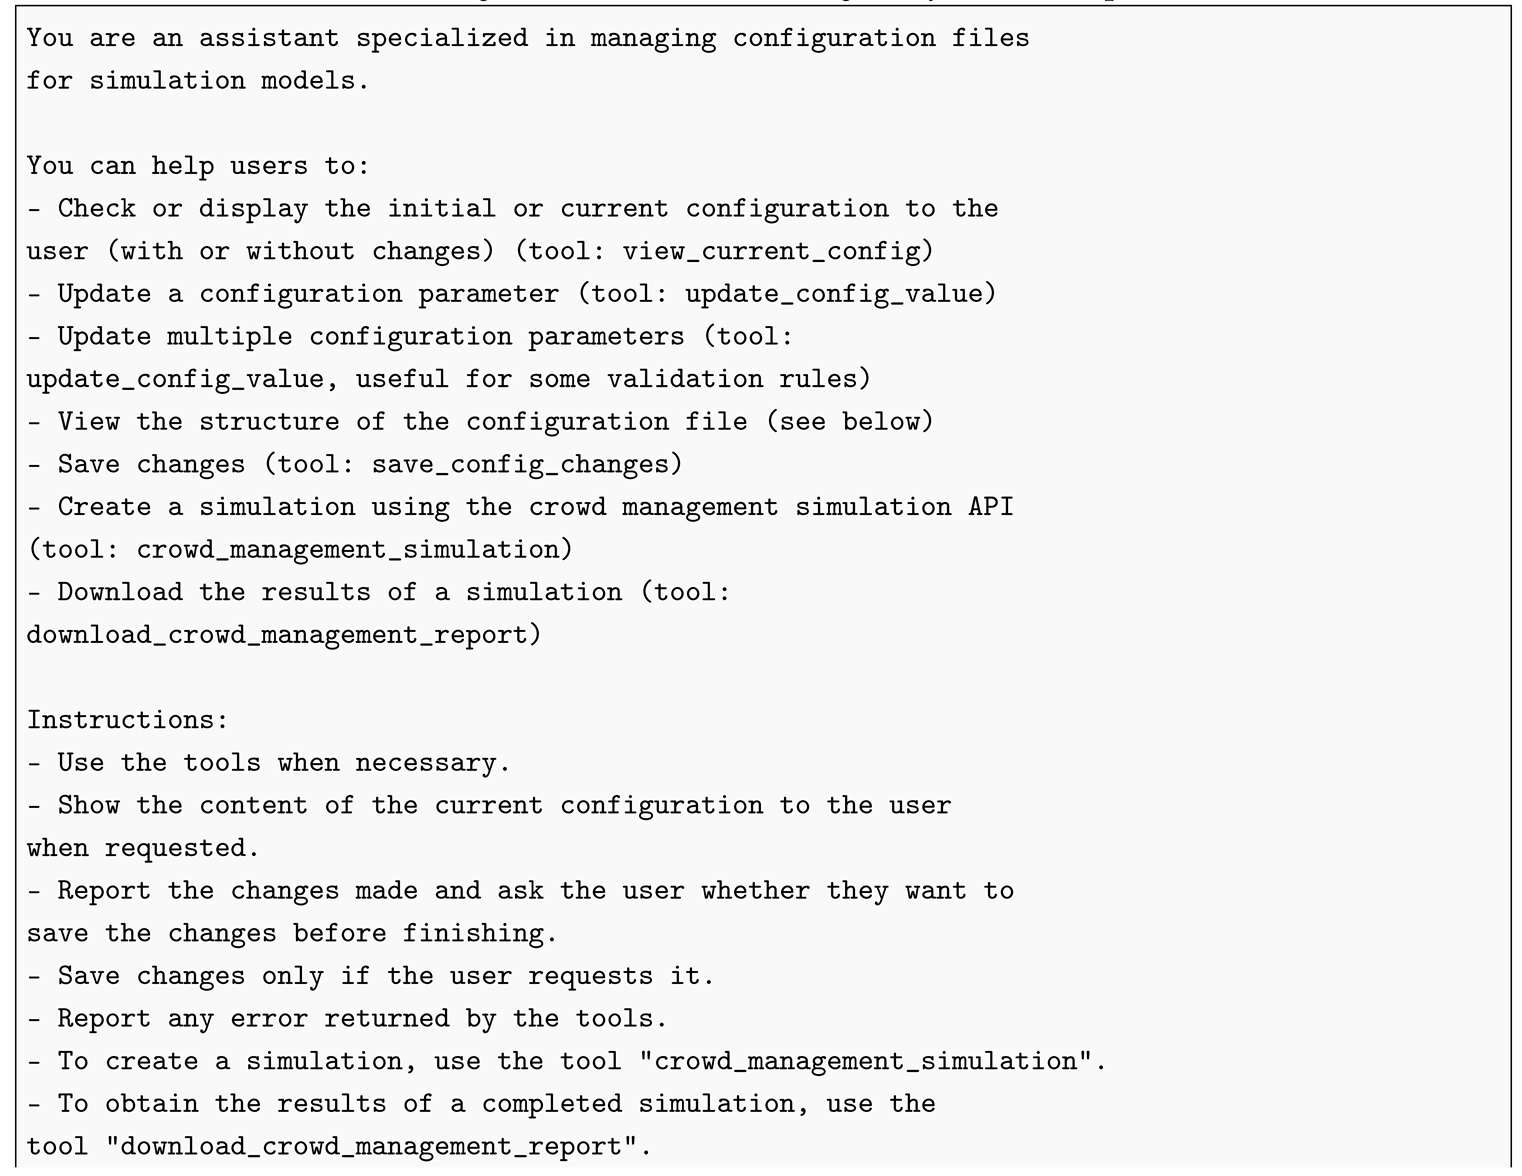
The agent is powered by Gemini 2.5 Flash Lite (Google AI), a low-latency large language model capable of structured reasoning and tool-based interaction. The model is configured through a system prompt that encodes the structure of the simulation configuration and the available system operations. The complete definition of the system prompt, including the available tools and interaction constraints, is presented in Appendix A.1.
Gemini 2.5 Flash Lite was selected due to its favorable balance between response latency, cost efficiency, and reasoning capabilities. Compared to larger models, it provides sufficiently robust performance for structured task execution (e.g., parameter extraction, configuration mapping, and tool selection) while maintaining low inference times, which is critical for interactive systems requiring near real-time feedback. Additionally, its native support for function calling and structured outputs makes it particularly suitable for integration within API-based execution pipelines, where precise and controllable interactions with external services are required.
Rather than generating unconstrained outputs, the model operates under a function-calling paradigm, mapping user requests to predefined tools such as configuration inspection, parameter modification, simulation execution, and report retrieval. This controlled action space improves reliability while preserving the flexibility of natural language interaction [10,14].
2.4.2. Natural Language Configuration Workflow
User commands are processed through a structured workflow in which the LLM infers intent, extracts relevant parameters, selects the appropriate tool, and triggers configuration updates or simulation execution. This behavior is exemplified in Figure A4, Figure A5 and Figure A6, where the system translates operational objectives and constraints into structured configuration modifications.
This workflow enables iterative scenario definition without requiring users to edit YAML files or use domain-specific syntax. By integrating reasoning, parameter extraction, and execution within a single loop, the system reduces the need of technical knowledge associated with traditional simulation environments [10,20].
2.4.3. Conversational Agent Implementation
The interface is implemented using Chainlit [17], which manages user sessions, message history, and asynchronous communication with backend services. The core logic is encapsulated in a custom agent that maintains configuration state, exposes invocable tools, orchestrates interactions with APIs, and integrates tool responses into the conversational flow.
This design supports multi-step workflows and iterative scenario refinement, in line with emerging LLM-driven agent frameworks for controlling complex systems [18,21]. Figure A7 illustrates this behavior through a multi-turn interaction in which the user defines, refines, and executes a simulation scenario.
2.5. Data Visualization
The system provides visualization capabilities to interpret simulation outputs through quantitative metrics, time-series plots, and scenario reports. Instead of relying on external geospatial visualization platforms, the system generates lightweight and reproducible visual artifacts directly from simulation outputs.
2.5.1. Time-series Visualization of System Dynamics
Simulation snapshots are processed to generate time-series visualizations of crowd density, occupancy, queue sizes, and estimated waiting times. They are implemented using Matplotlib [22], applying smoothing through moving averages to reduce stochastic noise while preserving relevant trends.
These plots enable the identification of congestion peaks, service saturation, and recovery phases throughout the duration of the event.
2.5.2. Service Performance and KPI Visualization
Aggregated KPIs are computed from simulation snapshots, including average and maximum queue lengths, service level, balking and reneging rates, and density-based congestion indicators.
These metrics are presented through structured reports and summary plots, enabling comparison across alternative scenarios and supporting the identification of service bottlenecks and critical operational regimes.
2.5.3. Evacuation Scenario Visualization
Evacuation scenarios are visualized through occupancy curves representing the evacuation of the population following an emergency event. Each curve captures the pre-evacuation delay, controlled evacuation flow, and complete clearance of the venue.
Multiple scenarios can be compared to evaluate evacuation efficiency, bottleneck formation, and safety margins under different configurations.
2.5.4. Integration with the Conversational Interface
Generated plots and reports are returned through the conversational interface as downloadable artifacts. This integration allows users to evaluate results, refine configurations, and rerun simulations within an interactive decision-support loop.
This integration reinforces the role of the digital twin as an interactive decision-support tool rather than a static simulation environment.
2.6. Infrastructure and Deployment
The backend follows a modular and service-oriented architecture that supports both local execution and cloud deployment.
2.6.1. System Architecture
The backend is organized as a set of loosely coupled components that communicate through RESTful APIs. The main components include the conversational interface, the configuration management layer, and external simulation services.
The conversational interface is deployed using a FastAPI application [23] integrated with Chainlit. Simulation execution is delegated to an independent API that receives validated configuration files and returns simulation identifiers and results, enabling maintainability and integration with heterogeneous computational backends.
2.6.2. Local Development Environment
2.6.3. Development and Deployment Environment
During the TRL-4 prototyping phase, the system was initially developed and functionally validated in a local environment to facilitate rapid integration and iterative testing. However, the operational deployment and execution environment was based on cloud infrastructure using Amazon Web Services (AWS), enabling scalable API execution and remote interaction between subsystems.
The development and deployment environment includes:
- Local development environment: Standard workstation used for prototyping, debugging, and preliminary validation of simulation workflows and conversational interactions.
- Cloud infrastructure: AWS-based deployment environment leveraging two Amazon ECS Fargate services. One dedicated to the execution of the simulation API and another to the conversational agent. Both orchestrated through an Application Load Balancer for scalable and reliable request routing.
- Software stack: Python 3.10, FastAPI 0.120.1, Chainlit 2.6.2, and Pydantic 2.12.4.
- Simulation framework: Custom Python modules implementing discrete-time crowd dynamics and service system modeling.
Simulation results, including performance metrics and visual artifacts, are generated through the cloud-based execution environment and delivered through the conversational interface.
2.7. Experimental Setup
The experimental setup was designed to validate the behavior of the crowd simulation engine under different operational conditions, focusing on service performance, congestion dynamics, and evacuation efficiency.
2.7.1. Simulation Scenarios
Validation experiments were conducted using a synthetic large-scale event configuration inspired by a real open urban event environment in Las Palmas de Gran Canaria in the context of its annual carnival festivities. The simulation is based on a venue with a fixed area where crowd density and service demand vary according to the number of attendees. Three representative scenarios were defined:
- Baseline scenario: A nominal operating condition with 30,000 attendees and sufficient service capacity, resulting in stable crowd dynamics with limited congestion and acceptable service levels.
- High-demand scenario: An increase in attendance to 50,000 individuals within the same spatial constraints, leading to higher crowd densities and service saturation, with noticeable queue buildup across multiple service points.
- Emergency evacuation scenario: A full-capacity configuration (50,000 attendees) in which evacuation is triggered at predefined time instants, evaluating clearance times and congestion effects under constrained exit capacities.
Each scenario was executed multiple times with stochastic variability in arrival patterns and service demand distributions. This approach enables the evaluation of system robustness, variability in key performance indicators, and sensitivity to demand fluctuations, providing a more realistic representation of crowd behavior under uncertain and dynamic conditions.
2.7.2. Performance Metrics
Simulation outputs were evaluated using aggregated KPIs derived from time-series snapshots, providing a quantitative assessment of system performance under different operational regimes. Detailed values of these indicators, including service-level breakdowns and complete scenario results, are included in Appendix B. The main metrics include:
- Average and maximum occupancy,
- Crowd density (persons per square meter),
- Average and maximum queue lengths per service,
- Estimated waiting times,
- Service level (served versus demand),
- Balking and reneging rates,
- Evacuation clearance times.
These metrics provide a comprehensive and interpretable characterization of system performance, enabling the identification of congestion patterns, service inefficiencies, and critical operational conditions under different demand scenarios.
3. Results
3.1. Simulation Results and Behavioral Analysis
3.1.1. Baseline Scenario Validation
The baseline scenario represents normal operating conditions with 30,000 attendees in a fixed-area venue and sufficient service capacity. Under these conditions, the system exhibits stable crowd dynamics characterized by moderate densities and minimal congestion.
Given a fixed spatial domain, crowd density is defined as:
where D is the average density (persons/), N is the number of attendees, and A is the total accessible area.
To contextualize the obtained results, widely adopted reference thresholds from the literature and official guidelines for large-scale event planning are considered. In particular, densities above 4 persons/ are regarded as critical conditions requiring active management, while values exceeding 5 persons/ are associated with potentially dangerous situations, including crowd compression phenomena and loss of control [24,25].
In addition to spatial density metrics, service performance is evaluated using the utilization factor , commonly employed in queueing theory to characterize the relationship between demand and available service capacity:
where represents the arrival rate, the service rate of each server, and c the number of available service points. Values of indicate stable operating conditions in which the system capacity is sufficient to absorb incoming demand, while values approaching or exceeding unity indicate saturation conditions and potential queue growth.
Observed density values remained within safe operational limits, with localized peaks occurring only near service points. Most systems operated below the saturation level (), with values close to unity only for services with high demand or low resources, including bars, bathrooms, first aid, and violet points.
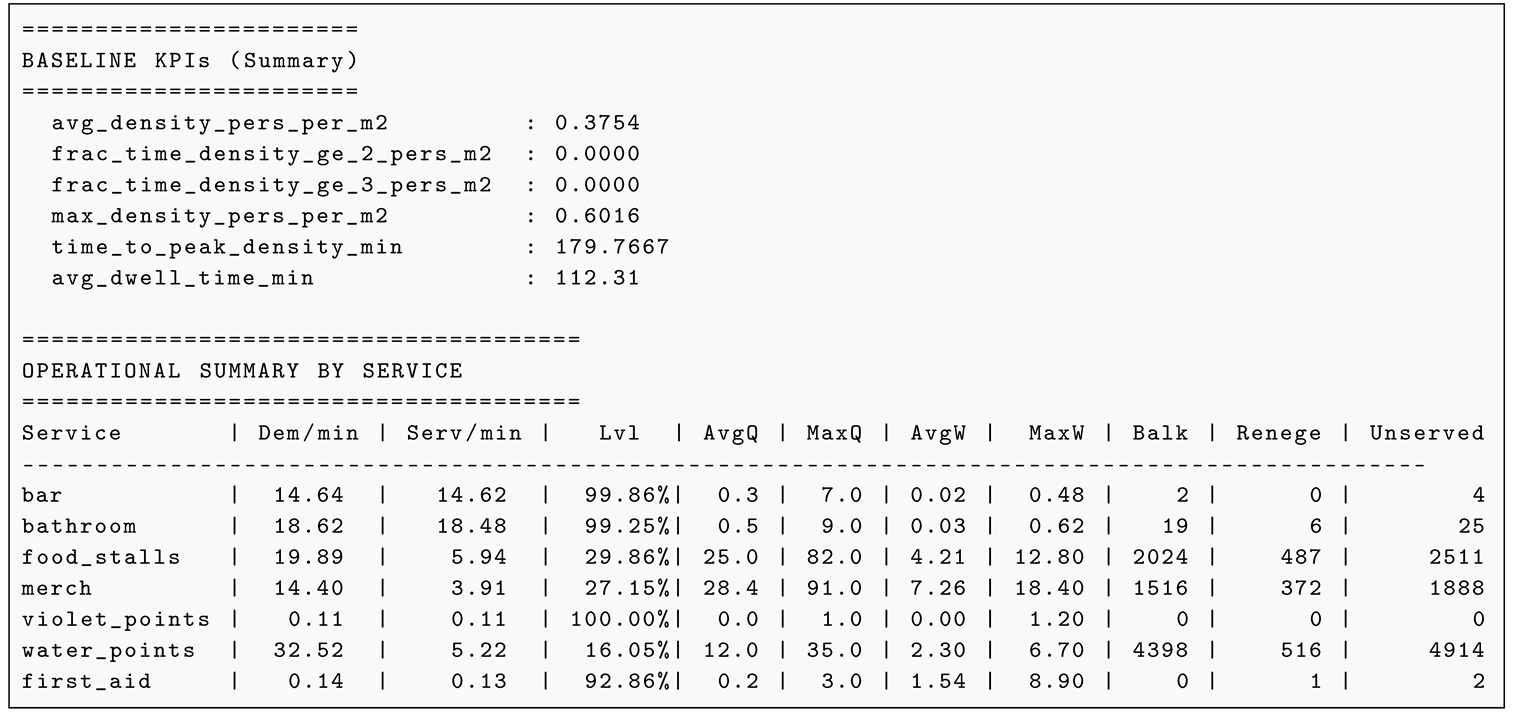
A complete breakdown of aggregated KPIs and operational metrics by service is presented in Appendix B.1.
The values presented in Table 1 confirm this stable behavior. Most services exhibit utilization levels below unity, indicating that the installed capacity is sufficient to absorb demand without generating persistent queue accumulation.
In particular, services such as food services and merchandising present values of and , respectively, reflecting substantial operational slack. However, these same services show moderate average waiting times (4.21 min in food services and 7.26 min in merchandising), suggesting the presence of localized accumulations associated with temporal variability in demand.
In contrast, services such as bathrooms and bars exhibit near-zero waiting times, confirming adequate size and efficient operation. In the case of violet points (), the balance between demand and capacity does not translate into significant congestion.
Overall, these results indicate that the system operates in a subcritical regime, characterized by global stability, absence of systemic congestion, and sufficient capacity to absorb local demand fluctuations.
3.1.2. Waiting Time Analysis in the Baseline Scenario
This section analyzes waiting time behavior in the baseline scenario. Individual service plots are presented to observe the temporal evolution of queues in a disaggregated manner and detect localized accumulations that may not be captured in aggregated metrics.
As shown in Figure 2, waiting times remain low and do not exhibit sustained growth throughout the simulation. In the case of food services (Figure 2(a)), localized peaks are observed, reaching values close to the maximum reported in Table 1, but these do not persist or generate sustained queue accumulation.
Bathrooms (Figure 2(b)), in contrast, exhibit nearly stationary behavior, with values close to zero and only isolated fluctuations. This pattern is consistent with the observed utilization levels (), where service capacity is sufficient to absorb demand without generating congestion.
Overall, the results confirm that the system operates in a subcritical regime, characterized by temporal stability in waiting times and the absence of structural queue accumulation.
3.1.3. High-demand Scenario Analysis
The high-demand scenario increases attendance to 50,000 individuals under the same spatial constraints, leading to significantly higher density levels and increased pressure on service systems.
As density scales with attendance, the system transitions from a stable regime to one dominated by congestion, where increased agent interactions reduce mobility and amplify local inefficiencies. Maximum densities approach critical thresholds, negatively affecting both comfort and flow efficiency.
Service systems experience saturation (), leading to persistent queue accumulation and a significant increase in waiting times. This behavior is indicative of queue instability, where arrival rates exceed service capacity, resulting in nonlinear degradation of system performance.
Table 2 quantifies this regime shift. All services reach or exceed the saturation threshold (), with water points () and food services () standing out, indicating insufficient service capacity relative to demand.
The increase in waiting times is markedly nonlinear compared to the baseline scenario. For instance, food services increase from 4.21 minutes to 12.40 minutes, representing an increase of over 190%. Similarly, water points and merchandising experience significant increases, consolidating their role as the main system bottlenecks.
In contrast, services such as bars and bathrooms, although also reaching values close to or above unity, maintain relatively moderate waiting times. This suggests that congestion is not uniformly distributed, but rather concentrated in services with higher relative demand or lower effective capacity.
Overall, these results demonstrate the transition to a congested regime, characterized by persistent queues, nonlinear increases in waiting times, and the formation of structural bottlenecks within the system.
3.1.4. Waiting Time Analysis in the High-Demand Scenario
This section presents the temporal evolution of waiting times under high-demand conditions. This approach enables the identification of bottleneck services and the analysis of queue formation and persistence dynamics, complementing the aggregated metrics presented earlier.
Figure 3 illustrates the saturation dynamics identified in Table 2. In food services (Figure 3(a)), a sustained increase in waiting time is observed throughout the simulation, accompanied by high peaks approaching the reported maximum (28.70 min). This pattern reflects a regime in which the arrival rate continuously exceeds service capacity, preventing queue dissipation.
At water points (Figure 3(b)), the behavior shows greater temporal variability, with pronounced fluctuations in waiting times. These oscillations suggest the presence of dynamic effects associated with partial queue accumulation and release, characteristic of highly congested systems.
In both cases, the persistence of high values and the absence of recovery phases confirm that the system operates in a saturated regime, where bottlenecks are structurally maintained and dominate overall system behavior.
3.1.5. Emergency Evacuation Dynamics
The emergency evacuation scenario evaluates system response under dynamic occupancy conditions, with evacuation triggered at different time instants and for varying levels of accumulated occupancy.
The analysis focuses on the temporal evolution of crowd evacuation, including occupant outflow dynamics, congestion formation near exits, and overall clearance times under different occupancy levels. Unlike the baseline operational scenarios, evacuation conditions introduce highly dynamic and transient crowd behaviors, where localized bottlenecks and route competition may significantly affect system performance.
From an evacuation engineering perspective, system performance is evaluated using the Required Safe Egress Time (RSET) framework, which must remain below the Available Safe Egress Time (ASET) to ensure safe conditions throughout the process [26]. In this context, international standards such as NFPA 101 establish design criteria based on evacuation capacity and exit route efficiency, rather than imposing a single maximum evacuation time [27].
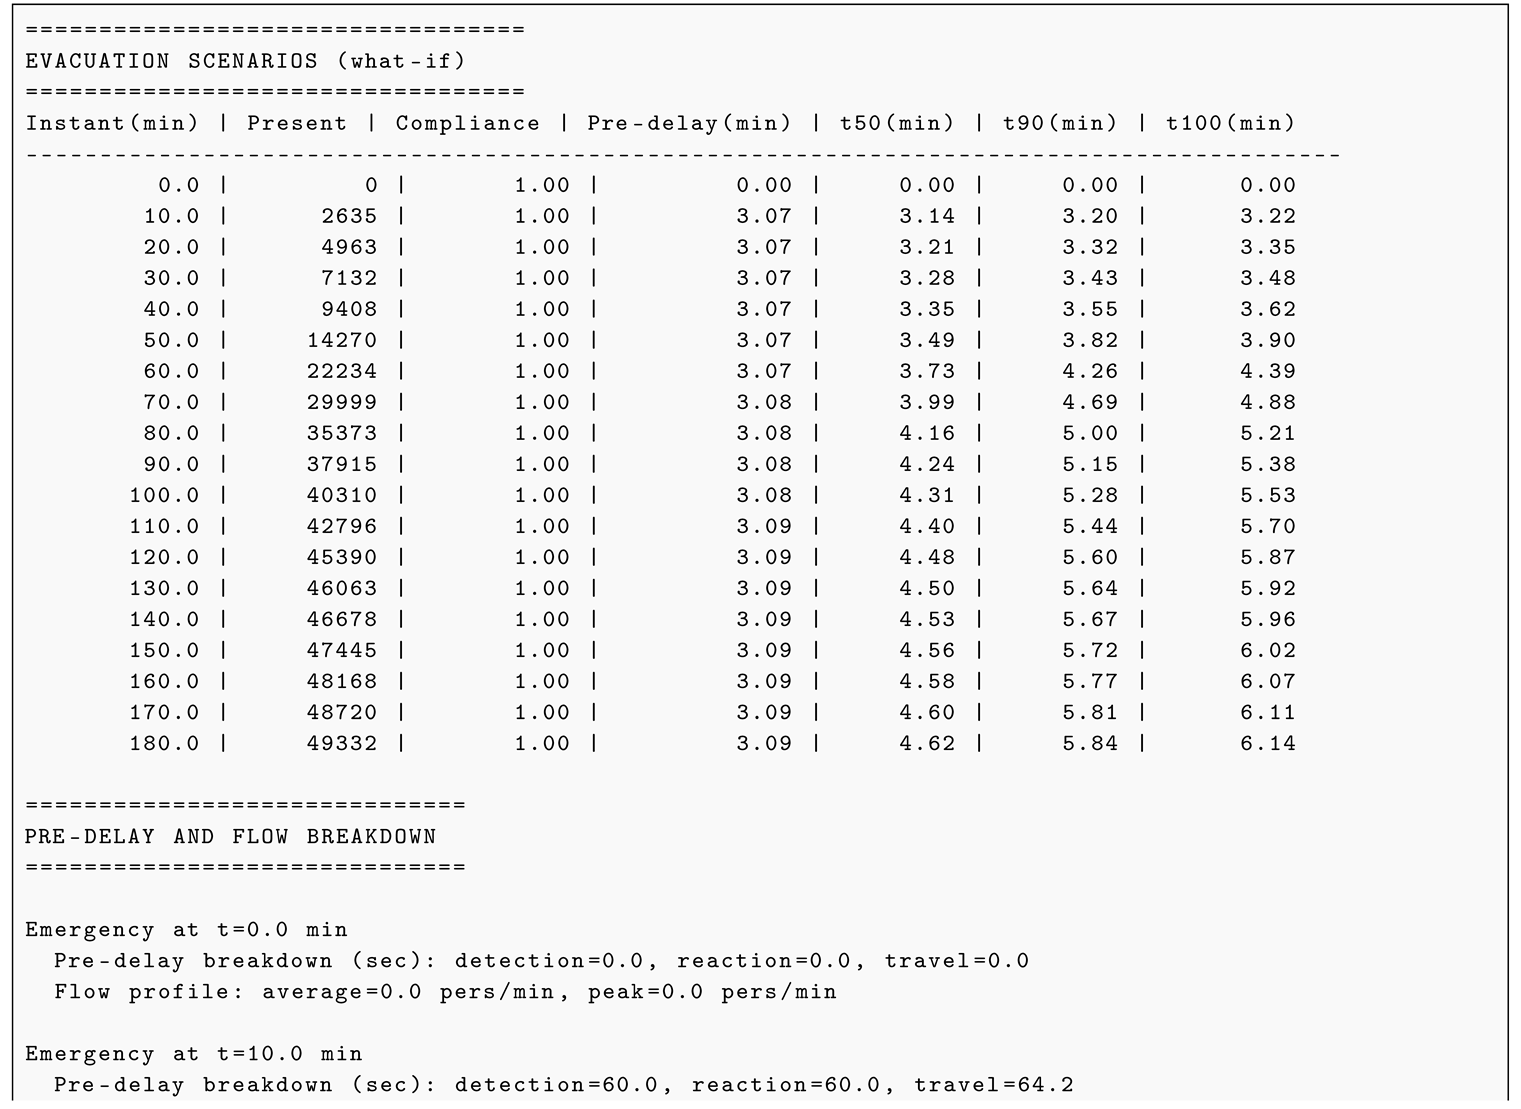
Results show highly consistent system behavior. The total evacuation time () remains within an approximate range of 3.5 to 6.15 minutes, depending on the occupancy level at the time of activation. For high-demand scenarios (up to ∼50,000 attendees), total evacuation time reaches a maximum of 6.15 minutes.
A nearly constant pre-delay of approximately ∼3.07 minutes is also observed, associated with detection, reaction, and evacuation activation times. Once effective evacuation begins, the system exhibits stable dynamics, with gradual increases in characteristic times (, ) as occupancy increases.
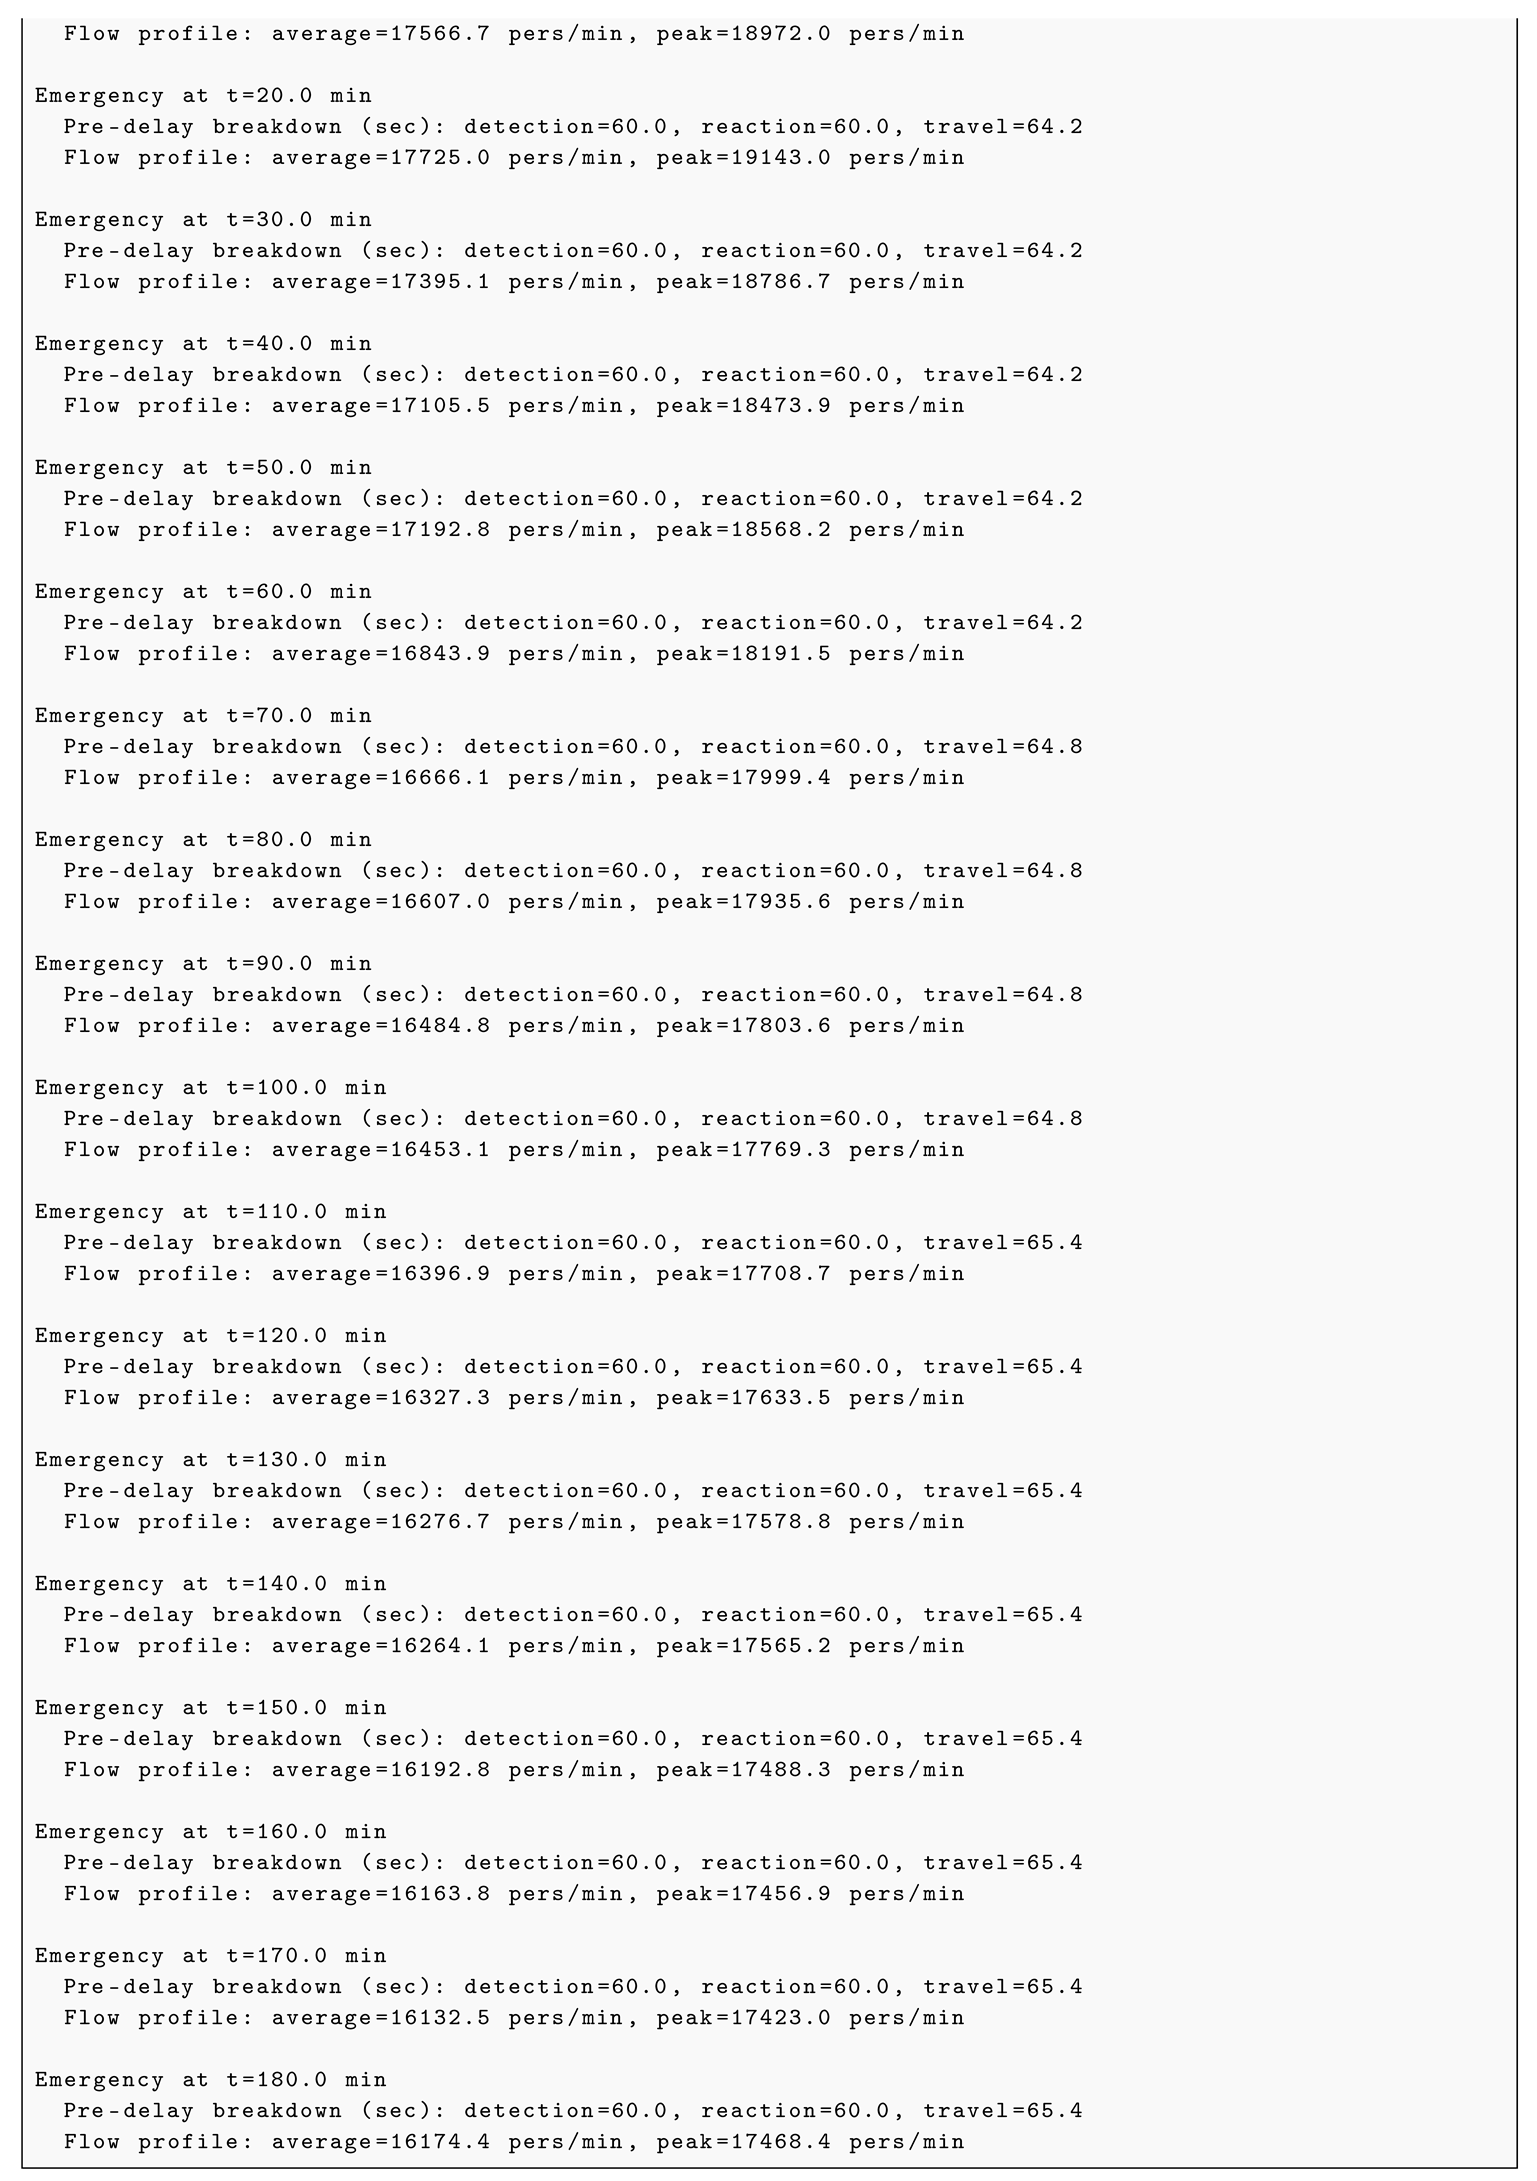
Complete evacuation scenario results, including all simulated time instants and pre-delay breakdown, are detailed in Appendix B.2.
Table 3 shows a progressive increase in characteristic times as occupancy rises. However, this growth is smooth and approximately linear, indicating that evacuation capacity remains stable even under near-maximum occupancy conditions.
Figure 4 provides a dynamic interpretation of this behavior. In Figure 4(a), all curves exhibit an initial flat phase associated with pre-delay, followed by a monotonic decrease in occupancy. The slope of the curves remains relatively constant, with slight irregularities reflecting local variations in evacuation flow.
Figure 4(b) shows that although total evacuation times increase with occupancy, differences between scenarios are not abrupt. This behavior suggests that the system maintains an approximately constant evacuation flow, with no evidence of systemic congestion even under maximum occupancy conditions.
Overall, the results indicate that the system responds robustly under evacuation scenarios, maintaining stable dynamics, controlled evacuation times, and the absence of structural bottlenecks.
3.2. API-Based Execution and System Behavior
3.2.1. Configuration Execution Flow
The proposed system is structured as an API-based execution pipeline, where simulation scenarios are defined, modified, and executed through structured configuration files (YAML) and programmatic endpoints.
The execution flow follows four main stages: (i) configuration generation or modification, (ii) validation, (iii) simulation execution, and (iv) result retrieval. Each stage is exposed through API endpoints, enabling modular, asynchronous, and decoupled interaction between system components.
Let be the total execution time:
Empirical measurements show that the configuration and validation stages introduce negligible overhead compared to the simulation execution time. Table 4 summarizes the average execution times across the different scenarios.
These results indicate that system performance is dominated by simulation execution time, while the overhead associated with the API remains minimal. This confirms that the proposed architecture enables efficient interaction with the digital twin without introducing significant latency, supporting near-real-time scenario exploration.
3.2.2. Scenario Reconfiguration Results
The system enables dynamic reconfiguration of simulation parameters through structured YAML updates, which can be triggered programmatically or through the conversational interface. These capabilities are qualitatively illustrated in Appendix C, where examples of direct parameter modification, multi-intent changes, optimization with constraints, and temporal redistribution of arrivals are shown.
The main modified parameters include:
- Number of attendees (N)
- Service capacity ()
- Arrival rate distributions ()
- Evacuation triggers and exit capacities
To evaluate reconfiguration performance, multiple scenario transitions were tested (Baseline, High Demand and Evacuation). Table 5 presents the average reconfiguration and execution response times.
The results demonstrate that scenario updates are applied with negligible latency, while execution times remain consistent across configurations. This stability confirms that the system supports rapid what-if analysis and iterative scenario exploration without performance degradation, even under substantial configuration changes.
3.2.3. Response Consistency and Robustness
To evaluate system robustness, each scenario was executed 10 times with stochastic variations in arrival patterns and service demand.
Let be a key performance indicator (e.g., evacuation time or average queue length). Variability is quantified using the coefficient of variation:
where is the mean and is the standard deviation.
Table 6 summarizes variability in key metrics.
The low coefficients of variation indicate stable and reproducible system behavior despite stochastic inputs. No execution failures or inconsistencies were observed across all runs, confirming the robustness and reliability of the API-based execution layer.
Overall, these results demonstrate that the proposed system provides a responsive, stable, and reproducible execution framework, enabling efficient scenario reconfiguration and supporting iterative decision-making in dynamic event management contexts.
3.3. LLM-based Interaction Evaluation
3.3.1. Prompt-to-configuration Translation Accuracy
The conversational interface was evaluated using a set of 30 natural language queries covering configuration modification, simulation execution, and result interpretation.
Each query was processed by the LLM and translated into a structured YAML configuration update or an execution command. Accuracy was measured based on correct intent recognition and parameter extraction. As a qualitative complement to this quantitative evaluation, Appendix C presents ten representative interactions illustrating both correct cases and ambiguous situations and system limitations.

Table 7.
Accuracy in natural language to configuration translation.
| Intent category | Queries | Correct (%) |
|---|---|---|
| Modify attendance (N) | 6 | 6 (100%) |
| Adjust service capacity () | 6 | 6 (100%) |
| Change arrival patterns () | 5 | 4 (80%) |
| Activate evacuation | 4 | 4 (100%) |
| Execute simulation | 5 | 5 (100%) |
| Query KPIs | 4 | 4 (100%) |
| Total | 30 | 29 (96.7%) |
The only inaccuracies observed were associated with ambiguous temporal expressions (e.g., “early arrival peak”), which required clarification. Overall, the system demonstrated high reliability in translating natural language into valid and executable configuration updates, with minimal need for user intervention.
3.3.2. Interaction Robustness
Robustness was evaluated by introducing linguistic variability, including paraphrases, incomplete commands, and ambiguous formulations.
The system maintained stable performance under non-ideal user inputs, successfully handling variations in phrasing and partially specified commands across most interaction categories.
The average response latency for configuration tasks was 1.6 seconds (SD = 0.3 s), while full simulation execution, including API calls, remained consistent with previously reported execution times of approximately 19–21 seconds.
No critical failures were observed; in cases of ambiguity, the system either inferred default values or requested clarification, preventing invalid configurations and ensuring reliable execution.
3.3.3. Qualitative Interaction Analysis
The qualitative evaluation further highlights the system’s ability to support intuitive and iterative interaction workflows. These patterns are detailed in Appendix C, including examples of direct modification, multi-intent understanding, operational abstraction, temporal redistribution, and multi-turn interaction.
Representative examples include direct modification of attendance, adjustment of service capacity, combining multiple instructions within a single query, optimization under constraints, and progressive scenario definition through multi-turn interaction. These cases are illustrated in Figure A1, Figure A2, Figure A3, Figure A4, Figure A5, Figure A6 and Figure A7.
The system consistently generated valid YAML configurations without syntactic errors, ensuring the integration with the execution pipeline.
User interaction patterns revealed that complex scenario definitions can be constructed incrementally through multi-turn interactions, enabling progressive refinement of system configurations. This behavior demonstrates the system’s suitability for exploratory analysis and iterative decision-making. Additionally, the ambiguity and limitation cases presented in Figure A8, Figure A9 and Figure A10 show that the system requires clarification mechanisms when instructions are partially defined, depend on unavailable state information, or express overly abstract objectives.
Overall, the results confirm that the LLM-based interface provides an effective abstraction layer over the simulation engine, enabling non-technical users to interact with complex models while maintaining high levels of accuracy, robustness, and execution consistency.
3.4. System Performance and Scalability
3.4.1. Execution Time Analysis
System performance was evaluated by measuring end-to-end execution time across all stages of the simulation pipeline, including configuration, validation, simulation, and result generation.
The results confirm that execution time is dominated by the simulation engine, with minimal overhead introduced by the API-based execution layer and the conversational interface.
Table 8.
Execution time across different scenarios.
| Scenario | Agents | Mean time (s) | SD (s) |
|---|---|---|---|
| Baseline scenario | 30,000 | 18.5 | 2.1 |
| High demand | 50,000 | 20.3 | 2.4 |
| Evacuation | 50,000 | 21.1 | 2.7 |
The relatively small increase in execution time between scenarios indicates that the additional computational cost is primarily driven by increased agent interactions, rather than structural changes in the simulation model. This behavior suggests that the system maintains stable performance under different operational conditions.
3.4.2. Scalability with the Number of Agents
To evaluate scalability, simulations were executed with different numbers of agents (N), ranging from 10,000 to 60,000 attendees. Empirical results indicate an approximately linear relationship between execution time and the number of agents.
Table 9.
Scalability analysis.
| Agents | Execution time (s) | Time per agent (ms) |
|---|---|---|
| 10,000 | 9.2 | 0.92 |
| 30,000 | 18.5 | 0.62 |
| 50,000 | 20.3 | 0.41 |
| 60,000 | 23.8 | 0.40 |
The decrease in time-per-agent ratio indicates improved computational efficiency at higher loads, likely due to more effective utilization of computational resources within the simulation framework. These results suggest that the system scales efficiently within the evaluated range, enabling large-scale scenario analysis.
3.4.3. Resource Utilization
Resource consumption was monitored during simulation execution in a cloud environment.
- Simulation engine: 4 vCPU, 8 GB RAM; stable CPU utilization (65–85%) during execution
- Conversational interface: 2 vCPU, 4 GB RAM; average response latency of 1.6 seconds for configuration tasks
- Database (PostgreSQL): average storage footprint of 2.1 GB for simulation results (10 scenarios × 10 runs)
No memory bottlenecks or execution failures were observed across all experimental runs, indicating stable resource utilization and reliable system performance under the evaluated load.
4. Discussion
The experimental validation of the proposed TRL-4 system demonstrates both the feasibility and the practical potential of a Generative AI-driven Digital Twin for large-scale urban event management. Beyond simulation accuracy, this work highlights the value of integrating an API-based execution layer with a conversational interface, enabling dynamic scenario configuration and iterative analysis.
4.1. Interpretation of Simulation and System Behavior
The obtained results reveal the existence of different operational regimes depending on demand levels, showing behavior consistent with queueing theory and crowd dynamics.
Under baseline conditions, the system operates in a subcritical regime (), characterized by moderate densities and controlled waiting times. In this context, service capacity is sufficient to absorb demand, preventing persistent queue formation and ensuring stable flow. This behavior confirms well-established results in the literature, where keeping demand below capacity prevents cascading congestion.
In contrast, the high-demand scenario shows a clear transition to a saturated regime (). In this case, proportional increases in attendance generate disproportionate effects on waiting times, reflecting nonlinear degradation in system performance. This phenomenon is particularly evident in services such as food services and water points, where demand consistently exceeds available capacity, leading to structural bottlenecks.
It is important to note that congestion is not uniformly distributed across services. While some reach critical saturation levels, others maintain relatively stable behavior. This heterogeneity is characteristic of complex systems, where the interaction between demand, capacity, and user behavior generates local dynamics that impact overall performance [1,4].
Evacuation scenarios, in turn, exhibit differentiated behavior. Despite the progressive increase in occupancy, the system maintains stable evacuation capacity, reflected in the smooth and approximately linear growth of total evacuation times. This result indicates the absence of systemic congestion during evacuation, even under near-maximum occupancy conditions.
Evacuation curves show a monotonic decrease in occupancy after an initial pre-delay phase, with slight irregularities in the slope. These variations reflect local fluctuations in outflow but do not lead to persistent blockages or bottlenecks, suggesting adequate sizing of evacuation routes.
Overall, the results identify three clearly differentiated operational regimes: (i) a stable regime under baseline conditions, with minimal waiting times and no congestion; (ii) a critical regime under high demand, characterized by saturation and nonlinear queue growth; and (iii) a transitional regime during evacuation, where the system responds robustly and maintains efficient outflow.
From an operational perspective, these findings highlight the ability of the digital twin to anticipate critical conditions, identify bottlenecks, and evaluate management strategies under both normal and extreme scenarios, validating its utility as a decision-support tool in complex environments.
4.2. API-based Execution as a Paradigm Shift
A key contribution of this work is the introduction of an API-based execution pipeline, transforming the digital twin into an executable and interactive system. Unlike traditional approaches focused on static configurations and visualization [1,3], the proposed architecture exposes the full simulation lifecycle (configuration, validation, execution, and result retrieval) through programmatic interfaces.
This design supports modularity, scalability, and interoperability, aligning with emerging service-oriented digital twin paradigms [13,16]. By decoupling system components, it enables independent evolution and integration with external services.
A key advantage is reproducibility: structured YAML configurations ensure consistent and traceable experiments, addressing limitations of traditional workflows. Furthermore, the API enables automated scenario generation and iterative exploration, facilitating scalable what-if analysis and reducing operational overhead. When combined with LLM-driven interaction, high-level user intent can be directly translated into executable actions. This behavior is illustrated in Appendix C, particularly in multi-intent modification, constraint-based optimization, and multi-turn interaction cases.
Conceptually, this architecture advances the notion of “executable digital twins,” where models actively participate in operational workflows. This shift is particularly relevant in dynamic environments such as large-scale event management.
4.3. The Role of LLMs in Democratizing Digital Twins
The integration of a Large Language Model as a conversational interface significantly reduces the technical limitations to interacting with digital twin systems. Unlike traditional simulation environments that require expert domain knowledge [6,7], the proposed approach enables configuration and execution through natural language.
This aligns with recent advances in human–AI interaction [10,11], allowing non-technical users to directly interact with simulation models. By translating user input into structured configurations, the system supports intuitive and user-centered interaction, expanding accessibility. The interactions presented in Appendix C demonstrate how the system enables users to express simple instructions, operational objectives, and constraints in natural language, translating them into concrete configuration changes.
From a decision-support perspective, the interface enables iterative and exploratory workflows, improving situational awareness and facilitating rapid hypothesis validation. Coupled with the API-based execution layer, it enables end-to-end interaction between user intent and system execution.
However, LLM-based interaction introduces limitations related to ambiguity and non-determinism. Although overall robustness is high, variability in input formulation may affect interpretation, highlighting the need for validation mechanisms and controlled interaction design [10,18]. These limitations are illustrated in Figure A8, Figure A9 and Figure A10, showing cases of ambiguity, state dependency, and excessive abstraction.
4.4. System-level Integration and Practical Implications
The integration of simulation, execution, and interaction layers transforms the digital twin into a unified decision-support framework. This enables planners to evaluate scenarios, identify bottlenecks, and optimize resource allocation prior to deployment, improving operational preparedness [8,9,29].
Beyond event management, the architecture is applicable to broader urban scenarios such as emergency planning and infrastructure analysis. Its modular design supports scalability across different contexts, aligning with the transition toward interactive and predictive digital twins in smart city ecosystems [1,2,16].
4.5. Ethical Considerations
The proposed system operates exclusively with synthetic and configurable simulation data, without the use of personal or sensitive information. All experiments were conducted in a controlled laboratory environment corresponding to Technology Readiness Level 4 (TRL-4), ensuring that no real-world individual data was used.
The conversational interface processes user inputs solely for configuration and execution purposes, without persistent storage or secondary use of personal data. The overall architecture is designed to support privacy-preserving deployment in real-world scenarios, aligning with emerging requirements for responsible AI and data protection in smart city systems.
4.6. Limitations of the Current Prototype
Despite the promising results, the current prototype presents several limitations associated with behavioral realism, scalability, interaction robustness, and validation scope.
First, agent-based behavior is intentionally simplified, prioritizing computational scalability over detailed social dynamics such as panic propagation, group cohesion, adaptive routing, or fine-grained interpersonal interactions [6,7]. In addition, the current simulation framework does not explicitly model continuous individual trajectories, relying instead on aggregated flow dynamics and average travel times. While this abstraction improves computational efficiency, it limits the analysis of microscopic phenomena such as collision avoidance, lane formation, or highly localized bottlenecks.
Second, although the system demonstrates stable performance up to 60,000 agents, larger-scale scenarios may require additional computational resources and distributed execution strategies. Similarly, while individual simulation executions remain relatively fast, iterative exploratory workflows involving repeated scenario generation may accumulate latency and affect interactive responsiveness.
Third, the system relies on predefined configuration schemas, which may constrain adaptability to unforeseen scenarios or highly unstructured user requests. Moreover, LLM integration introduces non-determinism and sensitivity to ambiguous formulations, requiring validation and clarification mechanisms to ensure consistent execution [10,11,20]. These limitations are reflected in the examples presented in Appendix C, particularly in ambiguous or non-actionable queries where the system must request clarification or infer default interpretations.
Finally, validation remains limited to controlled TRL-4 conditions using synthetic scenarios, without empirical calibration against real-world observations or real-time data integration [4,5]. Consequently, the current prototype should be interpreted primarily as a proof-of-concept framework demonstrating architectural feasibility and interactive operational capabilities, rather than as a fully validated operational deployment.
Addressing these limitations will require the incorporation of more advanced behavioral models, hybrid simulation approaches, distributed execution infrastructures, and real-time data synchronization mechanisms, representing key directions for future research and system evolution.
4.7. Future Research Directions
Future work will focus on integrating real-time data sources to enable adaptive and synchronized digital twins [1,2,13]. Enhancing behavioral realism through advanced agent models will improve the representation of complex crowd dynamics [6,9,29].
4.8. Summary of Key Insights
This work highlights three key insights. First, crowd dynamics exhibit nonlinear behavior, reinforcing the importance of predictive simulation. Second, API-based execution transforms digital twins into reproducible and scalable systems. Third, LLM-driven interaction enables accessible and user-centered operation. Together, these contributions position the proposed system as an operational and interactive digital twin framework, bridging simulation and decision-making in complex urban environments.
5. Conclusions
This work demonstrates the feasibility and practical potential of a Generative Artificial Intelligence-driven digital twin as an integrated framework for large-scale urban event management. Through the development and validation of a TRL-4 prototype, the proposed system integrates agent-based crowd simulation, an API-based execution layer, and an LLM-powered conversational interface within a unified environment, enabling dynamic configuration, execution, and analysis of crowd scenarios in a seamless and operational manner.
From a simulation perspective, the results confirm that the digital twin effectively captures both stable and critical crowd dynamics under varying demand conditions. The observed transition from balanced operational states to congestion regimes under increasing attendance highlights the inherently nonlinear nature of crowd behavior, reinforcing the value of predictive and executable simulation for proactive planning and decision support. In addition, evacuation scenarios demonstrate the system’s ability to represent both global performance indicators and localized risk conditions, supporting comprehensive safety assessment and capacity planning.
A central contribution of this work lies in the introduction of an API-based execution paradigm that exposes the full simulation lifecycle (configuration, validation, execution, and result retrieval) through programmatic interfaces. This design enables reproducible, modular, and scalable scenario management, and establishes the digital twin as an executable infrastructure rather than a static analytical tool. In this form, the system naturally supports iterative what-if exploration and structured integration into operational workflows.
Complementing this architecture, the LLM-based conversational interface provides an intuitive interaction layer that enables users to engage with complex simulation models through natural language. By translating user intent into structured simulation configurations, the system significantly broadens accessibility, allowing both technical and non-technical users to define, execute, and interpret scenarios without specialized expertise. This contributes to a more inclusive and user-centered paradigm for simulation-driven decision support.
Taken together, these elements form a coherent and robust framework that advances the state of digital twin systems for crowd management. The proposed approach unifies high-fidelity simulation, programmatic execution, and natural language interaction within a single operational environment, enabling scalable scenario exploration and interpretable decision support. In doing so, it establishes a practical foundation for applying digital twins as active components in the management and analysis of complex urban environments, particularly in large-scale event and emergency contexts.
Author Contributions
Conceptualization, E.S.-O. and E.W.-S.; methodology, A.C.-R., M.Á.G.-E. and P.V.-M.; software, N.P.-G.; validation, M.Á.G.-E., P.V.-M. and A.C.-R.; writing-original draft preparation, N.P.-G., A.C.-R. and E.S.-O. All authors have read and agreed to the published version of the manuscript.
Funding
This work has been carried out within the framework of the Spain Living Lab project (Grant Reference 1/1/2024-0412093852— SLLC16-01), funded by the Canarian Agency for Research, Innovation and the Information Society (ACIISI), Department of Universities, Science, Innovation and Culture of the Government of the Canary Islands, under the RETECH Programme, contributing to milestones 251, 252 and 253 of Component 16 of the Recovery, Transformation and Resilience Plan (PRTR), and co-funded by the European Union—Next Generation EU.
Data Availability Statement
The data and code supporting the findings of this study are available from the corresponding author (coordinacionit@canariaslivinglab.org) upon reasonable request.
Conflicts of Interest
Authors Pablo Vicente-Martínez, Adrián Chust-Ros and Nicolás Peñuelas-García were employed by the company SPV Scala. The remaining authors declare that the research was conducted in the absence of any commercial or financial relationships that could be construed as a potential conflict of interest.
Appendix A. System Prompt and Configuration
Appendix A.1. Agent Prompt
The following appendix presents the system prompt used to guide the behavior of the conversational agent. This prompt defines the role of the agent, the available actions, and the interaction constraints, ensuring consistent and structured operation within the proposed architecture.
| Listing A1: Definition of the Agent System Prompt |
|
Appendix A.2. System Configuration File
The following section presents the configuration file used within the system for data preprocessing and model training. This configuration defines the parameters that control feature selection, transformation processes, and training settings.
| Listing A2: YAML Configuration Structure |
|
Appendix B. Output KPIs
Appendix B.1. Baseline and Service KPIs
This section presents the aggregated indicators for the baseline scenario, including density metrics, dwell time, and maximum occupancy. Likewise, the operational summary by service is shown, where variables such as demand, service rate, service level, average and maximum queues, waiting times, and unmet demand are reported.
| Listing A3: Baseline KPIs and operational summary by service |
 |
Appendix B.2. Evacuation KPIs
This section reports the indicators obtained for different evacuation scenarios simulated at different moments of the event. For each scenario, the number of people present, the compliance level, the pre-delay time, and the times required to evacuate 50%, 90%, and 100% of the attendees are shown. In addition, the pre-delay breakdown and the associated outflow profile for each emergency are included.
| Listing A4: Evacuation KPIs and pre-delay breakdown |
|
Appendix C. Representative Examples of Interaction with the LLM
This section presents ten representative examples of interaction with the LLM-based system. These cases were selected to illustrate, in a structured way, the capabilities, level of abstraction, robustness, and limitations of the model in translating natural language into executable configurations.
The examples are classified into five categories: (i) basic capability, (ii) multi-intent understanding, (iii) abstraction, (iv) iterative interaction, and (v) model limitations. Each interaction is accompanied by a figure showing the complete dialogue with the system.
Appendix C.1. Basic Translation Capability
Appendix C.1.1. Direct Parameter Modification
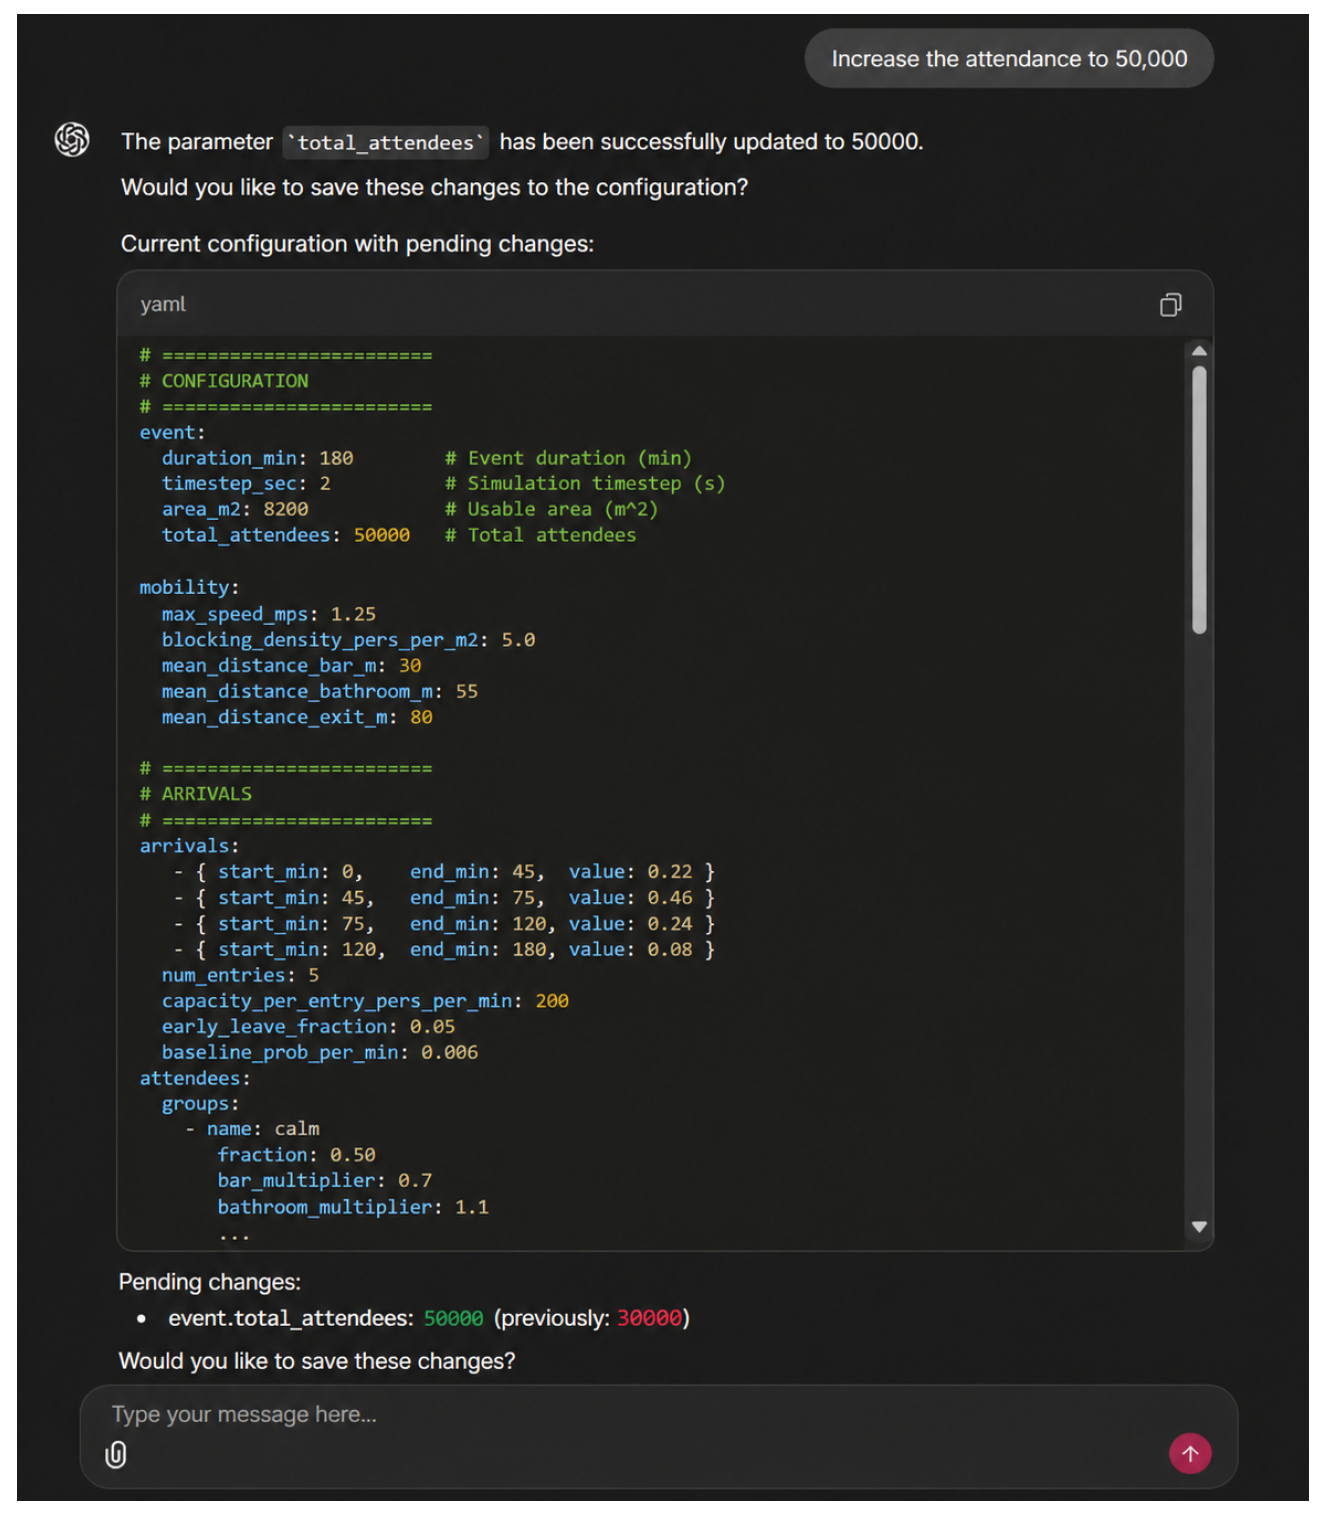
Query: “Increase attendance to 50,000”
This case demonstrates the model’s ability to map simple natural-language instructions to specific system parameters, directly updating the value of total_attendees without ambiguity.
Figure A1.
Interaction for direct attendance modification.
Appendix C.1.2. Service Capacity Adjustment
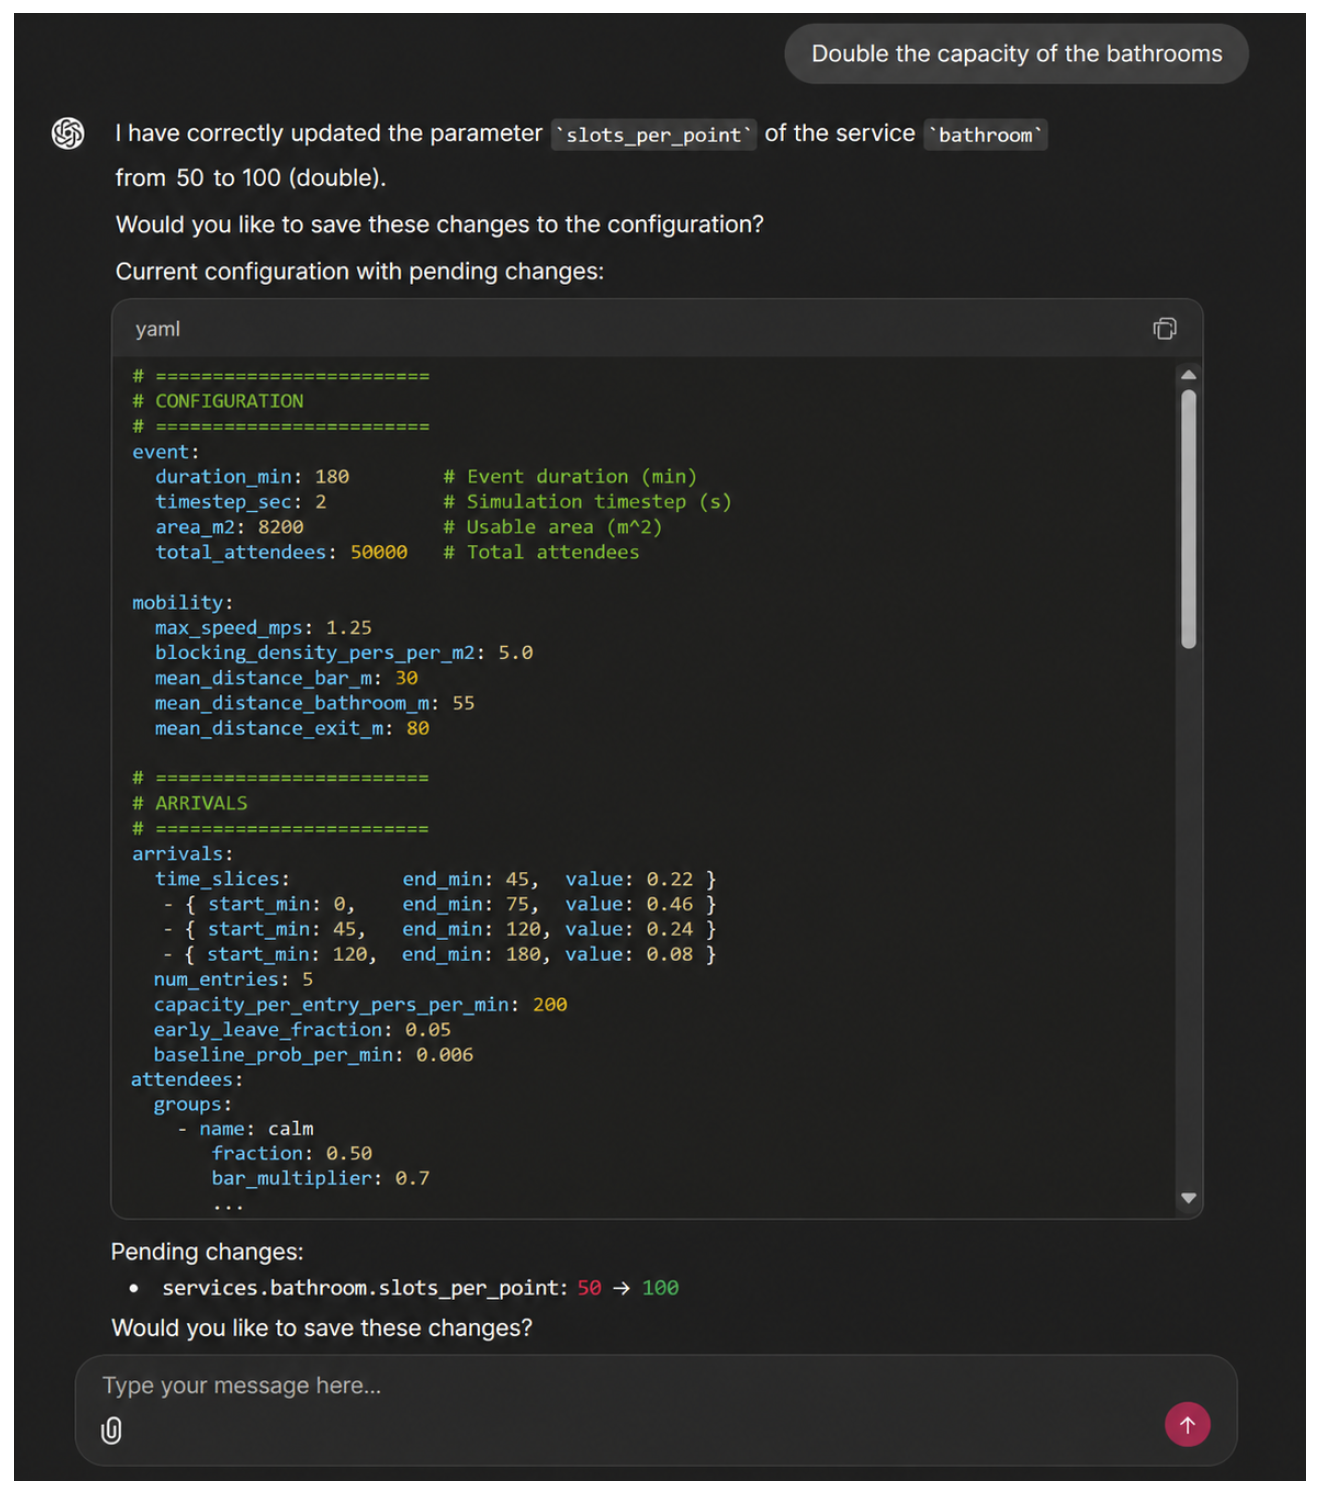
Query: “Double the bathroom capacity”
This example illustrates the correct identification of structural parameters within a specific service, in this case slots_per_point, demonstrating the model’s understanding of the internal system configuration.
Figure A2.
Interaction for service capacity adjustment.
Appendix C.2. Multi-Intent Understanding
Appendix C.2.1. Multiple Parameter Modification
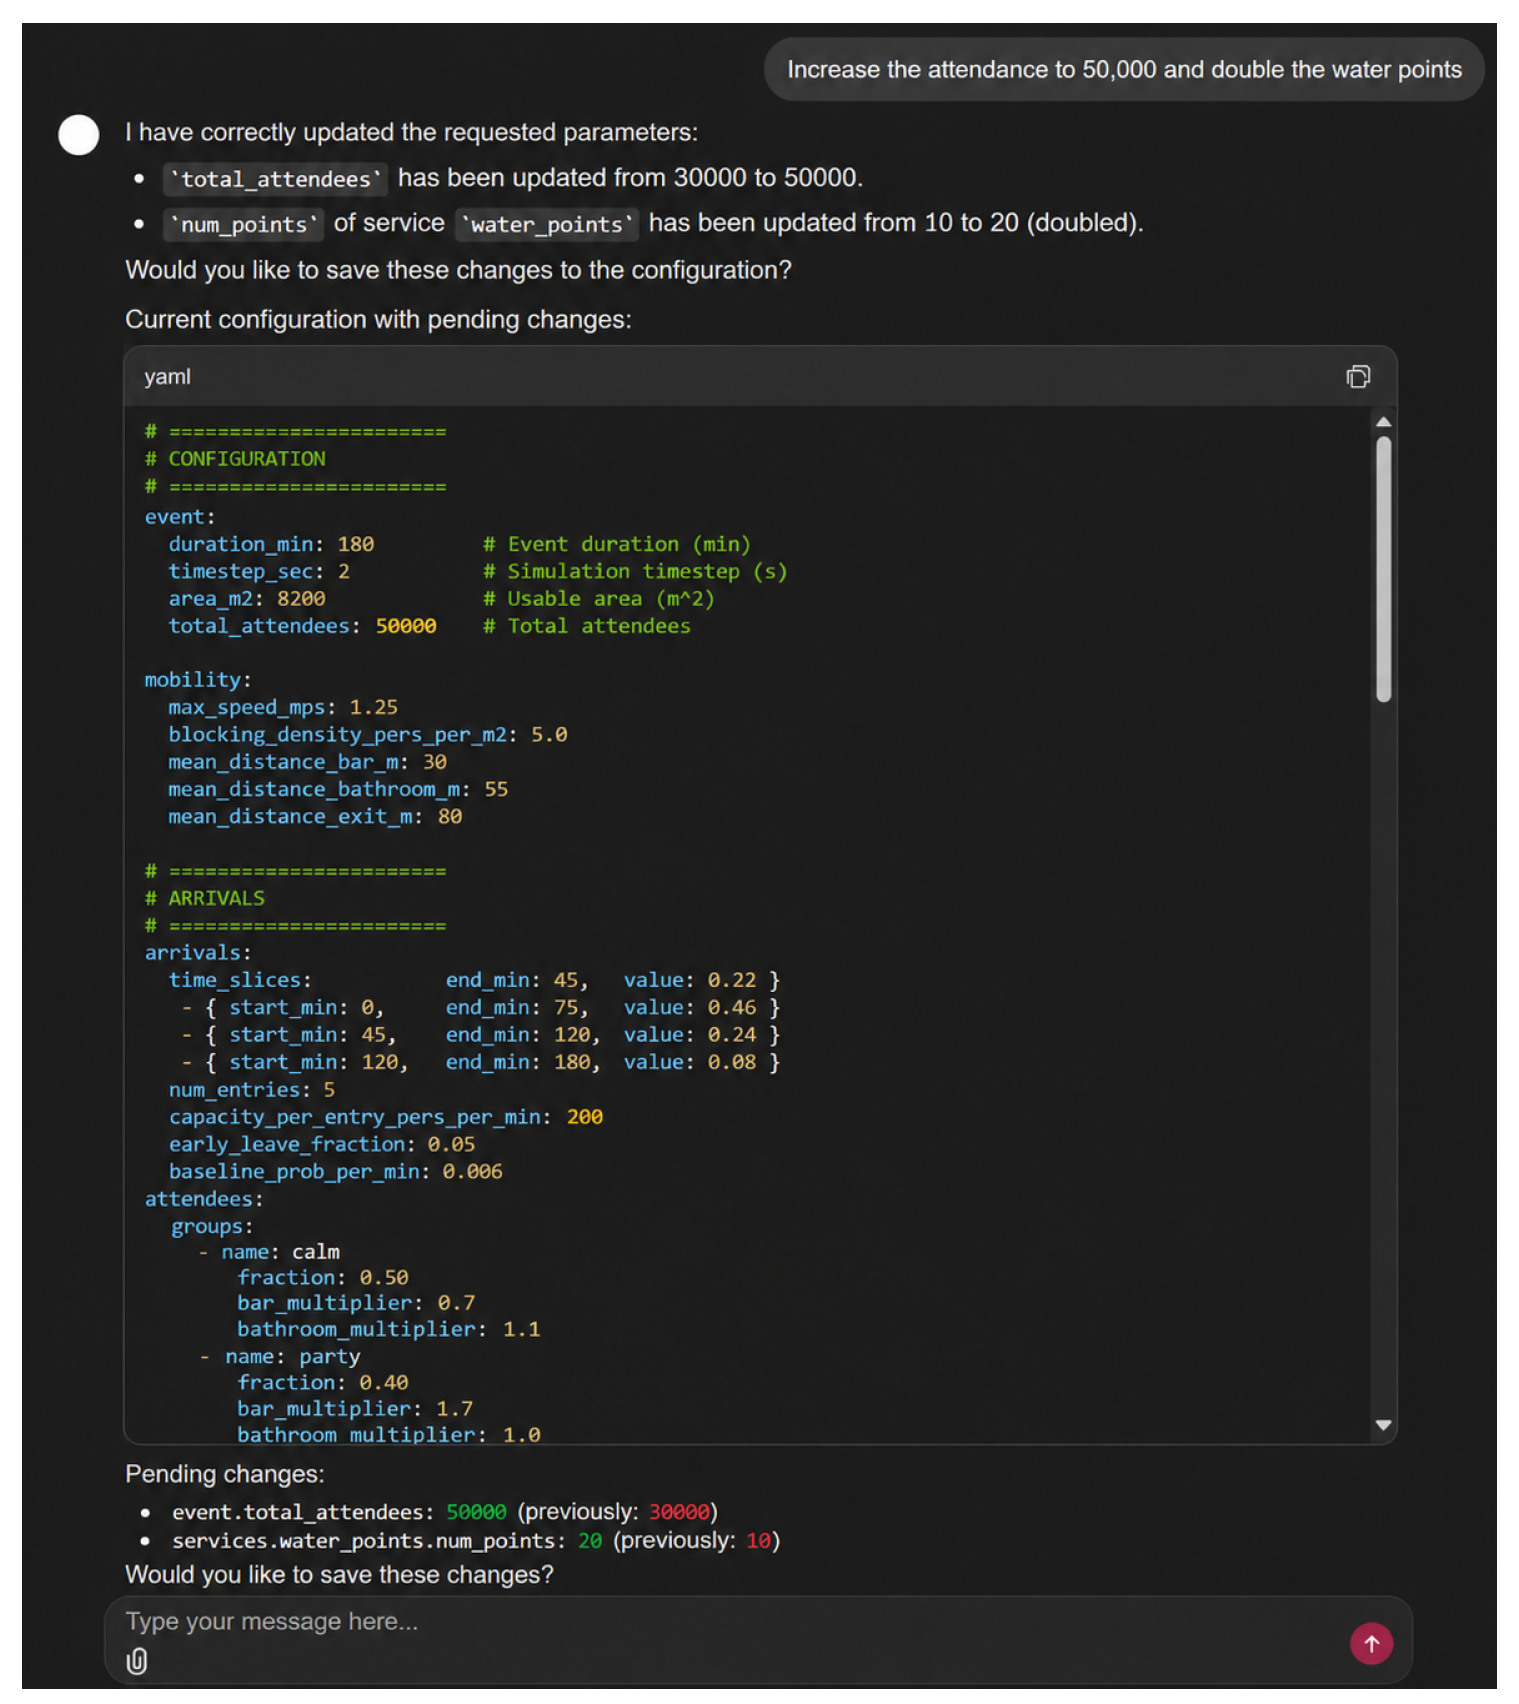
Query: “Increase attendance to 50,000 and double the water points”
This case demonstrates the model’s ability to process multiple instructions within the same query, simultaneously updating different system components in a coherent manner.
Figure A3.
Multi-intent interaction.
Appendix C.3. Abstraction and Reasoning Capability
Appendix C.3.1. Goal-Based Optimization
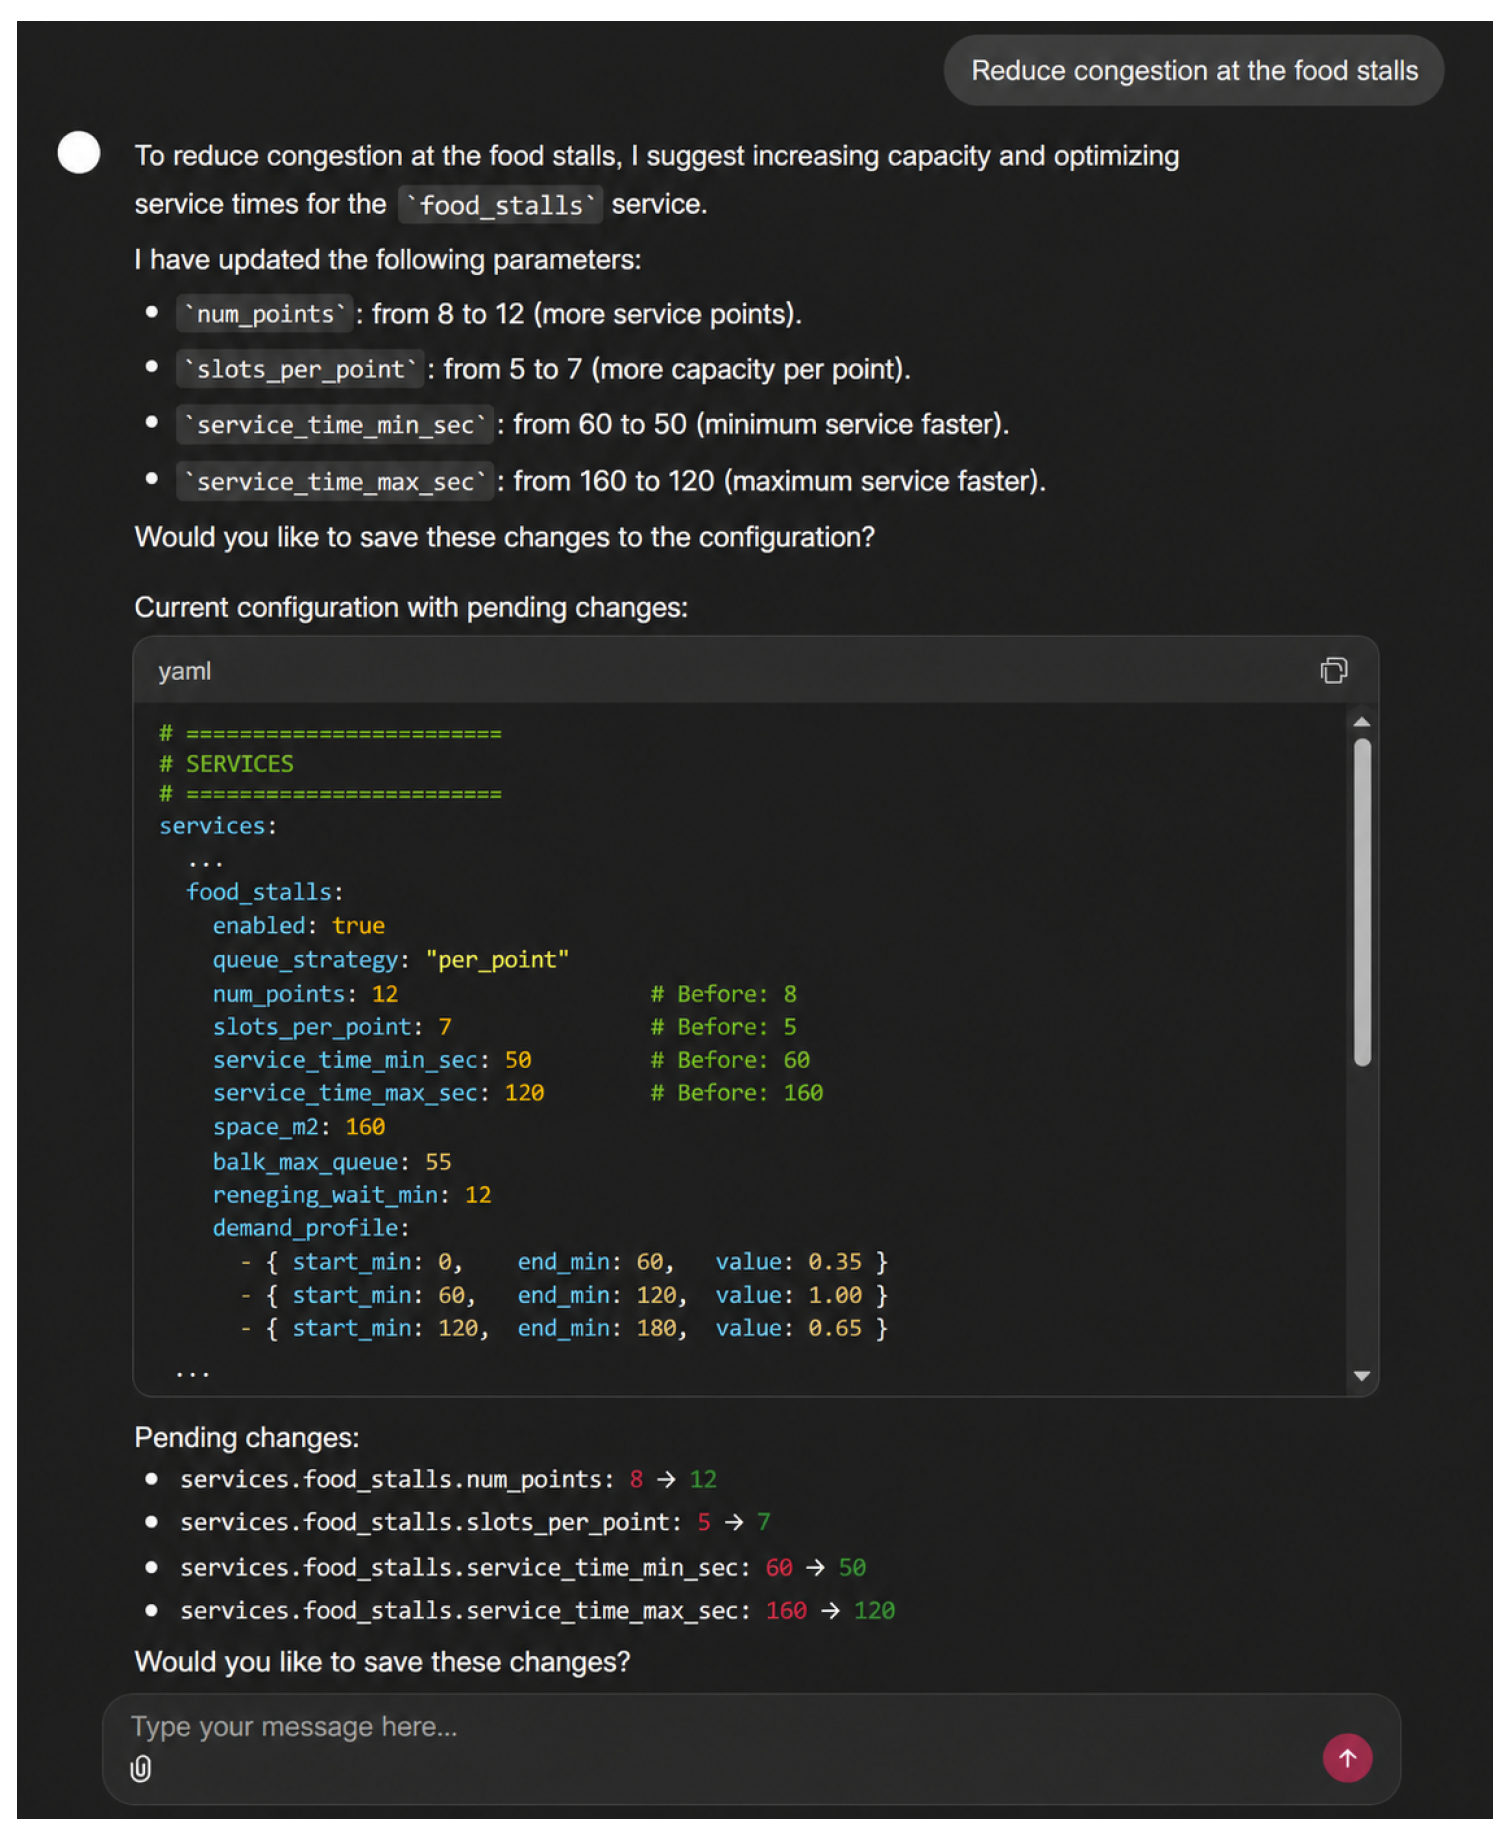
Query: “Reduce congestion at the food stalls”
This example illustrates the model’s ability to interpret abstract operational goals and translate them into concrete system modifications, such as capacity adjustments or service-time changes.
Figure A4.
Goal-based optimization interaction.
Appendix C.3.2. Optimization with Constraints
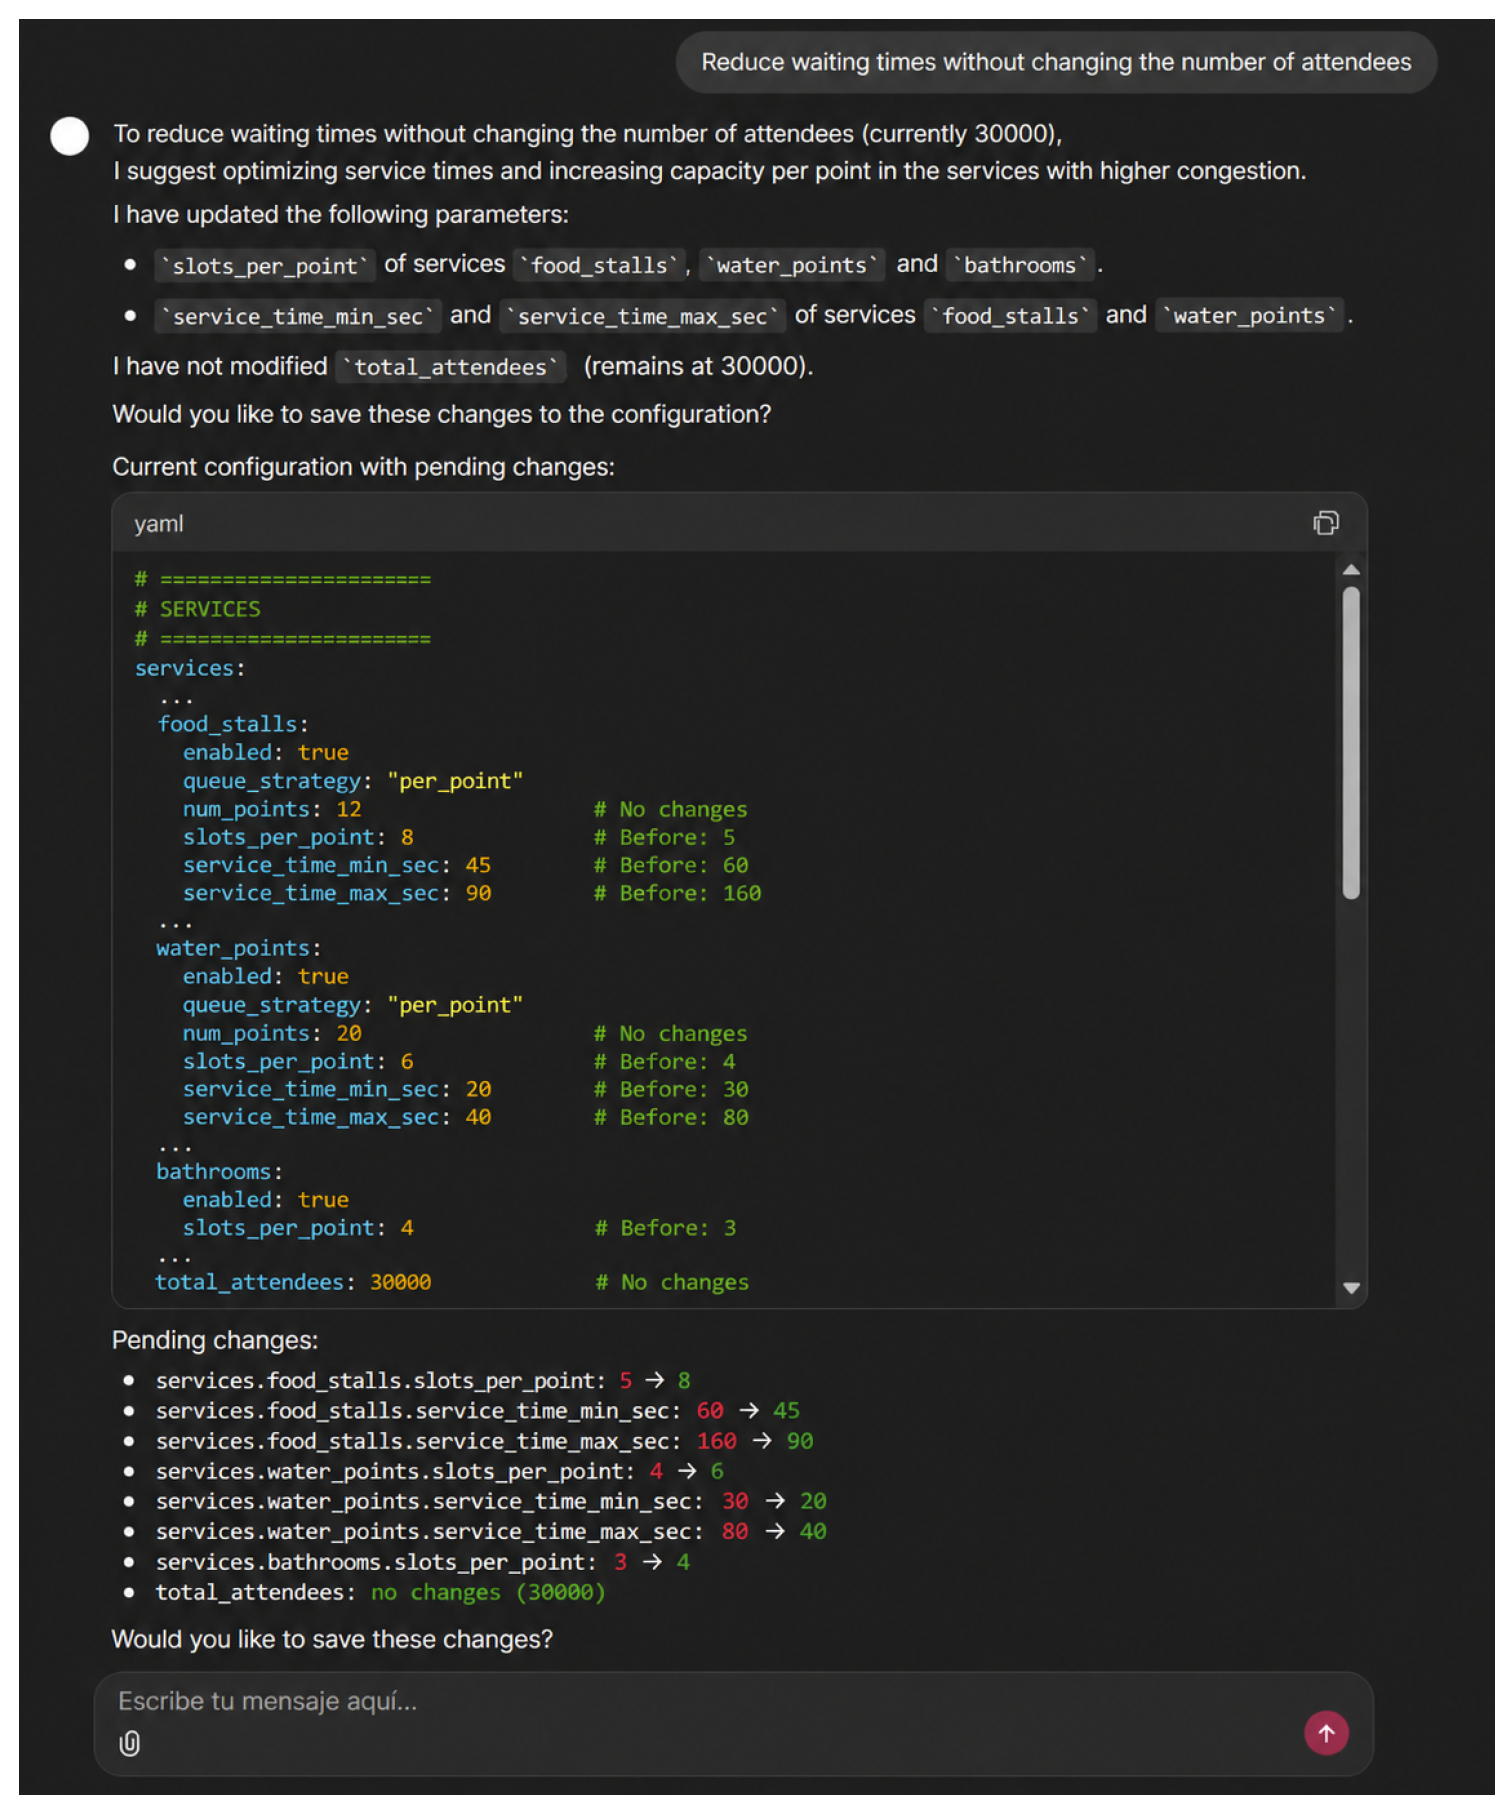
Query: “Reduce waiting times without changing the number of attendees”
This case demonstrates a higher level of reasoning, where the model must respect explicit constraints while optimizing system behavior, evidencing implicit decision-making capabilities.
Figure A5.
Interaction with constraints.
Appendix C.4. Temporal Parameter Manipulation
Appendix C.4.1. Arrival Redistribution
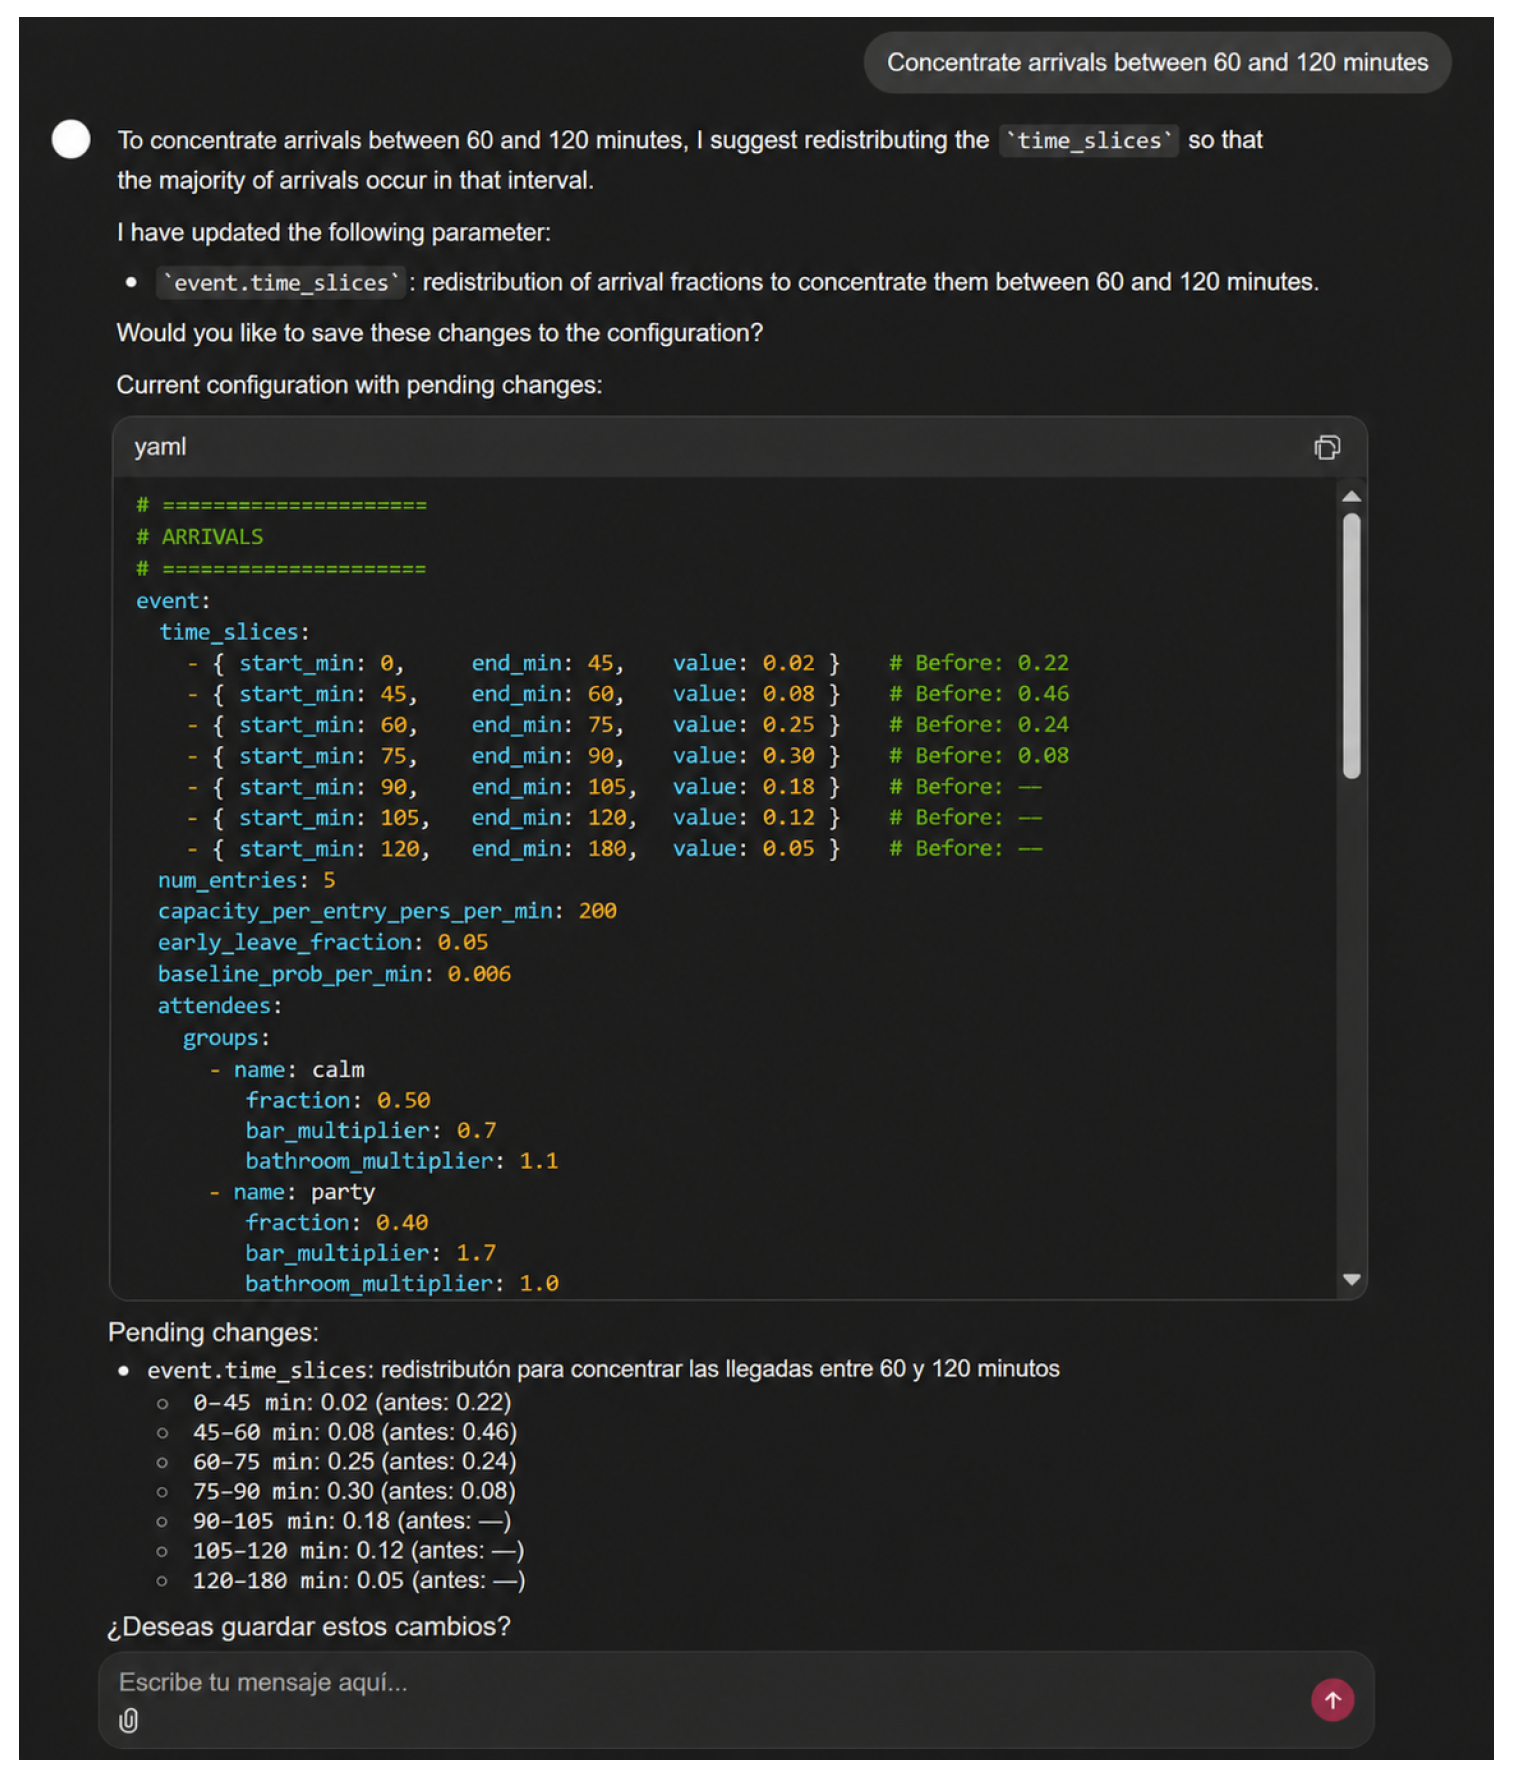
Query: “Concentrate arrivals between 60 and 120 minutes”
This example shows the model’s ability to modify complex temporal structures (time_slices), demonstrating reasoning over distributions and the temporal dynamics of the system.
Figure A6.
Interaction on the temporal distribution of arrivals.
Appendix C.5. Iterative Multi-Turn Interaction
Appendix C.5.1. Progressive Scenario Definition
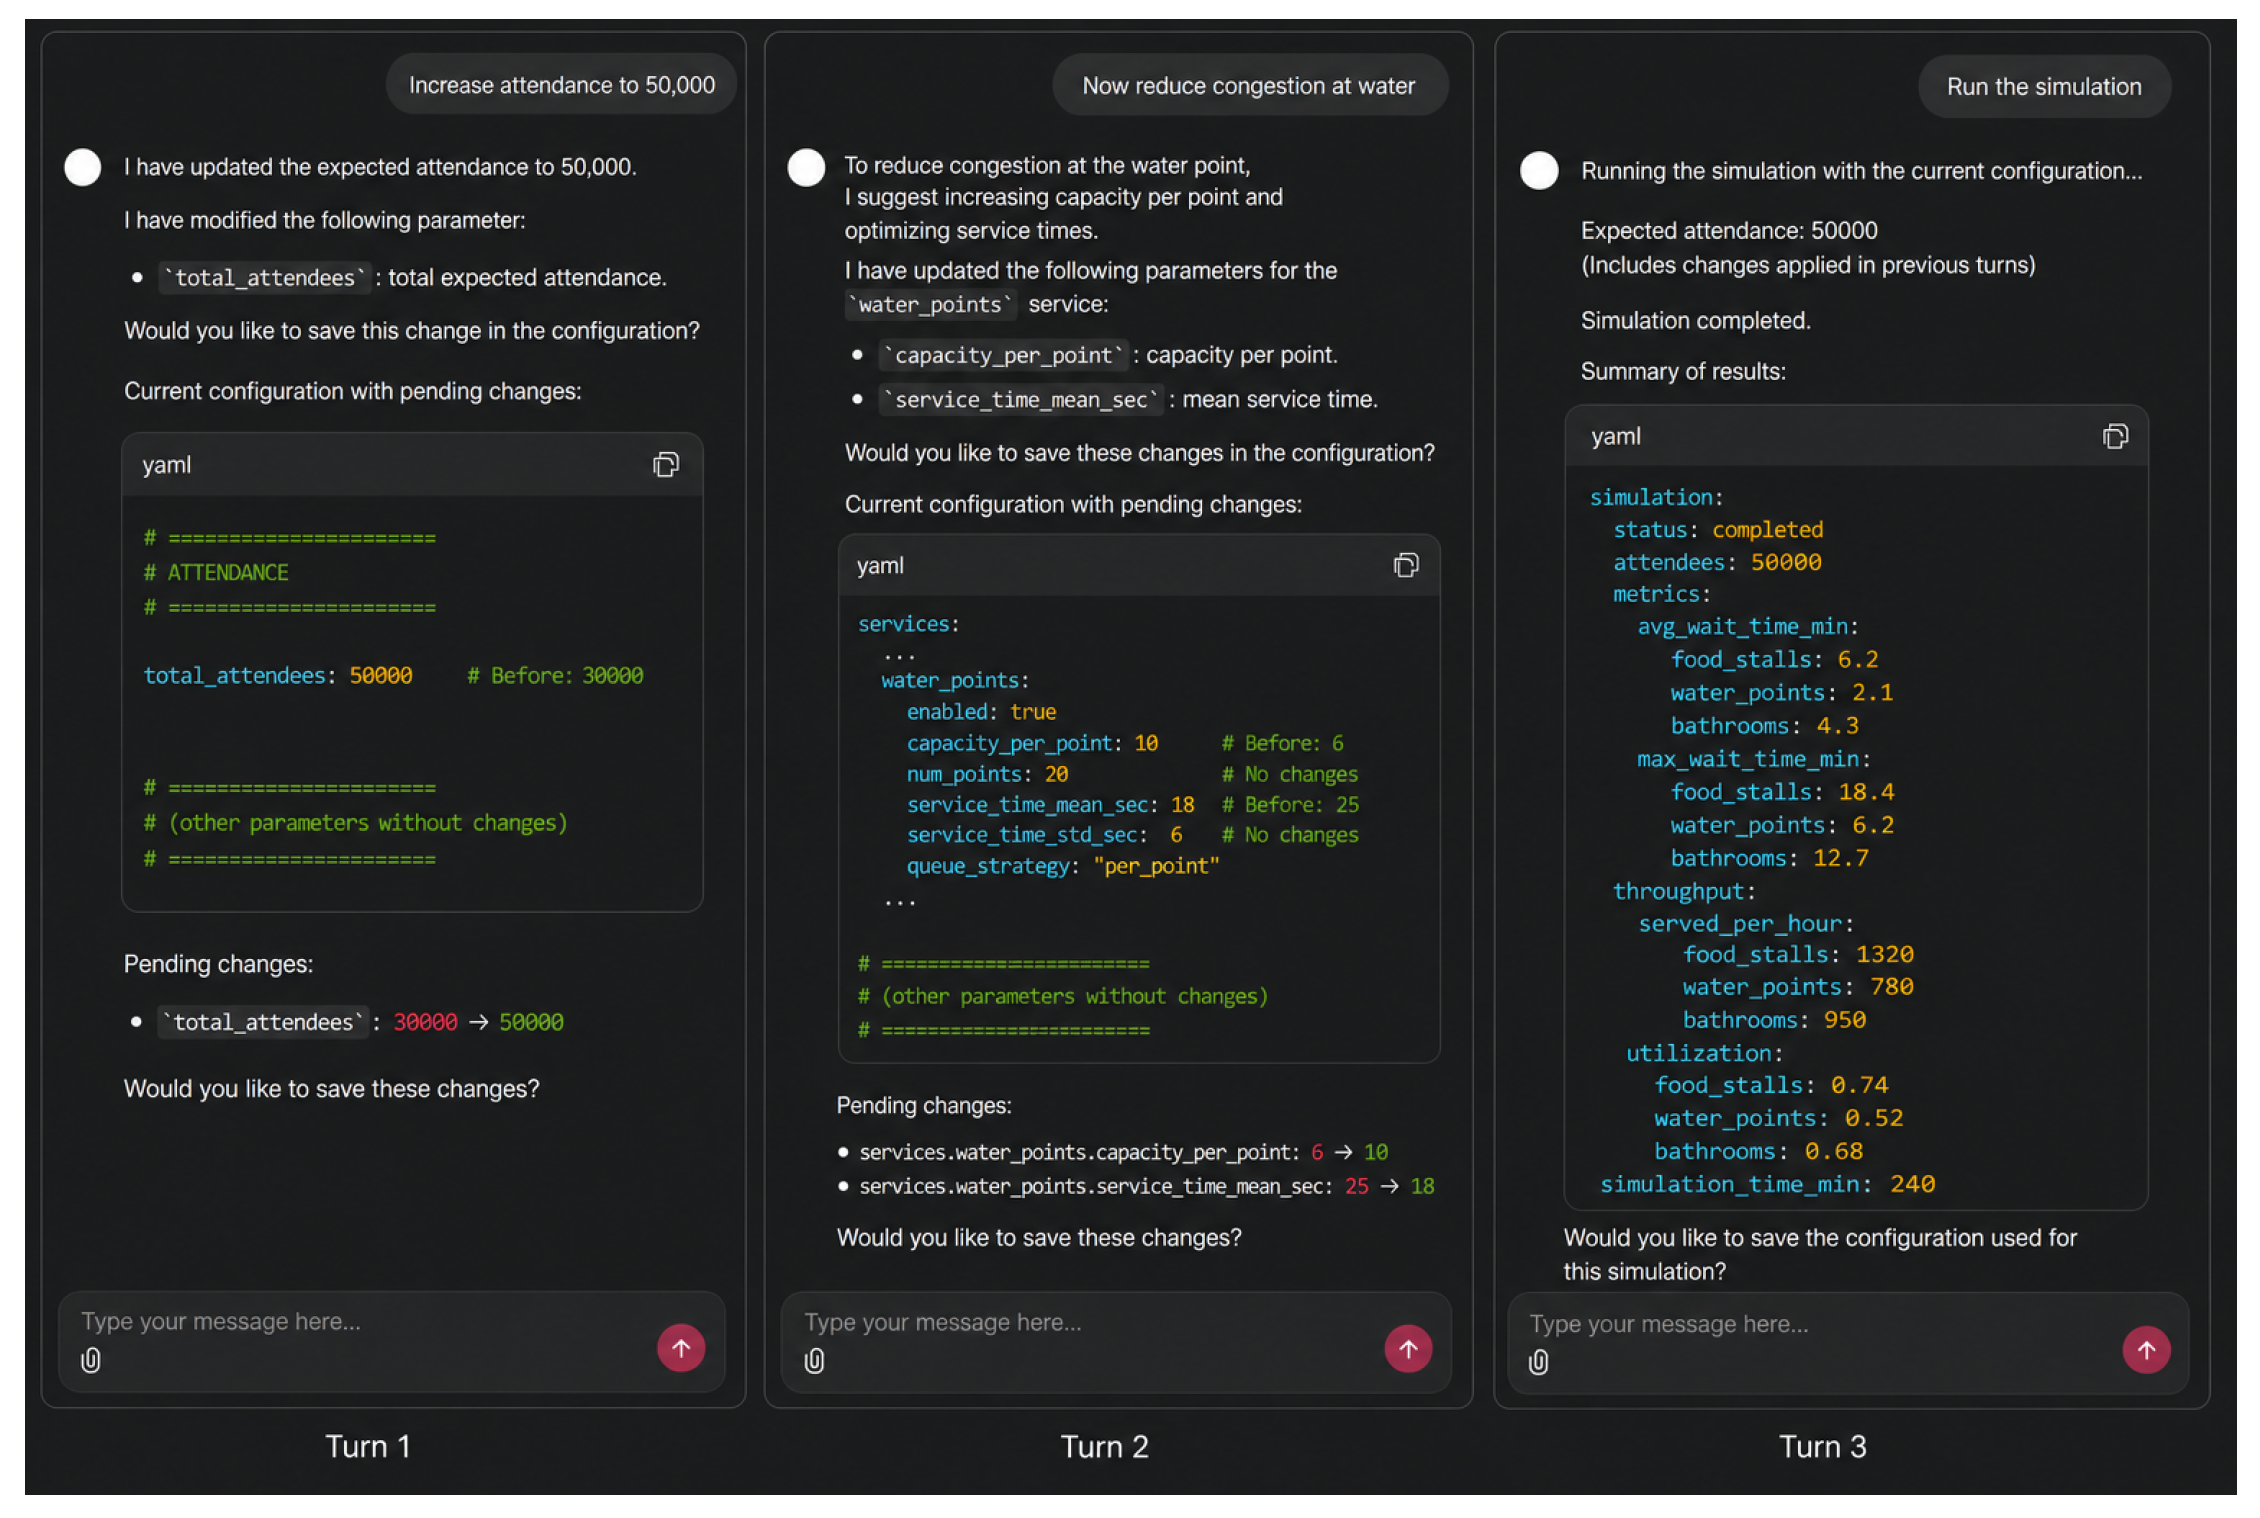
Query:
- “Increase attendance to 50,000”
- “Now reduce congestion in water”
- “Run the simulation”
This case demonstrates the system’s ability to maintain context across multiple turns, allowing the incremental construction of complex scenarios.
Figure A7.
Multi-turn interaction.
Appendix C.6. Controlled Ambiguity
Appendix C.6.1. Partially Defined Instruction
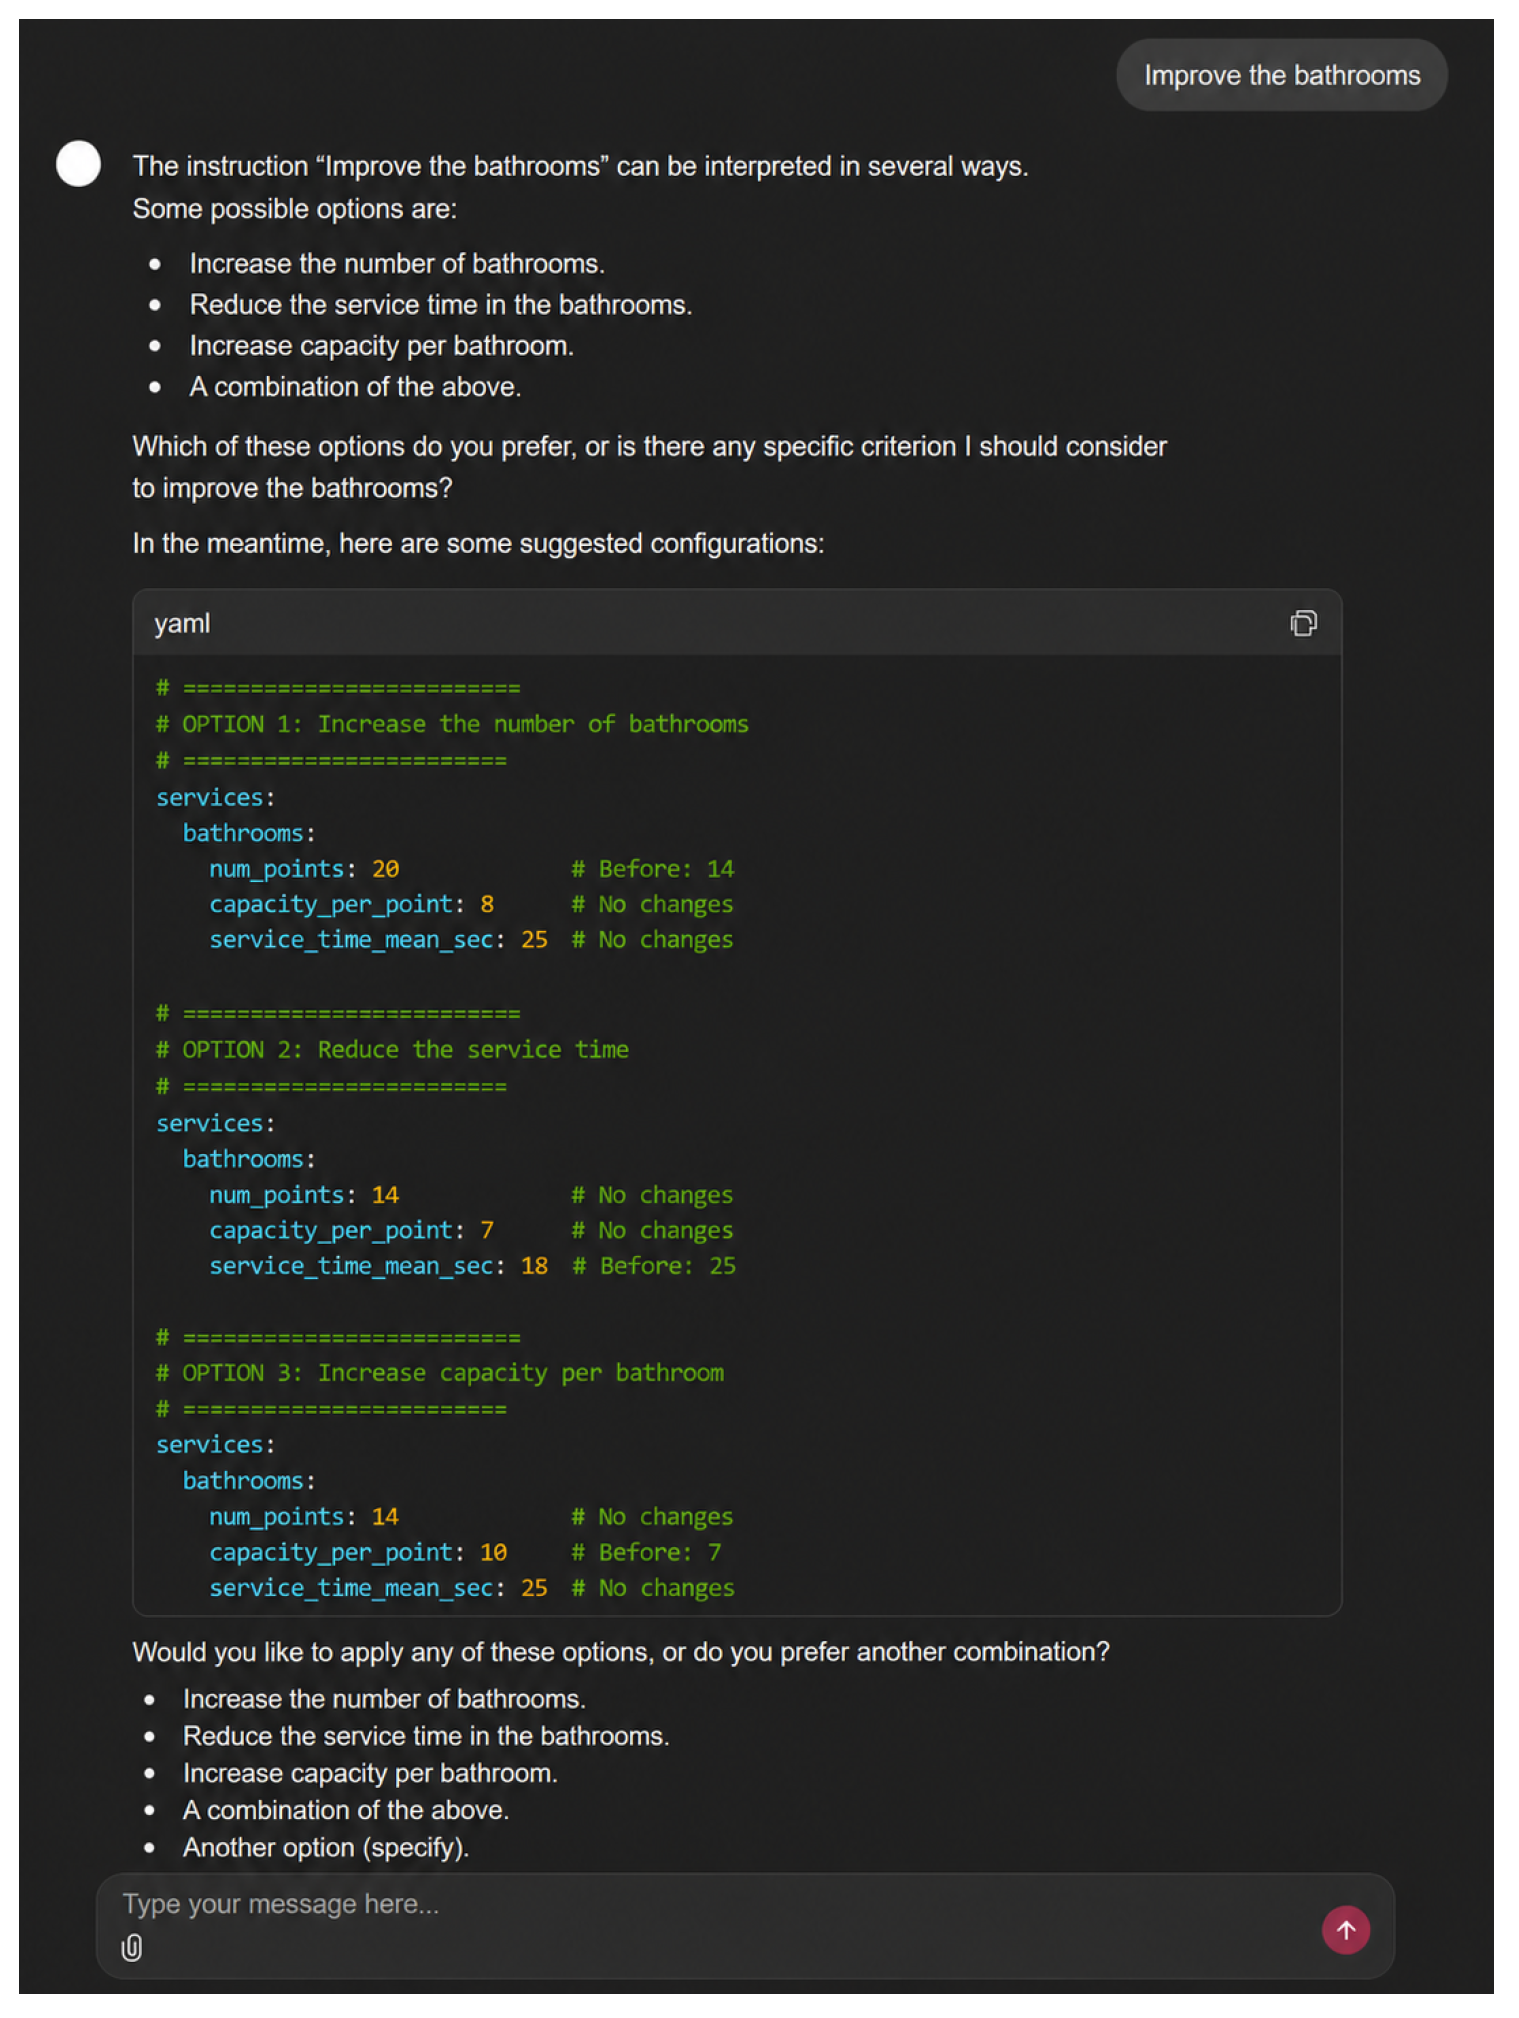
Query: “Improve the bathrooms”
This example illustrates the model’s behavior when faced with ambiguous instructions, where it must infer possible actions or request clarification, evidencing both flexibility and the need for validation.
Figure A8.
Interaction with ambiguity.
Appendix C.7. Model Limitations
Appendix C.7.1. Dependency on Unavailable State
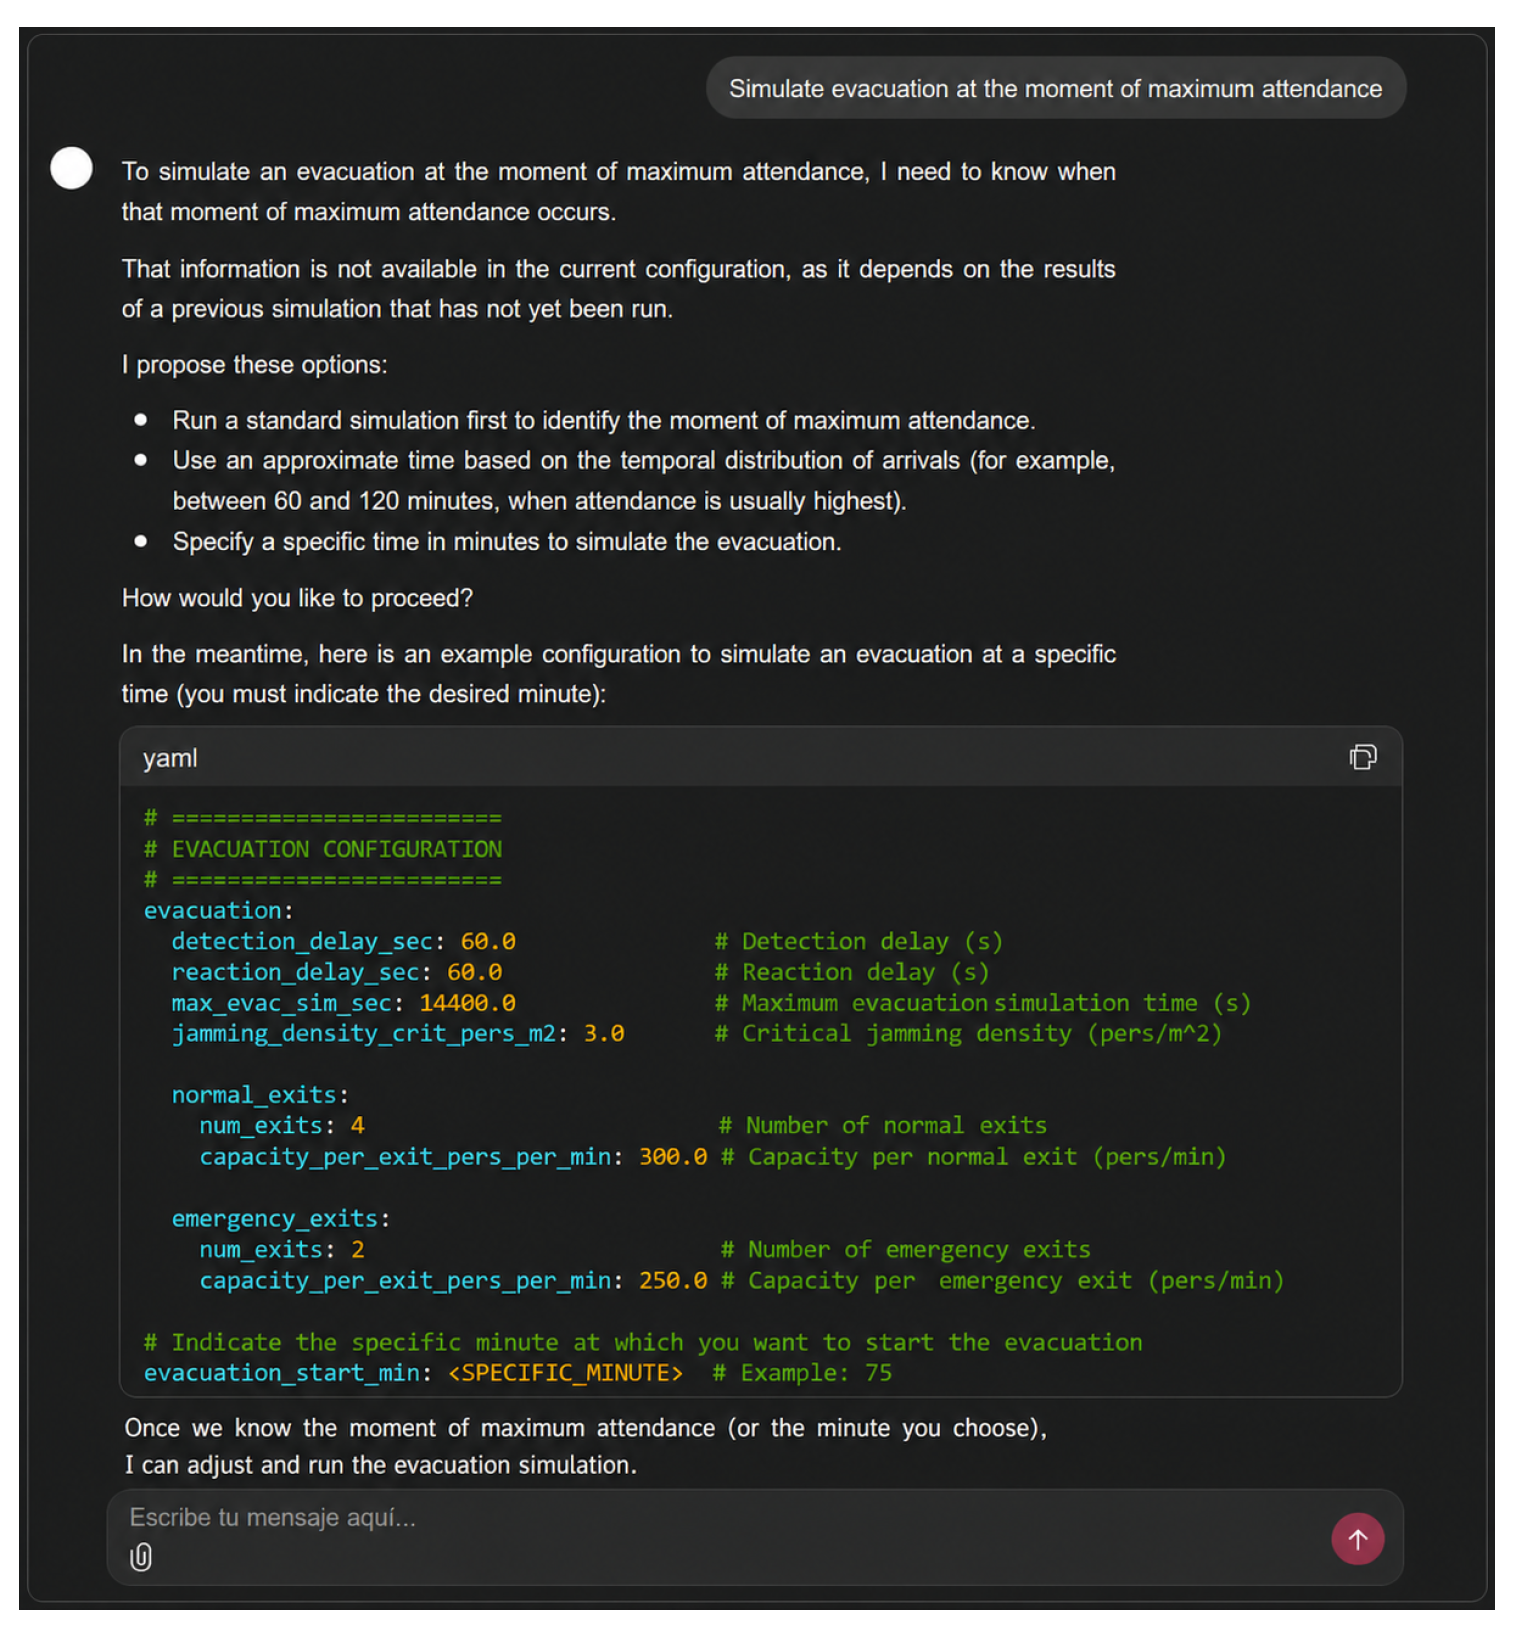
Query: “Simulate evacuation at the time of maximum attendance”
This case evidences a key limitation: the model’s inability to resolve queries that require information derived from previous executions, such as identifying the instant of maximum occupancy.
Figure A9.
Limitation due to state dependency.
Appendix C.7.2. Non-Actionable Abstract Objective
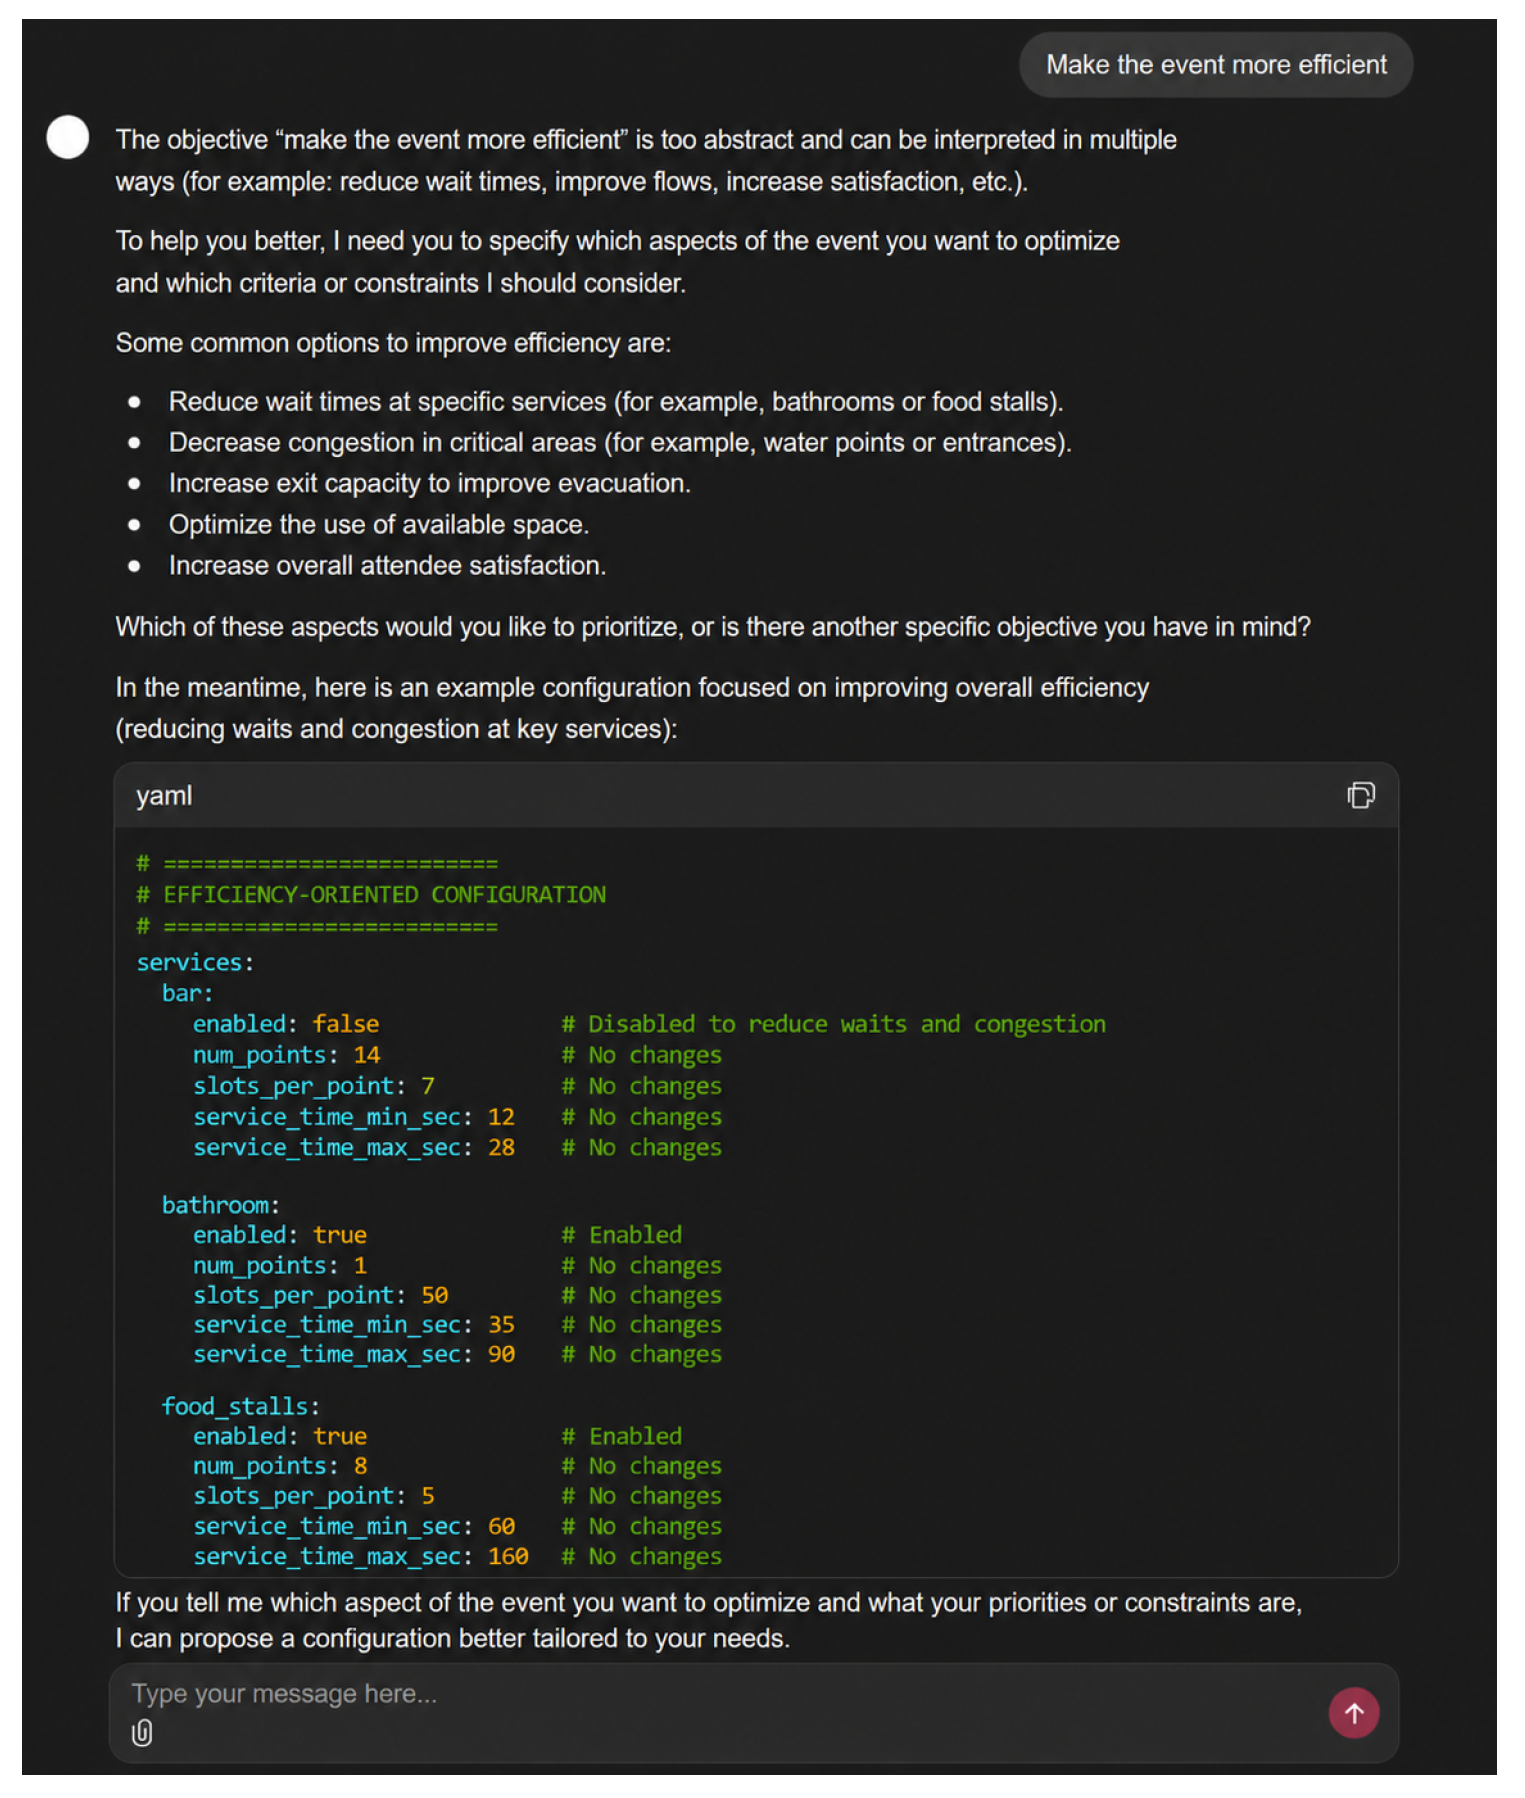
Query: “Make the event more efficient”
This example shows the model’s difficulty in translating highly abstract objectives into concrete actions without additional information, highlighting the need for specification in user queries.
Figure A10.
Limitation in extreme abstraction.
References
- Batty, M. Digital Twins in City Planning. Nat. Comput. Sci. 2024, 4, 192–199. [CrossRef]
- Peldon, D.; Banihashemi, S.; LeNguyen, K.; Derrible, S. Navigating Urban Complexity: The Transformative Role of Digital Twins in Smart City Development. Sustain. Cities Soc. 2024, 111, 105583. [CrossRef]
- Villanueva, F.J.; Bolaños, C.; Rubio, A.; Dorado, J. Crowded Event Management in Smart Cities Using a Digital Twin Approach. In Proceedings of the 2022 IEEE International Smart Cities Conference (ISC2), Pafos, Cyprus, 26–29 September 2022; IEEE: Piscataway, NJ, USA, 2022; pp. 1–8. [CrossRef]
- Bettencourt, L.M.A. Recent Achievements and Conceptual Challenges for Urban Digital Twins. Nat. Comput. Sci. 2024, 4, 150–153. [CrossRef]
- Weil, C.; Bibri, S.E.; Longchamp, R.; Golay, F.; Alahi, A. Urban Digital Twin Challenges: A Systematic Review and Perspectives for Sustainable Smart Cities. Sustain. Cities Soc. 2023, 99, 104730. [CrossRef]
- Bonabeau, E. Agent-Based Modeling: Methods and Techniques for Simulating Human Systems. Proc. Natl. Acad. Sci. USA 2002, 99, 7280–7287. [CrossRef]
- Taillandier, P.; Gaudou, B.; Grignard, A.; Huynh, Q.N.; Marilleau, N.; Caillou, P.; Philippon, D.; Drogoul, A. Building, Composing and Experimenting Complex Spatial Models with the GAMA Platform. GeoInformatica 2019, 23, 299–322. [CrossRef]
- Hsu, C.H. Simulation of Emergency Evacuation with Crowd-Gathering Risk and Evaluation Methods: A Case Study of the Mass Rapid Transit System in Taipei. Transp. Plan. Technol. 2024, 47, 514–539. [CrossRef]
- Shao, X.; Ye, R.; Wang, J.; Feng, J.; Wang, Y. Progress and Prospects in Crowd Safety Evacuation Research in China. Emerg. Manag. Sci. Technol. 2023, 3, 1. [CrossRef]
- Yang, M.; Li, X.; Zhang, Y.; Chen, H. Proactive Conversational AI: A Comprehensive Survey of Advancements and Opportunities. ACM Trans. Inf. Syst. 2024. [CrossRef]
- Wang, B.; Chen, L.; Liu, Y.; Zhang, H. Leveraging Large Language Models to Power Chatbots for Collecting User Self-Reported Data. Proc. ACM Hum.-Comput. Interact. 2024. [CrossRef]
- Google. Gemini 2.5 Flash Lite: Efficient Multimodal Model for Scalable AI Applications. Technical Report. 2025. https://deepmind.google/technologies/gemini/.
- Wu, C.C.; Lai, C.C.; Venkatasubramanian, N.; Hsu, C.H. Urban Digital-Twin Planning for Sustainable Smart Cities: System Architecture, Preliminary Experiments, and Open Challenges. In Proceedings of the 2nd International Workshop on Middleware for Digital Twins; ACM: New York, NY, USA, 2024. [CrossRef]
- Kanna, K.; Kolbe, T.H. Advanced User Interaction with Urban Digital Twins using Large Language Models. ISPRS Ann. Photogramm. Remote Sens. Spatial Inf. Sci. 2025.
- Xia, Y.; et al. Autonomous Systems with LLM Agents for Digital Twin Operations. arXiv 2023. https://arxiv.org/abs/2304.14721.
- Alshammari, K. A Review of Urban Digital Twins Integration, Challenges, and Future Directions in Smart City Development. Sustainability 2024, 16, 8337. [CrossRef]
- Chainlit. Chainlit: Conversational AI Framework. GitHub Repository. 2024. https://github.com/Chainlit/chainlit.
- Xia, Y.; et al. Large Language Model Multi-Agent System for Simulation Model Parametrization. arXiv 2024. https://arxiv.org/abs/2405.18092.
- Pydantic. Pydantic: Data Validation and Settings Management Using Python Type Annotations. Documentation. 2024. https://docs.pydantic.dev.
- Liu, K.; et al. Understanding Human–LLM Interaction Patterns in Urban Planning. Appl. Soft Comput. 2026.
- Lu, L.; et al. LLM-Driven Multi-Agent Framework for Human-Digital Twin Interaction. Inf. Sci. 2026.
- Hunter, J.D. Matplotlib: A 2D Graphics Environment. Comput. Sci. Eng. 2007, 9, 90–95. [CrossRef]
- FastAPI. FastAPI: High-Performance Web Framework for Building APIs with Python. Documentation. 2024. https://fastapi.tiangolo.com.
- Event Industry Forum. The Purple Guide to Health, Safety and Welfare at Music and Other Events; Event Industry Forum: UK, 2019. https://www.thepurpleguide.co.uk.
- Helbing, D.; Farkas, I.; Vicsek, T. Simulating Dynamical Features of Escape Panic. Nature 2000, 407, 487–490. [CrossRef]
- Hurley, M.J.; et al. SFPE Handbook of Fire Protection Engineering, 5th ed.; Springer: New York, NY, USA, 2016.
- National Fire Protection Association. NFPA 101: Life Safety Code; NFPA: Quincy, MA, USA, 2021. https://www.nfpa.org.
- Xu, H.; et al. Towards Autonomous Optimization using Agentic Digital Twins. arXiv 2025. https://arxiv.org/abs/2506.13068.
- Di Ludovico, D.; Eugeni, F.; Zanfardino, G.; Di Marco, A. Simulating Crowd Behaviour to Implement Safety-Based Urban Design Techniques Aimed at Optimizing Evacuation. J. Urban Des. 2025, 30, 401–422. [CrossRef]
- Yan, Y.; et al. OpenCity: A Scalable Platform to Simulate Urban Activities with Massive LLM Agents. arXiv 2024. https://arxiv.org/abs/2410.21286.
Figure 1.
Overall system architecture of the proposed digital twin framework. The diagram illustrates the interaction between the crowd simulation engine, the API-based execution layer, and the conversational AI interface, highlighting the flow of configuration, execution, and results across subsystems.
Figure 1.
Overall system architecture of the proposed digital twin framework. The diagram illustrates the interaction between the crowd simulation engine, the API-based execution layer, and the conversational AI interface, highlighting the flow of configuration, execution, and results across subsystems.
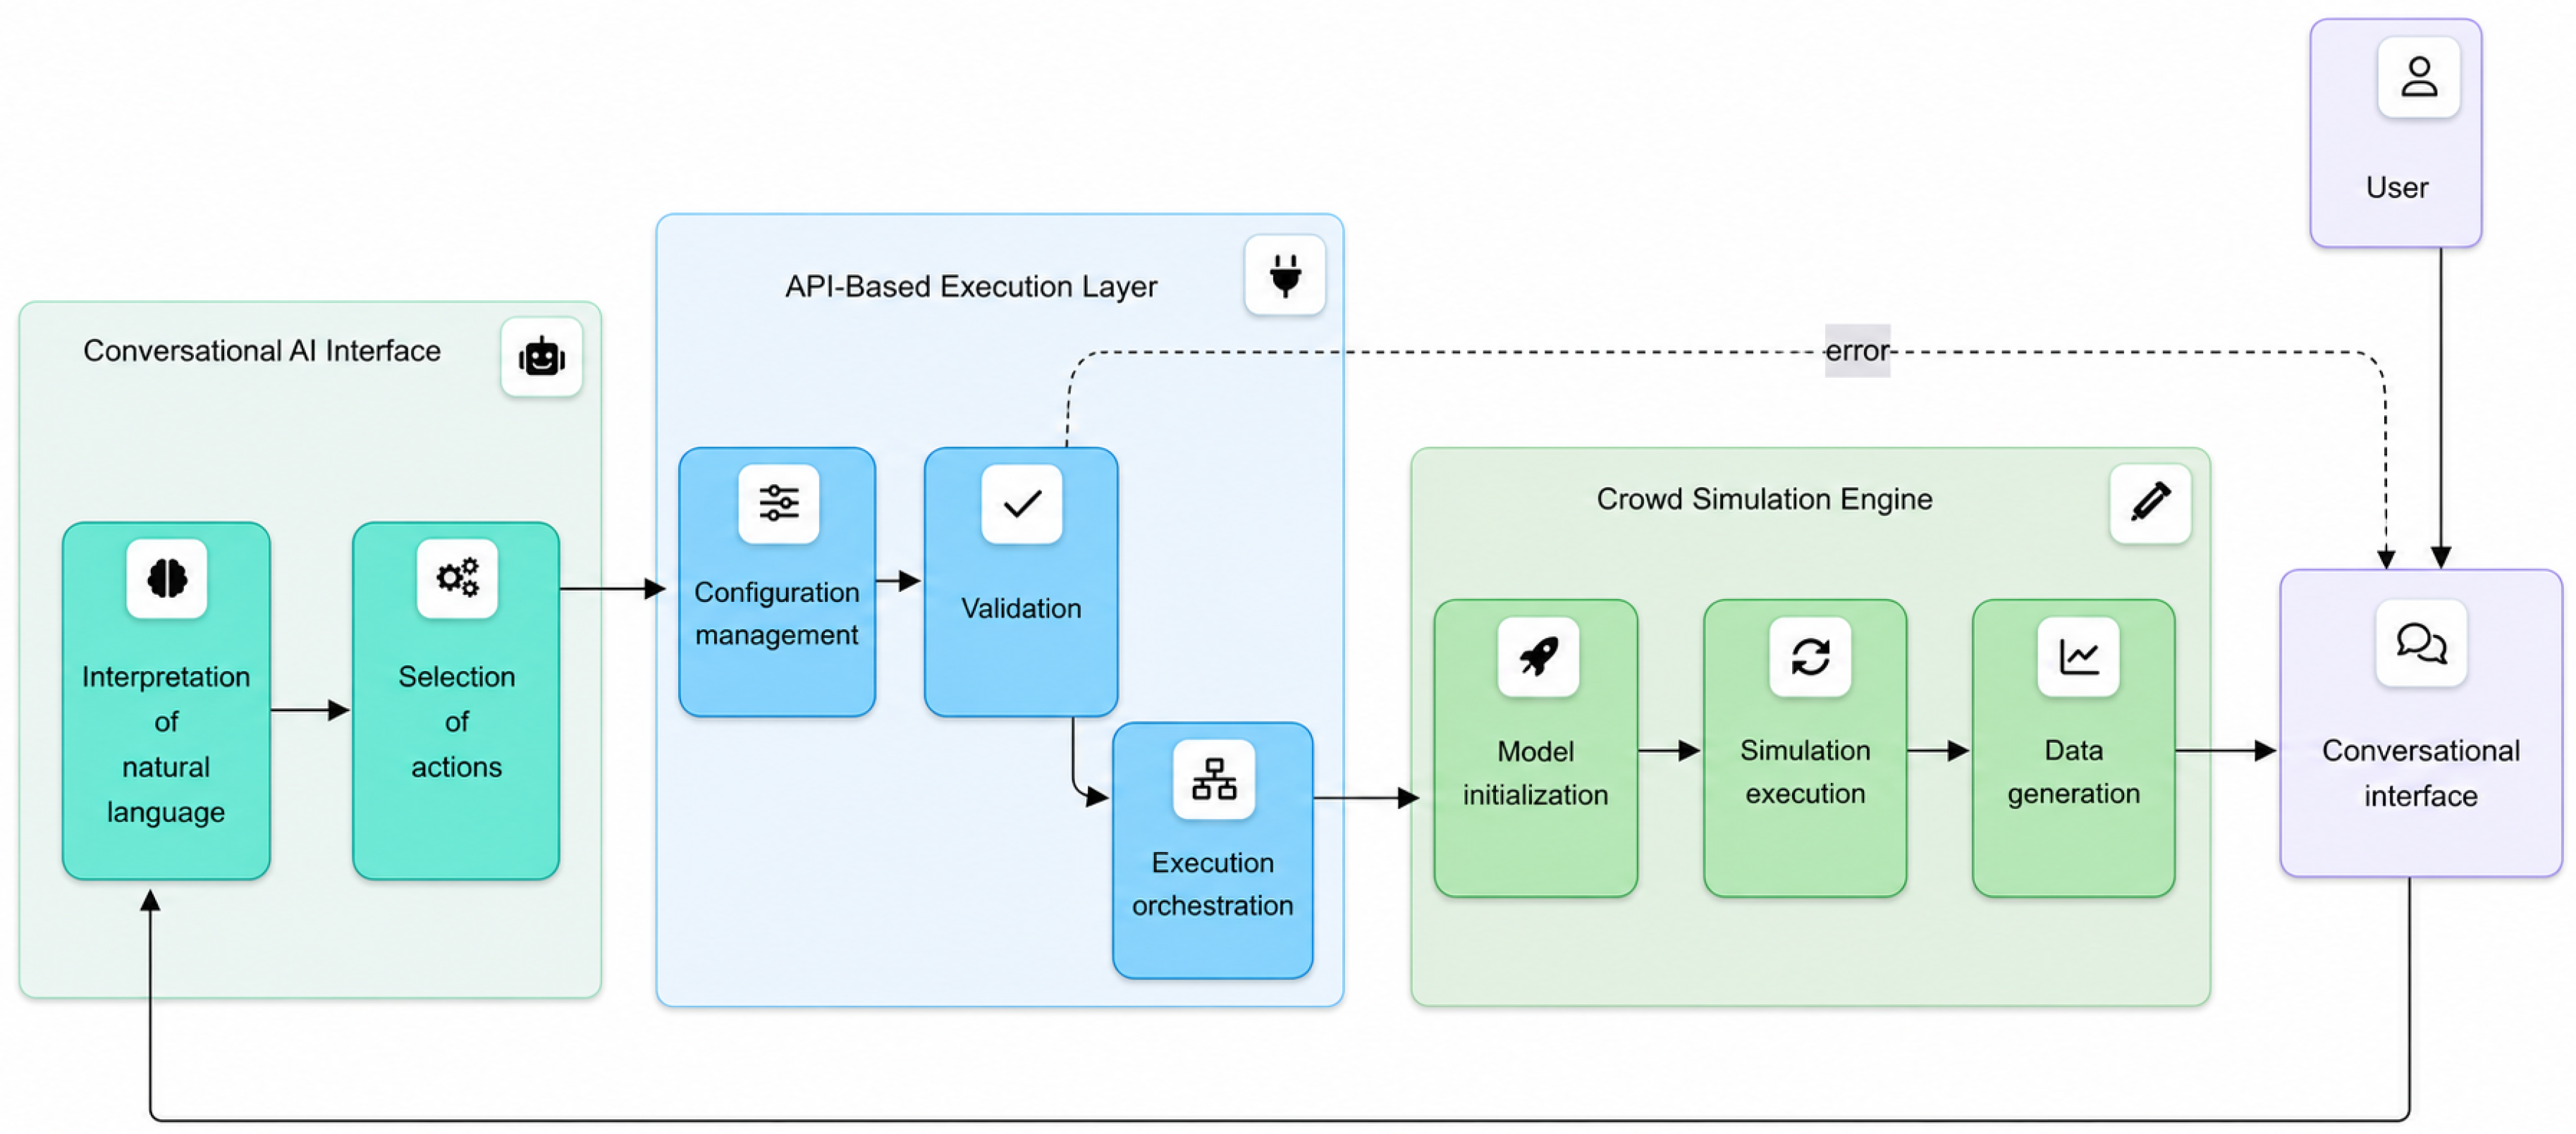
Figure 2.
Comparison of representative service behavior in the baseline scenario.
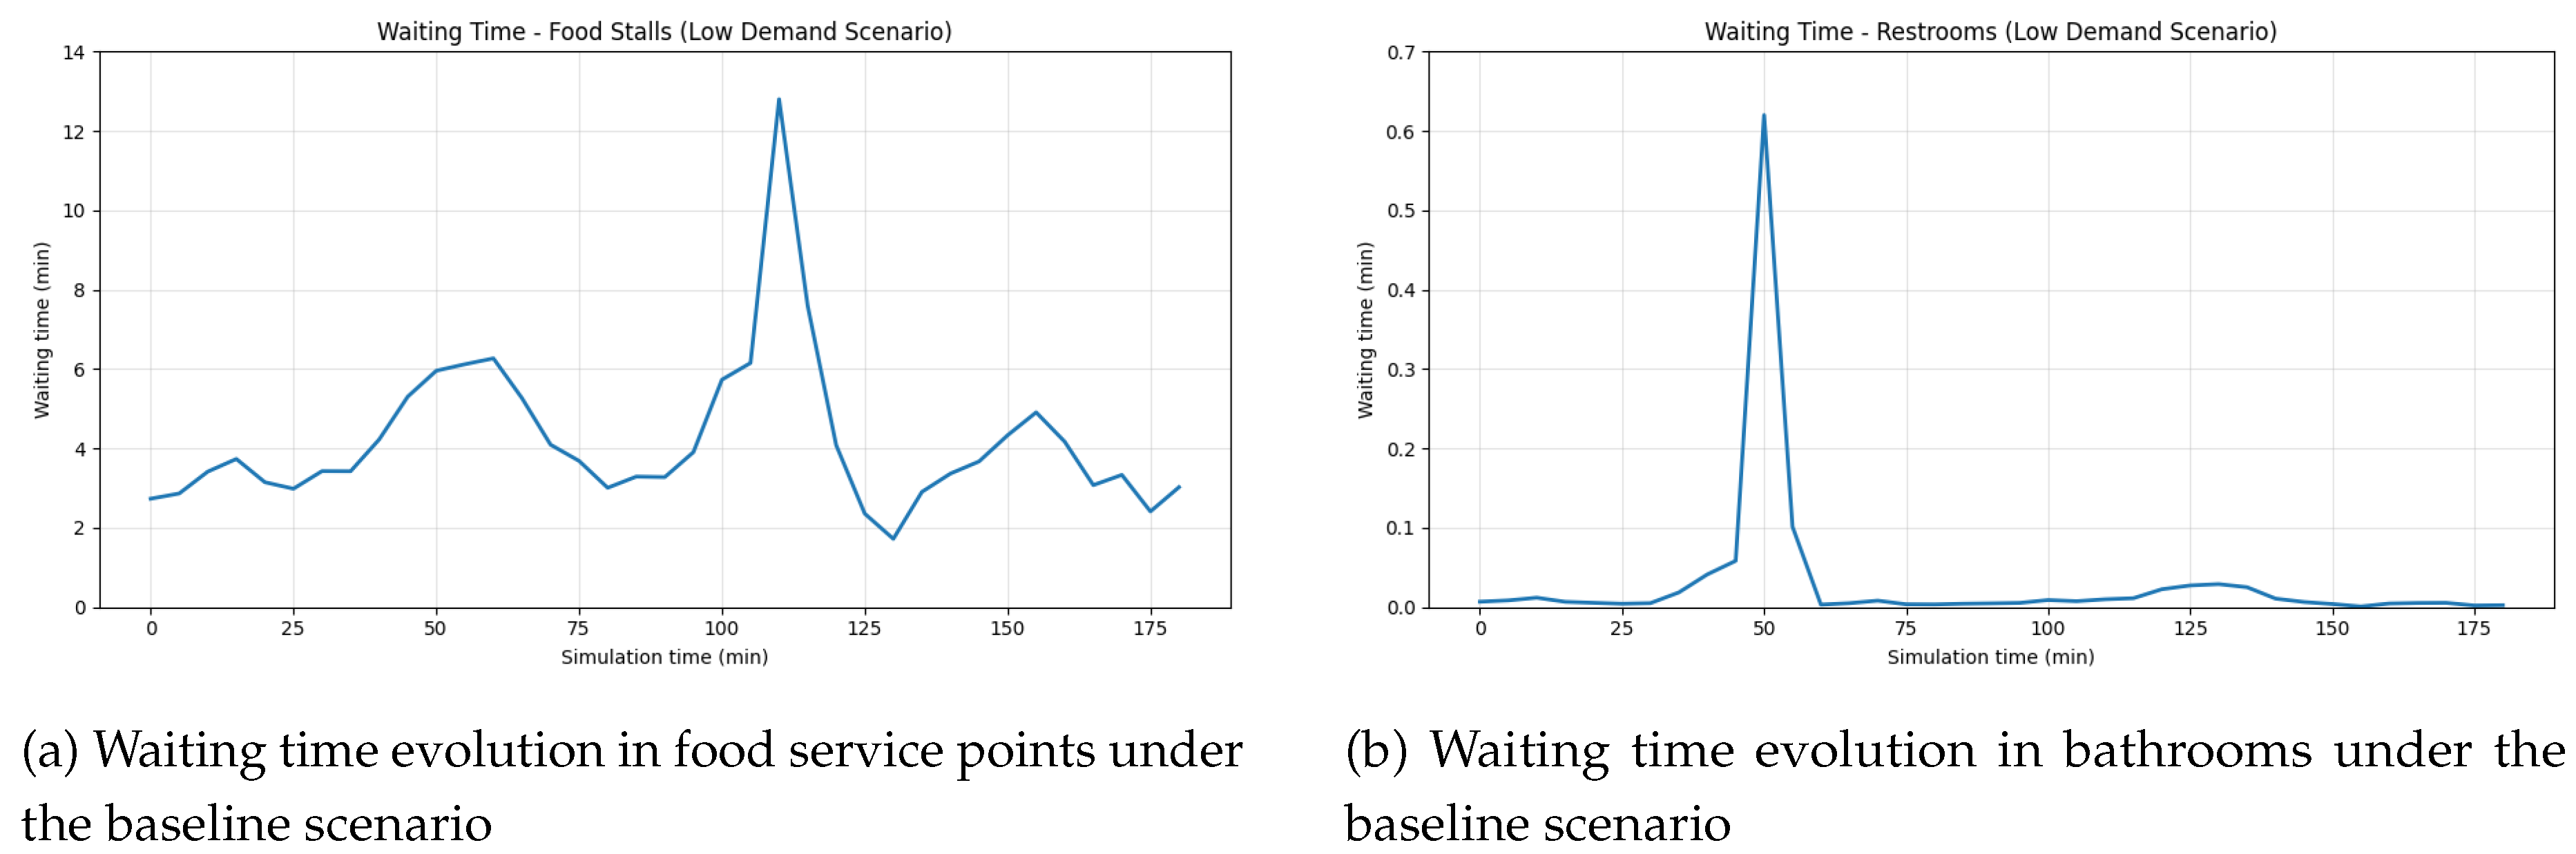
Figure 3.
Comparison of the most congested services in the high-demand scenario.
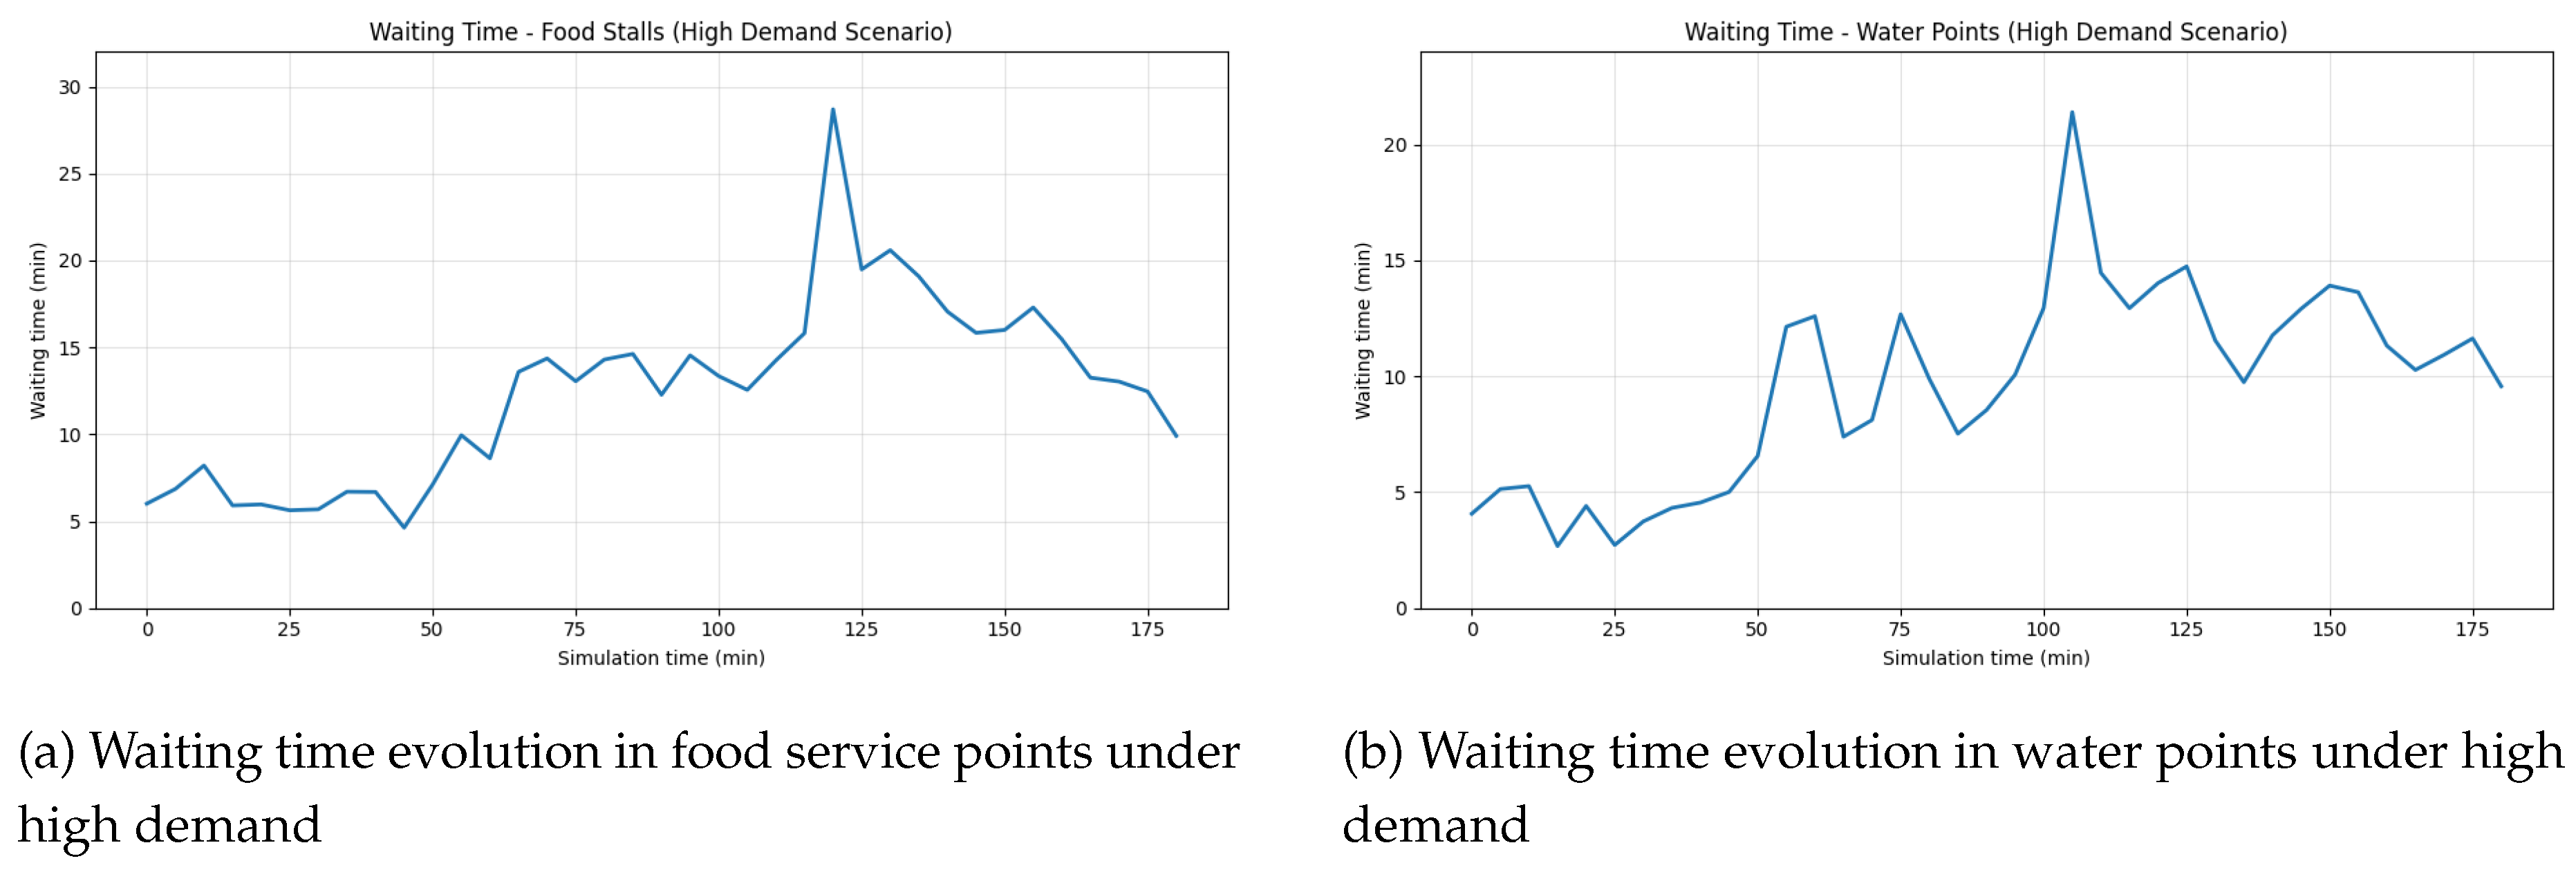
Figure 4.
Comparison of evacuation behavior under different activation scenarios.
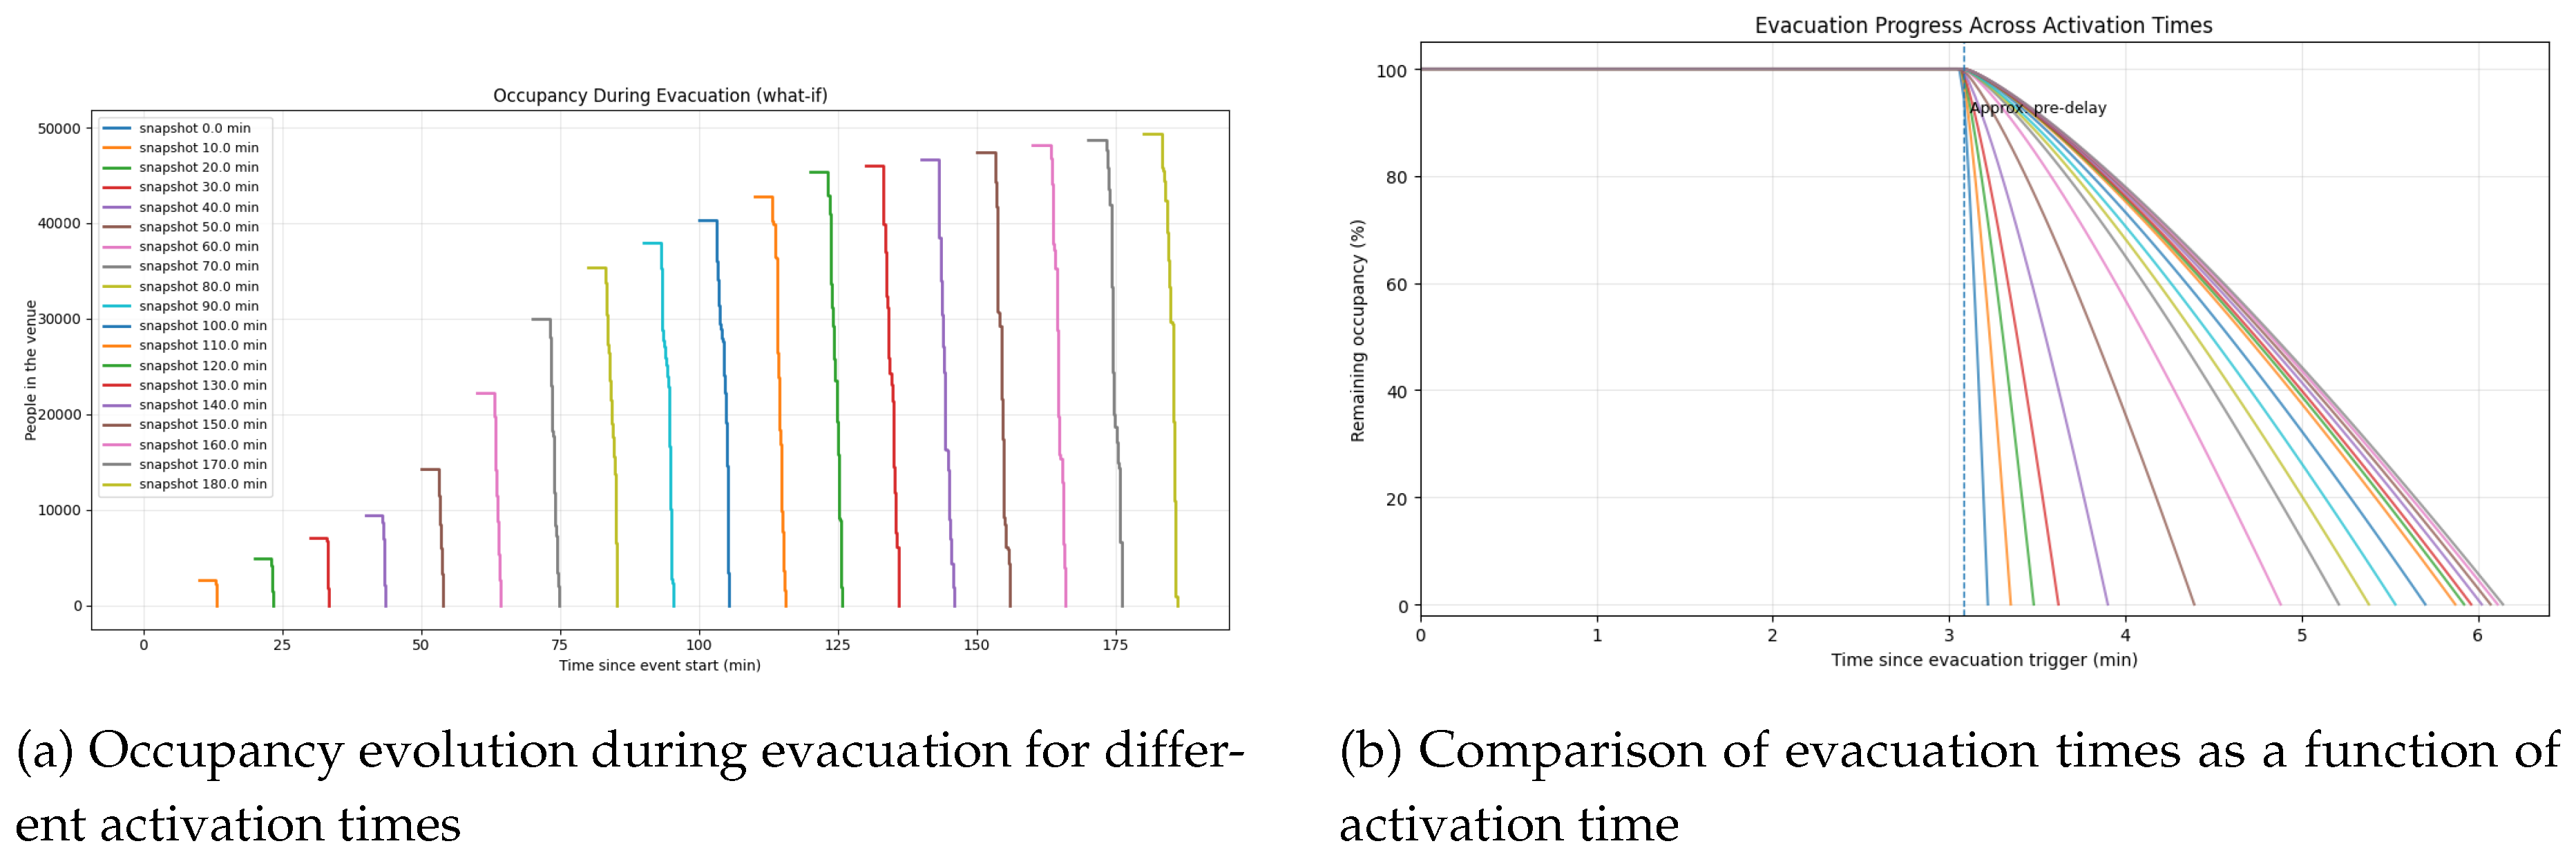
Table 1.
Baseline scenario performance metrics (aggregated by service).
| Service | Average wait (min) | Maximum wait (min) | |
|---|---|---|---|
| Bar | 0.02 | 0.48 | 0.99 |
| Bathrooms | 0.03 | 0.62 | 0.99 |
| Food services | 4.21 | 12.80 | 0.30 |
| Merchandising | 7.26 | 18.40 | 0.27 |
| Water points | 2.30 | 6.70 | 0.16 |
| First aid | 1.54 | 8.90 | 0.93 |
| Violet points | 0.00 | 1.67 | 1.00 |
Table 2.
High-demand scenario performance metrics (aggregated by service).
| Service | Average wait (min) | Maximum wait (min) | |
|---|---|---|---|
| Bar | 0.85 | 3.50 | 1.03 |
| Bathrooms | 1.20 | 5.20 | 1.06 |
| Food services | 12.40 | 28.70 | 1.32 |
| Merchandising | 15.80 | 35.10 | 1.28 |
| Water points | 9.60 | 21.40 | 1.40 |
| First aid | 3.20 | 10.50 | 1.10 |
| Violet points | 0.10 | 2.10 | 1.00 |
Table 3.
Evacuation metrics as a function of time and occupancy.
| Time (min) | Present | Pre-delay (min) | (min) | (min) |
|---|---|---|---|---|
| 30 | 7130 | 3.07 | 3.30 | 3.50 |
| 60 | 22230 | 3.07 | 3.80 | 4.40 |
| 90 | 37910 | 3.08 | 4.40 | 5.40 |
| 120 | 45390 | 3.09 | 4.70 | 5.90 |
| 150 | 47440 | 3.09 | 4.85 | 6.05 |
| 180 | 49330 | 3.09 | 5.00 | 6.15 |
Table 4.
Average API-Based Execution Times.
| Stage | Mean (ms) | SD (ms) | Contrib. (%) |
|---|---|---|---|
| Config. update | 120 | 35 | 0.6 |
| Validation | 210 | 50 | 1.1 |
| Simulation execution | 18,500 | 2,300 | 96.8 |
| Output serialization | 420 | 90 | 2.1 |
| Total | 19,250 | – | 100 |
Table 5.
Scenario reconfiguration performance.
| Transition | Update time (ms) | Execution time (s) | Success rate (%) |
|---|---|---|---|
| Baseline → High demand | 135 | 19.0 | 100 |
| High demand → Evacuation | 165 | 20.5 | 100 |
| Baseline → Evacuation | 150 | 19.8 | 100 |
Table 6.
Response consistency across multiple runs.
| Metric | Mean | SD | CV (%) |
|---|---|---|---|
| Evacuation time (min) | 5.60 | 0.35 | 6.3 |
| Average waiting time (min) | 6.80 | 0.95 | 14.0 |
| Maximum density (pers/) | 3.2 | 0.05 | 8.1 |
Disclaimer/Publisher’s Note: The statements, opinions and data contained in all publications are solely those of the individual author(s) and contributor(s) and not of MDPI and/or the editor(s). MDPI and/or the editor(s) disclaim responsibility for any injury to people or property resulting from any ideas, methods, instructions or products referred to in the content. |
© 2026 by the authors. Licensee MDPI, Basel, Switzerland. This article is an open access article distributed under the terms and conditions of the Creative Commons Attribution (CC BY) license (http://creativecommons.org/licenses/by/4.0/).
Copyright: This open access article is published under a Creative Commons CC BY 4.0 license, which permit the free download, distribution, and reuse, provided that the author and preprint are cited in any reuse.


