

Submitted:
15 May 2026
Posted:
18 May 2026
You are already at the latest version
Abstract
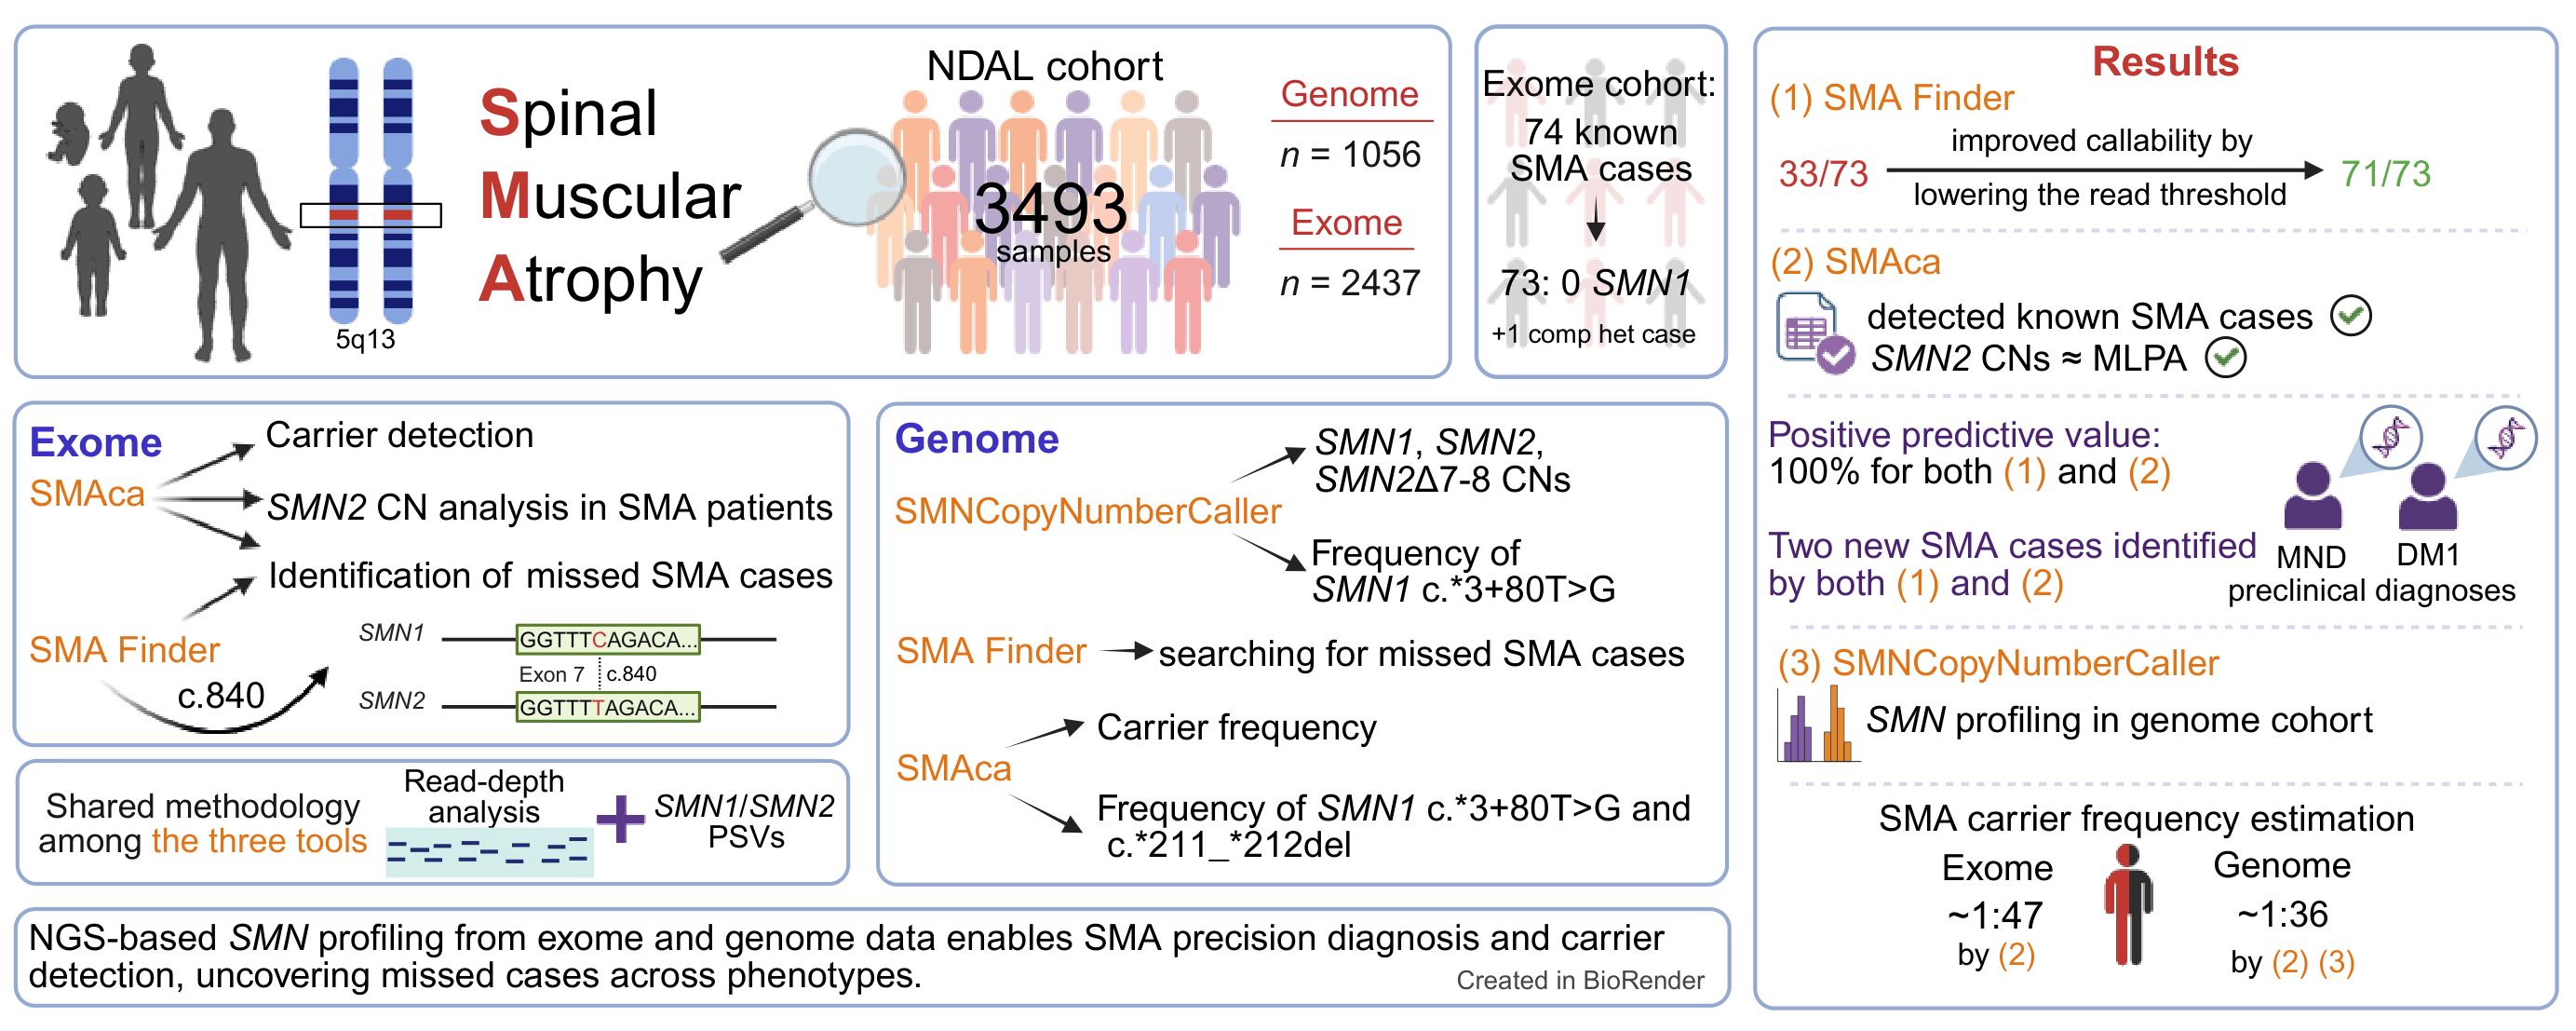
Purpose: Next-generation sequencing (NGS) is routinely used in the diagnostic workup of neurological diseases, enabling systematic screening for SMA with tailored bioinformatic tools, further enhancing diagnostic speed and accuracy. Methods: We leveraged SMNCopyNumberCaller, SMAca, and SMAFinder in our NGS cohort (n = 3493), including 74 MLPA-validated SMA cases (one compound heterozygous) in the exome dataset. Putative SMA cases were validated using PCR-RFLP and MLPA. Results: With default settings of SMA Finder in exome cohort (n = 2437), 16.4% of samples were uncallable including 40 known SMA cases. Lowering read thresholds markedly improved callability and identified 71/73 known SMA cases, two cases remaining uncallable. SMAca correctly detected 73/73 SMA cases. Both tools had a positive predictive value of 100% and identified two missed cases (DM1, MND), subsequently molecularly confirmed. After inclusion of correction value to scale factor, SMAca showed high concordance with MLPA for SMN2 copy number estimation in SMA cases. Carrier frequencies were estimated as 1:36 and 1:47, in genome and exome respectively. Using SMNCopyNumberCaller, we provided detailed SMN profiling in a Turkish genome cohort (n = 1056). Conclusions: NGS-based SMN analysis enables robust detection of SMA and supports systematic cohort screening to identify missed cases.
Keywords:
spinal muscular atrophy
; SMN1/2
; SMNCopyNumberCaller
; SMAca
; SMA Finder
Introduction
Spinal Muscular Atrophy (SMA) is a rare autosomal recessive neuromuscular disorder caused by insufficient levels of survival of motor neuron (SMN) protein due to biallelic deletions or pathogenic variants in SMN1 and limited expression of functional SMN protein from SMN2. SMN1 and its paralog SMN2 locate within the 5q13 chromosomal region, which harbors a human-specific inverted segmental duplication [1] and is highly prone to genomic rearrangements [2]. The two genes are nearly identical, differing by 15 SNVs and 1 indel of five nucleotides. The most significant difference lies at the sixth nucleotide of exon 7 (c.840C>T),which is translationally silent that nevertheless disrupts splicing, leading to exon 7 exclusion during SMN protein expression from SMN2 [2].
SMA is characterized by the progressive loss of lower motor neurons, causing muscle atrophy and weakness with a broad spectrum of clinical severity. Traditionally, SMA is classified into five subtypes (types 0–4) based on maximum motor milestone achieved; however, in the era of disease-modifying therapies, the clinical relevance of this classification has gradually decreased. Multiplex ligation-dependent probe amplification (MLPA) remains the gold standard for assessing SMN1 and SMN2 copy numbers (CNs). Approximately 95% of SMA cases result from homozygous deletion of SMN1 exons 7–8 or exon 7 alone, whereas most of the remaining cases are compound heterozygotes carrying a deletion on one allele and a pathogenic variant on the non-deleted allele [3]. SMN2 acts as a disease modifier, with higher SMN2 CN usually associated with a milder phenotype [4].
The most common SMA carrier genotype is the heterozygous SMN1 deletion (1+0) with a frequency of 1:51 globally [5]. Additionally, silent carriers with two SMN1 copies in cis (2+0) exist; variants c.*3+80T>G and c.*211_*212del are linked to SMN1 duplication and may inform about 2+0 carrier risk across populations [6]. Accordingly, the American College of Medical Genetics and Genomics recommends universal carrier screening for all couples [7]. Türkiye launched a nationwide SMA Carrier Screening Program in December 2021 to identify carrier couples and reduce SMA incidence [8].
To date, three SMN-targeting therapies have been approved by the FDA and EMA: the antisense oligonucleotide nusinersen and the small-molecule risdiplam, both targeting SMN2 splicing, and an AAV9-based SMN1 gene replacement therapy. Ongoing clinical trials may provide additional therapeutic options in future [9], further highlighting the importance of SMA diagnosis in the treatment era. In Türkiye, nusinersen and risdiplam are currently available under specific reimbursement criteria [10]. Detecting previously unrecognized cases, often due to phenotypic overlaps with other neuromuscular disorders, is crucial for enabling access to potentially life-altering therapies.
Several bioinformatics methods, three of which are publicly available, have been specifically developed to estimate SMN CNs from short-read next-generation sequencing (NGS) data (Table 1). These approaches predominantly rely on read-depth information and exploit nucleotide differences between the SMN1 and SMN2 genes to infer their CNs. While such methods perform well on genome sequencing (GS) data, their application to targeted sequencing (TS) and exome sequencing (ES) data is more challenging due to heterogeneous capture efficiency [11,12,13,14,15].
SMNCopyNumberCaller enables accurate estimation of SMN1 and SMN2 CNs from GS data and has been widely adopted in population-scale studies [13,16,17]. SMAca was subsequently introduced to facilitate SMA carrier detection; however, it reports raw coverage, the scaled proportion of SMN1 reads at three SMN-discriminating loci, along with a scale factor (SF) reflecting SMN raw dosage, and it was tested only on GS data. These values are used to infer absolute SMN1 CN based on categorization methods described by the authors [14]. More recently, SMA Finder was introduced as a focused approach relying exclusively on read information at the c.840 position, enabling detection of SMA cases with homozygous deletion of SMN1 exon 7 [15].
Systematic evaluation of SMA-specific NGS-based tools in non-European, heterogeneous cohorts remains limited, particularly for ES data generated using different capture kits; also, large-scale profiling of SMN genes in Türkiye is scarce. Here, we applied three publicly available SMA-specific tools to a large Turkish neurodegenerative disease cohort (n = 3493, including 74 known SMA cases), demonstrating their efficient implementation.
Materials and Methods
Study Cohort
The Suna and İnan Kıraç Foundation Neurodegeneration Research Laboratory (NDAL) performs molecular diagnostics primarily for neuromuscular and movement disorders, receiving samples from specialist clinics nationwide. The laboratory has assembled exome (n = 2437) and genome (n = 1056) cohorts, including a small subset of healthy controls. This study includes samples collected between 2005 and 2026. The exome cohort includes 74 confirmed SMA cases, previously validated using SALSA MLPA Probemix P021-B1 SMA and sequenced with the SureSelect v6 exome kit (Agilent Technologies).
Alignment of Short-Read Sequencing Data and Copy Number Analysis
Exome sequencing data were processed described by Khojakulov et al. [18] and genome sequencing data within the Project MinE framework using the standardized pipeline reported by van Rheenen et al. [19] both were aligned to the GRCh38 reference genome.
All SMA cases underwent CN analysis using the SEQ Platform (Genomize, Istanbul, Türkiye), which incorporates Genome Analysis Toolkit (GATK) copy number (CN) analysis and Delly.
SMN CN Analysis Using Bioinformatic Tools
SMNCopyNumberCaller [13], SMAca [14], and SMA Finder [15] were applied with default parameters. SMNCopyNumberCaller was used exclusively for GS samples, whereas SMAca (ES samples stratified by sequencing run) and SMA Finder were applied to both GS and ES samples. To improve callability, SMA Finder was rerun on ES data with the threshold reduced from 14 to 3.
SMN CN Estimation in SMAca
SMAca reports scaled proportional indices (PI values) at three paralogous sequence variants (PSVs): PI_a (c.835-44), PI_b (c.840), and PI_c (c.*3+100). It also provides a scale factor (SF) reflecting SMN raw dosage, where a value of 1 corresponds to four SMN copies. These metrics were used to estimate absolute SMN1 CN by users as previously described (Lopez-Lopez et al., 2020).
As PI values represent the proportion of SMN1 relative to total SMN, they are expected to be zero in samples lacking SMN1 copies, regardless of the SF. In such cases, PSV-specific SMN1 signals are absent (zero reads), and the SF reflects only SMN2 CN, assuming no contribution from SMN2Δ7–8 alleles.
SMAca-derived SMN dosage estimation incorporated SF correction and PI-based carrier classification, followed by a custom post-processing framework for SMN CN, SMA status, carrier status, and quality metrics, described in detail in Supplementary File.
Validation of SMN CN
Putative SMA cases were confirmed by PCR-RFLP as described by van der Steege et al. (1995) and by SALSA® MLPA® Probemix P021-B1 SMA (MRC Holland) according to the manufacturer’s instructions.
Statistical Analysis
Data processing, statistical analyses, and figure generation were performed using Python. Agreement between SMNCopyNumberCaller and SMAca in SMN raw dosage estimates in GS dataset was assessed using Bland–Altman analysis.
Positive predictive value (PPV) was calculated as previously described [15]: PPV = TP/(TP + FP), where TP and FP denote true and false positives, respectively.
Results
Study Cohort Overview
The study cohort comprises a large Turkish neurodegenerative disease dataset, consisting of 2437 ES and 1056 GS samples, a total of 3493 NGS samples (Supplementary Table S1) Among the 74 SMA cases previously confirmed by MLPA in our ES dataset, all cases except one exhibited a homozygous deletion of SMN1 exons 7-8 or exon 7 alone, and the remaining case was a compound heterozygote. The SMN1 homozygous deletion cases (n = 73) were used to evaluate the performance of SMA Finder and SMAca.
Performance of SMA Finder and SMAca in Exome Data
In the ES cohort, the performance of SMA Finder and SMAca was first evaluated for detecting known SMA cases and identifying missed SMA cases. Application of SMA Finder with default settings called only 33 of 73 (45.2%) known homozygous SMA cases; the remaining samples were not callable due to insufficient read coverage at the SMN c.840 position (Figure 1A; Supplementary Table S2). Across the entire ES cohort, running the SMA Finder with default settings identified two new SMA cases and flagged 400 samples as no-call (Figure 1B).
The SMA Finder calling threshold was lowered from 14× to 3× (Supplementary Figure S1), leading to considerably increased callability (71/73; 97.3%) in known SMA cases. Across the ES cohort, i) 73 samples were identified as SMA-positive, including two newly detected cases, ii) 2356 were predicted as SMA-negative and iii) 8, comprising two known SMA cases, were classified as no-calls (Figure 1C). Importantly, SMA Finder classified the compound heterozygous case as SMA-negative due to its limitation of detecting only homozygous SMN1 exon 7 deletions. Considering only callable samples, the positive predictive value (PPV) was 100% (73/73), with no false-positive calls introduced by the lowered threshold.
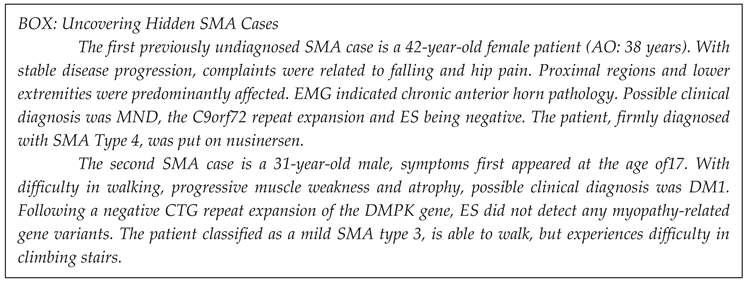
All PI values and the coverage of three PSVs of SMN1 in the SMAca output were equal to zero in almost all 73 known SMA cases. Similarly, SMAca also yielded zero PI values for the two new cases. The SF of both cases was ~1, estimating an overall SMN CN of four; considering the absence of SMN1, total SMN CN reflects the SMN2 copies. PCR-RFLP confirmed SMN1 exon 7–8 deletions in both cases, and MLPA validated zero SMN1 and four SMN2 copies. The cases were referred with preclinical diagnoses of motor neuron disease (MND) and myotonic dystrophy type 1 (DM1), respectively (Box 1). Despite heterogeneous ES capture kits and low-coverage samples, SMAca accurately estimated zero SMN1 copies in 75 SMA cases including the two newly identified SMA patients. Consequently, the PPV of SMAca was also 100% (75/75), comprising the two uncalled SMA samples by the SMA Finder. SMAca, SMA Finder, and MLPA results for SMA cases are provided in the Supplementary Table S3.
Potential homozygous SMN2 deletions were identified in 5.6% of ES samples using SMAca and SMA Finder. Detailed methodology and results are provided (Supplementary File; Supplementary Table S4).
Assessment of Control Gene Coverage Variability
In our cohort, the standard deviation of control gene coverage, stratified by sequencing kit and read length (Figure 2A), was substantially higher in ES than GS, indicating potential technical noise. The mean standard deviation in the 1000 Genomes Project dataset was 1.65 (±0.43), comparable to GS data in our cohort. Both GS data exhibited relatively uniform coverage (~30–40×) across SMN and 20 control genes, whereas ES data showed lower and more variable coverage (<10×), consistent with capture-based design limitations (Figure 2B).
SMNCopyNumberCaller generated accurate calls for all MLPA-validated samples in 1000 Genomes Project (n = 1109), except four samples that yielded no-calls. Contrarily, SMAca produced CN estimates for all samples, but after rounding the SF (×4) to the nearest integer, discrepancies were observed in 30 of 1105 samples (2.7%), differing by one-copy overestimation by SMAca. Incorporating stepwise corrections to the SF prior to rounding (0.025, 0.05, 0.075, 0.1, and 0.125) substantially improved agreement, reducing discrepancies to 7, 2, 1, 2, and 8 samples, respectively. SMNCopyNumberCaller, SMAca, and validation results for 1000 Genomes samples are given in Supplementary Table S5.
Comparison of SMAca-Derived SMN CN Estimates with MLPA in SMA Cases
We evaluated the accuracy of SMAca for estimating SMN CN in ES data from 75 SMA cases with zero SMN1 copies. SMN2Δ7–8 copies were absent in all but one individual (SMA149), who carries two copies each of SMN2 and SMN2Δ7–8. In the absence of SMN2Δ7–8 alleles, SMN CN directly reflected SMN2 CN in the 74 cases. Per-sample comparison of SMN2 CN between MLPA and SMAca (SF×4) showed moderate concordance across the 2–4 copy range, with minor upward bias in SMAca estimates. Rounding to the nearest integer introduced discrepancies in 19/75 samples (25.3%), predominantly reflecting one-copy overestimation (Figure 3A). SMA149 had a SF of 0.96 (corresponding to an estimated total CN of 3–4, depending on rounding), although SMN2Δ7–8 alleles could not be reliably distinguished from raw outputs. Applying incremental corrections to the SF prior to rounding (0.025, 0.05, 0.075, 0.1, and 0.125) markedly improved agreement, reducing discrepancies to 15, 7, 5, 3, and 6 samples, respectively (Supplementary Figure S2). Among tested values, a correction factor of 0.1 showed optimal performance, enabling accurate SMN CN estimation in 72/75 samples (96.0%) (Figure 3B) and was therefore preferred for carrier detection in ES datasets.
Identification of Potential SMA Carriers in ES Data Using SMAca
Using the approach described in the Methods, we identified 71 likely SMA carriers among 2437 samples. After manual curation, 52 samples were retained, corresponding to a carrier frequency of 2.13% (1:47). Of these, 34 (65.4%) were classified as high-confidence carriers (Supplementary Table S6). Notably, two confirmed carriers were classified as moderate-confidence carriers because only one PI value was below the expected threshold, indicating that moderate-confidence carrier calls by the algorithm may still represent true carriers (Supplementary File).
SMN Raw Dosage Comparison in GS
Agreement between SMNCopyNumberCaller and SMAca was assessed by comparing SMN raw dosage across 1056 GS samples; Bland–Altman analysis showed differences centered near zero across the SMN CN range (Figure 3C). The mean difference in raw CN between tools was −0.19, reflecting a small difference, with SMAca yielding higher SMN raw dosage estimates. The 95% limits of agreement (LoA) ranged from −0.49 to +0.11, with no evidence of proportional bias being observed across the CN spectrum.
After rounding to nearest integer values without correction, discrepancy was seen in 42 (4%) samples, differing by ±1 copy. When incremental corrections (0.025, 0.05, 0.075, 0.1, and 0.125) applied to the SF prior to rounding, the discrepancies observed in 16, 8, 11, 35, and 79 samples, respectively. Correction value of 0.05 demonstrated high agreement (99.2%; 1048/1056) between two tools; the mean difference was approximately 0.01, with 95% LoA ranging from −0.29 to 0.31 (Figure 3D).
SMN profiling in a Large Turkish GS Dataset
The three tools consistently identified no SMA-positive cases in the GS cohort, which comprised 1056 samples: 146 controls and 910 sporadic amyotrophic lateral sclerosis cases. Notably, SMA Finder callability was 100% with default settings. However, SMNCopyNumberCaller did not produce SMN CN calls for 12 samples which were consequently excluded from the SMN CN analysis.
SMNCopyNumberCaller and SMAca identified the same 29 individuals as likely SMA carriers (Supplementary Table S7), corresponding to an overall carrier frequency of 2.8% (1:36). The distribution of SMN CNs inferred by SMNCopyNumberCaller in the GS cohort (n = 1044) is shown in Figure 4A-C. Total SMN CN distribution demonstrated that four copies predominated, followed by three copies. In gene-specific analyses, two copies were most common for both SMN1 and SMN2, with the most frequent SMN1–SMN2 CN combinations being 2–2 (51.5%) and 2–1 (31.6%). Beyond the carrier identification, SMN1 CN analysis identified 65 individuals with increased SMN1 copies (>2 copies). For SMN2, CN losses (<2 copies) were observed in 430 samples, including 61 samples (5.8%) with zero copies and 369 samples with a single copy, while increased SMN2 copies were detected in 40 samples. In addition, 168 samples (16.1%) harbored one or more truncated SMN2Δ7–8 alleles; their presence could not be distinguished in raw output of SMAca. SMNCopyNumberCaller and SMAca results for individuals with zero copies of SMN2 and those with truncated SMN2Δ7–8 alleles are presented in Supplementary Tables S8 and S9, respectively. The distribution of SMN CNs in the GS cohort, stratified into controls and cases, is shown in Supplementary Figures S3 and S4, respectively.
SMN1 Duplication Markers Associated with Silent Carriers in GS Cohort
SMNCopyNumberCaller and SMAca identified the same 11 individuals (1.05%) who harbor g.27134T>G (c.∗3+80T>G), demonstrating 100% agreement between the tools. Among these, 2 individuals carried two SMN1 copies who are potential silent carriers; 8 harbored three and 1 had four copies of SMN1 (Supplementary Table S10). SMAca analysis did not identify g.27706_27707delAT (c.∗211_∗212del) variant. Overall, these findings indicate that silent carrier risk modifying variants (SNVs) are rare in our GS dataset.
Dıscussıon
In this study, we i) compared the three publicly available bioinformatic tools specifically designed for SMN genes: SMNCopyNumberCaller, SMAca and SMA Finder in a Turkish neurodegenerative disease cohort, which includes ES data of 74 known SMA cases; ii) utilized SMNCopyNumberCaller results to generate comprehensive SMN CN characterization in a large Turkish GS cohort, and iii) developed an algorithm for SMAca raw output that estimates cases and carriers from ES data. Moreover, since in our heterogeneous ES dataset, implementing SMA Finder with the default settings yielded lower callability compared to the original study [15], iv) we reduced the threshold which resulted in improved callability, without introducing false positives. Collectively, these tools offer distinct, yet complementary strengths and limitations, and their combined use may be advantageous depending on the specific analytical objectives (Table 1).
To our knowledge, five studies have described methodological approaches specifically tailored for SMN CN analysis from short-read NGS data. The earliest work by Larson et al. [11] introduced a Bayesian hierarchical framework leveraging read-depth information from PSVs, demonstrating that locus-specific modeling could overcome the limitations of general-purpose CNV callers [21]; CNV analysis of GATK and Delly could not detect SMN CN changes. Larson et al. [11] also incorporated coverage of control genes, an approach later adopted by SMAca. Subsequently, Feng et al. [12] proposed a related strategy and partially shared implementation details. However, neither study provided a fully publicly accessible software package, limiting their applicability for independent benchmarking. Given our objective to conduct a systematic and reproducible comparative analysis, we restricted our evaluation to three tools with fully accessible implementations that could be uniformly applied across datasets.
Despite differences in modeling and implementation, all current tools rely on a shared strategy combining read-depth analysis with interrogation of SMN1/SMN2 PSVs. This common framework likely explains the high concordance observed between SMNCopyNumberCaller and SMAca in GS data (Figure 3C, D), as well as the complete agreement between SMAca and SMA Finder for detecting homozygous SMN1 deletions in ES data. The ability of SMAca to infer SMN1 CN and SMN dosage from ES data, as demonstrated in SMA cases, addresses a crucial gap in SMA bioinformatics workflows especially for retrospective studies. Nevertheless, its broader adoption has been limited by the need for manual interpretation of raw outputs. To our knowledge, only Boonsawat et al. [22] have applied SMAca to an exome cohort of neurodevelopmental disorder patients, identifying multiple SMA carriers, several of whom were validated with MLPA. We developed a Python-based script to automate SMAca output interpretation. While a permissive approach was preferred to minimize false negatives, results should be evaluated alongside quality metrics. This framework aims to reduce manual burden and improves scalability for ES-based SMA case and carrier screening.
SMA carrier frequency depends on ethnicity, with a global average frequency of ~1:51 [23]. In Türkiye, a carrier frequency of 1:44 was reported in a nationwide screening program that tested over one million individuals [8], a finding further supported by Topcu Yenercag et al. [24] in a regional cohort of ~20,000 individuals. In our computational analyses, carrier frequencies were 1:47 and 1:36 in ES and GS datasets, respectively. The ES-based estimate, derived from a cohort more than twice the size of the GS dataset, was closer to the nationwide figure, underscoring the stabilizing effect of larger sample sizes. Accordingly, Özdemir et al. [25] reported a higher frequency (~1:28) in a cohort of 250 individuals. Similarly, Arikan et al. [26] demonstrated an elevated carrier frequency (~1:6) in a small, preselected cohort of 113 individuals with suspected carrier status. Together, these findings indicate that cohort size can substantially influence SMA carrier frequencies, which may be further refined as large-scale screening programs continue to expand.
The silent carrier risk modifying SNV c.*3+80T>G was identified at a frequency of 1.05%, comparable to Iran (~1.02%) [27], but lower than Qatar (3.66%) [28] and higher than Poland (0.3%) [17]. Population datasets show substantial variability, from ~0.8% in European and South Asian populations to up to 59.2% in individuals of African ancestry, where multiple SMN1 copies are more frequent [29]. To our knowledge, this is the first report of its frequency in a large Turkish cohort. Although its contribution appears limited, combining SNV and CN analyses may improve detection; however, c.*3+80T>G alone is not sufficient to define silent carrier status [6].
SMN2 homozygous deletion frequencies were 5.8% and 5.6% in GS and ES cohorts, respectively. Compared across populations, these rates are substantially lower than in African populations (25.16%) and modestly lower than in European (8.63%) and Admixed American (8.8%) groups, while remaining comparable to South Asian (6.51%) and East Asian (4.72%) populations [13]. Notably, most published estimates are derived from GS datasets; our study extends these observations by incorporating ES data, which remain underrepresented in SMN CN analyses.
To our knowledge, the present study provides the first estimate of SMN2Δ7–8 frequency in a Turkish cohort. The observed frequency (16.1%) lies between those reported in European (21.2%) and admixed American (11.5%) populations, and exceeds estimates from South Asian (3.35%), African (1.1%), and East Asian (0.34%) cohorts [13]. In our cohort, SMN2Δ7–8 was enriched in individuals with zero or one SMN2 copy (Figure 4C), consistent with prior studies [13,30]. Collectively, SMN CN characterization reveals that the Turkish population exhibits a genetically admixed structure, supporting genetic heterogeneity described by Kars et al. [31].
The clinical utility of SMA-specific detection tools is underscored by the substantial phenotypic overlap with other neuromuscular disorders, which can contribute to misdiagnosis. Weisburd et al. [15] reported that 11 of 13 cases flagged as SMA were initially diagnosed as other conditions. Similarly, in our study, two individuals initially diagnosed with MND and DM1 were reidentified as SMA through in silico NGS-based screening and subsequently molecularly confirmed. The diagnostic challenge is particularly pronounced in SMA types 3 and 4, which share clinical features with more prevalent myopathies [32]. Souza et al. [33] described 20 adult patients with SMA type 4, all of whom had prior alternative diagnoses, several were initially classified as limb girdle muscular dystrophy or ALS. The authors reported a mean diagnostic delay of 12.4 years, with patients consulting an average of seven specialists prior to correct diagnosis. Considering the prolonged diagnostic odyssey associated with this mild phenotype, the importance of NGS-based screening is undeniable.
This study has several limitations. Data were generated exclusively using Illumina platforms and BWA alignment [34], limiting generalizability to other sequencing technologies and pipelines. The absence of TS data precluded evaluation of SMA Finder and SMAca in such settings. Validation was restricted to newly identified SMA cases due to the retrospective design and lack of biological samples for carrier confirmation. In addition, the SMAca post-processing script focused on clinically relevant SMN1 CN states (0–1 copies), potentially limiting broader applicability to SMN profiling. Finally, because SMAca does not account for truncated SMN2Δ7–8 alleles, case-level concordance analyses of SMN1 and SMN2 CNs with SMNCopyNumberCaller were not performed in the GS dataset.
In the era of disease-modifying therapies, timely molecular diagnosis of SMA is essential. Our results support the systematic screening of routinely generated NGS data to identify overlooked SMA cases, particularly in milder and adult-onset phenotypes where SMA may be underrecognized, while also facilitating carrier screening for preventive strategies. We demonstrated that SMA Finder reliably identifies homozygous SMN1 deletions in heterogeneous ES datasets, while its combined use with SMAca provides a complementary framework for SMN2 CN estimation. Together, these integrated approaches enhance diagnostic precision and facilitate timely identification of treatable patients.
Supplementary Materials
The following supporting information can be downloaded at the website of this paper posted on Preprints.org.
Author Contributions
Conceptualization: A.N.B., A.Ş., Z.K.; Methodology: A.Ş., Z.K.; Software: Z.K.; Validation: A.Ş.; Formal analysis: A.Ş., Z.K., R.P.; Investigation: A.Ş., Z.K., R.P.; Resources: A.N.B., E.A.A., P.T., Z.Y., C.E.B.K.; Data curation: Z.K.; Writing – original draft: A.Ş., Z.K., A.N.B.; Writing – review & editing: A.N.B., A.Ş., Z.K., R.P., E.A.A., P.T., Z.Y., C.E.B.K.; Visualization: Z.K., A.Ş.; Supervision: A.N.B.; Project administration: A.N.B.; Funding acquisition: A.N.B.
Funding
This work was supported by funds from Suna and İnan Kıraç Foundation and Koç University.
Data Availability
Publicly available data from the 1000 Genomes Project Consortium are accessible via the International Genome Sample Resource (IGSR; https://www.internationalgenome.org). Results of SMNCopyNumberCaller and SMAca for the 1000 Genomes Project, together with MLPA-based validation data, are available in the supplementary materials of the original studies (Chen et al., 2020; Lopez-Lopez et al., 2020) and are additionally provided in Supplementary Table S5. Full raw output files are available from the corresponding author upon reasonable request. The script developed for post-processing of SMAca results is publicly available at: https://github.com/zakhiriddin-kh/SMAca-utils.
Ethics Declaration
This study was approved by the Institutional Review Boards of Boğaziçi University and Koç University (approval no. 2021.287.IRB2.057; July 5, 2021). All procedures were carried out in accordance with the Declaration of Helsinki and received Institutional Review Board approval.
Declaration of AI and AI-Assisted Technologies in the Writing Process
During the preparation of this work the author(s) used ChatGPT in order to improve readability. After using this tool/service, the author(s) reviewed and edited the content as needed and take(s) full responsibility for the content of the publication.
Acknowledgments
NDAL gratefully acknowledges the use of the services and facilities of Koç University Research Center for Translational Medicine (KUTTAM). We sincerely thank Suna and İnan Kıraç Foundation for its generous support of this study, and both the Foundation and Koç University for fostering an inspiring research environment. We are deeply grateful to our clinicians for their contributions, and to all families for their devotion. We also extend our sincere appreciation to the Project MinE Consortium for their invaluable collaboration.
Conflicts of interest
The authors declare no conflict of interest.
References
- Butchbach, M.E.R. Copy Number Variations in the Survival Motor Neuron Genes: Implications for Spinal Muscular Atrophy and Other Neurodegenerative Diseases. Front Mol. Biosci. 2016, 3, 7. [Google Scholar] [CrossRef]
- Costa-Roger, M.; Blasco-Pérez, L.; Cuscó, I.; Tizzano, E.F. The Importance of Digging into the Genetics of SMN Genes in the Therapeutic Scenario of Spinal Muscular Atrophy. Int. J. Mol. Sci. 2021, 22(16), 9029. [Google Scholar] [CrossRef]
- Li, L.; Menezes, M.P.; Smith, M.; et al. Rare homozygous disease-associated sequence variants in children with spinal muscular atrophy: a phenotypic description and review of the literature. Neuromuscul. Disord. 2024, 37, 29–35. [Google Scholar] [CrossRef]
- Wirth, B. Spinal Muscular Atrophy: In the Challenge Lies a Solution. Trends Neurosci. 2021, 44(4), 306–322. [Google Scholar] [CrossRef]
- Eggermann, K.; Gläser, D.; Abicht, A.; Wirth, B. Spinal muscular atrophy (5qSMA): best practice of diagnostics, newborn screening and therapy. Med. Genet. 2020, 32(3), 263–272. [Google Scholar] [CrossRef]
- Milligan, J.N.; Blasco-Pérez, L.; Costa-Roger, M.; Codina-Solà, M.; Tizzano, E.F. Recommendations for Interpreting and Reporting Silent Carrier and Disease-Modifying Variants in SMA Testing Workflows. Genes. 2022, 13(9), 9. [Google Scholar] [CrossRef] [PubMed]
- Prior, T.W. Carrier screening for spinal muscular atrophy. Genet Med. 2008, 10(11), 840–842. [Google Scholar] [CrossRef]
- Evlilik Öncesi Spinal Musküler Atrofi (SMA) Taşıyıcı Tarama Programı. Available online: https://hsgm.saglik.gov.tr/tr/tarama-programlari/evlilik-oncesi-sma-tasiyici-tarama-programi.html (accessed on 17 January 2026).
- Nishio, H.; Niba, E.T.E.; Saito, T.; Okamoto, K.; Takeshima, Y.; Awano, H. Spinal Muscular Atrophy: The Past, Present, and Future of Diagnosis and Treatment. Int. J. Mol. Sci. 2023, 24(15), 15. [Google Scholar] [CrossRef] [PubMed]
- Sosyal Güvenlik Kurumu Sağlık Uygulama Tebliğinde Değişiklik Yapılmasına Dair Tebliğ. 2025, Vol 32882. Available online: https://www.resmigazete.gov.tr/eskiler/2025/04/20250426-4.pdf (accessed on 6 May 2026).
- Larson, J.L.; Silver, A.J.; Chan, D.; Borroto, C.; Spurrier, B.; Silver, L.M. Validation of a high resolution NGS method for detecting spinal muscular atrophy carriers among phase 3 participants in the 1000 Genomes Project. BMC Med. Genet. 2015, 16(1), 100. [Google Scholar] [CrossRef]
- Feng, Y.; Ge, X.; Meng, L.; et al. The next generation of population-based spinal muscular atrophy carrier screening: comprehensive pan-ethnic SMN1 copy-number and sequence variant analysis by massively parallel sequencing. Genet Med. 2017, 19(8), 936–944. [Google Scholar] [CrossRef]
- Chen, X.; Sanchis-Juan, A.; French, C.E.; et al. Spinal muscular atrophy diagnosis and carrier screening from genome sequencing data. Genet Med. 2020, 22(5), 945–953. [Google Scholar] [CrossRef]
- Lopez-Lopez, D.; Loucera, C.; Carmona, R.; et al. SMN1 copy-number and sequence variant analysis from next-generation sequencing data. Hum. Mutat. 2020, 41(12), 2073–2077. [Google Scholar] [CrossRef] [PubMed]
- Weisburd, B.; Sharma, R.; Pata, V.; et al. Diagnosing missed cases of spinal muscular atrophy in genome, exome, and panel sequencing data sets. Genet Med. 2025, 27(4), 101336. [Google Scholar] [CrossRef]
- Moisse, M.; Zwamborn, R.A.J.; van Vugt, J.; et al. The Effect of SMN Gene Dosage on ALS Risk and Disease Severity. Ann. Neurol. 2021, 89(4), 686–697. [Google Scholar] [CrossRef]
- Sypniewski, M.; Kresa, D.; Dobosz, P.; et al. Population WGS-based spinal muscular atrophy carrier screening in a cohort of 1076 healthy Polish individuals. J. Appl. Genet. 2023, 64(1), 135–139. [Google Scholar] [CrossRef]
- Khojakulov, Z.; Palvadeau, R.J.; Kovancılar-Koç, M.; et al. Computational Short Tandem Repeat Genotyping Reveals Clinically Relevant Expansions in a large Turkish Neurodegeneration Cohort. Preprints Preprint posted online. 2026, 2026030755. [CrossRef]
- van Rheenen, W.; van der Spek, R.A.A.; Bakker, M.K.; et al. Common and rare variant association analyses in amyotrophic lateral sclerosis identify 15 risk loci with distinct genetic architectures and neuron-specific biology. Nat. Genet. 2021, 53(12), 1636–1648. [Google Scholar] [CrossRef]
- Auton, A.; Abecasis, G.R.; Altshuler, D.M.; et al. A global reference for human genetic variation. Nature 2015, 526(7571), 68–74. [Google Scholar] [CrossRef] [PubMed]
- Zhao, M.; Wang, Q.; Wang, Q.; Jia, P.; Zhao, Z. Computational tools for copy number variation (CNV) detection using next-generation sequencing data: features and perspectives. BMC Bioinform. 2013, 14(11), S1. [Google Scholar] [CrossRef] [PubMed]
- Boonsawat, P.; Horn, A.H.C.; Steindl, K.; et al. Assessing clinical utility of preconception expanded carrier screening regarding residual risk for neurodevelopmental disorders. npj Genom. Med. 2022, 7(1), 45. [Google Scholar] [CrossRef]
- Wirth, B.; Karakaya, M.; Kye, M.J.; Mendoza-Ferreira, N. Twenty-Five Years of Spinal Muscular Atrophy Research: From Phenotype to Genotype to Therapy, and What Comes Next. Annu Rev. Genom. Hum. Genet. 2020, 21((Volume 21), 231–261. [Google Scholar] [CrossRef]
- Topcu Yenercag, F.N.; Ozturk, S.; Kaya Tarhan, G. From policy to practice: premarital spinal muscular atrophy screening as a public health initiative in northern Türkiye. Front Public Health 2026, 13. [Google Scholar] [CrossRef]
- Özdemir, Y.; Arısoy, R.; Semiz, A.; Şanlıkan, F.; Akar, G.; Çağ, M. Carrier frequency of spinal muscular atrophy in Turkish population. 2022. Available online: https://search.trdizin.gov.tr/tr/yayin/detay/520486/carrier-frequency-of-spinal-muscular-atrophy-in-turkish-population (accessed on 27 April 2026).
- Arikan, Y.; Berker Karauzum, S.; Uysal, H.; et al. Evaluation of exonic copy numbers of SMN1 and SMN2 genes in SMA. Gene 2022, 823, 146322. [Google Scholar] [CrossRef] [PubMed]
- Savad, S.; Modarressi, M.H.; Seifi-Alan, M.; et al. Carrier frequency of spinal muscular atrophy: a large-scale study in Iranian population. Gene Rep. 2025, 41, 102378. [Google Scholar] [CrossRef]
- Ibrahim, F.; Velayutham, D.; Alsharshani, M.; et al. Studying carrier frequency of spinal muscular atrophy in the State of Qatar and comparison to other ethnic groups: Pilot study. Mol. Genet Genom. Med. 2023, 11(12), e2184. [Google Scholar] [CrossRef] [PubMed]
- rs143838139 (SNP) - Population genetics - Homo_sapiens - Ensembl genome browser 115. Available online: https://www.ensembl.org/Homo_sapiens/Variation/Population?db=core;r=5:70951574-70952574;v=rs143838139;vdb=variation;vf=338156203#373509_tablePanel (accessed on 6 April 2026).
- Vijzelaar, R.; Snetselaar, R.; Clausen, M.; et al. The frequency of SMN gene variants lacking exon 7 and 8 is highly population dependent. PLoS ONE 2019, 14(7), e0220211. [Google Scholar] [CrossRef]
- Kars, M.E.; Başak, A.N.; Onat, O.E.; et al. The genetic structure of the Turkish population reveals high levels of variation and admixture. Proc. Natl. Acad. Sci. 2021, 118(36), e2026076118. [Google Scholar] [CrossRef]
- Salort-Campana, E.; Quijano-Roy, S. Clinical features of spinal muscular atrophy (SMA) type 3 (Kugelberg-Welander disease). Arch. Pédiatrie 2020, 27(7 Supplement, 7S23–7S28. [Google Scholar] [CrossRef]
- Souza, P.V.S.; Pinto, W.B.V.R.; Ricarte, A.; et al. Clinical and radiological profile of patients with spinal muscular atrophy type 4. Eur. J. Neurol. 2021, 28(2), 609–619. [Google Scholar] [CrossRef]
- Li, H.; Durbin, R. Fast and accurate short read alignment with Burrows–Wheeler transform. Bioinformatics 2009, 25(14), 1754–1760. [Google Scholar] [CrossRef] [PubMed]
Figure 1.
Coverage variability at the SMN c.840 locus influences SMA Finder calling performance. (A) Read-depth distribution at the SMN c.840 locus by sequencing kit and read length (symmetrical log scale). The dashed line marks the default calling threshold (14 reads). (B) SMA status inferred with default parameters (n = 2437); no-calls indicate insufficient coverage. (C) SMA status after reducing the minimum read-depth threshold to 3 reads. Kits marked with an asterisk (*) denote those used for genome, while the remaining kits were used for exome.
Figure 1.
Coverage variability at the SMN c.840 locus influences SMA Finder calling performance. (A) Read-depth distribution at the SMN c.840 locus by sequencing kit and read length (symmetrical log scale). The dashed line marks the default calling threshold (14 reads). (B) SMA status inferred with default parameters (n = 2437); no-calls indicate insufficient coverage. (C) SMA status after reducing the minimum read-depth threshold to 3 reads. Kits marked with an asterisk (*) denote those used for genome, while the remaining kits were used for exome.
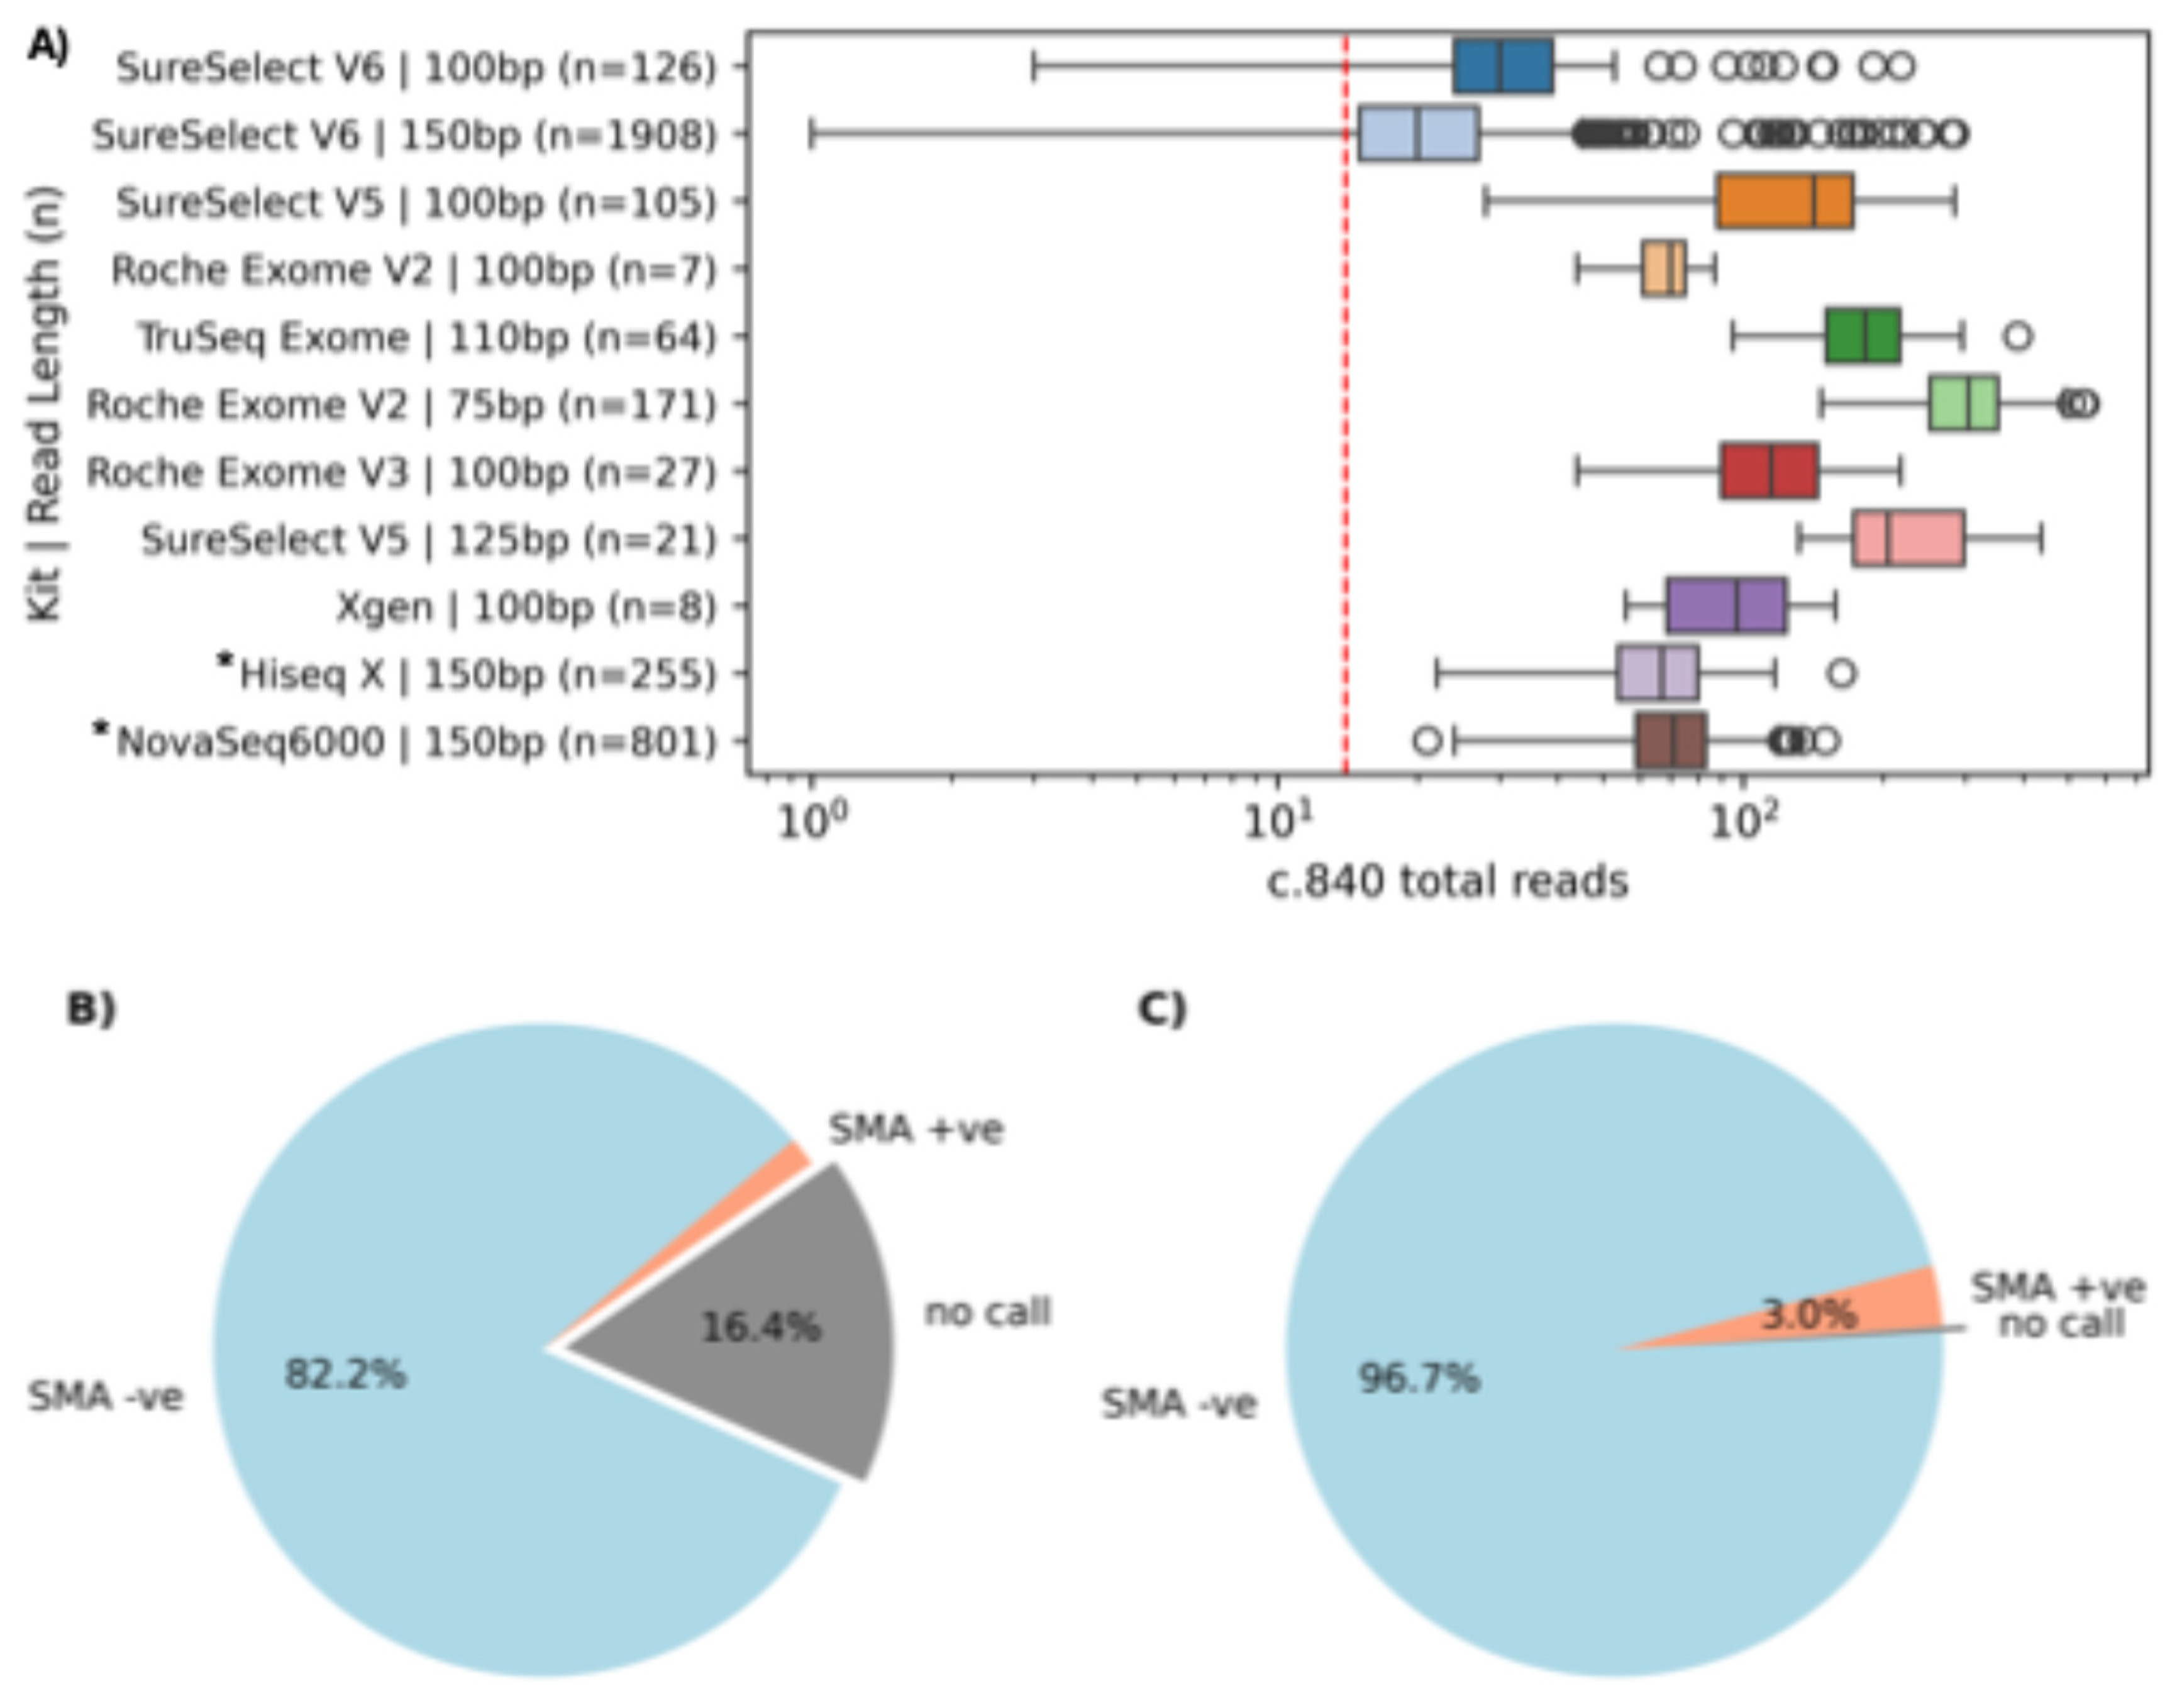
Figure 2.
Coverage variability across sequencing platforms. (A) Distribution of the standard deviation of control gene coverage across different sequencing kits and read lengths, demonstrating substantial variability between platforms. (B) Coverage distributions of SMN genes and 20 control genes in representative datasets (NovaSeq6000, SureSelect V6 exome, and 1000 Genomes), highlighting differences in coverage uniformity between exome and genome data.
Figure 2.
Coverage variability across sequencing platforms. (A) Distribution of the standard deviation of control gene coverage across different sequencing kits and read lengths, demonstrating substantial variability between platforms. (B) Coverage distributions of SMN genes and 20 control genes in representative datasets (NovaSeq6000, SureSelect V6 exome, and 1000 Genomes), highlighting differences in coverage uniformity between exome and genome data.
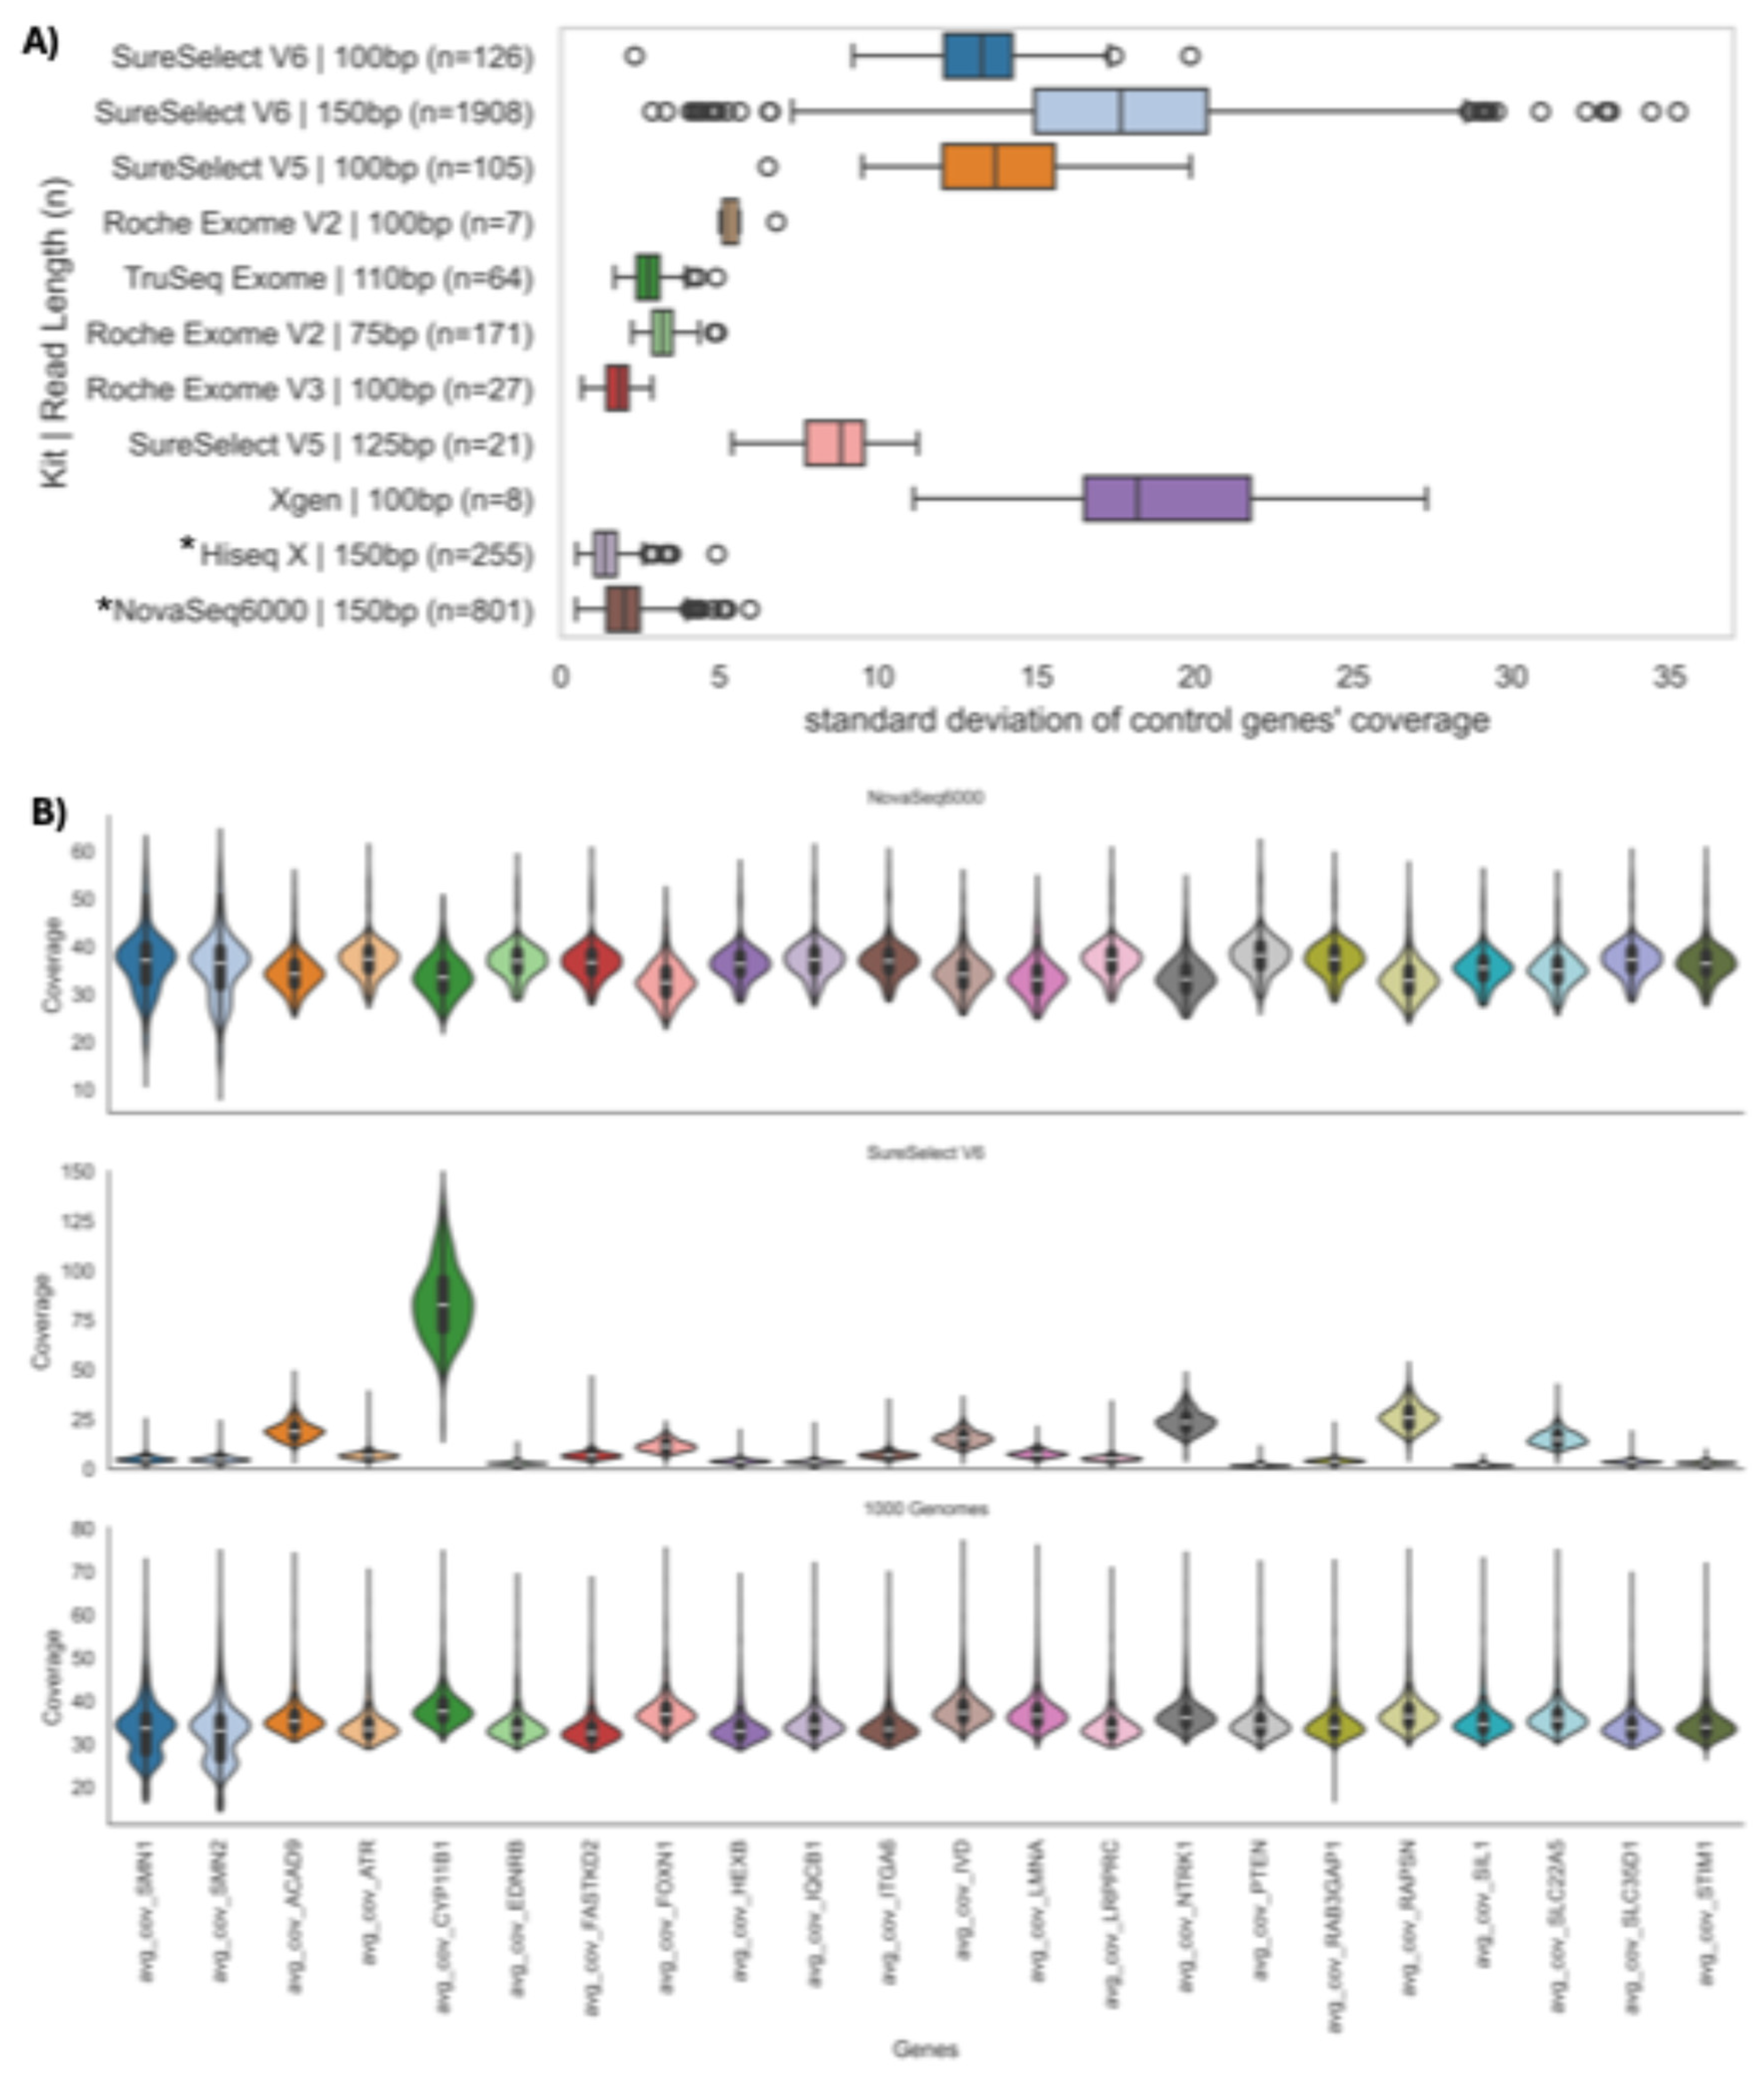
Figure 3.
Per-sample comparison of SMN CN estimation between methods. (A) Comparison of MLPA-derived SMN2 CN and SMAca scale factors across 75 SMA cases. For visualization, a small jitter (±0.1) was applied to MLPA values to reduce point overlap. One sample carrying an additional two SMN2Δ7-8 allele shows an apparent deviation of approximately two copies (indicated by the arrow). After rounding, discrepancies (Disagree) between methods were observed in 19 samples. (B) When applying a 0.1 correction to the SMAca scale factor prior to rounding, discrepancies were reduced to three samples. (C) Bland–Altman analysis of SMN CN estimates across 1056 Turkish genomes shows strong agreement between SMNCopyNumberCaller and SMAca, with a mean difference of −0.19 copies and 95% limits of agreement ranging from −0.49 to +0.11 copies. A total of 42 samples showed disagreement when rounding to nearest values. (D) After applying a 0.05 correction, disagreement was observed in 8 samples and the mean difference was approximately 0.01, with 95% limits of agreement ranging from −0.29 to +0.31.
Figure 3.
Per-sample comparison of SMN CN estimation between methods. (A) Comparison of MLPA-derived SMN2 CN and SMAca scale factors across 75 SMA cases. For visualization, a small jitter (±0.1) was applied to MLPA values to reduce point overlap. One sample carrying an additional two SMN2Δ7-8 allele shows an apparent deviation of approximately two copies (indicated by the arrow). After rounding, discrepancies (Disagree) between methods were observed in 19 samples. (B) When applying a 0.1 correction to the SMAca scale factor prior to rounding, discrepancies were reduced to three samples. (C) Bland–Altman analysis of SMN CN estimates across 1056 Turkish genomes shows strong agreement between SMNCopyNumberCaller and SMAca, with a mean difference of −0.19 copies and 95% limits of agreement ranging from −0.49 to +0.11 copies. A total of 42 samples showed disagreement when rounding to nearest values. (D) After applying a 0.05 correction, disagreement was observed in 8 samples and the mean difference was approximately 0.01, with 95% limits of agreement ranging from −0.29 to +0.31.
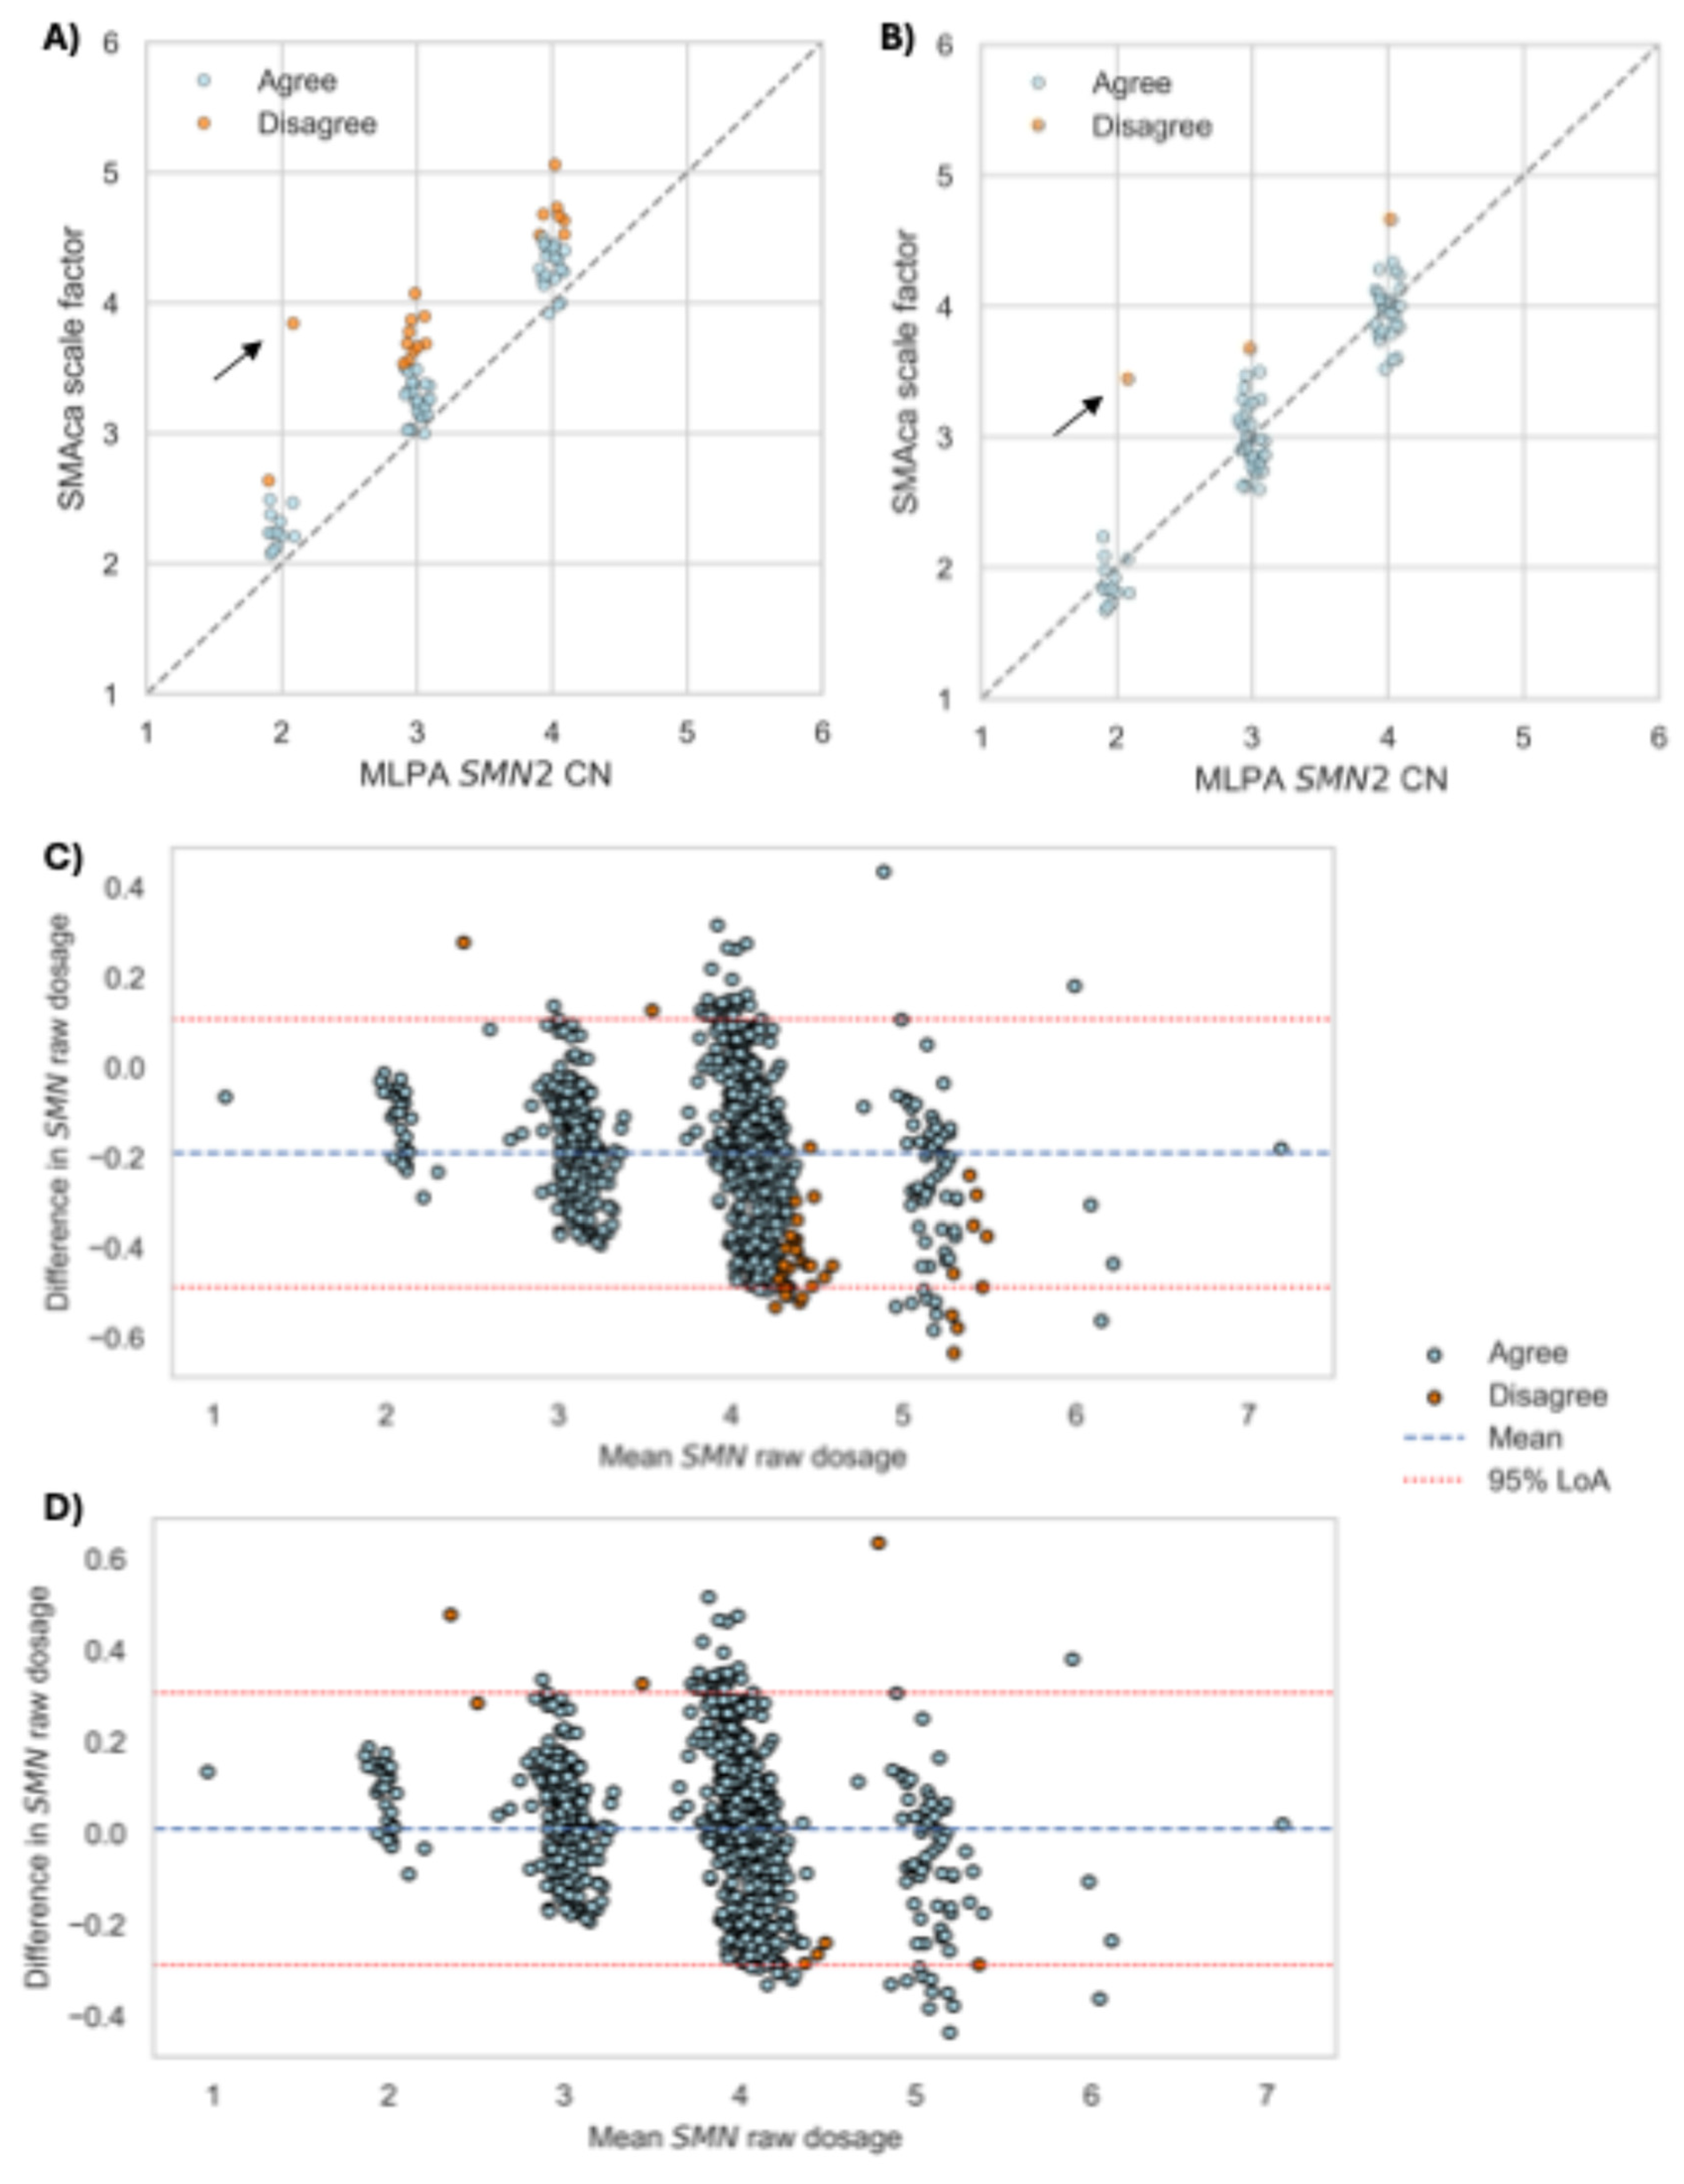
Figure 4.
SMN profiling in 1044 Turkish genomes inferred by SMNCopyNumberCaller. (A) Distribution of total SMN, SMN1, SMN2, and SMN2Δ7–8 CNs. The y-axis is displayed on a square-root scale to improve visualization of low-frequency categories. Contingency tables of (B) SMN1 and SMN2 CNs (C) SMN2 and SMN2Δ7–8 CNs.
Figure 4.
SMN profiling in 1044 Turkish genomes inferred by SMNCopyNumberCaller. (A) Distribution of total SMN, SMN1, SMN2, and SMN2Δ7–8 CNs. The y-axis is displayed on a square-root scale to improve visualization of low-frequency categories. Contingency tables of (B) SMN1 and SMN2 CNs (C) SMN2 and SMN2Δ7–8 CNs.
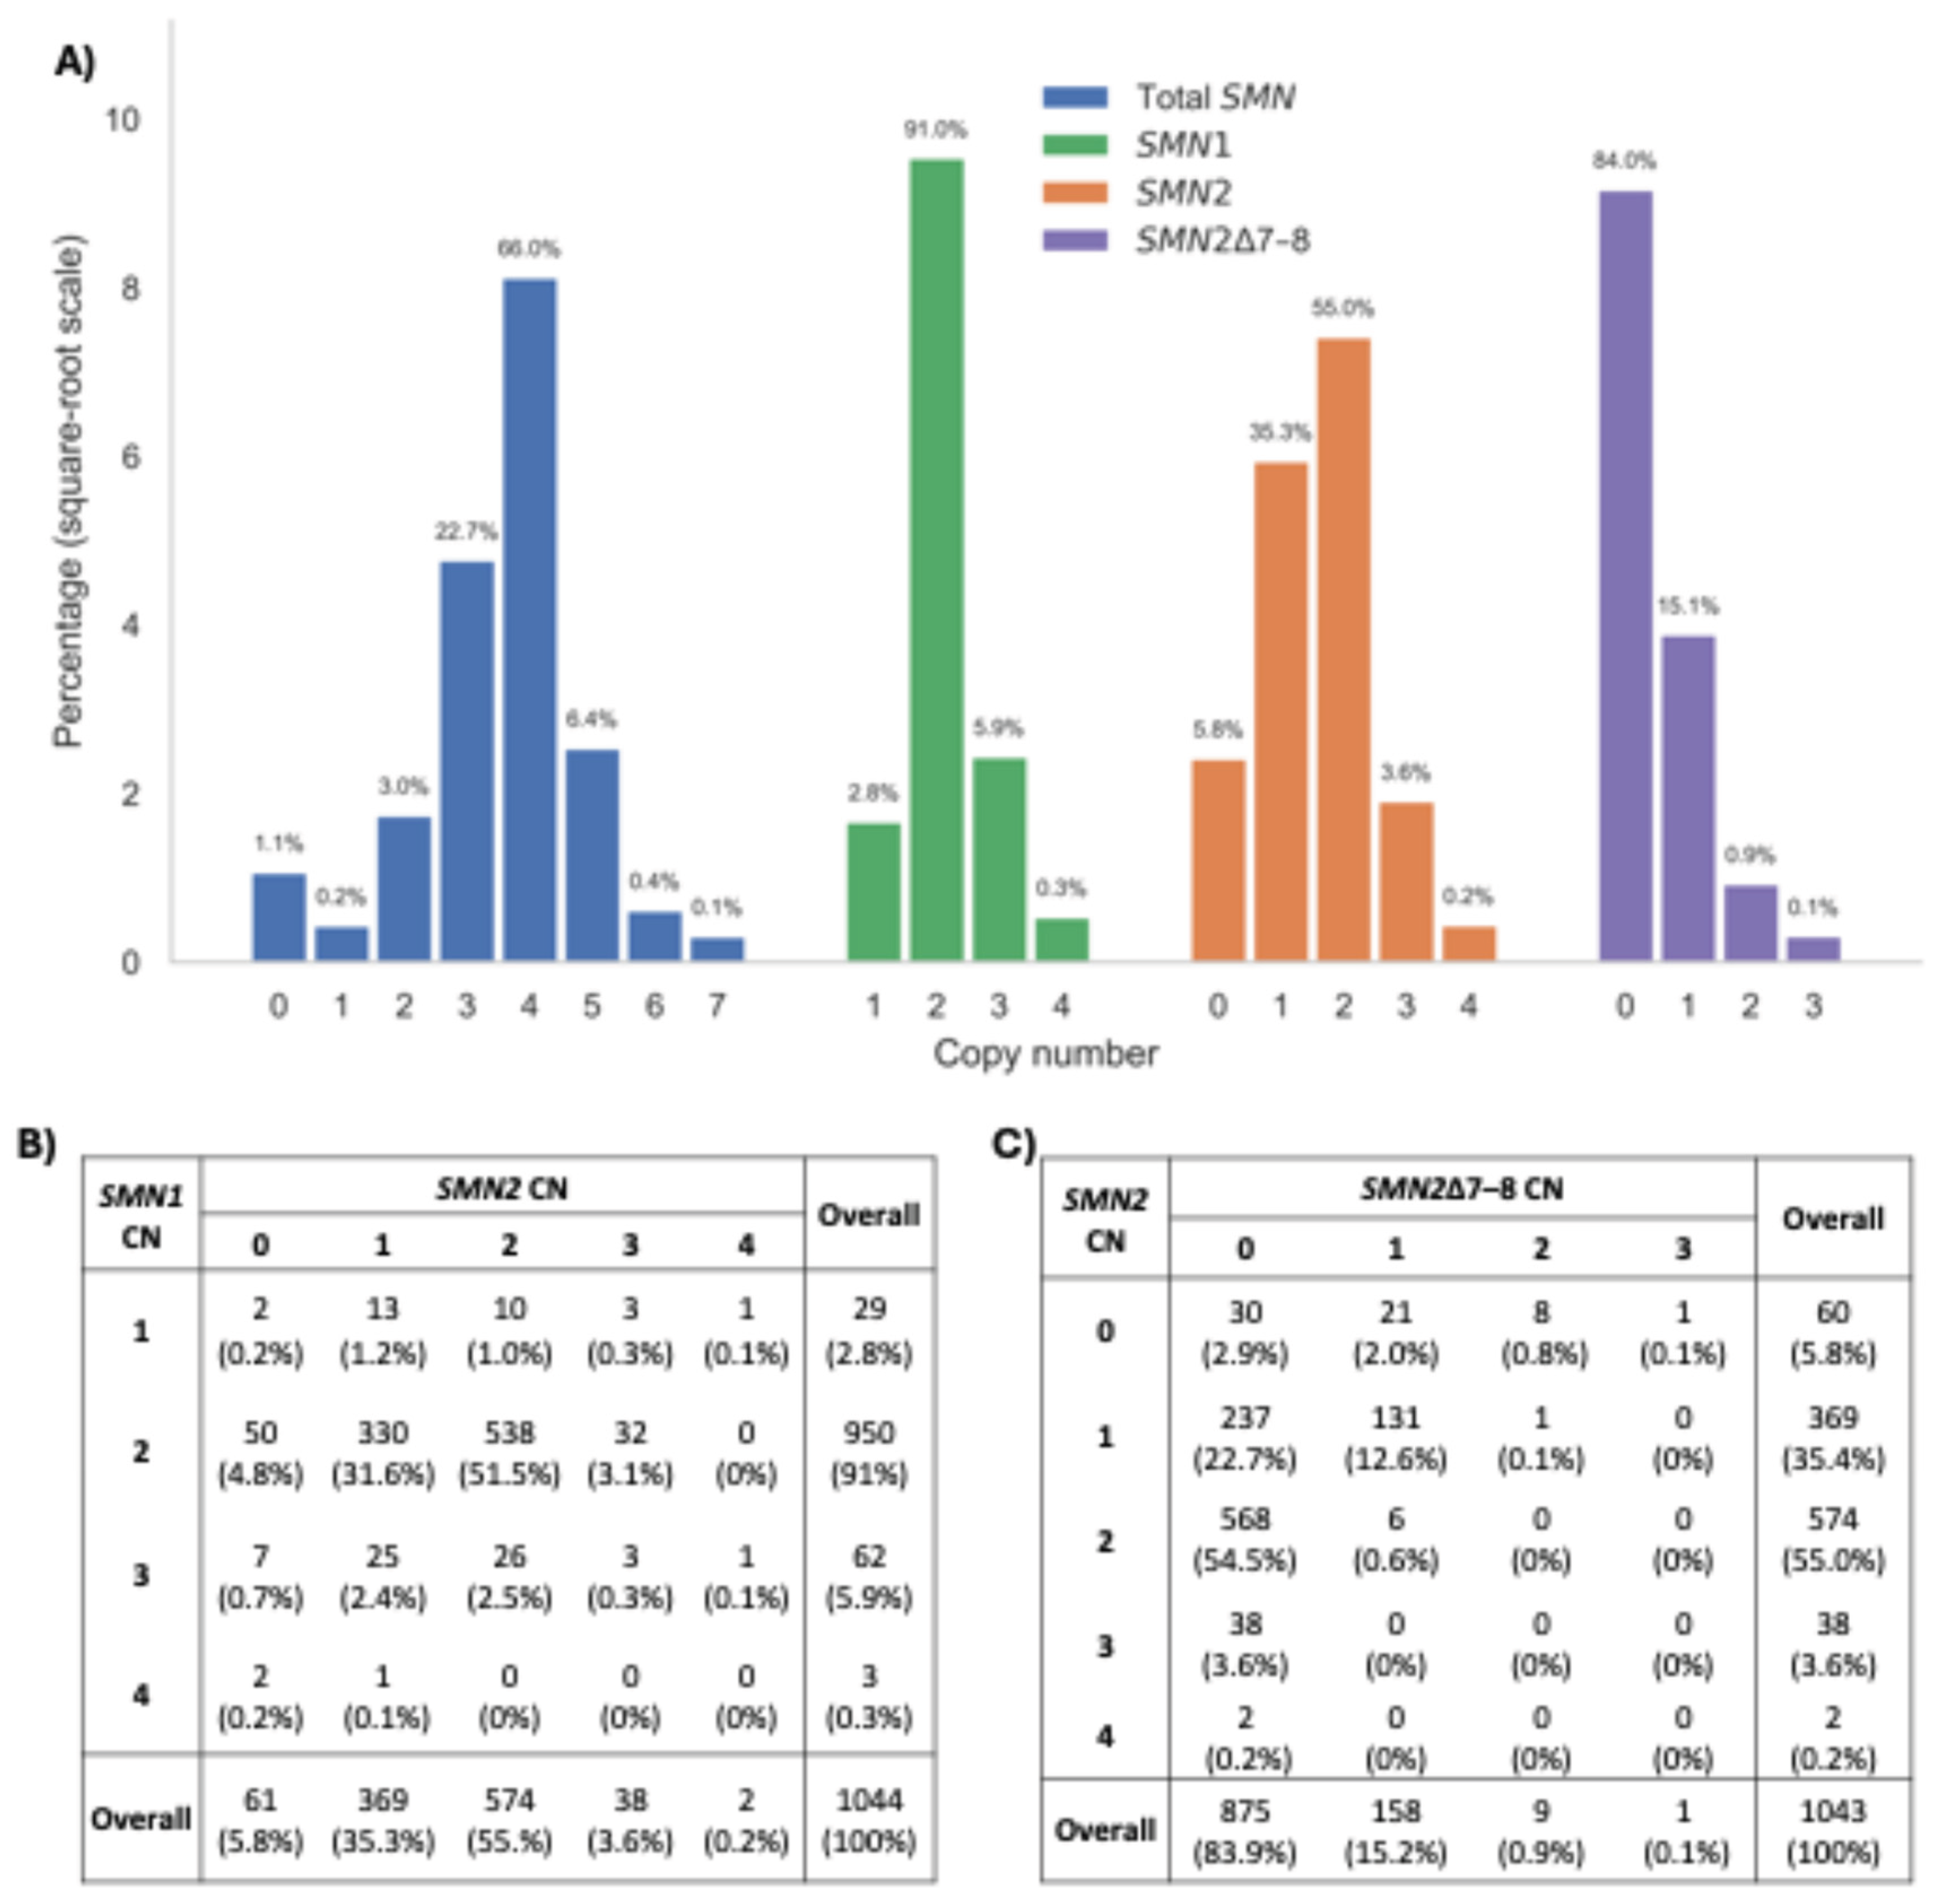

Table 1.
Comparison of SMNCopyNumberCaller, SMAca, and SMA Finder.
| Features | SMNCopyNumberCaller | SMAca | SMA Finder |
|---|---|---|---|
| Primary goal | SMN genes copy number call | SMA Carrier detection | SMA case detection |
| Supported NGS data type | GS | TS*, ES, GS | TS, ES, GS |
| Input data format | BAM, CRAM | BAM, CRAM | BAM, CRAM |
| Reference genome | hg19, hg38 | hg19, hg38 | hg19, hg38, T2T |
| Methodological approach | Read-depth, proportion of PSVs | Read-depth, proportion of PSVs | Read-depth, proportion of c.840 PSV |
| Number of PSVs evaluated | 8 | 3 | 1 |
| Control genes included | No | Yes | No |
| Reports | SMA status, carrier status, SMN CN | Raw proportion of reads of PSVs, scale factor | SMA status |
| Total SMN CN | Yes | Indirect | No |
| SMA detection | Yes | Indirect | Yes |
| Carrier Detection | Yes | Indirect | No |
| Silent Carrier Detection | Yes | Indirect | No |
| Detection of SMN2Δ7–8 | Yes | No | No |
| Strengths | Provides discrete SMN copy number estimates | Detects likely carriers from NGS data | Rapid detection of SMA from NGS data |
| Limitations | Coverage-dependent performance (≥30X) | No direct absolute copy number output | Does not report SMN copy number or dosage |
| Programming Language | Python | Python | Python |
| Output files | TSV, JSON | CSV* | TSV |
| Runtime for 100 WGS samples (8 GB RAM) | 01:50:19 | 01:16:06 | 00:03:53 |
| Runtime for 100 WGS samples (16 GB RAM) | 01:48:33 | 01:10:42 | 00:03:34 |
| PSVs: paralogous sequence variants; TS: targeted sequencing; ES: exome sequencing; GS: genome sequencing; TS*should include control genes; GS samples are in CRAM format; Time in hh:mm:ss | |||
Disclaimer/Publisher’s Note: The statements, opinions and data contained in all publications are solely those of the individual author(s) and contributor(s) and not of MDPI and/or the editor(s). MDPI and/or the editor(s) disclaim responsibility for any injury to people or property resulting from any ideas, methods, instructions or products referred to in the content. |
© 2026 by the authors. Licensee MDPI, Basel, Switzerland. This article is an open access article distributed under the terms and conditions of the Creative Commons Attribution (CC BY) license (http://creativecommons.org/licenses/by/4.0/).
Copyright: This open access article is published under a Creative Commons CC BY 4.0 license, which permit the free download, distribution, and reuse, provided that the author and preprint are cited in any reuse.