

Submitted:
14 May 2026
Posted:
18 May 2026
You are already at the latest version
Abstract
The aim of the study was to examine the effect of respiratory muscle strength parameters obtained from endurance athletes on aerobic capacity levels. A total of 70 endurance athletes, 23 females and 47 males, voluntarily participated with the study. Respiratory muscle strength of the athletes were measured with a digital spirometer. Max VO2 was assessed using the cardiopulmonary exercise testing system (Cosmed K5). As a result of the research; MIP and MEP values were determined to be related to PETCO2 value at maximum load in female endurance athletes. In male endurance athletes, MEP values were determined to be related to PETCO2 values at maximum load, PETO2 values at maximum load, MaxVO2 values, VO2 values at RCP, and VO2 values at VT. Additionally, in male endurance athletes, the MIP value was determined to be related to the VCO2 value at RCP and the VTidal value at maximum load. Other Max VO2 sub parameters examined were not associated with respiratory muscle strength. Research results reveal that there are relationships between maximal oxygen consumption which is the most important indicator of aerobic performance and its sub-parameters and respiratory muscles.
Keywords:
endurance athlete
; maximum oxygen uptake
; inspiratory pressure
; expiratory pressure
1. Introduction
The respiratory system of healthy young individuals generally is not considered a significant limiting factor for high-intensity endurance exercise (Amann, 2012). The reason for this is that the healthy lung system capacity in most people is sufficient to meet the demands for ventilation and gas exchange even during strenuous endurance exercise. The majority of untrained individuals, even well-trained individuals, are characterized by a small increase in alveolar and arterial O2 difference from rest to VO2 Max, of only two to three units. This small change indicates a largely uncompromised and sufficient O2 diffusion rate across the alveolar-capillary membrane (Dempsey and Wagner, 1999).
In general, the respiratory system in healthy young individuals can be considered adequately equipped to meet the pulmonary gas exchange demands associated with even high-intensity endurance exercise. In some well-trained endurance athletes, the metabolic demand associated with high-intensity exercise may necessitate excessive ventilation and pulmonary gas exchange.
This situation may reach or exceed the functional capacity of the respiratory systems and eventually compromise arterial oxygenation and limb O2 transport (Harms et al., 1997).
Arterial desaturation during exercise may also occur due to an inadequate hyperventilatory response secondary to reduced chemoreceptor sensitivity (e.g., poor response to circulating chemical stimuli such as protons, catecholamines, adenosine, or potassium) (Murias, Blanch, & Lucangelo, 2014).
In addition, mechanical restrictions presented by the airways may contribute to this condition (Guenette et al., 2007). Inadequate respiratory responses during exercise have been shown to reduce PAO2, negatively affecting arterial blood gas status and SaO2 (Johnson et al., 1996). The respiratory response during strenuous exercise which is often accompanied and impaired by expiratory flow restrictions and dynamic hyperinflation (Johnson, Saupe, & Dempsey, 1992), requires significant increases in both inspiratory and expiratory muscle work and can often lead to respiratory muscle fatigue (Romer and Polkey,2008).
However, strenuous contractions and the resulting accumulation of metabolites in the inspiratory and expiratory muscles activate unmyelinated group IV phrenic afferents (Hill, 2000), these ones reflexively increase sympathetic vasoconstrictor activity (St Croix et al., 2000) and vasoconstriction in the vascular system of the exercising limb.
The result is a decrease in QL and an increase in blood flow to the respiratory muscles, suggesting a relationship that involves a struggle for limited cardiac output (Musch, 1993). These effects do not occur during exercise at intensities below ~80% VO2max (Wetter et al., 1999). Fatigue-induced metabolite accumulation in respiratory muscles activates group III/IV phrenic afferents, which reflexively cause increased sympathetic efferent outflow and vasoconstriction in the extremities. This sequence facilitates locomotor muscle fatigue and limits endurance exercise performance (Dempsey et al., 2002).
In light of this information in the literature, our aim is to examine the effect of respiratory muscle strength on aerobic capacity level of endurance athletes.
We aim to determine the existence of the relationship between respiratory muscle strength and maximal oxygen consumption, which is the best indicator of the endurance of the cardiovascular system, and to provide a reference for coaches and athletes.
2. Method
2.1. Study Design and Participant Selection
Seventy endurance athletes, 23 female and 47 male, participated voluntarily in the study. Ethical approval for the study was obtained from Gazi University Ethics Committee (No: 2023-1133). The study was completed in accordance with the guidelines of the Declaration of Helsinki. All participants signed an informed consent form. Inclusion criteria for the study; not smoking, not having any respiratory diseases such as asthma, pulmonary tuberculosis, emphysema and chronic bronchitis were defined. Athletes using any medication were not included in the study. Athletes who met the study criteria were evaluated on the same day. Demographic information of the athletes (age, years of sports, number of training days per week, number of hours of training per day) was recorded. Information about the athletes is shown in Table 1 and Table 2.
Figure 1.
Research design workflow diagram.
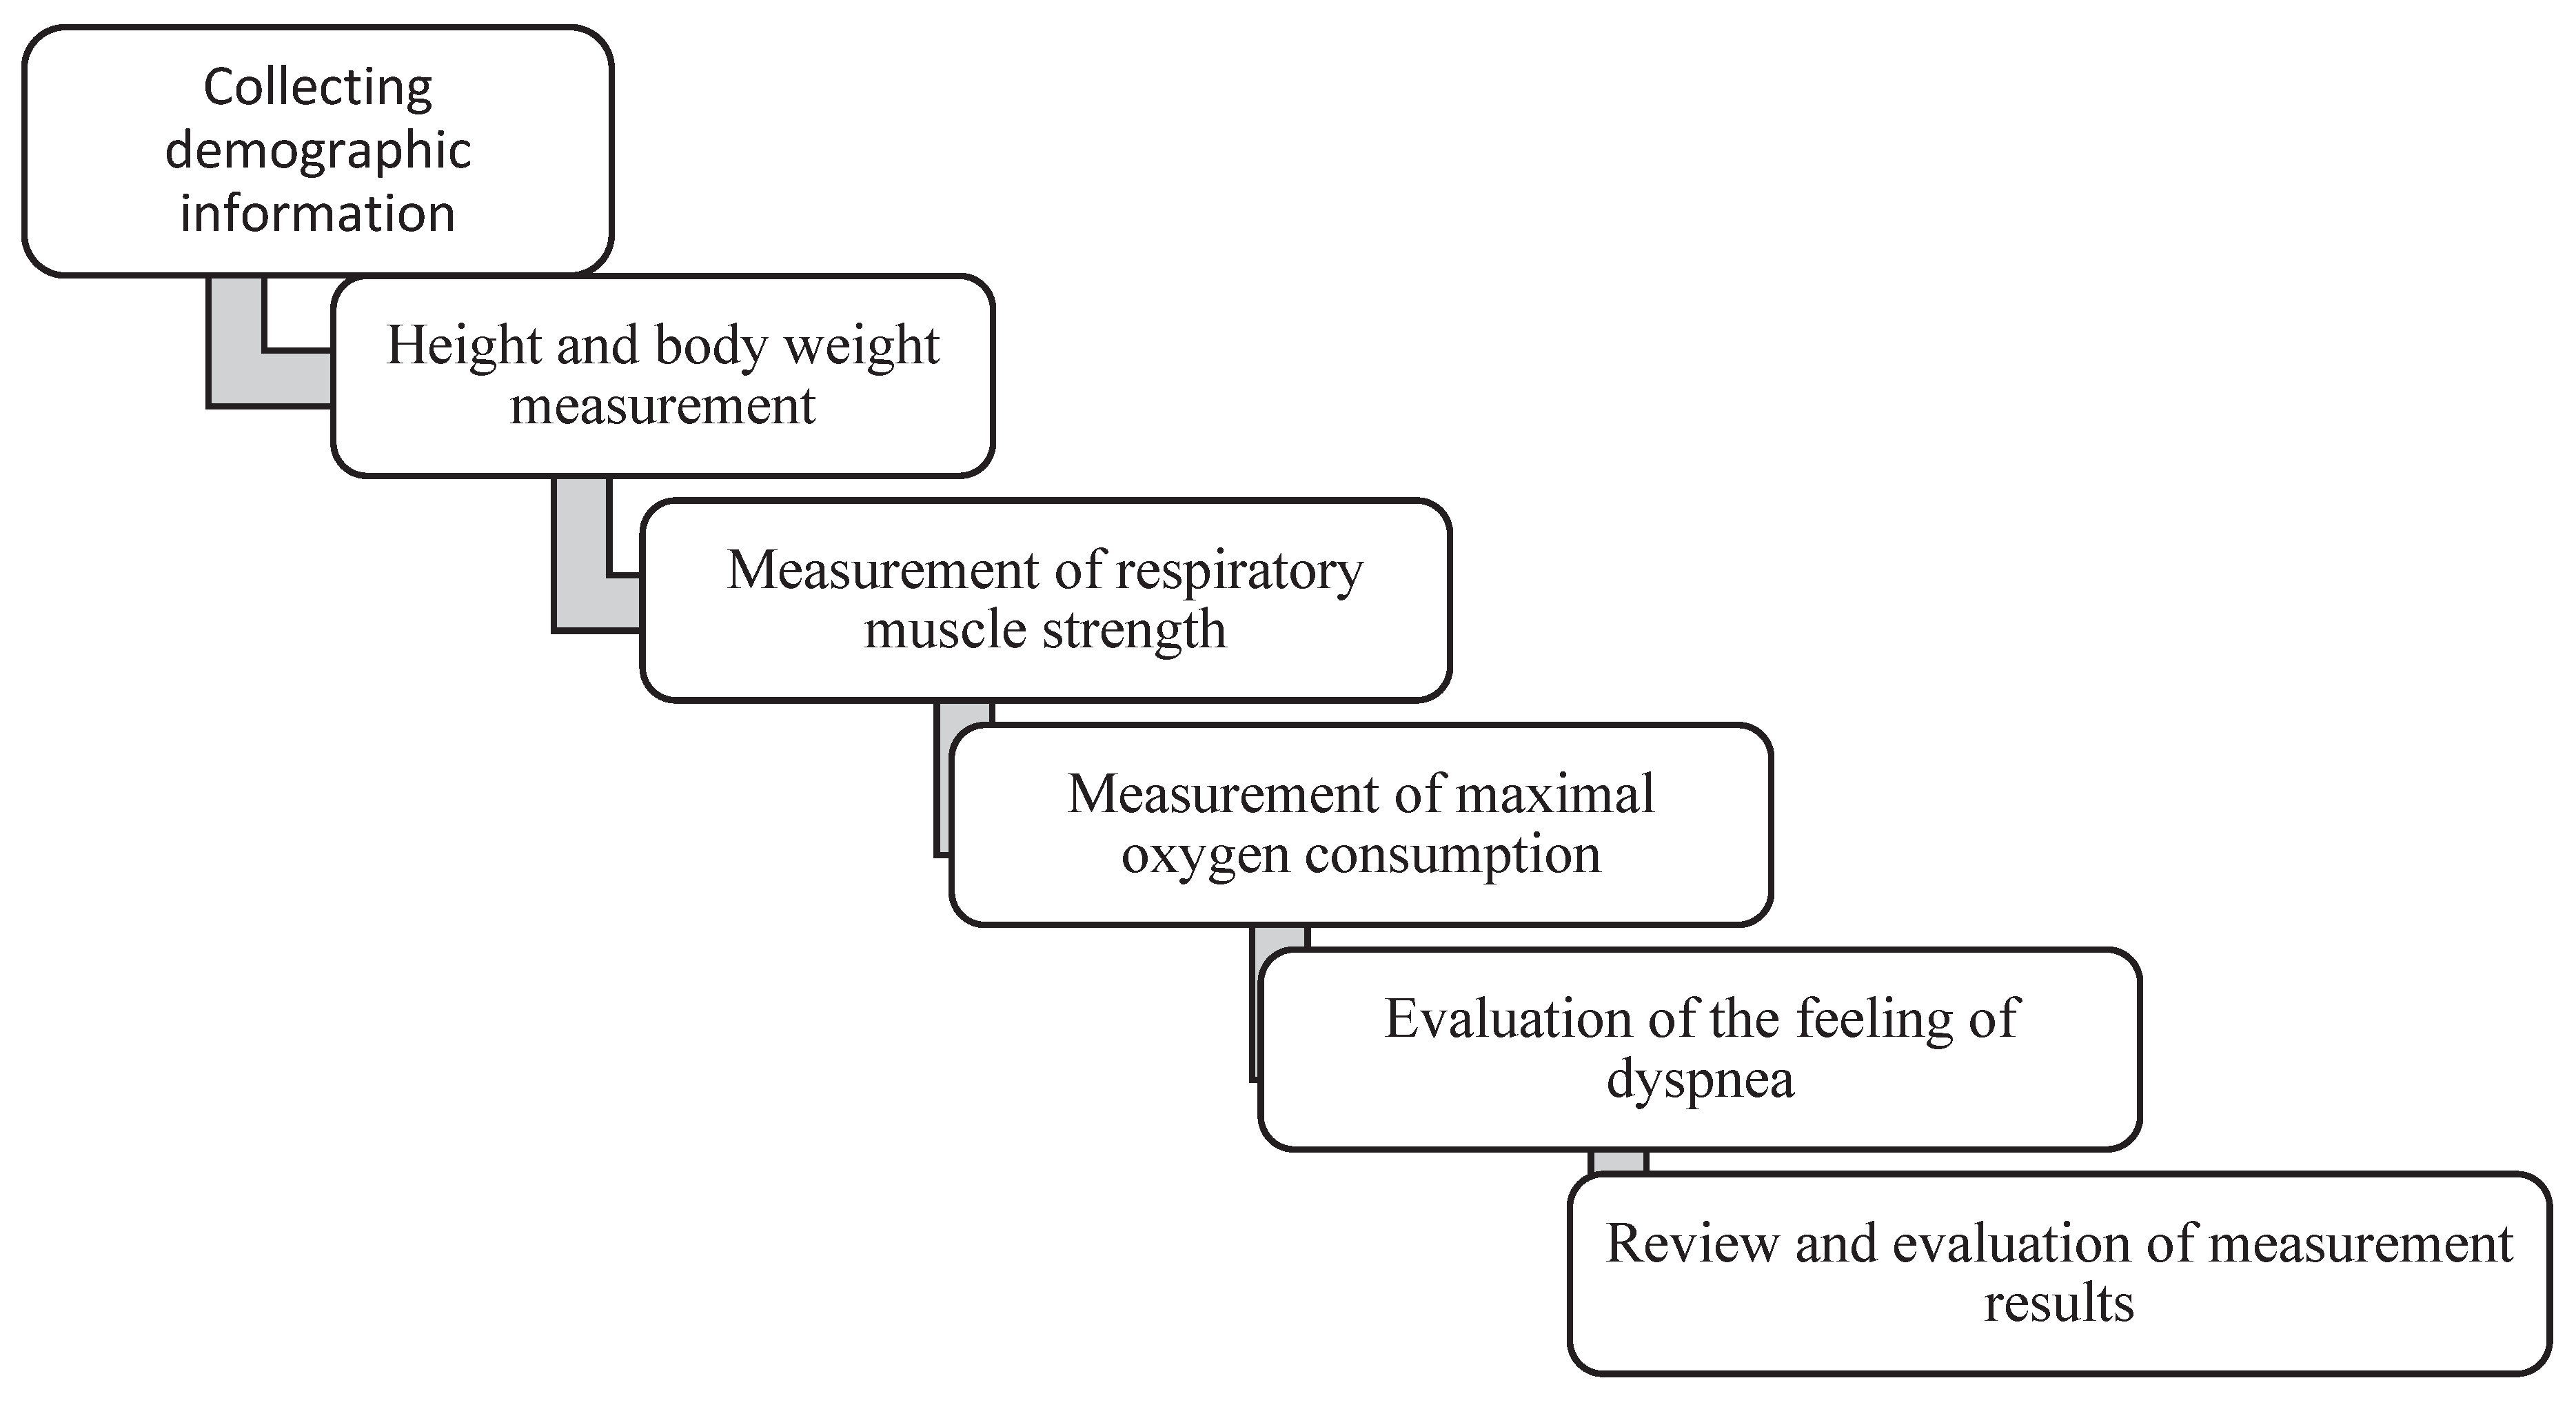
Respiratory muscle strength of the athletes was evaluated with a digital spirometer (Pony FX Cosmed, Italy).Maximum oxygen uptake (MaxVO2) was assessed using the cardiopulmonary exercise testing system (Cosmed K5, Italy, Serial No: 2019030706). A Seca brand stadiometer with a precision of ± 1 mm was used to measure the athletes' heights, and a Seca (761) brand mechanical scale was used to determine the participants' body mass. A motorized treadmill (H/p/cosmos/pulsar, Switzerland) was used for exercise tests with increasing workload.
2.2. Height and Body Weight Measurement
A Seca brand stadiometer with a precision of ± 1 mm was used to measure the height of the athletes. During the measurement, the athletes were asked to step onto the device without shoes, stand in an anatomical posture, touching the overhead table the vertex point with their heads in the frontal plane. Measurement results were recorded in cm. To determine the body weight of the athletes, a Seca (761) brand mechanical scale was used. During the measurement, the athletes were asked to step onto the device with bare feet and stand still. Data were recorded in kg.
2.3. Assessment of Respiratory Muscle Strength
Athletes were informed before the tests and the tests were performed in a comfortable sitting position. During the tests, the athlete's nose was closed with a clip and he was asked to cover the mouthpiece with his lips, leaving no gaps at the corners of the mouth to prevent air from escaping from the spirometer mouthpiece. Tests were performed by performing respiratory maneuvers through the spirometer mouthpiece. Before the tests, a few trial tests were conducted to understand the application and adapt to the device. Participants were allowed to rest for 1 minute between each trial and were asked to repeat the protocol 5 times (Sachs et al., 2009).
The best measurement score was used in statistical analyses.
Maximum inspiratory pressure (MIP) and maximum expiratory pressure (MEP) tests were performed to evaluate the strength of the respiratory muscles. For the MIP test, the athlete must first completely empty the air from their lungs and then take a full, deep, fast and forceful breath; For the MEP test, the athlete was asked to first fill her/his lungs completely with air and then exhale quickly and forcefully. Each test was repeated 5 times with rest between repetitions. Data were recorded. The best results of all tests were taken and analyzed.
2.4. Assessment of Aerobic Capacity (MaxVO2)
Maximum oxygen uptake (VO2 Max) was assessed using a portable cardiopulmonary exercise testing system (Cosmed K5, Italy, Serial No: 2019030706), known for its precision in automatic gas analysis of expiratory air. The calibration accuracy of the device with a known gas mixture (5.0% CO2 and 16.0% O2) was ensured. To reduce environmental influences on performance, laboratory conditions were tightly controlled with temperature maintained between 18-23°C and relative humidity kept below 70% (Weakley et al., 2024). The athlete's running was monitored in accordance with the test completion criteria used in the treadmill protocols used for aerobic capacity and power measurements. To determine the MaxVO2 parameter, after a 2-minute warm-up at a speed of 6 km/h on the treadmill, they were asked to run in a protocol where the speed of the treadmill increased by 1 km/h every 90 seconds and the incline increased by 0.5% with this speed increase (Deliceoglu et al., 2024). The athlete's perceived fatigue level on the original Borg scale is 17 or above and the athlete says that he is tired, despite increased workload, oxygen consumption no longer increases, The ratio of carbon dioxide production to oxygen consumption (RQ) reaches 1.15 or higher,
heart rate is 85% or more of the maximal heart rate, Observing three of the following criteria simultaneously, such as not observing an increase in heart rate despite increased workload,
The test was concluded by accepting this as an indication that maximal oxygen utilization capacity had been reached. The average of the aerobic capacity values obtained in the last 30 seconds with an automatic portable gas analysis program was taken and their ratio to the athletes' body weights was calculated (Gocentas et al., 2011).
In gas analyses, minute ventilation (VE), oxygen volume per minute (VO2), and carbon dioxide volume produced per minute (VCO2) were directly measured and the last 30 seconds of O2 use were recorded as Max VO2. The V-Slope method was used to determine the Ventilatory Threshold (VT) and Respiratory Compensation Point (RCP) (Beaver, Wasserman, & Whipp, 1986). After plotting the VO2 curve corresponding to VCO2 for determining VT and the VCO2 curve corresponding to VE for determining RCP, the intersection point of the two regression lines was determined by performing linear regression analysis. VO2 (ml/kg/min) value, running speed (km/h), heart rate and running time corresponding to VT and RCP points were determined. Additionally, CO2 and VCO2 values at the respiratory threshold, respiratory compensation point, and VE, VTidal, PETCO2, PETO2 values and VE/VCO2, VE/VO2 ratios at maximum load were recorded.
2.5. Evaluation of the Feeling of Dyspnea
The Modified Borg Scale, developed by Borg (1982) to measure the effort expended during physical exercise, was used to determine the feeling of dyspnea in athletes. This scale consists of ten items that define the severity of dyspnea according to its degree. The athlete was asked to rate the shortness of breath she/he felt on a scale of 0 to 10 after completing the cardiopulmonary exercise test. Data were recorded according to the athlete's statement.
2.6. Statistical Analysis
The data collected in accordance with the hypothesis determined within the scope of the research were recorded. The minimum number of athletes to participate in the research was determined to be at least 67, calculated using the G-Power method. Skewness and Kurtosis values were examined to determine the distribution in the analysis part of the obtained data.
Linear regression analysis was performed to explain the relationship between the dependent variable and the independent variable and to determine how much of the variation in the dependent variable was explained by the independent variables. All statistical analyses were performed using the SPSS 26.0 software program. The study had a power of 0.80 and a margin of error of 0.05.
3. Results
When the distribution of ages between groups was examined, the prevalence of female's ages was found to be 21% on average, while the coefficient of variation for male was found to be 25%. The female group shows a more homogeneous distribution in terms of age than the male group. When the distribution of heights between groups was examined, women's heights showed a prevalence of 3% around the mean, while the coefficient of variation for men was found to be 4%. When body weights were examined, the coefficient of variation was found to be 9% for females and 13% for males.
When the distribution of within-group variables is examined, it is seen that the female group is more homogeneous in terms of age (DK=21.03) and height (DK=3.29) and weight (DK=9.17) variables. When the data of the male group is examined, it is seen that while the prevalence is high according to age (DK=25.59), it is a more homogeneous group according to the height (DK=4.02) and weight (DK=13.28) variables (Alpar, 2014, pp. 108-109).

Table 3.
Coefficients of variation of female (n=23) and male (n=47) endurance athletes.
| Gender | Characteristics | X̄ | SD | CV (%) |
|---|---|---|---|---|
| Female | Age (Years) | 20.39 | 3,67 | 21.03 |
| Height (cm) | 163 | 5,36 | 3.29 | |
| Body Weight (kg) | 53.35 | 4,89 | 9.17 | |
| Male | Age (Years) | 23.00 | 5,24 | 25.59 |
| Height (cm) | 175.36 | 7,05 | 4.02 | |
| Body Weight (kg) | 67.45 | 8,96 | 13.28 |
X̄: mean, SD: Standard Deviation, CV: Coefficient of Variation.
Table 4.
Descriptive statistics of respiratory muscle test measurements of male and female endurance athletes.
Table 4.
Descriptive statistics of respiratory muscle test measurements of male and female endurance athletes.
| Characteristics | Female | Male | ||||||
|---|---|---|---|---|---|---|---|---|
| Min. | Max. | X̄ | SD | Min. | Max. | X̄ | SD | |
| MEP (cmH2O) | 85.00 | 222.00 | 160.65 | 41.37 | 68 | 229.00 | 121.94 | 36.78 |
| MIP (cmH2O) | 67.00 | 168.00 | 123.57 | 26.44 | 68 | 206.00 | 100.85 | 30.75 |
MEP: maximum expiratory pressure; MIP: maximum inspiratory pressure.
When respiratory muscle strength values were examined, MEP and MIP values were found to be higher in female athletes than in male athletes.
Table 5.
Descriptive statistics of cardiopulmonary exercise test measurements of male and female endurance athletes.
Table 5.
Descriptive statistics of cardiopulmonary exercise test measurements of male and female endurance athletes.
| Characteristics | Female | Male | ||||||
|---|---|---|---|---|---|---|---|---|
| Min. | Max. | X̄ | SD | Min. | Max. | X̄ | SD | |
| Max Speed (km/h) | 13 | 16 | 14.91 | 0.79 | 13 | 18 | 16.47 | 1.03 |
| MaxVO2 (ml/min/kg) | 42.90 | 72.70 | 56,44 | 7.40 | 42.90 | 81.00 | 60.43 | 6.98 |
| Max Time (min) | 12:15 | 16:15 | 14:23 | 1:02 | 13:34 | 19:20 | 16:51 | 1:08 |
| Max RQ | 1.09 | 1.39 | 1.22 | 0.08 | 0.85 | 1.38 | 1.20 | 0.11 |
| Rating of Perceived Exertion | 4 | 10 | 5.70 | 2.77 | 3 | 10 | 5.60 | 2.3 |
| VT-Time (min) | 5:45 | 11:40 | 9:11 | 1:18 | 6:40 | 14:10 | 10:59 | 1:44 |
| RC-Time (min) | 8:55 | 14:00 | 11:47 | 1:16 | 7:40 | 16:45 | 13:52 | 1:45 |
| VT-Speed (km/h) | 9 | 13 | 11.22 | 0.85 | 10 | 14 | 12.40 | 1.17 |
| RC- Speed (km/h) | 11 | 14 | 12.96 | 0.82 | 10 | 16 | 14.36 | 1.24 |
| VT-HR (puls) | 102 | 195 | 172.57 | 18.28 | 123 | 194 | 166.96 | 14.93 |
| RC-HR (puls) | 101 | 206 | 182.43 | 20.62 | 124 | 211 | 178.26 | 14.69 |
| Max-HR (puls) | 184 | 205 | 199.35 | 5.82 | 164 | 206 | 194.70 | 8.94 |
| Average Respiratory Frequency (1/min) | 32.06 | 50.56 | 42.41 | 5.40 | 31.05 | 56.67 | 42.50 | 5.59 |
When the cardiopulmonary exercise test results are examined, it is seen that male athletes have higher results than female athletes. However, female athletes Max RQ values, VT-HR, RC-HR and Max-HR values were found to be higher than male athletes.
The average respiratory frequency of female athletes was also found to be slightly lower than that of male athletes.
When Table 6 is examined, it was determined that the regression model created for male and female endurance athletes in all parameters had low level prediction rates in male and female according to R2 values. According to the model, it was observed that MEP and MIP variables had a significant effect on PET CO2 in female and MEP variable in male. The MEP variable was associated with PET O2 in male, but not in female. In the study VE at Max Load, VE/VO2 at Max Load, VT VCO2, VE/VCO2 at Max Load were not associated with respiratory muscle strength in both male and female. VTidal at max load was associated with the MIP variable in male but not in female. In male, RCP VCO2 and VTVO2 were associated with MIP, while RCPVO2 was associated with MEP, no association was found in female for all these parameters.
4. Discussion
According to the literature; Bussotti et al., (2008) stated in their studies on endurance athletes that the subjects with the lowest value of PETCO2 reached the lowest peak workload and VO2 during exercise. They stated that athletes with the lowest PETCO2 were most likely to have the greatest exercise-induced acidosis, leading to reduced exercise capacity. Other studies have shown that endurance athletes have a well-defined ventilation pattern, spending less ventilation in dead space and thus requiring less work of the respiratory muscles (Johnson et al. 1992).
Our study indicates that respiratory efficiency is related to respiratory muscle strength, especially in female.
Females experience a higher respiratory muscle workload than males for a given absolute V̇E during exercise, require a higher oxygen uptake by their respiratory muscles, and have greater activation of the "extra-diaphragmatic" inspiratory muscles for relative or absolute V̇E during exercise (Niro et al.,2021), which appears to affect respiratory efficiency more than males. Studies examining the effect of respiratory muscle strength on PETO2 are quite limited;
Juric et al. (2019) found a significant correlation between MIP and PETO2 in their study on male basketball and handball players aged between 16 and 36. Our study differs from this study. This may be due to the difference in branches or to the fact that our athletes' MIP values differ from the values of the athletes in Juric's study. The blunting of the inspiratory muscle metaboreflex in healthy young women compared to men may indicate that oxygen is used more efficiently in skeletal muscles in female athletes.
The inverse relationship between expiratory muscles and O2 efficiency in men may be an indication that O2 utilization by expiratory respiratory muscles in male athletes is higher than in female athletes. More studies are needed to confirm these possibilities.
According to the literature, Klusiewicz (2008) found no correlation between the MIP value and absolute or relative Max VO2 values in trained male athletes in his study on trained and untrained athletes, while he found a correlation between the MIP value and absolute or relative Max VO2 values in female athletes. Juric et al., (2019) found a significant relationship between MIP value and MaxVO2 in their studies on basketball and handball athletes.
On the contrary, Deliceoğlu et al. (2024) did not find a significant relationship between MIP and MEP values and MaxVO2 in their study. Studies in the literature mostly describe the effect of respiratory muscle strengthening training on MaxVO2.
For example, Lomax et al., (2011) reported that respiratory muscle training and warming up of respiratory muscles (at 40% of maximum inspiratory muscle power) in two groups of 12 male football players improved their Yo-Yo test performance compared to the control group.
In their study on female rowing athletes, Volianitis et al. (2001) reported that the MaxVO2 value of the athletes was higher than the control group after the respiratory muscle warm-up exercise performed together with the branch-specific general warm-up. In contrast, Romer et al. (2007) found that there was no significant change in subjects' VO2 Max values after respiratory muscle training.
Female are known to have higher diaphragm, scalene and sternocleidomastoid activation than men during graded exercise and at 85% of VO2max throughout constant load exercise and at a given VE (Payne, 2023).
The functional consequences of sex differences in respiratory muscle activation patterns during exercise are unclear, but increased activation of the “non-diaphragmatic” inspiratory muscles may influence the susceptibility to and magnitude of exercise-induced respiratory muscle fatigue.
When we analyze the significance of the importance weights stated in our research, it is seen that the MEP variable has a significant effect in male. The fact that the majority of expiratory muscles are also core muscles may contribute to running economy in endurance athletes.
This situation may have affected maximal oxygen consumption in our study, unlike other studies.
In our study, we found that the MEP variable had a significant effect on VE/VCO2 only in female. It is thought that the hyperventilation response, which is effective on the VE/VCO2 ratio, is affected by the expiratory respiratory muscle strength in female. The VE/VCO2 slope is inversely proportional to cardiac output at peak exercise (Chaumont et al., 2023), supporting the idea that women with morphologically smaller lungs and cardiac output mechanically support hyperventilation by increasing intrathoracic pressure with the help of expiratory muscles.
VE/VO2 ratio at maximum load can be considered as a parameter indicating ventilation efficiency. Bernardi et al., (2014) found that five weeks of respiratory muscle strength training improved the VE/VO2 ratio in triathletes. Bernardi's study indicates that respiratory muscle training improves the ability to sustain exercise beyond the anaerobic threshold, with no change in either the ventilatory threshold or the respiratory compensation point.
When we search the literature, we see that studies on VE/VO2 ratio have mostly been conducted on patients with pulmonary hypertension. In their study, Xi et al. (2014) found low VE/VO2 ratios in patients with chronic pulmonary hypertension. Meyer et al.,(2005) report data suggesting that respiratory muscle strength is reduced in pulmonary arterial hypertension.
In our study, respiratory muscle strength does not affect VE/VO2 ratio at maximum load in both genders. It is thought that the reason for this situation may be due to the endurance athletes quitting the test shortly after RCP.
As exercise intensity increases, the athlete is thought to select a combination of exercises that are assumed to maximize respiratory efficiency and minimize respiratory muscle demand (Kowalski, Granda, Klusiewicz, 2024). Dempsey (2006) states that during exercise, “A carefully chosen combination of increasing frequency and tidal volume should be achieved, taking into account the need to minimize dead space ventilation” (p. 255) At the same time, this combination provides protections against excessive increases in VTidal, which would result in excessive subatmospheric intrathoracic pressures and hence a large amount of work by the inspiratory muscles. The result is, with few exceptions, a nearly perfect and highly effective ventilatory response to exercise. Most studies have reported a plateau in VTidal before exhaustion (Johnson et al., 1992). According to the our best knowledge, no study was found in the literature that directly correlated respiratory muscle strength with VTidal at maximum load.
We believe that our research will contribute to the literature in this respect.
In our study, a significant relationship was found between VTidal and MIP at maximum load only in male athletes. It is thought that strong inspiratory muscles may increase VTidal in male.
Morphological differences in the lungs and respiratory tract in female may have affected the results of our study, and it is also considered that the small number of female athletes may have been a factor.
According to the model obtained from our research, the predictive variables addressed with the VT VO2 predicted variable did not show a significant effect in female athletes, while they had a significant effect in male athletes. When the significance of the specified importance weights is examined, it is seen that the MIP variable has a significant effect on male.
According to the literature, Juric et al. (2019) found a significant correlation between the VO2 value in VT and MIP in their study on male handball and basketball players. This study is similar to our research. In our research, female athletes entered the respiratory threshold at an average of 84.5% of Max VO2, while male athletes entered the respiratory threshold at 82.48%. Activation of the scalenes and sternocleidomastoids has been found to be higher in women than in men at a given VE during incremental exercise (Molgat-Seon et al., 2018) and during constant load exercise at 85% of VO2 Max (Ansdell et al., 2020). This situation may have affected the results of our study. The consequences of gender differences in respiratory muscle activation during exercise are unclear, which may explain the gender difference found in our study.
In our study, there was no relationship between VCO2 and respiratory muscles in VT in male and female. This result may be an indication that carbon dioxide production in VT is not affected by respiratory muscle strength as a result of metabolic functions. Henke et al. (1988) suggest that diaphragm fatigue during exercise is associated with increased inspiratory muscle recruitment and decreased end-expiratory lung volume. During inspiration, the rib cage muscles contract while the abdominal muscles gradually relax, and the opposite happens during expiration. This mechanism prevents the rib cage from collapsing, causing the diaphragm to act as a current generator by emptying, and the abdominal volume to fall below resting levels (Aliverti et al., 1997; Henke et al., 1988). The relationship between oxygen volume in the RCP and MEP can be explained by the expiratory muscles reducing the end-expiratory lung volume. This allows the diaphragm to stretch to its optimal length and allow more air to enter and perfuse the lungs. Studies are needed to explain the relationships between carbon dioxide and oxygen volumes at the respiratory compensation point and respiratory muscle strength.
In our study, respiratory muscle strength at maximum load was not related to VE. Carey et al. (2008) stated that high VE is achieved either by an exponential increase in respiratory frequency alone (37.5%) or by a combination of an exponential increase in respiratory frequency and a linear increase in VTidal (62.5%).
It is hypothesized that the ability to increase VE at maximal exercise in athletes may be an adaptation to training and provides the athlete with a performance advantage (Martin et al., 1979).
In our study, the sports age of female athletes was determined as (X̄=9.22±3.63) and the sports age of male athletes was determined as (X̄=9.30±5.61). This situation can be thought to provide training adaptation.
5. Conclusions
For female endurance athletes, MIP and MEP variables affect PETCO2 at maximum load, and MEP variables affect VE/VCO2 at maximum load. For male endurance athletes, the MEP variable affects the PETCO2 variable at maximum load, the PETO2 variable at maximum load, the MaxVO2 variable, the VO2 variable in RCP and the VO2 variable in VT. In male endurance athletes, the MIP variable affects VCO2 at RCP and VTidal at maximum load. Other VO2 Max subparameters examined are not affected by respiratory muscle strength.
Research results reveal that there are relationships between maximal oxygen consumption, the most important indicator of aerobic performance, and its sub-parameters and respiratory muscles. It has been concluded that the importance of respiratory muscles should not be ignored in today's sports competitions, where winning and losing depend on small differences.
6. Limitations of the Study
The main limitation of the study was that other parameters that may affect VO2 Max, such as nutrition, psychological state, and sleep, could not be examined. Other limitations include the inability to conduct a longitudinal study on the acute effects of respiratory muscle strength. In addition, the fact that the number of female athletes is less than the number of male athletes should be considered as a limitation of the study.
Institutional Review Board Statement
The study was conducted in accordance with the Declaration of Helsinki, and approved by Gazi University Ethics Committee (approval code: 2023-1133).
Informed Consent Statement
Informed consent was obtained from all subjects involved in the study.
Data Availability Statement
The original contributions presented in this study are included in the article. Further inquiries can be directed to the corresponding author.
Conflicts of Interest
The authors declare no conflicts of interest.
References
- Aliverti, A.; Cala, S. J.; Duranti, R.; Ferrigno, G.; Kenyon, C. M.; Pedotti, A.; Yan, S. Human respiratory muscle actions and control during exercise. J. Appl. Physiol. 1997, 83(4), 1256–1269. [Google Scholar] [CrossRef]
- Alpar, R. Uygulamalı istatistik ve geçerlilik-güvenirlik: SPSS’de çözümleme adımları ile birlikte (3. baskı); Detay Yayıncılık: Ankara, 2014; pp. s.108–109. [Google Scholar]
- Amann, M. Pulmonary system limitations to endurance exercise performance in humans. Exp. Physiol. 2012, 97(3), 311–318. [Google Scholar] [CrossRef] [PubMed]
- Ansdell, P.; Škarabot, J.; Atkinson, E.; Corden, S.; Tygart, A.; Hicks, K. M.; Goodall, S. Sex differences in fatigability following exercise normalised to the power–duration relationship. J. Physiol. 2020, 598(24), 5717–5737. [Google Scholar] [CrossRef]
- Beaver, W. L.; Wasserman, K.; Whipp, B. J. A new method for detecting anaerobic threshold by gas exchange. J. Appl. Physiol. 1986, 60(6), 2020–2027. [Google Scholar] [CrossRef] [PubMed]
- Bernardi, E.; Melloni, E.; Mandolesi, G.; Uliari, S.; Grazzi, G.; Cogo, A. Respiratory muscle endurance training improves breathing pattern in triathletes. Ann. Sports Med. Res. 2014, 1(1), 1003. [Google Scholar]
- Borg, G. A category scale with ratio properties for intermodal and interindividual comparisons. In Psychophysical judgment and the process of perception; Geissler, H.-G., Petzold, P., Eds.; North-Holland, 1982; pp. 25–34. [Google Scholar]
- Bussotti, M.; Magrì, D.; Previtali, E.; Farina, S.; Torri, A.; Matturri, M.; Agostoni, P. End-tidal pressure of CO2 and exercise performance in healthy subjects. Eur. J. Appl. Physiol. 2008, 103(6), 727–732. [Google Scholar] [CrossRef]
- Carey, D.; Pliego, G.; Raymond, R. How endurance athletes breathe during incremental exercise to fatigue: Interaction of tidal volume and frequency. J. Exerc. Physiol. Online 2008, 11(4), 25–33. [Google Scholar]
- Chaumont, M.; Forton, K.; Gillet, A.; Tcheutchoua Nzokou, D.; Lamotte, M. How does the method used to measure the VE/VCO2 slope affect its value? A cross-sectional and retrospective cohort study. Healthcare 2023, 11(9), 1292. [Google Scholar] [CrossRef]
- Deliceoğlu, G.; Kabak, B.; Çakır, V. O.; Ceylan, H. İ.; Raul-Ioan, M.; Alexe, D. I.; Stefanica, V. Respiratory muscle strength as a predictor of VO2max and aerobic endurance in competitive athletes. Appl. Sci. 2024, 14(19), 8976. [Google Scholar] [CrossRef]
- Dempsey, J. A.; Wagner, P. D. Exercise-induced arterial hypoxemia. J. Appl. Physiol. 1999, 87(6), 1997–2006. [Google Scholar] [CrossRef]
- Dempsey, J. A.; Sheel, A. W.; St. Croix, C. M.; Morgan, B. J. Respiratory influences on sympathetic vasomotor outflow in humans. Respir. Physiol. Neurobiol. 2002, 130(1), 3–20. [Google Scholar] [CrossRef]
- Dempsey, J. A. ACSM’s advanced exercise physiology, 1st ed.; Lippincott Williams & Wilkins, 2006. [Google Scholar]
- Gocentas, A.; Jascaniniene, N.; Poprzęcki, S.; Jaszczanin, J.; Juozulynas, A. Position-related differences in cardiorespiratory functional capacity of elite basketball players. J. Hum. Kinet. 30 2011, 145–153. [Google Scholar] [CrossRef]
- Guenette, J. A.; Witt, J. D.; McKenzie, D. C.; Road, J. D.; Sheel, A. W. Respiratory mechanics during exercise in endurance-trained men and women. J. Physiol. 2007, 581(3), 1309–1322. [Google Scholar] [CrossRef] [PubMed]
- Harms, C. A.; Babcock, M. A.; McClaran, S. R.; Pegelow, D. F.; Nickele, G. A.; Nelson, W. B.; Dempsey, J. A. Respiratory muscle work compromises leg blood flow during maximal exercise. J. Appl. Physiol. 1997, 82(5), 1573–1583. [Google Scholar] [CrossRef] [PubMed]
- Henke, K. G.; Sharratt, M.; Pegelow, D.; Dempsey, J. A. Regulation of end-expiratory lung volume during exercise. J. Appl. Physiol. 1988, 64(1), 135–146. [Google Scholar] [CrossRef] [PubMed]
- Hill, J. M. Discharge of group IV phrenic afferent fibers increases during diaphragmatic fatigue. Brain Res. 2000, 856(1–2), 240–244. [Google Scholar] [CrossRef] [PubMed]
- Johnson, B. D.; Aaron, E. A.; Babcock, M. A.; Dempsey, J. A. Respiratory muscle fatigue during exercise: Implications for performance. Med. Sci. Sports Exerc. 1996, 28(9), 1129–1137. [Google Scholar] [CrossRef]
- Johnson, B. D.; Saupe, K. W.; Dempsey, J. A. Mechanical constraints on exercise hyperpnea in endurance athletes. J. Appl. Physiol. 1992, 73(3), 874–886. [Google Scholar] [CrossRef]
- Jurić, I.; Labor, S.; Plavec, D.; Labor, M. Inspiratory muscle strength affects anaerobic endurance in professional athletes. Arh. Za Hig. Rada I Toksikol. 2019, 70(1), 42–48. [Google Scholar] [CrossRef] [PubMed]
- Klusiewicz, A. Characteristics of the inspiratory muscle strength in the well-trained male and female athletes. Biol. Sport 2008, 25(1), 35–48. [Google Scholar]
- Kowalski, T.; Granda, D.; Klusiewicz, A. Practical application of respiratory muscle training in endurance sports. Strength Cond. J. 2024, 46(6), 686–695. [Google Scholar] [CrossRef]
- Lomax, M.; Grant, I.; Corbett, J. Inspiratory muscle warm-up and inspiratory muscle training: Separate and combined effects on intermittent running to exhaustion. J. Sports Sci. 2011, 29(6), 563–569. [Google Scholar] [CrossRef] [PubMed]
- Martin, B. J.; Sparks, K. E.; Zwillich, C. W.; Weil, J. V. Low exercise ventilation in endurance athletes. Med. Sci. Sports 1979, 11(2), 181–185. [Google Scholar]
- Meyer, F. J.; Lossnitzer, D.; Kristen, A. V.; Schoene, A. M.; Kübler, W.; Katus, H. A.; Borst, M. M. Respiratory muscle dysfunction in idiopathic pulmonary arterial hypertension. Eur. Respir. J. 2005, 25(1), 125–130. [Google Scholar] [CrossRef] [PubMed]
- Molgat-Seon, Y.; Dominelli, P. B.; Ramsook, A. H.; Schaeffer, M. R.; Romer, L. M.; Guenette, J. A.; Sheel, A. W. Effects of age and sex on inspiratory muscle activation patterns during exercise. Med. Sci. Sports Exerc. 2018, 50(9), 1882–1891. [Google Scholar] [CrossRef]
- Murias, G.; Blanch, L.; Lucangelo, U. The physiology of ventilation. Respir. Care 2014, 59(11), 1795–1807. [Google Scholar] [CrossRef]
- Musch, T. I. Elevated diaphragmatic blood flow during submaximal exercise in rats with chronic heart failure. Am. J. Physiol.-Heart Circ. Physiol. 1993, 265(5), H1721–H1726. [Google Scholar] [CrossRef]
- Niro, F.; Dubuc, B.; Sodeifi, K. G.; Jensen, D. Effect of end-inspiratory lung volume and breathing pattern on neural activation of the diaphragm and extra-diaphragmatic inspiratory muscles in healthy adults. J. Appl. Physiol. 2021, 131(6), 1679–1690. [Google Scholar] [CrossRef]
- Payne, O. The effect of aerobic fitness on exercise-induced diaphragmatic fatigue in females . Doctoral dissertation, University of British Columbia, 2023. Available online: https://open.library.ubc.ca/.
- Romer, L. M.; Polkey, M. I. Exercise-induced respiratory muscle fatigue: Implications for performance. J. Appl. Physiol. 2008, 104(3), 879–888. [Google Scholar] [CrossRef] [PubMed]
- Romer, L. M.; Miller, J. D.; Haverkamp, H. C.; Pegelow, D. F.; Dempsey, J. A. Inspiratory muscles do not limit maximal incremental exercise performance in healthy subjects. Respir. Physiol. Neurobiol. 2007, 156(3), 353–361. [Google Scholar] [CrossRef]
- Sachs, M. C.; Enright, P. L.; Stukovsky, K. D. H.; Jiang, R.; Barr, R. G. Performance of maximum inspiratory pressure tests and maximum inspiratory pressure reference equations for 4 race/ethnic groups. Respir. Care 2009, 54(10), 1321–1328. [Google Scholar] [CrossRef] [PubMed]
- St. Croix, C. M.; Morgan, B. J.; Wetter, T. J.; Dempsey, J. A. Fatiguing inspiratory muscle work causes reflex sympathetic activation in humans. J. Physiol. 2000, 529(2), 493–504. [Google Scholar] [CrossRef]
- Volianitis, S.; McConnell, A. K.; Koutedakis, Y.; Jones, D. A. Specific respiratory warm-up improves rowing performance and exertional dyspnea. Med. Sci. Sports Exerc. 2001, 33(7), 1189–1193. [Google Scholar] [CrossRef]
- Weakley, J.; Black, G.; McLaren, S.; Scantlebury, S.; Suchomel, T. J.; McMahon, E.; Read, D. B. Testing and profiling athletes: Recommendations for test selection, implementation, and maximizing information. Strength Cond. J. 2024, 46(2), 159–179. [Google Scholar] [CrossRef]
- Wetter, T. J.; Harms, C. A.; Nelson, W. B.; Pegelow, D. F.; Dempsey, J. A. Influence of respiratory muscle work on VO2 and leg blood flow during submaximal exercise. J. Appl. Physiol. 1999, 87(2), 643–651. [Google Scholar] [CrossRef] [PubMed]
- Xi, Q.; Zhao, Z.; Liu, Z.; Ma, X.; Luo, Q.; Liu, W. The lowest VE/VCO2 ratio best identifies chronic thromboembolic pulmonary hypertension. Thromb. Res. 2014, 134(6), 1208–1213. [Google Scholar] [CrossRef]
Table 1.
Number of athletes by sports branch.
| Gender | Sports Branches | N |
|---|---|---|
| Female | Cross-Country Skiing | 10 |
| Modern Pentathlon | 11 | |
| Triathlon | 2 | |
| Total | 23 | |
| Male | Cross-Country Skiing | 4 |
| Modern Pentathlon | 9 | |
| Biathlon | 6 | |
| Triathlon | 10 | |
| Orienteering | 18 | |
| Total | 47 |
Table 2.
Demographic information of the research group.
| Gender | Characteristics | Min | Max | X̄ | SD |
|---|---|---|---|---|---|
| Female | Age (Years) | 18 | 30 | 20.39 | 3.67 |
| Height (Cm) | 153 | 175 | 163.00 | 5.36 | |
| Body Weight (Kg) | 43 | 63 | 53.35 | 4.89 | |
| Sports Year (Year) | 4 | 17 | 9.22 | 3.63 | |
| Training Duration (Week/Day) | 5 | 7 | 6.13 | 0.45 | |
| Traınıng Duration (Days/Hours) | 2.0 | 8.0 | 4.82 | 1.43 | |
| Male | Age (Years) | 18 | 34 | 23.00 | 5.24 |
| Height (Cm) | 159 | 188 | 175.36 | 7.05 | |
| Body Weight (Kg) | 40 | 85 | 67.45 | 8.96 | |
| Sports Year (Year) | 3 | 26 | 9.30 | 5.61 | |
| Training Duration (Week/Day) | 3 | 7 | 5.94 | 1.00 | |
| Training Duration (Days/Hours) | 1.0 | 9.0 | 3.63 | 1.83 |
Min: Minimum, Max: Maximum, X̄: Average, SD: Standard deviation.
Table 6.
Regression analysis results of Maximal O2 consumption and subparameter values of female (n=23) and male (n=47) endurance athletes constituting the research group.
Table 6.
Regression analysis results of Maximal O2 consumption and subparameter values of female (n=23) and male (n=47) endurance athletes constituting the research group.
| Characteristics | Female | Male | |||||||
|---|---|---|---|---|---|---|---|---|---|
| R | R2 | Beta | p | R | R | Beta | p | ||
| Max Load VE | MEP | 0.214 | 0.046 | -0.105 | 0.769 | 0.327 | 0.107 | 0.234 | 0.155 |
| MIP | 0.287 | 0.426 | 0.143 | 0.38 | |||||
| Max Load VE/VO2 | MEP | 0.1 | 0.01 | -0.098 | 0.789 | 0.349 | 0.122 | -0.241 | 0.139 |
| MIP | -0.003 | 0.994 | -0.163 | 0.313 | |||||
| VTVCO2 | MEP | 0.281 | 0.079 | -0.045 | 0.899 | 0.467 | 0.218 | 0.278 | 0.073 |
| MIP | 0.315 | 0.375 | 0.267 | 0.084 | |||||
| Max Load VE/VCO2 | MEP | 0.468 | 0.219 | 0.518 | 0.030* | 0.255 | 0.065 | -0.258 | 0.125 |
| MIP | -0.748 | 0.12 | 0.006 | 0.971 | |||||
| Max Load VTidal | MEP | 0.183 | 0.034 | -0.003 | 0.993 | 0.445 | 0.198 | 0.084 | 0.585 |
| MIP | 0.186 | 0.606 | 0.399 | 0.012* | |||||
| Max Load PETCO2 | MEP | 0.535 | 0.286 | 0.864 | 0.010* | 0.433 | 0.187 | 0.449 | 0.006* |
| MIP | -0.665 | 0.042* | -0.037 | 0.81 | |||||
| Max Load PETO2 | MEP | 0.318 | 0.101 | -0.503 | 0.158 | 0.434 | 0.188 | - 0.387 | 0.016* |
| MIP | 0.332 | 0.344 | -0.085 | 0.585 | |||||
| MaxVO2 | MEP | 0.583 | 0.34 | 0.47 | 0.125 | 0.324 | 0.105 | 0.342 | 0.040* |
| MIP | 0.136 | 0.647 | 0.043 | 0.79 | |||||
| RCP VCO2 | MEP | 0.198 | 0.039 | -0.135 | 0.708 | 0.457 | 0.209 | 0.236 | 0.127 |
| MIP | 0.285 | 0.43 | 0.296 | 0.050* | |||||
| RCP VO2 | MEP | 0.24 | 0.058 | -0.237 | 0.506 | 0.495 | 0.245 | 0.314 | 0.040* |
| MIP | 0.376 | 0.296 | 0.262 | 0.084 | |||||
| VT VO2 | MEP | 0.304 | 0.093 | -0.362 | 0.306 | 0.467 | 0.25 | 0.28 | 0.065 |
| MIP | 0.49 | 0.17 | 0.303 | 0.047* | |||||
VO2: Oxygen volume, VCO2: Carbon dioxide volume, VT: Respiratory threshold VE: Respiratory volume; RCP: Respiratory compensation point, PETCO2: End tidal carbon dioxide pressure, PETO2: End tidal oxygen pressure, VTidal: Tidal volume, Max Load: Maximum load, RCPVCO2: Carbon dioxide volume at respiratory compensation point, RCPVO2: Oxygen volume at respiratory compensation point, MaxVO2: Maximal oxygen consumption, Max Load VE/VO2: Ratio of O2 consumption volume at maximum load to respiratory volume, Max Load VE/VCO2: Ratio of CO2 production volume at maximum load to respiratory volume, VTVCO2: Volume of CO2 produced at respiratory threshold, VT VO2: Volume of O2 consumed at respiratory threshold.
Disclaimer/Publisher’s Note: The statements, opinions and data contained in all publications are solely those of the individual author(s) and contributor(s) and not of MDPI and/or the editor(s). MDPI and/or the editor(s) disclaim responsibility for any injury to people or property resulting from any ideas, methods, instructions or products referred to in the content. |
© 2026 by the authors. Licensee MDPI, Basel, Switzerland. This article is an open access article distributed under the terms and conditions of the Creative Commons Attribution (CC BY) license (http://creativecommons.org/licenses/by/4.0/).
Copyright: This open access article is published under a Creative Commons CC BY 4.0 license, which permit the free download, distribution, and reuse, provided that the author and preprint are cited in any reuse.


