

Submitted:
11 May 2026
Posted:
12 May 2026
You are already at the latest version
Abstract
Advanced Driver Assistance Systems (ADAS) have demonstrated safety potential and are becoming increasingly available in the vehicle markets across the world. However, drivers’ perceptions, trust, and engagement with these systems in Thailand remain unexplored. This study therefore aimed to explore Thai drivers’ perceptions towards ADAS and investigated factors associated with trust and intention to use. A cross-sectional survey was conducted with 849 licensed drivers in Thailand. The online survey measured perceived usefulness, perceived ease of use, trust, barriers and concerns, expectations and preferences, and intention to use ADAS. Data were analyzed using Mann–Whitney U tests and Spearman’s rank correlations. Results showed that Thai drivers reported positive perceptions of usefulness and intention to use ADAS, while trust was moderate, and barriers and concerns showed variability. Trust demonstrated strong positive associations with perceived usefulness (ρ = .69), perceived ease of use (ρ = .56), and intention to use (ρ = .49). The findings highlight the important role of perceived usefulness, perceived ease of use, and trust in shaping drivers’ intent to use the system and supports the development of learning strategies to enhance ADAS usage whilst promoting utilization of these systems.
Keywords:
advanced driver assistance systems (ADAS)
; drivers
; perceptions
; intention to use
; trust
1. Introduction
Advanced Driver Assistance Systems (ADAS), also referred to as advanced in-vehicle technologies, are designed to support driving tasks, mitigate collision risks, enhance driving safety, comfort, and mobility. [1,2,3,4]. Such benefits are particularly relevant for older adults [5], who may experience age-related decline and frailty in physical, cognitive, and sensory functions that can negatively affect driving performance [6]. Empirical evidence from developed countries reveals that ADAS features can substantially reduce crash frequency and injury severity. For example, in the United States of America (USA), ADAS was estimated to reduce collisions by around 27-29 percent and mitigate road injuries and fatalities by around 14-20 percent [7,8]. In Germany, systems such as Lane Departure Warning (LDW), Lane Change Assist (LCA), and Blind Spot Warning (BSW) have shown safety potential ranging from 11.4% to 43.4% [8]. In Austria, Automatic Emergency Braking (AEB) and Forward Collision Warning (FCW) are projected to reduce approximately 8,700 crashes and prevent around 70 fatalities by 2040 [8]. Similarly, studies in the United Kingdom report that ADAS can reduce six common crash types by approximately 23.8%, with AEB identified as particularly effective in decreasing intersection, rear-end, and pedestrian collisions by 28–35% [7]. However, the safety benefits of ADAS are contingent not only on technological capability but also on drivers’ understanding, trust, and willingness to engage with these systems. Whilst much research has examined ADAS adoption in developed nations, there is limited evidence regarding ADAS effectiveness in developing countries where infrastructural conditions, traffic environments, and socioeconomic characteristics differ noticeably. Variations in lane marking quality, mixed traffic composition, and infrastructural conditions may influence both the functional performance of ADAS and drivers’ perceptions of the system reliability. Consequently, findings derived from developed countries may not be directly transferable to developing nations.
Thailand continues to experience high numbers of road crash fatalities and has one of the highest road fatality rates in the Asian region [9], reflecting a critical road safety situation and systemic safety challenges. At the same time, ADAS-equipped vehicles are increasingly available in the Thai automotive market year by year, but research regarding how Thai drivers evaluate ADAS and how their perceptions influence trust, and in general, their overall intention to use the system remains limited. Understanding how drivers perceive, trust, and intend to use ADAS is critical for informing policy, education, and development of implementation strategies aimed at safe, sustainable use of the system.
Therefore, this cross-sectional study aims to explore Thai drivers’ perceptions towards ADAS, trust, and intention to use the systems and investigates key factors related to their intention to engage with ADAS. The findings provide evidence-based support for developing road safety policies, educational guidance, and promoting ADAS engagement in Thailand.
2. Theoretical Background
2.1. Technology Acceptance
Technology acceptance theory provides a structured framework to examine determinants of acceptance and behavioural intention to use technology. In ADAS research, the Technology Acceptance Model (TAM) proposed that there are two components, including perceived usefulness (the degree to which an individual evaluates that using a technology would benefit them) and perceived ease of use (the degree to which an individual evaluates that using a technology would be free or require less effort), which influence behavioural intention to use a technology [10]. Furthermore, the Unified Theory of Acceptance and Use of Technology (UTAUT) model integrates eight acceptance models [11,12,13] to examine the relationship of four core components, including performance expectancy, effort expectancy, social influence, and behavioural intention to use a technology. These two models are widely applied in ADAS acceptance research. For example, Rahman et al. (2017) [14] examined ADAS acceptance using three theoretical frameworks including the Technology Acceptance Model (TAM), Theory of Planned Behaviour (TPB), Unified Theory of Acceptance, and Use of Technology (UTAUT) frameworks. The findings indicated that all three models were able to explain ADAS acceptance through their respective constructs, while TAM was considered the best model, as it demonstrated greater explanatory power and more consistent predictive relationships with behavioral intention. Braun et al. (2019) [15] examined the relationship between demographics and driving-related variables and acceptance of ADAS using applied TAM and UTAUT. The findings indicated that factors related to ADAS acceptance and perceived usefulness are the strongest influences on intention to use a system. Regarding Technology Threat Avoidance Theory (TTAT), two key cognitive processes that influence avoidance behaviour and coping responses are threat appraisal and coping appraisal [16]. Most existing studies have applied TAM and UTAUT in the context of advanced automotive technologies, particularly in examining ADAS acceptance [14,17]. Although each model provides valuable insights, relying on a single theory may offer only a partial explanation of behavioural intention to use a technology. Therefore, prior studies have typically combined one or two models [14,15,17,18], while the integration of TTAT in ADAS research remains limited.
In this study, TAM, UTAUT, and TTAT are integrated to examine factors that shape drivers’ perceptions towards ADAS and their intention to use a system. TAM highlights perceived usefulness and perceived ease of use, while UTAUT incorporates broader motivational and facilitating influences. In contrast, TTAT captures threat-related cognitions that may trigger avoidance behaviour. By combining these frameworks, this study adopts a more comprehensive theoretical approach to provide a holistic understanding of drivers’ perceptions towards ADAS.
2.2. Trust in Technology
Trust in technology, defined as users’ reliance on, and willingness to use technological systems, is a key determinant of technology acceptance [19,20] and plays a critical role in mitigating fear and uncertainty associated with technology adoption [21]. In the context of ADAS, drivers’ perceptions and trust strongly predict their acceptance and usage of these systems [3,22]. Previous research indicates that perceived usefulness, perceived ease of use, perceived safety, and trust are central factors influencing ADAS adoption among older drivers [1,23,24,25]. Experience with ADAS has also been shown to enhance familiarity, reliance, and trust, thereby increasing acceptance [6,26,27]. However, barriers such as low trust, cost concerns, and perceived risks related to privacy, reliability, and safety continue to hinder adoption [15]. Consequently, drivers tend to prefer lower levels of automation where they perceive greater control of the vehicle, over higher levels of automation that may reduce their autonomy and trust [3,5,28].
3. Materials and Methods
3.1. Study Population and Sample
The study population comprised male and female Thai drivers who hold a valid driving license. The target population was classified into two groups: younger drivers aged 18-59 years old, and older drivers aged 60 years and over.
The study sample size was determined using the Krejcie and Morgan method for a finite [29]. Based on the number of licensed Thai drivers reported by the Department of Land Transportation, between October 2022 and September 2024 (N=18,761,658 drivers), a minimum sample size of 384 participants was required, assuming a 95% confidence level, a margin of error of 5%, and a population proportion of 0.5. To account for any possible error, an additional 5 percent was added, resulting in a final sample size of 403 participants per group. Therefore, 806 participants were required for analysis. The inclusion criteria required participants aged 18 years or older to hold a valid Thai driving license, have driven within the past 12 months, be able to read and write in Thai, and be willing to participate with informed consent.
3.2. Questionnaire Development
A self-administered questionnaire survey was developed based on a comprehensive literature review. The questionnaire was tested for validity and reliability before use.
The validity was tested using the Index of Item-Objective Congruence (IOC) with three experts who were experienced in the human factors and transport safety field. The questionnaire obtained IOC value, ranging between 0.7 to 1 which was an acceptable value [30].
The questionnaire piloted with 31 drivers during July 2025. The internal consistency of the questionnaire and reliability was tested and returned a Cronbach’s alpha of 0.793, which is an acceptable level.
The final questionnaire consisted of 6 sections comprising 46 items. Section 1 collected demographic information, including gender, age, income, province of residence, education level, and self-reported changes in sensory abilities. Section 2 collected driving experience, covering vehicle brand and model, vehicle age, years of driving experience, car accident experience, and driving behaviours. Section 3 collected experience with ADAS, including familiarity with ADAS, availability of ADAS features in the vehicle, usage behaviours, barriers to ADAS use, and sources of ADAS-related information or training. Section 4 collected perceptions towards ADAS, including perceived usefulness (PU), perceived ease of use (PEOU), trust, and perceived barriers and concerns (BC). Section 5 collected drivers’ expectations and preferences regarding ADAS. Section 6 measured intention to use (IU) ADAS, focusing on drivers’ willingness and intended future use (Table 1). Perceptions towards ADAS were constructed from the theory together with literature reviews. These sections were assessed using a 5-point Likert scale ranging from strongly disagree to strongly agree (Table 2). The average completion time for the questionnaire was approximately 5–8 minutes.
3.3. Data Collection
The study employed a combination of purposive and snowball sampling to recruit participants who met the inclusion criteria. Data were collected using an anonymous online questionnaire administered via Google Forms. The questionnaire was distributed through social media platform (Facebook, LINE, Instagram), local communities (markets, shopping malls, Department of Land Transport offices, and dance clubs), and University of Third Age in Chiang Rai city). Participants were informed about the study purpose and provided with completion instructions, and electronic informed consent was obtained prior to proceeding to the main survey. The data were collected between August and September 2025.
3.4. Data Analysis
Data were exported to Microsoft Excel prior to analysis using IBM SPSS Statistics (version 30; 2023). All responses were screened for completeness, and incomplete responses were excluded, resulting in 849 valid responses which were included in the analysis. Mann–Whitney U tests were conducted to examine differences between younger (those who aged 18-59 years old) and older groups (those who aged 60 years and older), and Spearman’s rank-order correlation coefficients were used to explore relationships between variables.
4. Results
The results are presented in five sections: (1) participant characteristics, (2) driving and ADAS experiences, (3) perceptions distribution towards ADAS, (4) Statistical testing of differences between age groups, and (5) Correlation between variables and perceptions towards ADAS.
4.1. Demographics Data of the Participants
The sample was relatively balanced in terms of gender, with 52.2% male and 44.1% female participants. Younger drivers (18–59 years) accounted for 52.7% of the sample, while older drivers (≥60 years) represented 47.3%. More than half of the participants (56.3%) held a bachelor’s degree or higher. Regarding monthly income, 39.9% reported earning more than 580 pounds per month. In terms of sensory abilities, 42.9% reported no sensory changes, whereas 40.5% reported visual changes (Table 3).
4.2. Driving and ADAS Experiences
Most participants reported more than 10 years of driving experience (60.5%), and 74.2% indicated no accident involvement within the past two years. Vehicles were mainly aged between 6–10 years (39.5%), followed by 1–5 years (30.7%). Regarding ADAS awareness, 54.9% reported having heard of ADAS, while 29.6% of the total sample indicated that they had not received any information or training. Among those who had received information, car dealers were the most frequently reported source (23.9%) (Appendix A1).
The most familiar ADAS features were basic systems, including Parking Sensors (76.4%), Anti-lock Braking Systems (54.5%), and 360-degree camera systems (54.1%) (Figure 1), while more advanced systems such as Adaptive Cruise Control (ACC) and Lane Keeping Assist (LKA) were less frequently reported. Among participants who had turned off ADAS (n = 602), the most common reasons were perceiving the system as unnecessary (41.9%), lack of understanding (37.9%), and concerns about malfunction or safety risks (34.6%) (Figure 2).
4.3. Perceptions Distribution Towards Advanced Driver Assistance Systems (ADAS)
Figure 3 shows moderate to high median scores across perceived usefulness, expectations and preferences, and intention to use, while a moderate median score was observed in trust. In contrast, perceived ease of use and barriers and concerns showed a wider distribution and the presence of outliers, indicating variability in these perceptions among drivers.
4.4. Differences Between Age Groups
The Mann–Whitney U test revealed statistically significant differences between younger and older drivers in perceived ease of use (p = 0.004) and perceived barriers and concerns (p < 0.001). Older drivers reported higher perceived ease of use, whereas younger drivers reported higher perceived barriers and concerns (Table 4). No statistically significant differences were identified between age groups for perceived usefulness, trust, expectations and preferences, or intention to use.
4.5. Correlation Between Variables and Perceptions Towards ADAS
Spearman’s rank correlation analysis revealed several significant relationships between individual factors, driving experience, ADAS experience, and perceptions towards ADAS. Overall, the significant associations were weak with correlation coefficients ranging from = 0.08 to 0.26 for positive associations and from = −0.07 to −0.30 for negative associations (Table 5).
Table 6 presents correlations among perception constructs. Trust is the most strongly influenced variable. It demonstrated moderate to strong positive associations with perceived usefulness ( = .69, p < .01), perceived ease of use ( = .56, p < .01), expectations and preferences ( = .56, p < .01), and intention to use ( = .49, p < .01). Perceived usefulness was positively related to expectations and preferences ( = .63, p < .01) and intention to use ( = .47, p < .01). Perceived ease of use was also positively associated with intention to use ( = .34, p < .01). In contrast, barriers and concerns demonstrated weak but statistically significant negative relations with perceived ease of use ( = −.20, p < .01), trust ( = −.12, p < .01), and intention to use ( = −.08, p < .05).
These findings indicate a consistent pattern in which evaluative perceived usefulness and perceived ease of use are positively aligned with trust and behavioural intention, while perceived barriers are inversely related to these constructs.
5. Discussion
The study results revealed that Thai drivers have a generally positive perceptions towards ADAS, including perceived usefulness, expectations, and preferences, and showed a high intention to use ADAS. However, moderate levels of trust and variability in perceived ease of use and barriers and concerns were found. Although ADAS are increasingly available in the Thai automotive market, their engagement appears to be inhibited by limited understanding and informal learning. Thai drivers obtained knowledge and information about ADAS informally and received only limited and insufficient information from dealerships, suggesting that current communication may not adequately support drivers’ understanding. Similarly, the study by Kaye et al. (2022) [18] found that drivers learnt ADAS via verbal explanation at the showroom, while most of them had never heard of or lacked ADAS experience. This indicates a barrier to intention to use ADAS, leading to underuse of ADAS. The most familiar ADAS were basic warning system such as Parking Sensors (PS), Anti-Lock Braking Systems (ABS) and 360-degree camera systems while more advanced features such as Adaptive Curies Control (ACC), Lane Keeping Assist (LKA) demonstrated comparatively lower familiarity and usage. This distribution reflects a gradual technological transition and partial ADAS adoption. Moreover, the study found that Thai drivers unawares the necessary to use ADAS which related the survey reported they lack ADAS knowledge, and did not understand how to use it, and how it work. This finding aligns with the study of Biassoni and Gnerre (2024) [3] who conducted a study in the United state, France, Australia, Germany, Canada, and Japan, and found that drivers lack knowledge and understanding about ADAS. It can be implied that knowledge and learning are common barriers of intention to use ADAS not only in Thailand but also other countries.
The findings have demonstrated strong positive associations between trust and perceived usefulness, perceived ease of use, expectations, and intention to use. Trust emerged as a key linking the behavioural intention. This finding aligns with technology acceptance theories [10,14,18] while highlighting the contextual importance of trust in transport systems characterized by infrastructural variability and safety risks. The presence of outliers further reflects differences in drivers’ perceptions, which may be associated with variations in their understanding of and experience with ADAS. Moreover, Thai drivers reported particular concerns regarding trust in ADAS, especially in emergency situations, suggesting a tendency to rely more on their own driving skills and to demonstrate limited trust in the system under critical conditions. These findings were also in line with previous studies. For example, the research by Lajunen and Sullman (2021) [28], observed that older drivers expressed concerns about the safety and reliability of advanced automation features [15]. A study on Australian drivers’ acceptance of ADAS found that while drivers demonstrated a positive attitude towards ADAS, they showed low trust in the system, including privacy, safety, and system malfunction or failure [15]. These findings reflect concerns regarding low usage and underutilization of ADAS, particularly when the system functions are not fully understood. If trust remains moderate, the safety potential of ADAS may not be fully realized.
Differences in perceived usefulness, trust, expectations, preferences, and intention to use ADAS between younger drivers and older drivers was not found, which is contrary to the finding of Burridge et al. (2020) [34] who found that older drivers are less likely to use ADAS than younger drivers [15]. However, there was a difference in perceived ease of use and perceived barriers and concerns, with older drivers reporting lower perceived barriers and concerns than younger drivers. This finding may be explained by differences in cost perceptions across age groups. To expand, cost may represent a less prominent barrier for older drivers compared to younger drivers.
Income was positively associated with perceived usefulness, perceived ease of use, trust, expectations and preferences, and intention to use, while negatively associated with perceived barriers and concerns. This finding shows the similar report by Biassoni and Gnerre (2024)[3] which revealed that cost was associated with barriers to ADAS adoption. These reflect differences in access to ADAS-equipped vehicles, whereby drivers with higher income levels report more favourable perceptions and stronger intentions to use ADAS, while cost-related factors appear to be less important barriers to adoption within this group [3]. In Thailand, ADAS features are primarily available in higher-priced vehicle models, limiting access among lower-income drivers. Consequently, positive perceptions may reflect differences in exposure rather than purely attitudinal differences. Changes in sensory abilities was negatively associated with perceived usefulness, perceived ease of use, trust, expectations and preferences, and intention to use. One possible explanation is that drivers with sensory changes may experience a mismatch between system design and their perceptual capabilities, which could influence their evaluations of ADAS usability and reliability. These results highlight the importance of system design, particularly in adaptable interfaces that should accommodate the capabilities of drivers. Regarding driving experience, this was associated with more favourable ADAS perceptions and stronger intentions to use, while negative perceptions related to barriers and concerns were identified. This finding was similar to the study by Ali et al. (2021) [35] which reported that driving experience influences user acceptance. This can imply that drivers who have a lot of driving experience are also more exposed to ADAS and familiarity, which leads to the development of drivers’ trust in the system. Consequently, they are more reliant on and are likely to intend to use ADAS [3,13]. Accident experience and speeding behaviour were negatively associated with multiple ADAS perceptions. This relationship may reflect diminished trust following adverse driving experiences, while the relation of speeding behaviour may reflect a stronger preference for relying on personal driving ability rather than assistance systems. This supports the study by (Jun et al. (2019) [17] which reported that despite ADAS being well developed and improved, drivers are still hesitant to rely on it for safety as they perceived ADAS cannot fully prevent accidents, but that it could mitigate risk, serious injuries, and support driving comfort. This suggests that driving behaviour may be related to ADAS engagement. Regarding awareness of ADAS, having heard of ADAS was found to be associated with several ADAS perceptions. This finding is in line with previous studies, for example, Hansen (2019) [15] found that knowledge and prior experience about ADAS were related to an increase in acceptance levels. Kay et al. (2021) [18] also revealed the importance of support and found that drivers who learned about ADAS were more accepting of ADAS than those who did not learn. In contrast, a low acceptance level was found in drivers who reported a lack of engagement with education and communication about ADAS [36]. This suggests that basic level of awareness or recognition of ADAS can lead to more positive perceptions of these systems, including perceived usefulness, perceived ease of use, trust, expectations, and an increased intention to use ADAS.
The current study found strong interrelationships among key ADAS perception constructs. Perceived usefulness, perceived ease of use, expectations and preferences, and intention to use were all positively associated with trust in ADAS [37]. This pattern highlights the important role of trust within the ADAS perceptions framework, suggesting that drivers are more likely to trust in ADAS when they perceive the system as beneficial, easy to use, and aligned with their expectations. These results are consistent with the Technology Acceptance Model (TAM), which emphasizes the relation between influence of perceived usefulness, perceived ease of use, and behaviour intention [10,14,18]. To expand, perceived usefulness showed strong positive associations with expectations and preferences and intention to use, indicating that drivers who recognize the benefits of ADAS are more inclined to view the systems favourably and express a willingness to use them [5]. Similarly, perceived ease of use was positively related to trust and intention to use [18]. These findings were supported by previous studies [37], which found that perceived usefulness, perceived ease of use, and trust play an important role in acceptance in automotive technology. Moreover, this finding also reflects the importance of intuitive system design and minimal cognitive effort in enhancing positive evaluations of ADAS. Conversely, barriers and concerns demonstrated negative associations with perceived ease of use, trust, and intention to use. Although these associations were weak, concerns such as limited understanding, perceived system design inadequacies, and doubts about system reliability may partially explain lower trust and willingness to use ADAS.
The limitations of this study should be acknowledged. First, the sample only consisted of Thai drivers, which may limit the generalizability of the findings to other populations with different environmental and sociocultural contexts. Second, the data were collected through self-report measures rather than direct observation, therefore, the findings may be subject to self-report bias. Third, this study employed a cross-sectional design, with data collected at a single point in time. As participants’ perceptions of ADAS may evolve with changes in experience, exposure, or contextual factors, the findings may not fully reflect participants’ views over time.
6. Conclusions
This study explored drivers’ perceptions of Advanced Driver Assistance Systems (ADAS) and investigated factors associated with perceptions towards ADAS and intention to use the systems. The findings indicate that perceptions towards ADAS were associated with income level, sensory abilities, and driving and accident experience, and also showed the interrelationships among ADAS perception constructs. Specifically, strong positive associations were observed between perceived usefulness, perceived ease of use, trust, expectations and preferences, and intention to use ADAS, whereas barriers and concerns showed a weak negative association with intention to use. Thai drivers demonstrated generally positive perceptions towards ADAS, while ADAS understanding and affordability to access ADAS-equipped vehicles remain challenges. To enhance ADAS usage in Thailand, system usability should be emphasized together with the provision of adequate information., In particular, system design should be adaptable match users’ sensory limitations, have a transparent system feedback, be easy to understand, reduced complexity of interpretation and effective learning strategies to reduce barriers and enhance more positive trust perceptions, in order to support better sustained use of ADAS.
Future research should consider evaluating drivers’ knowledge of ADAS to gain more insight into individual driver of understanding and how they interpret system functions. Comparative studies examining differences in knowledge and perceptions between Thailand and other regions, including Asia and European countries, would be valuable for identifying context-specific differences and effective approaches to enhance ADAS acceptance and adoption. In addition, implementing observational measures of ADAS use and driving behaviour would help reduce the limitations associated with self-reported data. This study provides valuable evidence for government, the education sector, and policymakers to inform strategies aimed at reducing barriers and promoting guidelines for sustained use of ADAS in Thailand.
Author Contributions
Conceptualization, N.P., D.G. and A.M.; methodology, N.P., D.G. and A.M.; validation, D.G., and A.P.; formal analysis, N.P.; investigation, N.P.; resources, N.P.; data curation, N.P.; writing—original draft preparation, N.P.; writing—review and editing, D.G and A.P.; visualization, N.P.; supervision, D.G and A.P.; project administration, N.P. All authors have read and agreed to the published version of the manuscript.
Funding
This research received no external funding.
Institutional Review Board Statement
The study was conducted in accordance with the Declaration of Helsinki and approved by the Ethics Committee of Loughborough University (review reference: 2025-22831-24371; July 2025).
Informed Consent Statement
Informed consent was obtained from all subjects involved in the study.
Data Availability Statement
The data presented in this study are available on request from the corresponding author.
Acknowledgments
During the preparation of this work, the authors used GPT-5.2 (OpenAI) for the purposes of assisting in correct sentences and grammar and check cohesion. The authors have reviewed and edited the output and take full responsibility for the content of this publication.
Conflicts of Interest
The authors declare no conflicts of interest.
Abbreviations
The following abbreviations are used in this manuscript:
| ADAS | Advanced Driver Assistance Systems |
| TAM UTAUT TTAT PU |
Technology Acceptance Model The Unified Theory of Acceptance and Use of Technology The Technology Threat Avoidance Theory Perceived Usefulness |
| PEOU BC |
Perceived Ease of Use Perceived Barriers and concerns |
| EP IU |
Expectation and Preferences Intention to use |
Appendix A
Appendix A.1

Table A1.
This is a table caption.
| Frequency | Percentage | |
| Vehicle brand and model | ||
| Isuzu D-Max | 83 | 9.8 |
| Toyota Hilux | 57 | 6.7 |
| Toyota Vios | 55 | 6.5 |
| Other | ||
| Vehicle age (years) | ||
| 1-5 | 261 | 30.7 |
| 6-10 | 335 | 39.5 |
| 11-15 | 156 | 18.4 |
| More than 15 | 97 | 11.4 |
| Driving experience (years) | ||
| 1-3 | 115 | 13.5 |
| 4-6 | 125 | 14.7 |
| 7-9 | 95 | 11.2 |
| More than 10 | 514 | 60.5 |
| Accident experience (in past 2 years) | ||
| No | 630 | 74.2 |
| Minor collision | 204 | 24 |
| Severe collision | 15 | 1.8 |
| Average weekly driving distance (miles) | ||
| Less than 31 | 135 | 15.9 |
| 32 - 62 | 286 | 33.7 |
| 63 - 124 | 290 | 34.2 |
| More than 125 | 138 | 16.3 |
| Driving over the speed limit | ||
| Never | 320 | 37.7 |
| Rarely | 303 | 35.7 |
| Sometimes | 149 | 17.6 |
| Often | 47 | 5.5 |
| Always | 30 | 3.5 |
| Having heard of ADAS | ||
| No | 208 | 24.5 |
| Yes | 466 | 54.9 |
| Not sure | 175 | 20.6 |
| Having received any information or training ADAS | ||
| No | 251 | 29.6 |
| Not sure | 123 | 14.5 |
| Care dealer | 203 | 23.9 |
| Family or friends | 108 | 12.7 |
| Instruction manual | 69 | 8.1 |
| Online VDO or website | 95 | 11.2 |
References
- Palac, D.; et al. Advanced driver assistance systems (ADAS): Who’s driving what and what’s driving use? In Proceedings of the Human Factors and Ergonomics Society; SAGE Publications Inc.: 2021; pp. 1220–1224.
- Ammar, D.; et al. Driving style classification and the effectiveness of advanced driving assistance systems: Differences between teen and adult drivers. Transp. Res. Rec. 2023, 2677, 731–742.
- Biassoni, F.; Gnerre, M. Understanding elderly drivers’ perception of advanced driver assistance systems: A systematic review of perceived risks, trust, ease of use, and usefulness. Geriatrics 2024.
- Eby, D.W.; et al. Use, perceptions, and benefits of automotive technologies among aging drivers. Inj. Epidemiol. 2016.
- Braun, H.; et al. Advanced driver assistance systems for aging drivers. In Proceedings of the 11th International ACM Conference on Automotive User Interfaces and Interactive Vehicular Applications; Association for Computing Machinery: 2019; pp. 123–133.
- Wood, J.M.; et al. Exploring perceptions of advanced driver assistance systems (ADAS) in older drivers with age-related declines. Transp. Res. Part F 2024, 100, 419–430.
- Masello, L.; et al. On the road safety benefits of advanced driver assistance systems in different driving contexts. Transp. Res. Interdiscip. Perspect. 2022, 15, 100670.
- Aleksa, M.; et al. Impact analysis of advanced driver assistance systems (ADAS) regarding road safety—computing reduction potentials. Eur. Transp. Res. Rev. 2024, 16, 1–13.
- Deaths from road injuries, 2016 to 2021. Available online: https://ourworldindata.org/grapher/number-of-deaths-from-road-injuries (accessed on 28 March 2025).
- Davis, F.D. Perceived usefulness, perceived ease of use, and user acceptance of information technology. MIS Q. 1989, 13, 319–339.
- Downe, A.G.; Taiwo, A.A. The theory of user acceptance and use of technology (UTAUT): A meta-analytic review of empirical findings. J. Theor. Appl. Inf. Technol. 2013, 10.
- Wang, J.; Li, X.; Wang, P.; Liu, Q.; Deng, Z.; Wang, J. Research trend of the unified theory of acceptance and use of technology theory: A bibliometric analysis. Sustainability 2022, 14, 10.
- Damsara, K.; de Barros, A. A systematic review on user acceptance of advanced driver assistance systems (ADAS). Transp. Res. Procedia 2025, 82, 3472–3482.
- Rahman, M.M.; et al. Assessing the utility of TAM, TPB, and UTAUT for advanced driver assistance systems. Accid. Anal. Prev. 2017, 108, 361–373.
- Hansen, A. Advanced driver–assistance systems are set to change the way we drive; but do older drivers trust the technology enough to use it? Thesis, University of New South Wales, Sydney, Australia, 2025.
- Liang, H.; Xue, Y. Avoidance of information technology threats: A theoretical perspective. MIS Q. 2009, 33, 71–90.
- Jun, J.; Park, H.; Cho, I. Study on initial adoption of advanced driver assistance system: Integrated model of PMT and UTAUT2. Total Qual. Manag. Bus. Excell. 2019, 30, S83–S97.
- Kaye, S.-A.; Nandavar, S.; Yasmin, S.; Lewis, I.; Oviedo-Trespalacios, O. Consumer knowledge and acceptance of advanced driver assistance systems. Transp. Res. Part F 2022, 90, 300–311.
- Wang, T.L. An effect of trust and attitude in the initial adoption of online shopping: An empirical study. In Proceedings of the International Conference on Information Society; 2011; pp. 22–26.
- Ramjan, S.; Sangkaew, P. Understanding the adoption of autonomous vehicles in Thailand: An extended TAM approach. Eng. Manag. Prod. Serv. 2022, 14, 49–62.
- Akbari, M.; et al. Acceptance of 5G technology: Mediation role of trust and concentration. J. Eng. Technol. Manag. 2020, 57, 101585.
- Yannis, G.; et al. Older drivers’ perception and acceptance of in-vehicle devices for traffic safety and traffic efficiency. J. Transp. Eng. 2010, 136, 472–479.
- Souders, D.; Charness, N. Challenges of older drivers’ adoption of advanced driver assistance systems and autonomous vehicles. In Lecture Notes in Computer Science; Springer: 2016; Vol. 9755; pp. 428–440.
- Liang, D.; et al. Examining senior drivers’ attitudes toward advanced driver assistance systems after naturalistic exposure. Innov. Aging 2020, 4, 1–12.
- Motamedi, S.; et al. Different level automation technology acceptance: Older adult driver opinion. Transp. Res. Part F 2021, 80, 1–13.
- Crump, C.; et al. Differing perceptions of advanced driver assistance systems (ADAS). In Proceedings of the Human Factors and Ergonomics Society; 2016; pp. 860–864.
- Classen, S.; et al. Predicting autonomous shuttle acceptance in older drivers. Front. Neurol. 2021, 12.
- Lajunen, T.; Sullman, M.J.M. Attitudes toward four levels of self-driving technology among elderly drivers. Front. Psychol. 2021, 12.
- Krejcie, R.V.; Morgan, D.W. Determining sample size for research activities. Educ. Psychol. Meas. 1970, 30, 607–610.
- Turner, R.C.; Carlson, L. Indexes of item-objective congruence for multidimensional items. Int. J. Test. 2003, 3, 163–171.
- Venkatesh, V.; et al. User acceptance of information technology: Toward a unified view. MIS Q. 2003, 27, 425–478.
- Peng, M.H.; Hwang, H.G. An empirical study to explore the adoption of e-learning social media platform in Taiwan: An integrated conceptual adoption framework. Sustainability 2021, 13.
- Xu, Z.; et al. What drives people to accept automated vehicles? Findings from a field experiment. Transp. Res. Part C 2018, 95, 320–334.
- Burridge, H.; Mayer, M.; Vaganay, A. Experiences of Advanced Driver Assistance Systems amongst Older Drivers: An Evidence Review for the Department for Transport; Department for Transport: London, UK, 2020.
- Ali, Y.; Haque, M.M.; Zheng, Z.; Bliemer, M.C.J. Stop or go decisions at the onset of yellow light in a connected environment: A hybrid approach. Anal. Methods Accid. Res. 2021, 31, 100165.
- Oviedo-Trespalacios, O.; Tichon, J.; Briant, O. Is a flick-through enough? A content analysis of advanced driver assistance systems (ADAS) user manuals. PLoS ONE 2021, 16, e0252688.
- Günthner, T.; Proff, H. On the way to autonomous driving: How age influences the acceptance of driver assistance systems. Transp. Res. Part F 2021, 81, 586–607.
Figure 1.
Distribution of familiar ADAS features among participants (n=849).
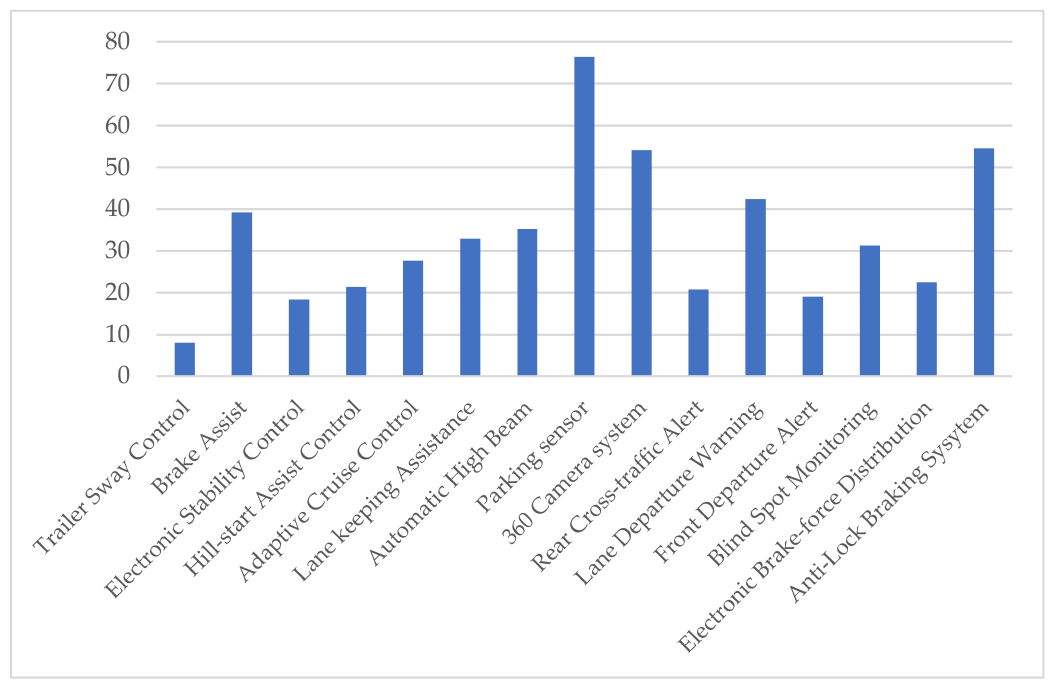
Figure 2.
Reasons for turning off or avoiding ADAS use among participants (n=602).
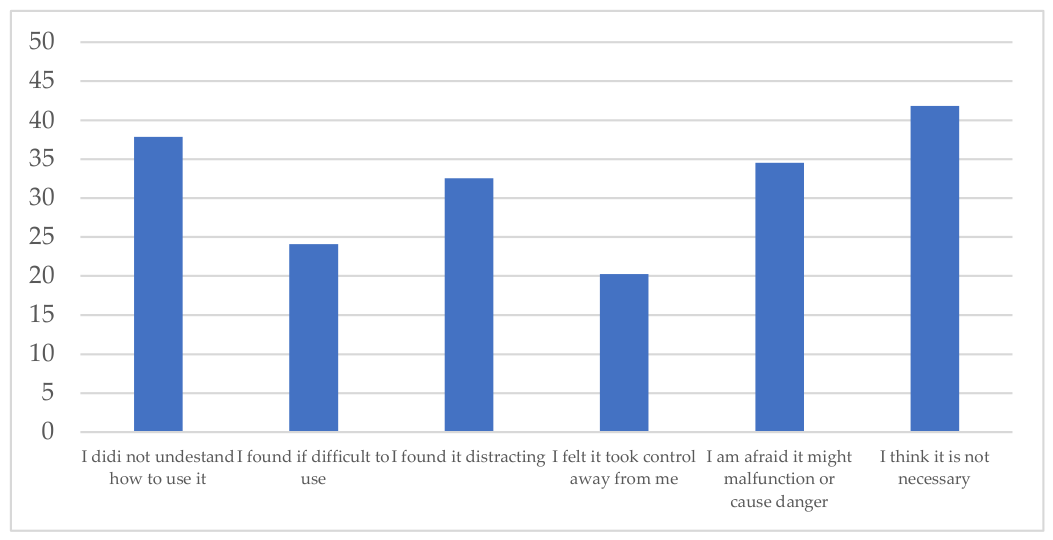
Figure 3.
Distribution of perceptions towards ADAS (n=849). Higher scores indicate more positive perceptions for PU, PEOU, Trust, EP, and IU. Please note that the higher score for BC indicates greater perceived barriers.
Figure 3.
Distribution of perceptions towards ADAS (n=849). Higher scores indicate more positive perceptions for PU, PEOU, Trust, EP, and IU. Please note that the higher score for BC indicates greater perceived barriers.
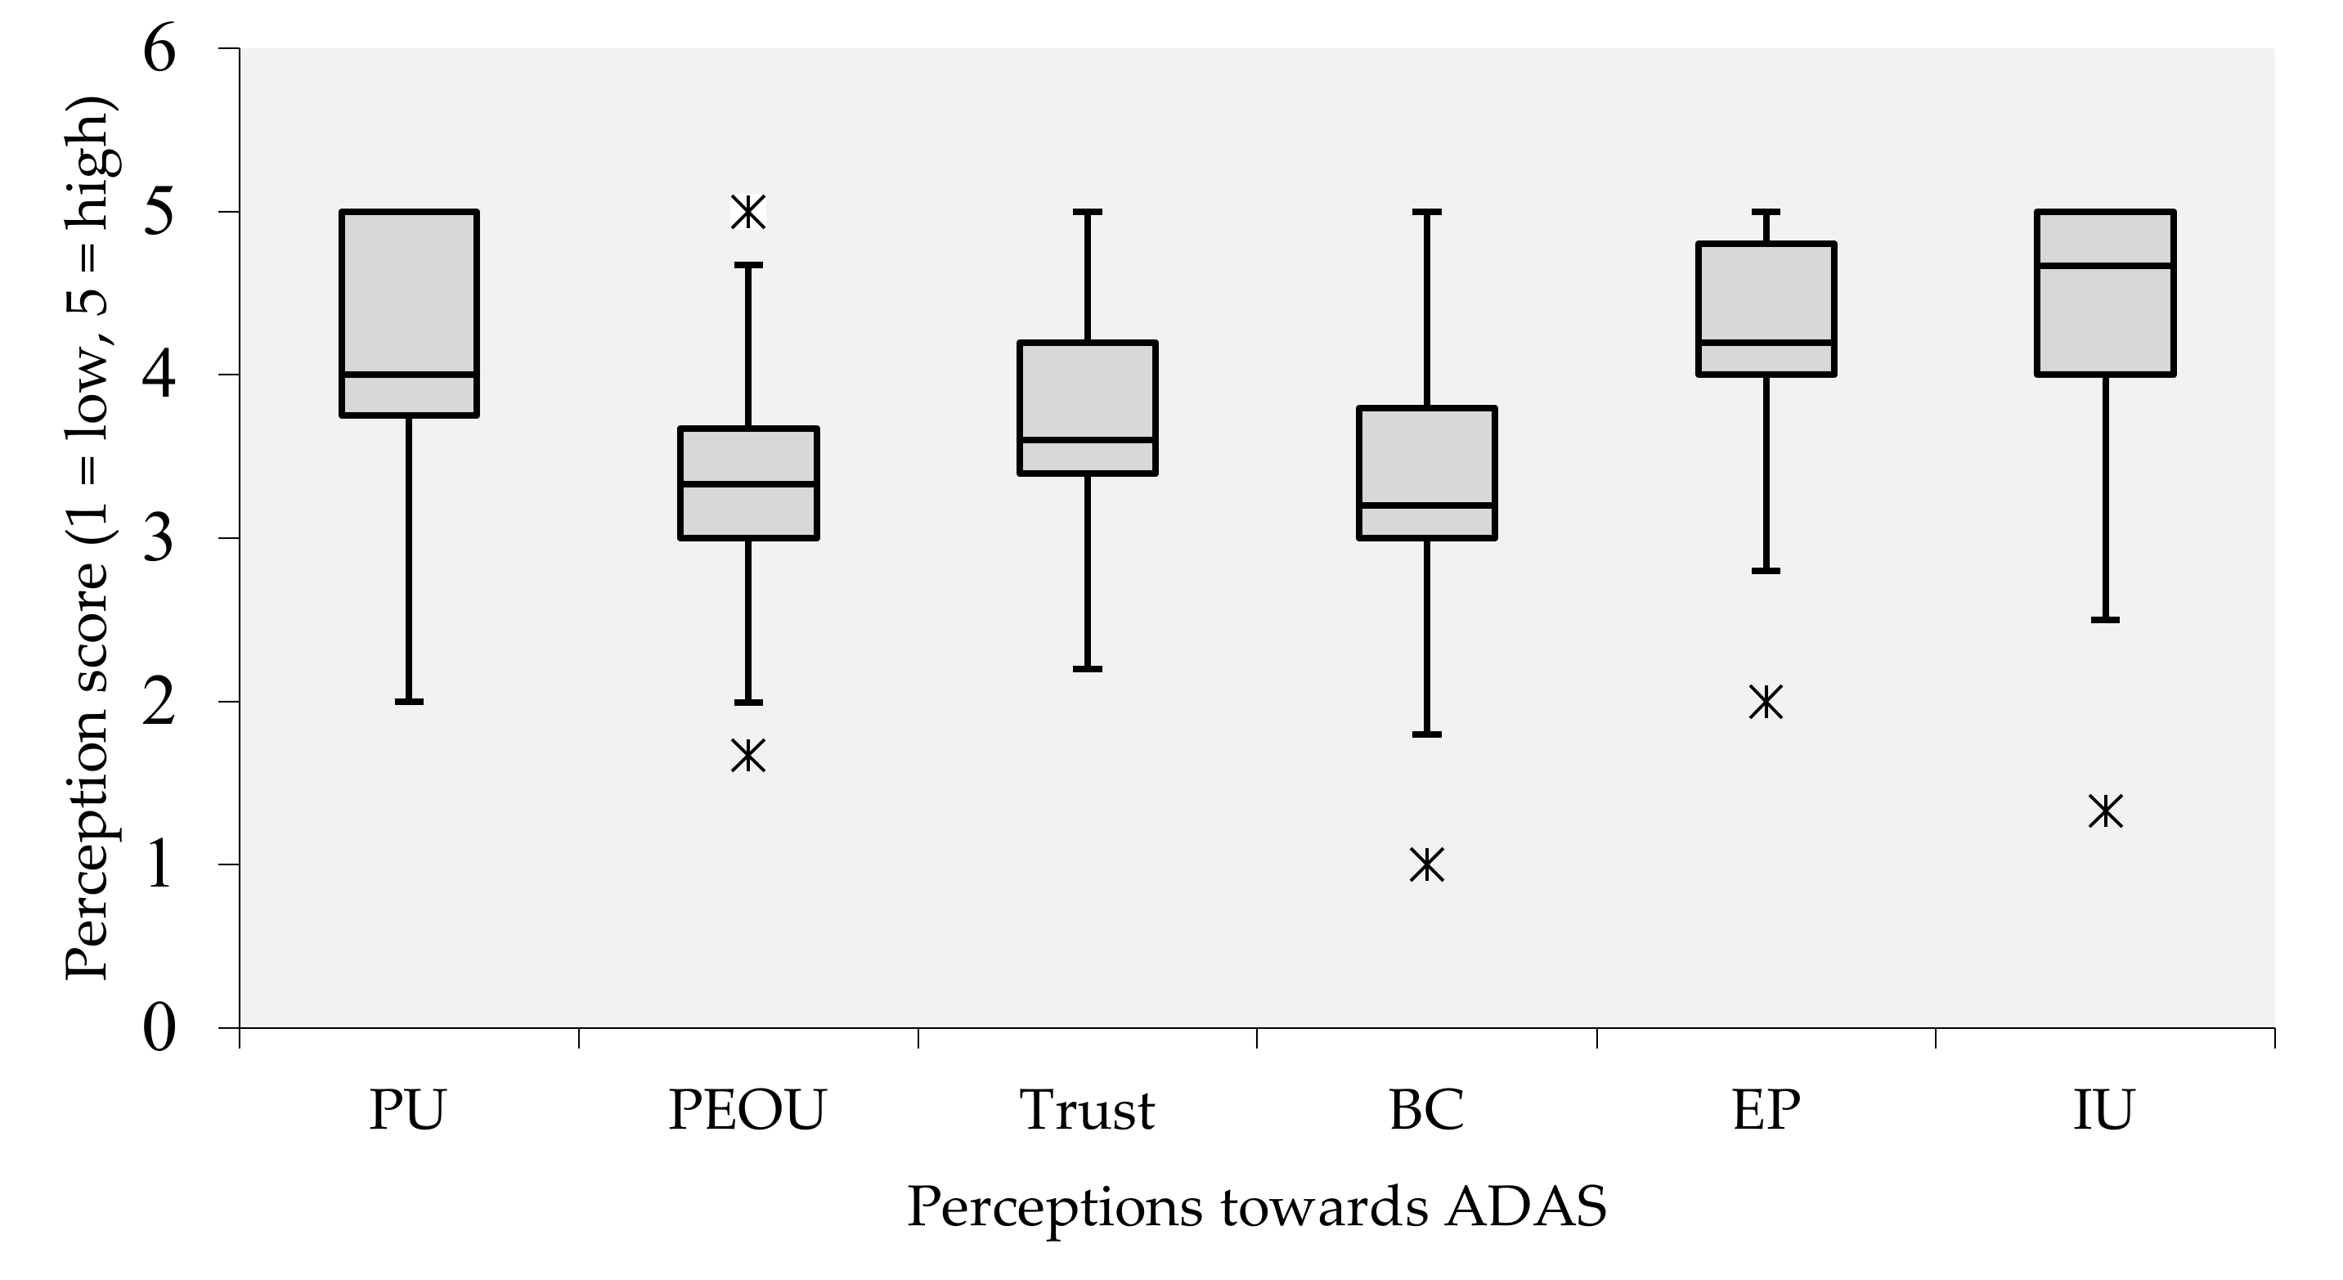
Table 1.
Online questionnaire section.
| Section | Number of questions | Scale |
| Demographics | 6 | Multiple choice |
| Diving experiences | 7 | Multiple choice |
| ADAS experiences | 8 | Multiple choice |
| Perceptions towards ADAS | 17 | 5-point Likert scale |
| Expectations and preferences | 5 | 5-point Likert scale |
| Intention to use | 3 | 5-point Likert scale |
Table 2.
Online questionnaire item.
| Variables | Item | Statement | Reference |
| Perceived Usefulness | PU1 | They can help prevent road accidents | [15] |
| PU2 | It will make me a safer driver | [31] | |
| PU3 | It can make driving easier | [31] | |
| PU4 | It is useful for driving | [31] | |
| Perceived ease of use | PEOU1 | It is easy to learn how to use | [31] |
| PEOU2 | They are easy to control | [31] | |
| PEOU3 | It is difficult to understand how they work | [31] | |
| Trust | TR1 | I would feel more confident if they were available in my car | [15] |
| TR2 | They provide accurate alerts and information | Self-developed | |
| TR3 | They are reliable in different driving conditions | [15] | |
| TR4 | I am hesitant to rely on these systems in critical situations | Self-developed | |
| TR5 | They are generally trustworthy | [15] | |
| Barriers and Concerns | BC1 | I am concerned that they might distract me while driving | Self-developed |
| BC2 | I am worried about the cost of installing or maintaining them | [16] | |
| BC3 | I fear that relying on them too much or for too long might reduce my driving skills | Self-developed | |
| BC4 | I am afraid they might malfunction or cause harm while driving | [32] | |
| BC5 | I lack self-confidence to use them | Self-developed | |
| Expectations and Preferences | EP1 | Must be easy to understand and operate | [31] |
| EP2 | Must be operated automatically without requiring manual activation | Self-developed | |
| EP3 | It is important to have a user manual or instruction guide | Self-developed | |
| EP4 | Must be able to customize or adjust settings according to preferences | Self-developed | |
| EP5 | It should provide clear visual or audio feedback while driving | [31] | |
| Intention to use | IU1 | I would like to drive a car equipped with safety technologies | [14] |
| IU2 | I would consider buying a car equipped with safety technologies in the future | [32] | |
| IU3 | I would recommend cars with safety technologies to my family and others | [33] |
Table 3.
Demographics of the participants (n=849).
| Frequency | Percentage | |
| Gender | ||
| Male | 443 | 52.2 |
| Female | 374 | 44.1 |
| Other or prefer not to say | 32 | 3.8 |
| Age (years) | ||
| 18-59 | 447 | 52.7 |
| 60 and older | 402 | 47.3 |
| Income per month (GBP) | ||
| Less than 235 | 125 | 14.7 |
| 235-350 | 114 | 13.4 |
| 350-470 | 137 | 16.1 |
| 470-580 | 134 | 15.8 |
| More than 580 | 339 | 39.9 |
| Education level | ||
| Primary school | 112 | 13.2 |
| Secondary school | 259 | 30.5 |
| Bachelor’s degree or higher | 478 | 56.3 |
| Change in sensory abilities | ||
| No | 364 | 42.9 |
| Visual change | 344 | 40.5 |
| Hearing change | 50 | 5.9 |
| Visual and hearing change | 91 | 10.7 |
Table 4.
Mann–Whitney U tests results comparing ADAS perceptions between age groups.
| Age group | n | Mean rank | U | Z | P value | |
| Perceived Ease of Use | Younger | 447 | 402.72 | 79890.00 | -2.847 | .004* |
| Older | 402 | 449.77 | ||||
| Perceived Barrier and Concern | Younger | 447 | 456.37 | 75826.00 | -3.989 | <.001* |
| Older | 402 | 390.12 |
Note. Mann–Whitney U test *p < .05.
Table 5.
Spearman’s rank correlation coefficients between individual factors, driving- and ADAS-related experiences, and perceptions towards ADAS.
Table 5.
Spearman’s rank correlation coefficients between individual factors, driving- and ADAS-related experiences, and perceptions towards ADAS.
| PU | PEOU | Trust | BC | EP | IU | |
| Age | -.02 | .10** | .04 | -.14** | .01 | -.02 |
| Gender | -0.3 | -.00 | .02 | -.10** | -.01 | .02 |
| Income | .14** | .26** | .17** | -.17** | .09** | .17** |
| Education level | .10** | .06 | .09** | .00 | .01 | .12** |
| Sensory decline | -.20** | -.19** | -.19** | .07 | -.22** | -.13** |
| Vehicle age | -.03 | -.01 | -.05 | .09** | -.05 | -.12** |
| Driving experience | .08* | .19** | .09* | -.10** | .15** | .14** |
| Accident experience | -.27** | -.21** | -.25** | .03 | -.29** | -.30** |
| Speeding behaviour | -.08* | -.07* | -.07* | .05 | -.10** | -.11** |
| Having heard of ADAS | .19** | .20** | .22** | -.07 | .20** | .26** |
| Having received ADAS information | .05 | -.01 | -.02 | -.03 | -.01 | .02 |
Note. Spearman’s rank correlation coefficient *p < .05, **p < .01.
Table 6.
Spearman’s rank correlation coefficients among ADAS perception constructs.
| PU | PEOU | Trust | BC | EP | IU | |
| Perceived Usefulness | 101.000 | .49** | .69** | .01 | .63** | .47** |
| Perceived ease of use | 1.00 | .56** | -.20** | .37** | .34** | |
| Trust | 1.00 | -.12** | .56** | .49** | ||
| Barriers and concerns | 1.00 | .07 | -.08* | |||
| Expectations and preferences | 1.00 | .41** | ||||
| Intention to use | 1.00 |
Note. Spearman’s rank correlation coefficient *p < .05, **p < .01.
Disclaimer/Publisher’s Note: The statements, opinions and data contained in all publications are solely those of the individual author(s) and contributor(s) and not of MDPI and/or the editor(s). MDPI and/or the editor(s) disclaim responsibility for any injury to people or property resulting from any ideas, methods, instructions or products referred to in the content. |
© 2026 by the authors. Licensee MDPI, Basel, Switzerland. This article is an open access article distributed under the terms and conditions of the Creative Commons Attribution (CC BY) license (http://creativecommons.org/licenses/by/4.0/).
Copyright: This open access article is published under a Creative Commons CC BY 4.0 license, which permit the free download, distribution, and reuse, provided that the author and preprint are cited in any reuse.