
Submitted:
21 September 2026
Posted:
23 September 2026
You are already at the latest version
Abstract
Irrigation-water quality and soil physical properties influence water movement through agricultural soils, but their interactions under field irrigation conditions remain poorly characterized in Eastern Africa. This study evaluated irrigation-water quality, soil physicochemical properties, and infiltration behaviour in the Kagitumba and Nasho Government-Funded Irrigation schemes in Eastern Rwanda. A comparative observational design was applied at 20 sampling locations per scheme. Soil samples were collected at 0–30 and 30–60 cm depths, and 20 irrigation-water samples were collected from each scheme. Soil properties and irrigation-water quality were analysed using standard laboratory and field methods. Infiltration was measured using a double-ring infiltrometer and described using the Horton model. Paired-samples t-tests and Spearman rank correlations were used for statistical analysis. Both schemes had predominantly sandy-loam soils, but soil physical properties differed between schemes and depths. Bulk density ranged from 0.751–0.896 g cm⁻³ at Kagitumba and 1.31–1.33 g cm⁻³ at Nasho. Mean irrigation-water electrical conductivity was 0.319 and 0.324 dS m⁻¹, respectively. Turbidity was higher at Kagitumba than at Nasho. Steady-state infiltration rates were 0.8 and 1.2 cm h⁻¹, respectively. Significant depth-related differences occurred in several soil properties. Infiltration was significantly associated with water electrical conductivity and oxidation–reduction potential only at Nasho, while turbidity was not significantly associated with infiltration at either scheme. Soil properties and infiltration behaviour showed substantial site-specific and depth-related variability. Integrating depth-resolved soil characterization with irrigation-water quality assessment is important for understanding soil–water interactions and improving irrigation management in sandy-loam soils.
Keywords:
soil physicochemical properties
; irrigation water quality
; turbidity
; sustainable irrigation
; infiltration
1. Introduction
Soil and water resources are fundamental components of agricultural productivity, particularly in semi-arid regions where rainfall variability and prolonged dry periods limit the reliable supply of water for crops [1]. Soil physical and chemical properties, such as texture, bulk density, pH, salinity, organic matter, and nutrient availability, regulate water movement, nutrient cycling, and overall crop productivity [2]. Among these, the soil infiltration rate is a key hydrological indicator that determines irrigation efficiency and water-use effectiveness [3]. Variations in soil structure and irrigation conditions can alter infiltration behavior, potentially affecting deep percolation, nutrient leaching, surface runoff, and water availability [4]. As global population growth increases demand for diverse and nutritious diets, the capacity to meet these needs will depend heavily on how effectively we preserve and manage productive agricultural soils [5].
Irrigation water quality plays a critical role in shaping these soil processes. Water containing high concentrations of suspended sediments may contribute to surface sealing and pore blockage, potentially reducing infiltration capacity. Even when salinity levels remain within acceptable limits, continuous irrigation in coarse-textured soils can still enhance nutrient leaching due to rapid percolation processes [6,7].
Globally, irrigation accounts for nearly 70% of freshwater withdrawals and remains the dominant strategy for stabilizing agricultural production under increasing climate variability. However, growing pressure on freshwater systems has intensified concerns not only about water scarcity but also about irrigation water quality and its implications for long-term soil physical, chemical, and hydraulic stability. Irrigation is increasingly important for stabilizing agricultural production under climate variability, but its sustainability depends on both water availability and the quality of water applied to agricultural soils [8,9,10].
Irrigation is one of the main solutions for stabilizing yields and reinforcing food security, yet it is underdeveloped in most parts of Africa. However, irrigation consumes the largest amount of water among sectors; thus, exploring and implementing ways to increase yield per unit of water is necessary [11]. In sub-Saharan Africa, irrigation development has expanded in recent decades as part of strategies to enhance agricultural productivity and climate resilience [12]. Coarse-textured soils, which are common in many irrigated areas, are particularly vulnerable to rapid drainage and nutrient losses, especially under continuous irrigation practices [13].
In Rwanda, agriculture serves as the backbone of economic growth and plays a central role in poverty reduction and food security by promoting commercialized and professional farming systems. However, rapid population growth and urbanization are projected to intensify water demand, heightening the risk of water scarcity and declining water quality due to increased pollution [14]. The Government of Rwanda acknowledges irrigation as a critical driver of the country’s future economic growth and social development, with enhanced agricultural productivity positioned as a key pathway to poverty reduction. Consistent with the national development agenda, this priority was embedded within the Economic Development and Poverty Reduction Strategies (EDPRS I and II, 2008–2018) and further reinforced through the national Irrigation Policy and Action Plan. [15], The Government of Rwanda continues to invest in the establishment and expansion of small-, medium-, and large-scale irrigation schemes across both hillside and marshland areas [16].
In Rwanda, agriculture contributes approximately 31% of Gross Domestic Product (GDP) and employs 70% of the population, both directly and indirectly [17]. To strengthen agricultural productivity and resilience, the Government of Rwanda has prioritized irrigation development as a key strategy for transformation. As a result, more than 140 irrigation schemes covering thousands of hectares (approximately 70,000 ha of irrigated land nationally, with continuous expansion) have been developed across the country, particularly in the Eastern Province, where semi-arid conditions dominate [6]. Despite this investment, many irrigation schemes continue to experience low water use efficiency, declining soil fertility, and inconsistent crop performance, often linked not only to infrastructure limitations but also to insufficient understanding of soil–water–quality interactions under field irrigation conditions [7]. In particular, limited field evidence is available on the relationships between irrigation-water quality indicators and soil hydraulic behavior, including infiltration, under operational irrigation conditions in Eastern Rwanda.
Previous studies have often examined irrigation water quality, soil fertility, and irrigation performance as separate components, while fewer studies have evaluated their relationships with soil hydraulic behavior under field conditions. Furthermore, most existing studies are site-specific, limiting comparative insights across irrigation systems with different soil and hydrological characteristics. Therefore, there is a need for comparative, field-based assessments that jointly evaluate irrigation water quality and soil physical–chemical responses across multiple irrigation schemes under similar agro-climatic conditions. This study addresses this gap by conducting a comparative assessment of irrigation water quality, soil physical–chemical properties, and soil infiltration behavior in the Kagitumba and Nasho irrigation schemes in Eastern Rwanda. Specifically, the study (i) characterizes irrigation water quality in both schemes, (ii) evaluates soil physical and chemical properties at two depths (0–30 cm and 30–60 cm), and (iii) examines the statistical associations between irrigation-water quality parameters, soil properties, and infiltration behavior.
The study hypothesized that irrigation-water quality parameters would be associated with soil physicochemical properties and infiltration behavior under field irrigation conditions. By integrating field measurements, laboratory analyses, and statistical modeling, the findings provide field-based evidence that can inform irrigation-water management and soil management strategies in semi-arid irrigation systems.
2. Materials and Methods
2.1. Study Area
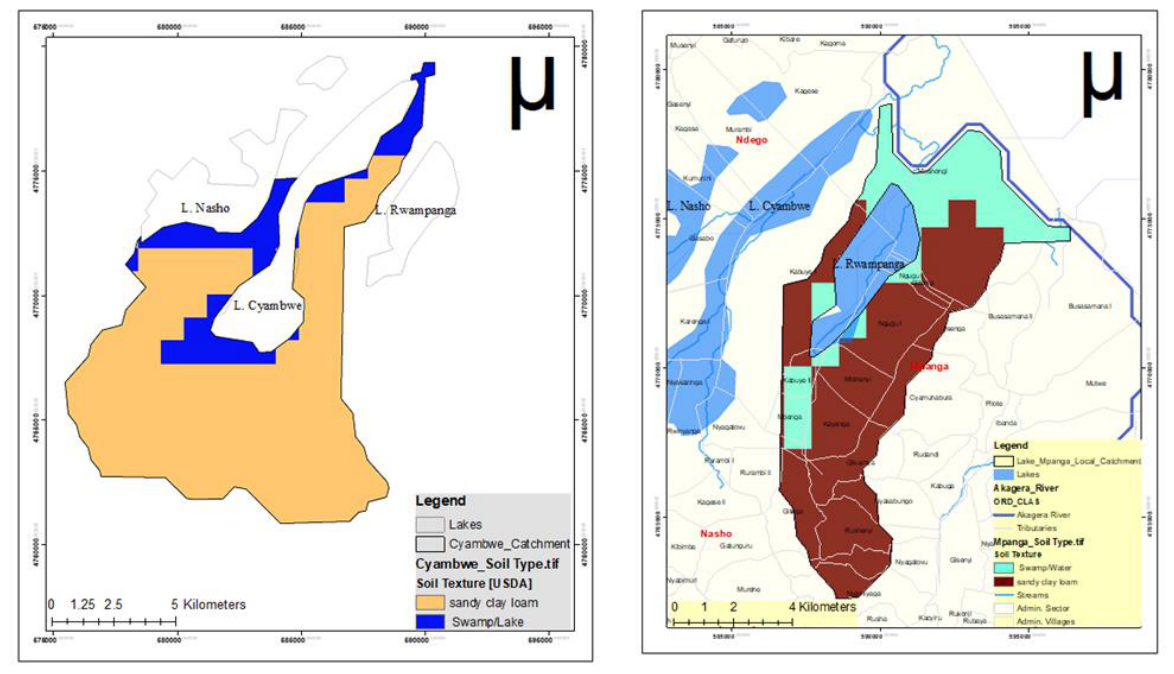
The study was conducted in two irrigation schemes located in the Eastern Province of Rwanda (Kagitumba and Nasho Government Fund). Kagitumba Irrigation Scheme is located in Nyagatare District (1.0584° S, 30.4574° E), while the Nasho Government-Funded Irrigation Scheme(Nasho-GFI) is located in Kirehe District (1.070° S, 30.480° E). Kagitumba is characterized by a semi-arid climate with annual rainfall ranging between 700 and 900 mm and high evapotranspiration rates, making irrigation essential for crop production. The scheme covers approximately 500 ha and relies on water abstracted from the Akagera River. Irrigation is primarily delivered through center pivot systems, supplemented by sprinkler irrigation. Major crops cultivated in the area include maize, soybean, beans, and chili. The Nasho-GFI scheme covers an area of 1,200 ha, and Nasho’s annual rainfall ranges between 800 and 1,200 mm. It has three lots (Lots 1, 2, and 3) to support management and irrigation operations. Lake Cyambwe is the primary water source for Lots 1 and 2, while Lake Rwampanga is the source for Lot 3.
Figure 1.
Kagitumba irrigation scheme map.
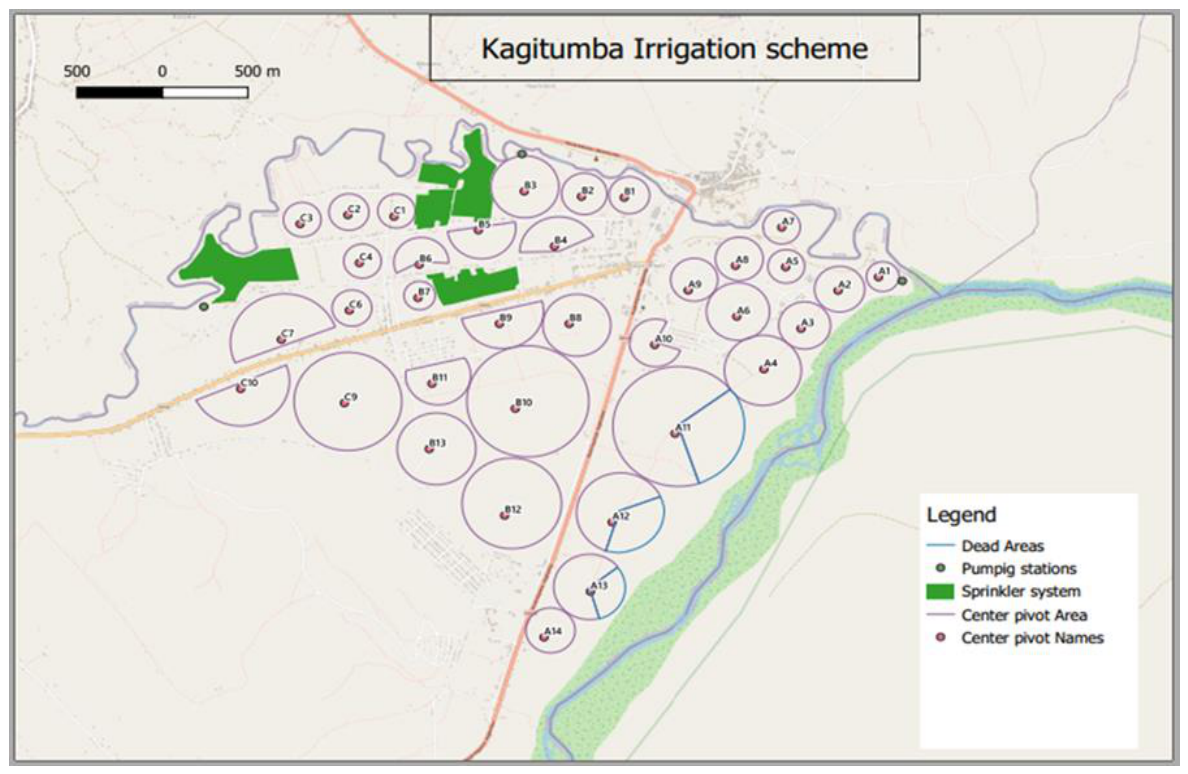
Figure 2.
Nasho GFI scheme map.
2.2. Research Design
This study employed a comparative observational analytical design to assess the relationship between irrigation water quality and soil physicochemical and hydraulic properties in irrigated agricultural systems. The design was based on field conditions without experimental manipulation of irrigation water, allowing assessment of naturally occurring variations across two irrigation schemes in Eastern Rwanda. The study integrated field sampling, laboratory analysis, and statistical evaluation to characterize irrigation water quality and soil physical–chemical properties and to examine their associations. Soil and water parameters were measured under existing irrigation practices in Kagitumba and Nasho irrigation schemes, enabling a comparative assessment of system responses under similar climatic conditions but differing soil and hydrological characteristics. The study therefore focused on associations among irrigation-water quality, soil physicochemical properties, and infiltration behavior rather than experimental treatment effects.
2.3. Sampling Strategy
Soil and water samples were collected using a structured sampling approach to ensure representativeness and minimize spatial variability. Soil sampling was conducted in irrigated maize fields across the scheme. Twenty sampling locations were selected within each irrigation scheme. At each location, soil samples were collected from two depths (0–30 cm and 30–60 cm), resulting in 40 soil samples per scheme and 80 soil samples in total. Sampling points were distributed across the irrigated command areas using a stratified random sampling approach to ensure adequate representation of different field positions and irrigation zones. At each point, soil samples were collected at two depths: the surface root zone (0–30 cm) and the subsurface root zone (30–60 cm) to capture within-root-zone variations and assess potential leaching of nutrients and salts. Composite samples were obtained by combining subsamples collected within a defined radius at each point. The samples were air-dried, sieved, and prepared for laboratory analysis.
Therefore, a total of 40 irrigation water samples were collected from both schemes, including the main intake point and irrigation distribution canals that actively supply water to the fields. Sampling was conducted during irrigation periods to ensure that the collected water represented actual field conditions. Clean polyethylene bottles were used, and each bottle was rinsed with irrigation water before sample collection to avoid contamination. The samples were sealed, labeled, stored in ice-filled coolers, and transported under controlled conditions to the laboratory for analysis within 24 hours.
2.4. Laboratory Analysis
Laboratory analysis of soil samples focused on both soil physical and chemical properties. Soil texture was determined using the hydrometer method [18], while bulk density was measured using the core sampling method [19].
Where:
- BD: bulk density (g/cm3 )
- Mv: mass of oven-dried soil (g)
- Vc: core volume (cm3)
Soil pH and electrical conductivity were measured in soil–water suspensions prepared at a 1:2.5 soil-to-water ratio using calibrated meters. Organic matter content was determined using the Walkley-Black wet oxidation method. Organic carbon was estimated from organic matter content using:
Where:
- OM: Organic Matter
- OC: Organic Carbon
Nitrogen content was determined using the Kjeldahl digestion–distillation method [20], while phosphorus was measured using the Olsen P extraction followed by colorimetric determination with the molybdenum blue method [21]. Field capacity (FC) and permanent wilting point (PWP) were determined using pressure plate apparatus, and available water content (AWC) was estimated as the difference between FC and PWP.
Where
- FC: field capacity (%)
- PWP: permanent wilting point (%)
- AWC: available water content (%)
Water quality analysis included parameters critical for irrigation suitability. The pH and electrical conductivity were measured with calibrated meters, and turbidity was measured with a nephelometric turbidity meter. Dissolved oxygen and oxidation-reduction potential were measured using appropriate digital probes. The results were interpreted based on established FAO irrigation water quality guidelines to assess their suitability for agricultural use.
2.5. Infiltration Measurement
Field infiltration measurements were conducted at 20 sampling locations in each irrigation scheme, giving a total of 40 infiltration test locations. Infiltration was measured under existing field conditions using a double-ring infiltrometer consisting of an inner ring with a diameter of 30 cm, an outer ring with a diameter of 60 cm, and a ring height of 45 cm. The rings were inserted approximately 15 cm into the soil to minimize lateral water movement during measurement. At each sampling location, water was maintained at a consistent depth within the inner and outer rings, and the decline in infiltration rate was recorded at regular elapsed-time intervals until the infiltration rate approached a relatively stable value. The same measurement procedure was applied at all 20 locations within each scheme. A steady-state infiltration rate (fc) was subsequently determined for each sampling location from the observed infiltration-time measurements. These location-specific steady-state infiltration rates constituted the infiltration observations used for statistical analysis, with n = 20 per irrigation scheme. To characterize the overall infiltration behavior of each scheme, the infiltration measurements from the 20 locations were also averaged at each corresponding elapsed-time interval. The resulting scheme-level mean infiltration-time series was used to describe the representative temporal infiltration behavior and to fit Horton’s infiltration model. Thus, the Horton curve represents the mean infiltration response of the 20 locations within each scheme, whereas the individual location-specific steady-state infiltration rates were retained for statistical comparison and correlation analysis.
Horton’s infiltration model, expressed as:
f(t) = fc + (f0−fc) e−kt
Where:
- f(t) = infiltration rate at time t (cm h−1)
- f0 = initial infiltration rate (cm h−1)
- fc= steady-state infiltration rate(cm h−1)
- k = decay constant
- t = elapsed infiltration time
The model parameters were estimated from the scheme-level mean infiltration-time series. The resulting Horton parameters and fitted curves were used to describe the overall infiltration dynamics of each irrigation scheme, while the 20 location-specific steady-state infiltration rates per scheme were used for subsequent statistical analyses. Specifically, mean, standard deviation, minimum, and maximum infiltration rates were calculated for each scheme, and infiltration rates were compared between schemes. In addition, the location-specific infiltration rates were paired with the corresponding water-quality and soil-property measurements at the same sampling locations for correlation analysis.
2.6. Variables and Hypothesis Testing
In this study, irrigation water quality parameters, including pH, electrical conductivity (EC), turbidity, dissolved oxygen (DO), and oxidation–reduction potential (ORP), were considered as explanatory variables. In contrast, soil physical, chemical, and hydraulic properties such as soil texture, bulk density, pH, electrical conductivity, organic matter content, nitrogen and phosphorus levels, and infiltration rate were considered as response variables. Given the observational and comparative nature of the study, the analysis did not involve experimental manipulation or treatment application; instead, it focused on examining naturally occurring field conditions in the two irrigation schemes. The study therefore emphasized assessing statistical relationships between irrigation water quality and soil properties rather than causal effects. Accordingly, the null hypothesis (H0) stated that there were no statistically significant associations between irrigation-water quality parameters and soil physicochemical and hydraulic properties. The alternative hypothesis (H1) stated that statistically significant associations existed between these variables.In addition, comparisons between Kagitumba and Nasho irrigation schemes were conducted using descriptive statistics and graphical analysis to highlight spatial variability in soil and water characteristics without assuming experimental treatment effects.
2.7. Statistical Analysis
All field and laboratory data were analyzed using IBM SPSS Statistics Version 27. Descriptive statistics, including mean, standard deviation, minimum, and maximum values, were calculated to summarize soil, irrigation-water, and infiltration characteristics for each irrigation scheme. For depth-wise comparison of soil properties, measurements from the 20 sampling locations at 0–30 cm and 30–60 cm were retained as paired observations and analyzed using paired-samples t-tests. For correlation analysis, soil measurements from the two sampling depths were averaged within each sampling location to obtain a single profile-level value. This resulted in 20 soil-profile observations per irrigation scheme. Infiltration analysis was conducted using the location-specific steady-state infiltration rate obtained from each of the 20 infiltration tests conducted within each irrigation scheme. These 20 infiltration observations were retained as individual observations and matched to the corresponding soil and irrigation-water measurements from the same sampling locations. Thus, correlation analyses involving infiltration were based on 20 location-matched observations per scheme (n = 20) rather than on the scheme-level mean infiltration curve. The mean infiltration-time series obtained by averaging measurements across the 20 locations at each elapsed-time interval was used separately for fitting Horton’s infiltration model and describing the overall infiltration behavior of each scheme. The Horton model therefore provided a scheme-level representation of infiltration dynamics, whereas the location-specific steady-state infiltration rates were used for statistical comparisons and correlation analyses. The normality of continuous variables was assessed using the Shapiro–Wilk test together with Q–Q plots. Because several variables showed departures from normality, Spearman’s rank correlation coefficient (ρ) was used to evaluate associations between infiltration rate, irrigation-water quality parameters, and soil properties. Statistical significance was evaluated at p < 0.05. The mean steady-state infiltration rates between Kagitumba and Nasho were compared using an independent-samples t-test. Because the variability between the two schemes was not assumed to be identical, the Welch-adjusted form of the independent-samples t-test was used. Results were reported using mean ± standard deviation, test statistic, and p-value.
3. Results
3.1. Soil Properties at Kagitumba Irrigation Scheme
This study analyzed the physical and chemical properties of the soil at Kagitumba and Nasho GFI irrigation schemes. The analyzed physical properties include soil depth, bulk density, and soil texture (sand, silt, and clay), field capacity, permanent wilting point, and available water. The chemical properties of the soil analyzed include pH, nitrogen, phosphorus, electrical conductivity, organic matter, and organic carbon. The properties of the soil were determined at two depths, 30 cm and 60 cm, and the results are presented in Table 1 and Table 2.
The soil at both depths in the Kagitumba schemes was sandy loam, with sand fractions of 60.8% in the 0-30 cm layer and 60% in the 30-60 cm layer. Silt content was 25.5% at 0- 30 cm and 20.5% at 30- 60 cm, while clay content was constant at 13.7% for both depths. The high sand content, combined with moderate silt and low clay, indicates that the soil has good drainage and reasonable water-holding capacity. The bulk density was 0.751 g/cm3 at 30 cm and 0.896 g/cm3 at 60 cm, both less than the typical threshold of 1.6 g/cm3 for compacted soils. The field capacity and permanent wilting point were found to be 16.9% and 8.3% at 30 cm, and 18% and 9% at 60 cm, respectively. This gives an available water content of 8.6% at 30 cm and 8% at 60 cm, indicating that the soil can hold moderate amounts of water for plant use and is well suited to crops with average water requirements. The pH values were 6.37 at 30 cm and 6.6 at 60 cm, both within the optimum range for most crops, ensuring adequate nutrient availability. Electrical conductivity (EC) values were low, at 0.197 and 0.262 dS/m, indicating non-saline soil conditions suitable for irrigation. For soil fertility, organic matter and organic carbon increased with depth, from 2.7% and 1.6% at 30 cm to 3.6% and 2% at 60 cm, respectively. This shows a reasonable level of soil fertility and potential for nutrient holding. The nitrogen percentage was low at 0.1% across both depths, indicating a potential need for nitrogen fertilization. Phosphorus percentage was relatively low at 30 cm (0.02%) and 60 cm (0.18%).
The soil at both depths in the Nasho GFI scheme was sandy loam, with sand fractions of 67.56% at 0-30 cm and 57.33% at 30-60 cm. Silt content was 22.44% at 0- 30 cm and 30% at 30- 60 cm, while clay content was 10% at 0-30 cm and 12.67% at 30-60 cm. The high sand content, combined with moderate silt and low clay, indicates that the soil has good drainage and reasonable water-holding capacity. The bulk density was 1.31 g/cm3 at 30 cm and 1.33 g/cm3 at 60 cm, both less than the typical threshold of 1.6 g/cm3 for compacted soils. Because the bulk density is low, the soil is well-structured with adequate porosity, which supports root growth and water infiltration. The field capacity and permanent wilting point were found to be 15.8% and 6.5% at 30 cm, and 18% and 10% at 60 cm, respectively. This gives an available water content of 9.3% at 30 cm and 10% at 60 cm, indicating that the soil can hold moderate amounts of water for plant use and is well suited to crops with average water requirements. The pH values were 7.3 at 30 cm and 7.8 at 60 cm, both within the optimum range for most crops, ensuring adequate nutrient availability. Electrical conductivity (EC) values were low at 0.1876 and 0.1968 dS/m, indicating non-saline soil conditions suitable for irrigation. For soil fertility, organic matter and organic carbon increased with depth, from 2% and 1.16% at 30 cm to 2.5% and 1.5% at 60 cm, respectively. This shows a reasonable level of soil fertility and potential for nutrient holding. The nitrogen percentage was low at 0.1% across both depths, indicating a potential need for nitrogen fertilization. Phosphorus percentage was relatively low at 30 cm (0.02%) and 60 cm (0.017%), indicating a need for phosphorus in crops.
3.1.1. Infiltration Rate
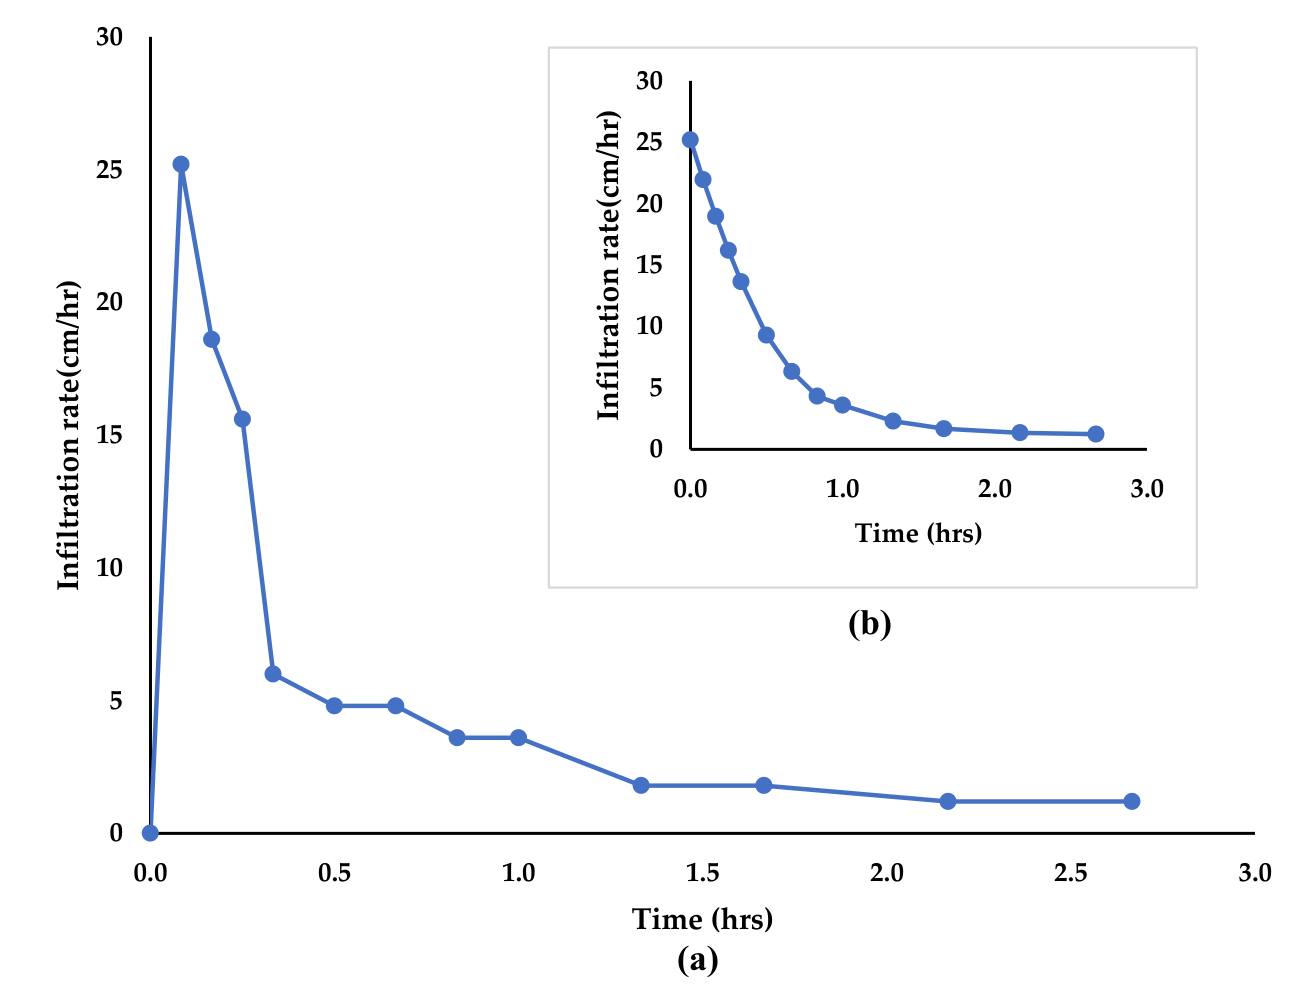
The infiltration rate was measured using a double-ring infiltrometer, and the results are presented in Table 3 and Table 4. The steady-state infiltration rate was 0.8 cm h−1 at Kagitumba and 1.2 cm h−1 at Nasho.
Application of Horton Infiltration Model
The field results and those obtained using the Horton equation showed the same trend, with infiltration rate decreasing over time. As presented in Figure 4 and Figure 6, the infiltration characteristics of the study soils were evaluated using the measured infiltration data and modeled using Horton’s infiltration equation. At the Kagitumba irrigation scheme, the initial infiltration rate ((f_0)) was 12.0 cm h−1, while the steady-state infiltration rate ((f_c)) was 0.8 cm h−1. The decay constant ((k)) was estimated at 0.0686 min−1 based on the observed decrease in infiltration rate over time. At the Nasho GFI scheme, the initial infiltration rate ((f_0)) was 25.0 cm h−1, the steady-state infiltration rate ((f_c)) was 1.2 cm h−1, and the decay constant ((k)) was estimated at 0.0805 min−1 based on the observed decrease in infiltration rate with time. The Horton model was fitted to the scheme-level mean infiltration-time series, obtained by averaging the infiltration measurements from the 20 infiltration locations at each corresponding elapsed-time interval. Thus, the fitted Horton curves represent the overall infiltration behavior of the 20 locations within each irrigation scheme rather than 20 separate Horton models. The individual location-specific steady-state infiltration rates ((n=20) per scheme) were retained separately for statistical comparison between schemes and for correlation analysis with the corresponding soil and irrigation-water properties.
Infiltration rate behavior before and after application of the Horton Infiltration Model (Kagitumba irrigation scheme)
Figure 3.
Infiltration behavior at Kagitumba irrigation scheme (a) Observed infiltration rate (b) Horton model fit.
Figure 3.
Infiltration behavior at Kagitumba irrigation scheme (a) Observed infiltration rate (b) Horton model fit.
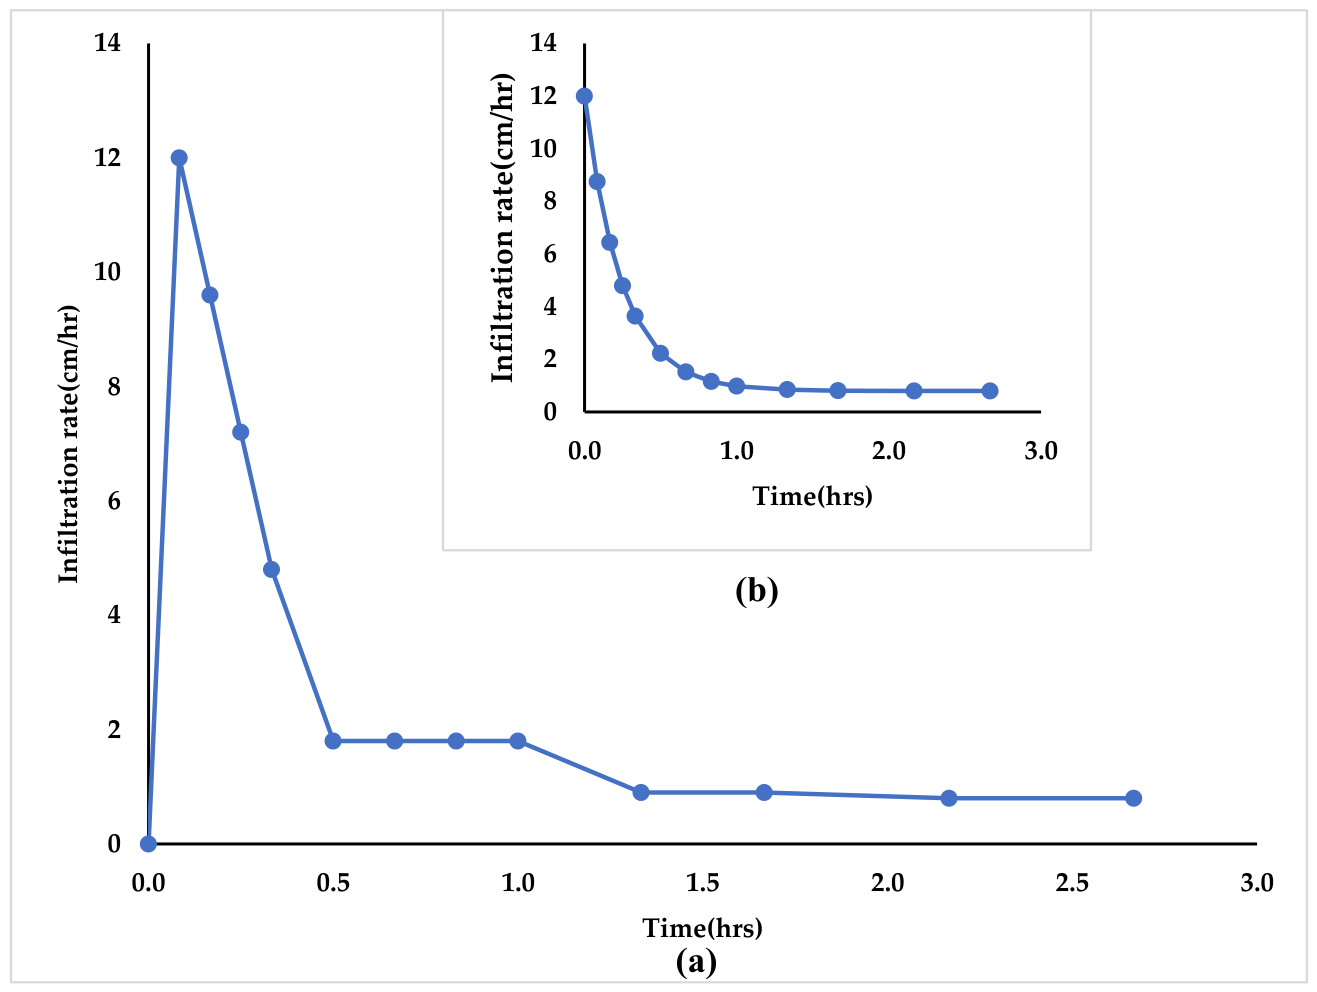
Figure 4.
Infiltration behavior at the Nasho GFI scheme (a) Observed infiltration rate (b) Horton model fit.
Figure 4.
Infiltration behavior at the Nasho GFI scheme (a) Observed infiltration rate (b) Horton model fit.
3.2. Irrigation Water Quality
Values presented in Table 5 and Table 6 are mean values calculated from 20 irrigation-water observations collected from each irrigation scheme., which revealed that both sources are chemically suitable for agricultural use, with mean pH values (7.03 and 7.35, respectively) falling within the FAO-recommended range of 6–8.4 and mean electrical conductivity levels (0.319 dS/m at Kagitumba and 0.324 dS/m at Nasho) indicating excellent quality with negligible salinity hazard. Mean Dissolved oxygen concentrations were high in both schemes (18.83 mg/L at Kagitumba and 21.4 mg/L at Nasho). However, mean oxidation–reduction potential values (−61.5 mV and −71.5 mV). The most critical limitation was mean turbidity, which was markedly higher at Kagitumba (81.25 NTU) compared to Nasho (52.5 NTU). Overall, while both schemes provide excellent chemical quality, Nasho water is comparatively more favorable due to lower turbidity and higher oxygen content, which enhance system performance and soil health.
3.3. Comparison of Irrigation Water Quality and Soil Properties
The irrigation-water quality parameters differed between the two irrigation schemes. Kagitumba recorded a mean pH of 7.03, electrical conductivity of 0.319 dS/m, dissolved oxygen of 18.83 mg/L, ORP of −61.5 mV, and turbidity of 81.25 NTU. Nasho GFI recorded a mean pH of 7.35, electrical conductivity of 0.324 dS/m, dissolved oxygen of 21.40 mg/L, ORP of −71.5 mV, and turbidity of 52.50 NTU. Soil properties also varied between the schemes and between the two sampling depths. Kagitumba generally recorded lower bulk density and higher organic matter than Nasho GFI, while Nasho GFI showed higher soil pH and bulk density. The measured infiltration rates were 0.8 cm/h at Kagitumba and 1.2 cm/h at Nasho GFI. These results describe the observed differences in irrigation-water quality, soil properties, and infiltration between the two schemes.
3.4. Correlation Between Irrigation Water Quality and Soil Properties
Spearman’s rank correlation analysis was conducted separately for Kagitumba and Nasho GFI to assess associations among irrigation-water quality parameters, soil properties, and infiltration rate. For the infiltration analysis, the correlations were based on the 20 location-specific steady-state infiltration rates per irrigation scheme, matched with the corresponding water-quality and soil-property measurements at the same sampling locations. Thus, (n=20) represents the number of sampling locations within each scheme and does not refer to the scheme-level mean infiltration-time series used for Horton model fitting. At Kagitumba ((n=20)), water pH showed a significant negative association with ORP (ρ = −0.490, p = 0.028). Water EC was significantly and positively associated with soil pH (ρ = 0.524, p = 0.018) and soil EC (ρ = 0.515, p = 0.020). Soil N was positively associated with soil EC (ρ = 0.492, p = 0.028) and negatively associated with bulk density (ρ = −0.522, p = 0.018). However, none of the examined water-quality or soil variables showed a statistically significant association with infiltration rate at Kagitumba (p > 0.05). In particular, infiltration rate showed no significant association with water pH (ρ = −0.365, p = 0.113), water EC (ρ = −0.086, p = 0.719), turbidity (ρ = −0.149, p = 0.531), ORP (ρ = 0.089, p = 0.710), DO (ρ = −0.115, p = 0.629), soil pH (ρ = −0.347, p = 0.133), soil N (ρ = 0.080, p = 0.738), soil EC (ρ = −0.090, p = 0.705), OM (ρ = 0.229, p = 0.332), or bulk density (ρ = −0.090, p = 0.705).

Table 7.
Relationship of Irrigation Water Quality and Soil Properties at Kagitumba Irrigation Scheme.
Table 7.
Relationship of Irrigation Water Quality and Soil Properties at Kagitumba Irrigation Scheme.
| Variable pair | ρ | p-value | Significance |
| Water pH – ORP | −0.490 | 0.028 | Significant |
| Water EC – Soil pH | 0.524 | 0.018 | Significant |
| Water EC – Soil EC | 0.515 | 0.020 | Significant |
| Soil N – Soil EC | 0.492 | 0.028 | Significant |
| Soil N – Bulk density | −0.522 | 0.018 | Significant |
| Water pH – Infiltration | −0.365 | 0.113 | Not significant |
| Water EC – Infiltration | −0.086 | 0.719 | Not significant |
| Turbidity – Infiltration | −0.149 | 0.531 | Not significant |
| ORP – Infiltration | 0.089 | 0.710 | Not significant |
| DO – Infiltration | −0.115 | 0.629 | Not significant |
| Soil pH – Infiltration | −0.347 | 0.133 | Not significant |
| Soil N – Infiltration | 0.080 | 0.738 | Not significant |
| Soil EC – Infiltration | −0.090 | 0.705 | Not significant |
| OM – Infiltration | 0.229 | 0.332 | Not significant |
| BD – Infiltration | −0.090 | 0.705 | Not significant |
Note: Spearman’s rank correlation coefficient (ρ); (n=20) location-specific observations; significance was evaluated at (p<0.05).
At Nasho GFI ((n=20)), water pH was significantly and negatively associated with infiltration rate (ρ = −0.464, p = 0.039), while turbidity also showed a significant negative association with infiltration rate (ρ = −0.493, p = 0.027). Water pH was additionally associated with soil organic matter, while water EC showed significant positive associations with soil pH and soil EC. Turbidity was significantly and negatively associated with dissolved oxygen (ρ = −0.657, p = 0.002). Soil pH showed significant positive associations with soil EC and organic matter, while soil N was negatively associated with bulk density. In contrast to the previously reported results, water EC was not significantly associated with infiltration rate (ρ = 0.218, p = 0.356), and ORP was also not significantly associated with infiltration rate (ρ = 0.011, p = 0.965). The remaining associations between infiltration and the examined soil variables were not statistically significant (p > 0.05).
Table 8.
Relationship of Irrigation Water Quality and Soil Properties at Nasho GFI Irrigation Scheme.
Table 8.
Relationship of Irrigation Water Quality and Soil Properties at Nasho GFI Irrigation Scheme.
| Variable pair | ρ | p-value | Significance |
| Water pH – OM | 0.629 | 0.003 | Significant |
| Water EC – Soil pH | 0.472 | 0.036 | Significant |
| Water EC – Soil EC | 0.513 | 0.021 | Significant |
| Turbidity – DO | −0.657 | 0.002 | Significant |
| Soil pH – Soil EC | 0.561 | 0.010 | Significant |
| Soil pH – OM | 0.595 | 0.006 | Significant |
| Soil N – BD | −0.493 | 0.027 | Significant |
| Water pH – Infiltration | −0.464 | 0.039 | Significant |
| Turbidity – Infiltration | −0.493 | 0.027 | Significant |
| Water EC – Infiltration | 0.218 | 0.356 | Not significant |
| ORP – Infiltration | 0.011 | 0.965 | Not significant |
| DO – Infiltration | −0.243 | 0.302 | Not significant |
| Soil pH – Infiltration | −0.063 | 0.791 | Not significant |
| Soil N – Infiltration | −0.108 | 0.649 | Not significant |
| Soil EC – Infiltration | 0.002 | 0.994 | Not significant |
| OM – Infiltration | 0.229 | 0.332 | Not significant |
| BD – Infiltration | 0.006 | 0.980 | Not significant |
Note: Spearman’s rank correlation coefficient (ρ); (n=20) location-specific observations; significance was evaluated at (p<0.05).
3.5. Paired Samples t-Test of Soil Properties at 30 cm and 60 cm Depths in Kagitumba and Nasho Government-Funded Irrigation Scheme
The paired-samples t-test was used to determine whether soil properties differed significantly between the 0–30 cm and 30–60 cm soil depths at Kagitumba. The results showed significant depth-related differences for most measured soil properties. Bulk density increased significantly from 0.751 g/cm3 at 30 cm to 0.896 g/cm3 at 60 cm (p < 0.001), indicating greater soil density in the deeper layer. Sand content was also significantly higher at 30 cm (60.8%) than at 60 cm (60.0%; p = 0.026), while silt content decreased significantly from 25.5% to 20.5% (p < 0.001). In contrast, clay content did not differ significantly between the two depths (13.7% at both depths; p = 1.000). The water-retention properties also differed significantly between depths. Field capacity increased from 16.9% at 30 cm to 18.0% at 60 cm (p < 0.001), while permanent wilting point increased from 8.3% to 9.0% (p < 0.001). However, available water decreased from 8.6% at 30 cm to 8.0% at 60 cm (p < 0.001). Soil pH increased significantly from 6.37 to 6.60 (p < 0.001) with depth. Phosphorus increased from 0.02% at 30 cm to 0.18% at 60 cm (p < 0.001), whereas nitrogen showed no significant difference between depths (0.10% at both depths; p = 1.000). Soil EC increased from 0.197 to 0.262 dS/m (p < 0.001). Organic matter and organic carbon were both significantly higher in the deeper layer. Organic matter increased from 2.7% at 30 cm to 3.6% at 60 cm, while organic carbon increased from 1.6% to 2.0%; both differences were statistically significant (p < 0.001).
Table 9.
Paired-samples t-test comparing soil properties between 0–30 cm and 30–60 cm at Kagitumba.
| Soil property | 0–30 cm | 30–60 cm | Mean difference (30–60) | t | df | p-value |
| Bulk density (g/cm3) | 0.751 | 0.896 | −0.145 | −27.177 | 19 | <0.001 |
| Sand (%) | 60.8 | 60.0 | 0.800 | 2.423 | 19 | 0.026 |
| Silt (%) | 25.5 | 20.5 | 5.000 | 17.387 | 19 | <0.001 |
| Clay (%) | 13.7 | 13.7 | 0.000 | 0.000 | 19 | 1.000 |
| Field capacity (%) | 16.9 | 18.0 | −1.100 | −7.157 | 19 | <0.001 |
| Permanent wilting point (%) | 8.3 | 9.0 | −0.700 | −6.051 | 19 | <0.001 |
| Available water (%) | 8.6 | 8.0 | 0.600 | 4.773 | 19 | <0.001 |
| pH | 6.37 | 6.60 | −0.230 | −9.722 | 19 | <0.001 |
| Nitrogen (%) | 0.10 | 0.10 | 0.000 | 0.000 | 19 | 1.000 |
| Phosphorus (%) | 0.02 | 0.18 | −0.160 | −61.203 | 19 | <0.001 |
| EC (dS/m) | 0.197 | 0.262 | −0.065 | −15.358 | 19 | <0.001 |
| Organic matter (%) | 2.7 | 3.6 | −0.900 | −20.580 | 19 | <0.001 |
| Organic carbon (%) | 1.6 | 2.0 | −0.400 | −18.709 | 19 | <0.001 |
The paired-samples t-test was used to determine whether soil properties differed significantly between the 0–30 cm and 30–60 cm soil depths at Nasho GFI. The results showed significant depth-related differences for all measured soil properties. Bulk density increased significantly from 0–30 cm to 30–60 cm, with a mean difference of −0.020 g/cm3 (p = 0.004), indicating greater soil density in the deeper layer. Sand content was significantly higher at 30 cm than at 60 cm, with a mean difference of 10.23% (p < 0.001). In contrast, silt content was significantly higher at 60 cm, with a mean difference of −7.56% (p < 0.001). Clay content was also significantly higher at 60 cm, with a mean difference of −2.67% (p < 0.001). The water-retention properties also differed significantly between depths. Field capacity increased at 60 cm compared with 30 cm, with a mean difference of −2.20% (p < 0.001). Similarly, permanent wilting point increased at 60 cm, with a mean difference of −1.50% (p < 0.001). However, available water decreased significantly with depth, with a mean difference of −0.70% (p < 0.001). Soil pH increased significantly from 30 cm to 60 cm, with a mean difference of −0.50 (p < 0.001). Nitrogen content was also significantly higher at 60 cm, with a mean difference of −0.005% (p < 0.001). In contrast, phosphorus was significantly higher at 30 cm, with a mean difference of 0.003% (p < 0.001). Soil EC increased significantly at the deeper depth, with a mean difference of −0.0092 dS/m (p < 0.001).
Organic matter and organic carbon were significantly higher at 60 cm than at 30 cm. Organic matter showed a mean difference of −0.50%, while organic carbon showed a mean difference of −0.34%; both differences were statistically significant (p < 0.001).Overall, the paired-samples t-test demonstrated significant differences between the two soil depths for all 13 measured soil properties at Nasho GFI.
Table 10.
Paired-samples t-test comparing soil properties between 0–30 cm and 30–60 cm at Nasho GFI.
Table 10.
Paired-samples t-test comparing soil properties between 0–30 cm and 30–60 cm at Nasho GFI.
| Parameters | Units | 30 cm | 60 cm | Mean Difference (30−60) | t | df | p-value |
| Bulk density | g/cm3 | 1.31 | 1.33 | −0.020 | −3.267 | 19 | 0.004 |
| Sand | % | 67.56 | 57.33 | 10.230 | 51.141 | 19 | <0.001 |
| Silt | % | 22.44 | 30.00 | −7.560 | −60.520 | 19 | <0.001 |
| Clay | % | 10.00 | 12.67 | −2.670 | −42.788 | 19 | <0.001 |
| Field capacity (FC) | % | 15.80 | 18.00 | −2.200 | −42.222 | 19 | <0.001 |
| Permanent wilting point (PWP) | % | 6.50 | 8.00 | −1.500 | −45.387 | 19 | <0.001 |
| Available water | % | 9.30 | 10.00 | −0.700 | −22.930 | 19 | <0.001 |
| Ph | — | 7.30 | 7.80 | −0.500 | −18.009 | 19 | <0.001 |
| Nitrogen (N) | % | 0.095 | 0.100 | −0.005 | −12.310 | 19 | <0.001 |
| Phosphorus (P) | % | 0.020 | 0.017 | 0.003 | 5.211 | 19 | <0.001 |
| Electrical conductivity (EC) | dS/m | 0.1876 | 0.1968 | −0.0092 | −14.532 | 19 | <0.001 |
| Organic matter (OM) | % | 2.00 | 2.50 | −0.500 | −27.429 | 19 | <0.001 |
| Organic carbon (OC) | % | 1.16 | 1.50 | −0.340 | −30.493 | 19 | <0.001 |
4. Discussions
4.1. Soil Physicochemical Properties and Depth-Related Variability
The soil physicochemical properties showed clear differences between the two sampling depths and between the irrigation schemes. At Kagitumba, the soil was dominated by sand, with sand content of approximately 60% at both depths, confirming the sandy-loam character of the soil. Bulk density increased from 0.75 g cm−3 at 0–30 cm to 0.90 g cm−3 at 30–60 cm, while organic matter increased from 2.7% to 3.6%. Field capacity and permanent wilting point also increased with depth, whereas available water decreased slightly. Soil pH increased from 6.37 to 6.60, and soil EC increased from 0.197 to 0.262 dS m−1. These depth-related changes indicate vertical variability in the physical and chemical environment of the soil profile. Similar depth-related changes in bulk density and hydraulic properties have been reported in agricultural and irrigated soils, where subsurface layers can exhibit greater compaction and different water-flow characteristics from surface soil [22,23].
The increase in bulk density with depth at Kagitumba is consistent with recent observations that soil hydraulic behavior is strongly related to changes in bulk density, texture, and organic matter. [23], working in the ETI Mpanga irrigation scheme in Rwanda, reported increasing bulk density with soil depth and an inverse relationship between bulk density and hydraulic conductivity. Similarly, recent research on agricultural soils has shown that subsurface physical properties can have an important influence on infiltration, particularly where changes in bulk density and soil structure occur with depth [22]. Thus, the increase in bulk density observed at Kagitumba may be relevant when interpreting the vertical distribution of water movement, although the present study did not directly measure hydraulic conductivity at each soil depth. The higher organic matter content observed at 30–60 cm at Kagitumba contrasts with the commonly reported decline of organic matter with increasing soil depth and therefore should be interpreted as a site-specific observation rather than a general depth pattern. Recent studies demonstrate that organic matter, bulk density, texture, and water-retention characteristics are closely interconnected and collectively influence soil hydraulic behavior [24]. Because organic matter contributes to soil aggregation and affects water retention, its measured distribution should be considered when interpreting differences in field capacity and available water between soil layers. However, the present data do not establish a causal relationship between organic matter and infiltration. At Nasho GFI, bulk density was higher than at Kagitumba, ranging from approximately 1.31 to 1.33 g cm−3. Sand content decreased from 67.56% at 0–30 cm to 57.33% at 30–60 cm, accompanied by increases in the finer fractions with depth. Field capacity and permanent wilting point increased at the deeper layer, while pH, EC, organic matter, organic carbon, and other measured properties also showed depth-related variation. The increase in finer particles at depth is relevant because soil texture influences pore-size distribution and water retention. Recent research has demonstrated that texture and bulk density are important predictors of soil water-retention characteristics and hydraulic behavior across different soil types [25].The depth-related differences identified through the paired comparisons further support the presence of vertical heterogeneity within the soil profiles.
At Kagitumba, significant differences between 0–30 and 30–60 cm were observed for bulk density, sand, silt, field capacity, permanent wilting point, available water, pH, phosphorus, EC, organic matter, and organic carbon, whereas clay and nitrogen did not differ significantly between the two depths (p > 0.05). Bulk density, field capacity, permanent wilting point, pH, phosphorus, EC, organic matter, and organic carbon were higher at 30–60 cm, while sand, silt, and available water were higher at 0–30 cm. These results indicate that the soil profile at Kagitumba was not physically or chemically uniform with depth, which may influence water storage and movement within the root zone. At Nasho GFI, the paired comparisons also indicated depth-related variation in the measured soil properties. The deeper layer showed a reduction in sand content from 67.56% to 57.33% and corresponding increases in the finer soil fractions, together with changes in field capacity, permanent wilting point, available water, pH, EC, organic matter, and organic carbon. The greater proportion of finer particles at depth may contribute to differences in pore-size distribution and water retention between the two layers. Recent studies have similarly reported that variations in soil texture and bulk density with depth can produce differences in water-retention and hydraulic characteristics within irrigated agricultural soils [26]. The observed differences between the two irrigation schemes highlight the importance of considering site-specific soil conditions when assessing irrigation performance.
Although both schemes were characterized broadly as sandy-loam soils, Kagitumba had lower bulk density and a relatively stable sand fraction, whereas Nasho GFI had higher bulk density and a greater shift toward finer particles at depth. Such differences can affect the distribution and movement of water through the soil profile and provide an important context for interpreting the differences in infiltration rates observed between the schemes. However, because the present study was observational, these relationships should be interpreted as associations rather than evidence of direct causation. The results demonstrate substantial vertical heterogeneity in soil physicochemical properties at both irrigation schemes. The significant depth-related differences in several physical and chemical properties indicate that characterization based only on surface soil may not adequately represent the conditions governing water storage and movement throughout the soil profile. Incorporating both 0–30 cm and 30–60 cm layers therefore provides a more complete basis for interpreting infiltration behavior and evaluating irrigation-water management in these sandy-loam soils.
4.2. Infiltration Dynamics
The infiltration measurements showed different infiltration behavior between the two irrigation schemes. The scheme-level steady-state infiltration rate represented by the Horton model was 0.8 cm h−1 at Kagitumba and 1.2 cm h−1 at Nasho GFI, indicating a higher steady-state infiltration rate at Nasho GFI. The location-specific measurements also showed higher mean infiltration at Nasho GFI (1.223 ± 0.108 cm h−1) than at Kagitumba (0.790 ± 0.075 cm h−1). Infiltration is governed by the interaction of soil texture, pore structure, bulk density, organic matter, and hydraulic conductivity, and these factors can vary considerably within agricultural landscapes. A large-scale assessment across 19 sub-Saharan African countries found that sand content and soil organic carbon were positively related to field-saturated hydraulic conductivity, while soil structure also played an important role beyond texture alone [27].
At Kagitumba, infiltration declined from a relatively high initial rate toward approximately 0.8 cm h−1 as the measurement progressed. At Nasho GFI, the infiltration rate similarly declined from a higher initial rate toward approximately 1.2 cm h−1. This pattern is consistent with the general behavior of infiltration under ponded conditions, where infiltration capacity tends to decrease as the soil profile becomes progressively wetted. The magnitude and rate of this decline depend on soil texture, layering, initial soil moisture, and hydraulic conditions. [28] demonstrated experimentally that soil texture and layering can substantially influence infiltration rate and the performance of infiltration models.
The difference between the two schemes should also be considered in relation to their contrasting soil physical conditions. Kagitumba had a relatively high sand content and lower bulk density, whereas Nasho GFI had higher bulk density and a greater proportion of finer particles at depth. Recent research on soils with different bulk-density profiles demonstrated that variation in bulk density with depth can influence infiltration rate and wetting-front development, although the magnitude of the effect depends on soil texture and the distribution of density within the profile [29]. This supports the interpretation that infiltration at the two schemes reflects the combined influence of soil physical conditions rather than a single soil property. The relatively higher infiltration rate at Nasho GFI despite its greater bulk density also demonstrates that bulk density alone cannot explain the observed infiltration differences. Soil texture and structural characteristics may modify the relationship between density and water movement. In particular, recent work in sub-Saharan Africa showed that sand content and soil organic carbon were important predictors of saturated hydraulic conductivity, while soil structure contributed substantially to variation that could not be explained by texture alone [30].
The statistical analysis further indicated that the factors associated with infiltration differed between the two schemes. At Kagitumba, none of the measured irrigation-water or soil variables was significantly associated with infiltration rate (p > 0.05). Water EC showed a weak negative association with infiltration (ρ = −0.086, p = 0.719), while turbidity also showed a weak negative association (ρ = −0.149, p = 0.531). Water pH (ρ = −0.365, p = 0.113), ORP (ρ = 0.089, p = 0.710), DO (ρ = −0.115, p = 0.629), soil pH (ρ = −0.347, p = 0.133), soil N (ρ = 0.080, p = 0.738), soil EC (ρ = −0.090, p = 0.705), organic matter (ρ = 0.229, p = 0.332), and bulk density (ρ = −0.090, p = 0.705) were also not significantly associated with infiltration. Therefore, the available data do not provide statistical evidence that any of the measured water-quality or soil variables explained the observed variation in infiltration at Kagitumba.
At Nasho GFI, infiltration showed significant negative associations with water pH (ρ = −0.464, p = 0.039) and turbidity (ρ = −0.493, p = 0.027). These relationships should be interpreted as statistical associations rather than causal effects because the study was observational and did not experimentally manipulate water pH or turbidity. Water EC was not significantly associated with infiltration (ρ = 0.218, p = 0.356), and ORP also showed no significant association with infiltration (ρ = 0.011, p = 0.965). The remaining measured soil variables were not significantly associated with infiltration at Nasho GFI (p > 0.05). The significant negative association between turbidity and infiltration at Nasho GFI suggests that locations receiving water with higher turbidity tended to have lower steady-state infiltration rates within that scheme. However, this association should not be interpreted as evidence that turbidity directly caused the lower infiltration rate. Turbidity may reflect suspended material and other site-specific water characteristics, while infiltration is simultaneously influenced by soil texture, structure, bulk density, surface conditions, antecedent moisture, and hydraulic properties. Further experimental investigation would therefore be required to establish a causal relationship.
The results also indicate that differences in water quality alone do not fully explain the difference in infiltration between the two schemes. For example, water EC was not significantly associated with infiltration at either scheme, despite the similar mean EC values between Kagitumba and Nasho GFI. Similarly, the statistical relationships involving turbidity differed between schemes. These findings support the interpretation that the observed infiltration difference is likely related to the combined effects of soil physical conditions and other site-specific hydraulic factors rather than to a single measured water-quality parameter.
Overall, the findings demonstrate that infiltration dynamics differed between Kagitumba and Nasho GFI, with Nasho GFI exhibiting a higher steady-state infiltration rate. The Horton model described the scheme-level temporal decline in infiltration, while the location-specific measurements provided evidence of spatial variability within each scheme. The absence of significant infiltration relationships with the measured variables at Kagitumba and the significant associations with water pH and turbidity at Nasho GFI indicate that infiltration responses were scheme-specific. Consequently, irrigation-management decisions should consider the combined soil and water characteristics of individual schemes rather than assuming that a single water-quality parameter can explain infiltration behavior across different irrigation environments.
4.3. Irrigation Water Quality
The comparative assessment showed that irrigation water at both Kagitumba and Nasho GFI had relatively low electrical conductivity and near-neutral to slightly alkaline pH. Mean pH values were 7.03 at Kagitumba and 7.35 at Nasho GFI, while mean electrical conductivity was approximately 0.319 and 0.325 dS m−1, respectively. These values indicate relatively low salinity under the conditions assessed. Recent irrigation-water quality research emphasizes, however, that water suitability should be evaluated in relation to soil texture, rainfall, crop salt tolerance, and the ionic composition of the water rather than by EC alone [31,32]. In particular, EC provides an indication of the total ionic concentration but does not characterize the potential sodicity or permeability hazard associated with the relative concentrations of sodium, calcium, magnesium, and potassium [33,34]. The low EC values observed in the present study therefore suggest limited salinity risk, but they should not be interpreted as evidence that the water is free from all potential soil-structural constraints. Recent studies have demonstrated that the response of soil hydraulic properties to irrigation-water chemistry varies with soil type and the chemical composition of the applied water. for example, found that irrigation-water quality can influence soil salinity, sodicity, and hydraulic conductivity, with the magnitude and direction of the response depending on soil texture. Similarly, [35] showed that assessment based on EC alone may not adequately describe the effects of irrigation-water chemistry on soil structural stability and infiltration. These findings are particularly relevant to the present study because both schemes have sandy-loam soils but exhibited different infiltration rates.
Turbidity was higher at Kagitumba (81.25 NTU) than at Nasho GFI (52.50 NTU), indicating a greater concentration of suspended material in the Kagitumba irrigation water. Suspended solids are relevant to irrigation-water management because water-quality assessment should consider not only dissolved salts but also physical and chemical characteristics that may affect soil and irrigation-system performance [32]. However, the relationship between turbidity and infiltration differed between the two schemes. At Kagitumba, turbidity was not significantly associated with infiltration rate (ρ = −0.149, p = 0.531). At Nasho GFI, turbidity showed a significant negative association with infiltration rate (ρ = −0.493, p = 0.027). This association should be interpreted cautiously because the study was observational and did not experimentally manipulate turbidity. In addition, turbidity may represent suspended material and other site-specific conditions rather than a direct causal control on infiltration. Therefore, the higher mean turbidity at Kagitumba cannot by itself explain the higher or lower infiltration behavior observed between the schemes. The results instead indicate that the relationship between water-quality characteristics and infiltration may vary according to local soil and hydraulic conditions [35,36].
Dissolved oxygen concentrations were 18.83 mg L−1 at Kagitumba and 21.40 mg L−1 at Nasho GFI, while ORP values were −61.5 and −71.5 mV, respectively. These measurements indicate differences in the redox characteristics of the irrigation water between the two schemes. However, because microbial activity, oxygen consumption, and specific redox-sensitive biochemical processes were not directly measured, the observed DO and ORP values should not be interpreted as direct evidence of differences in microbial activity or nutrient transformations. At Nasho GFI, ORP was not significantly associated with infiltration rate (ρ = 0.011, p = 0.965), while DO also showed no significant association with infiltration (ρ = −0.243, p = 0.302). More broadly, recent irrigation-water quality reviews recommend interpreting individual water-quality parameters within an integrated assessment of chemical composition, soil properties, crop requirements, and irrigation conditions rather than treating individual measurements as independent indicators of overall suitability [31].
Overall, the irrigation water at both schemes showed relatively low EC and pH values within a range generally compatible with agricultural irrigation, while Kagitumba had higher turbidity than Nasho GFI. However, the absence of measurements for sodium, calcium, magnesium, bicarbonate, SAR, or related permeability indices limits the extent to which potential sodicity and soil-structural hazards can be evaluated. Future assessments in these schemes should therefore incorporate these parameters to provide a more comprehensive evaluation of irrigation-water quality and its potential relationship with soil hydraulic behavior [34].
Spearman correlation analysis revealed scheme-specific associations between irrigation-water quality and soil properties. At Kagitumba, water electrical conductivity was positively associated with soil pH (ρ = 0.524, p = 0.018) and soil EC (ρ = 0.515, p = 0.020), while water pH was negatively associated with ORP (ρ = −0.490, p = 0.028). Soil nitrogen was positively associated with soil EC (ρ = 0.492, p = 0.028) and negatively associated with bulk density (ρ = −0.522, p = 0.018). None of the measured water-quality or soil variables was significantly associated with infiltration rate at Kagitumba. At Nasho GFI, water EC was positively associated with soil pH (ρ = 0.472, p = 0.036) and soil EC (ρ = 0.513, p = 0.021), while water pH was positively associated with soil organic matter (ρ = 0.629, p = 0.003). Turbidity was negatively associated with dissolved oxygen (ρ = −0.657, p = 0.002), while soil pH was positively associated with soil EC (ρ = 0.561, p = 0.010) and organic matter (ρ = 0.595, p = 0.006). Soil nitrogen was negatively associated with bulk density (ρ = −0.493, p = 0.027). With respect to infiltration, water pH (ρ = −0.464, p = 0.039) and turbidity (ρ = −0.493, p = 0.027) showed significant negative associations. In contrast, water EC was not significantly associated with infiltration (ρ = 0.218, p = 0.356), and ORP was also not significantly associated with infiltration (ρ = 0.011, p = 0.965). These findings indicate that the relationships among water quality, soil properties, and infiltration differed between the two schemes and should therefore be interpreted in relation to the specific physical and hydraulic conditions of each scheme.
The paired-samples t-test further confirmed significant depth-related differences in soil properties. At Kagitumba, significant differences were observed for bulk density, sand, silt, field capacity, permanent wilting point, available water, pH, phosphorus, EC, organic matter, and organic carbon, while clay and nitrogen did not differ significantly between depths. At Nasho GFI, all measured soil properties differed significantly between the two depths. The decrease in sand and corresponding increase in silt and clay at depth at Nasho GFI were accompanied by higher field capacity and permanent wilting point, while available water also increased slightly. These results demonstrate substantial vertical variability in soil properties within the irrigation schemes. Consequently, irrigation and soil-management practices should consider depth-specific soil characteristics rather than treating the soil profile as homogeneous.
5. Conclusion
This study demonstrated that Kagitumba and Nasho GFI had relatively low irrigation-water EC and near-neutral to slightly alkaline pH, although Kagitumba had higher turbidity. The soils showed substantial vertical variability between the 0–30 cm and 30–60 cm layers, indicating the importance of depth-specific soil characterization for irrigation management. Infiltration behavior differed between the two schemes, with steady-state infiltration rates of approximately 0.8 cm h−1 at Kagitumba and 1.2 cm h−1 at Nasho GFI. No significant association between infiltration and the measured water-quality or soil variables was observed at Kagitumba. At Nasho GFI, infiltration was significantly and negatively associated with water pH and turbidity, while EC and ORP were not significantly associated with infiltration. These findings indicate that infiltration behavior cannot be explained by a single water-quality parameter and is likely influenced by interacting site-specific soil and hydraulic conditions. The findings support a site-specific approach to irrigation and soil management that integrates water quality, depth-resolved soil properties, and infiltration behavior. Future studies should include major dissolved ions, particularly Na+, Ca2+, Mg2+, and HCO3−, together with SAR and related permeability indicators, as well as longer-term and spatially expanded monitoring to better explain the mechanisms controlling soil hydraulic responses.
Author Contributions
Sonia Ikundabayo: Conceptualization; Methodology; Data curation; Writing – original draft. Jean de Dieu Bazimenyera: Formal analysis; Validation; Supervision; Writing – review & editing. Romuald Bagaragaza: Methodology; Data analysis; Validation; Writing – review & editing.
Funding
This research was financially supported by the INTERVENE Fellowship Programme, implemented by the International Institute for Applied Systems Analysis (IIASA) in collaboration with the Lake Victoria Basin Commission (LVBC).
Data Availability Statement
All data supporting the findings of this study are included within the article. Additional data related to soil and irrigation water quality in Kagitumba and the Nasho GFI Irrigation Scheme are available from the corresponding author upon reasonable request.
Acknowledgments
The authors sincerely acknowledge the management and farming communities of Kagitumba Irrigation Scheme for their cooperation and support during field data collection. The authors also thank the Department of Civil, Environmental and Geomatics Engineering, University of Rwanda, for providing laboratory facilities and technical assistance. Appreciation is extended to the laboratory technicians and field assistants for their valuable contributions to sample collection and laboratory analysis.
Conflicts of Interest
The authors declare no conflicts of interest.
Abbreviations
The following abbreviations are used in this manuscript:
| EC | Electric Conductivity |
| pH | Potential of Hydrogen |
| DO | Dissolved Oxygen |
| EDPRS | Economic Development and Poverty Reduction Strategy |
| Nasho-GFI | Nasho Government-Funded Irrigation |
| FAO | Food and Agriculture Organization |
| ORP | Oxidation Reduction Potential |
| IWM | Integrated Water Management |
References
- Xing, Y.; Wang, X.; Mustafa, A. Exploring the link between soil health and crop productivity. Ecotoxicol. Environ. Saf. 2025, vol. 289, 117703. [Google Scholar] [CrossRef]
- Védère, C.; et al. How does soil water status influence the fate of soil organic matter? A review of processes across scales. Earth. Sci. Rev. 2022, vol. 234, 104214. [Google Scholar] [CrossRef]
- Delgado; Gómez, J. A. The Soil: Physical, Chemical, and Biological Properties. Princ. Agron. Sustain. Agric. Second Ed. 2024, 15–30. [Google Scholar] [CrossRef]
- Fadl, M. E.; et al. Irrigation Practices and Their Effects on Soil Quality and Soil Characteristics in Arid Lands: A Comprehensive Geomatic Analysis. Soil Syst. 2024 2024, Vol. 8, Page 52, vol. 8(no. 2). [Google Scholar] [CrossRef]
- Hopmans, J. W.; et al. Critical knowledge gaps and research priorities in global soil salinity. Adv. Agron. 2021, vol. 169, 1–191. [Google Scholar] [CrossRef]
- Rengasamy, P. Irrigation Water Quality and Soil Structural Stability: A Perspective with Some New Insights. Agronomy 2018, Vol. 8, Page 72, vol. 8(no. 5). [Google Scholar] [CrossRef]
- Tuyisabe, J. B.; Silungwe, F. R.; Mahoo, H. F. Assessment of Physical Status of The Irrigation Structures in Nyarubogo Irrigation Scheme, Rwanda. Afr. J. Empir. Res. 2024, vol. 5(no. 4), 1561–1575. [Google Scholar] [CrossRef]
- McDermid, S.; et al. Irrigation in the Earth system. Nat. Rev. Earth Environ. 2023 2023, 4:7, vol. 4(no. 7), 435–453. [Google Scholar] [CrossRef]
- Baghel, S.; Tripathi, M. P. Crop Selection and Management Strategies for Poor Quality Irrigation Water; 2025; pp. 261–279. [Google Scholar] [CrossRef]
- Haokip, C.; et al. Effects of Poor Irrigation Water Quality on Soil Fertility and Its Mitigation; 2025; pp. 209–233. [Google Scholar] [CrossRef]
- Mabhaudhi, T.; Dirwai, T. L.; Taguta, C.; Kanda, E. K.; Nhamo, L.; Cofie, O. Irrigation development and agricultural water management in Rwanda: a systematic review. Enhancing Water and Food Security Through Improved Agricultural Water Productivity 2025, 361–384. [Google Scholar] [CrossRef]
- KAMANDA, K. AGRICULTURAL TRANSFORMATION FOR CLIMATE RESILIENCE: A REVIEW OF STRATEGIES, CHALLENGES, AND FUTURE DIRECTIONS IN SUB-SAHARAN AFRICA. 2025, vol. 07(no. 01). [Google Scholar] [CrossRef]
- Kameswaran, S.; Ramesh, B. Emerging Contaminants from Pesticide, Bio Solids, and Manure in Agricultural Food Production: Health and Environment Implications. Emerg. Contam. Food Food Prod. 2024, 106–123. [Google Scholar] [CrossRef]
- Enhancing Food Security In Rwanda: Leveraging Economic Models And Historical Data For Strategic Agricultural Policy Development BACKGROUND OF THE STUDY; 2024.
- RAB. Rwanda irrigation master plan. Rwanda Irrig. Master Plan 2020, no. March, 240+xii. [Google Scholar]
- MINAGRI; Republic of Rwanda Ministry of Agriculture and Animal Resources. Minagri Annual Report 2019-2020; 2020; pp. 1–100.
- Pasgaard, M.; Kim, S. K.; Dawson, N.; Fold, N. Agrarian modernization through ‘ideal agricultural subjects’: a lost cause for smallholders in Rwanda? J. Polit. Ecol. 2022, vol. 29(no. 1), 100–122. [Google Scholar] [CrossRef]
- Mozaffari, H.; Moosavi, A. A.; Baghernejad, M.; Cornelis, W. Revisiting soil texture analysis: Introducing a rapid single-reading hydrometer approach. Measurement 2024, vol. 228, 114330. [Google Scholar] [CrossRef]
- Blake, G. R.; Hartge, K. H. Bulk density. In Methods of Soil Analysis, Part 1: Physical and Mineralogical Methods; STRING:BOOK: CTYPE, Sep 2018; pp. 363–375. [Google Scholar] [CrossRef]
- Bremner, M. Total Nitrogen. Methods Soil Anal. Part 2 Chem. Microbiol. Prop. 2016, 1149–1178. [Google Scholar] [CrossRef]
- Murphy, J.; Riley, J. P. A modified single solution method for the determination of phosphate in natural waters. Anal. Chim. Acta 1962, vol. 27, no. C, 31–36. [Google Scholar] [CrossRef]
- Ketena, S.; Gebresenbet, G.; Kolhe, K. P.; Dananto, M.; Seifu, Y.; Mathwos, M. Impacts of soil physical and mechanical behaviors under different tillage depths for agrotechnical operation in Bukito, Sidama, Ethiopia. Sci. Rep. 2025, 2025 15:1, vol. 15(no. 1), 19951. [Google Scholar] [CrossRef]
- Nsengiyumva, J. Nepo.; et al. Geospatial analysis of soil hydraulic properties in the ETI Mpanga irrigation scheme of Rwanda. Discov. Soil 2025, 2025 2:1, vol. 2(no. 1), 86. [Google Scholar] [CrossRef]
- Wang, H. S.; Wang, L. K. Waste Stabilization Pond Fundamentals and Innovations. Ind. Water Waste Treat. Fundam. 2025, 231–272. [Google Scholar] [CrossRef]
- Kosari, B.; Mahmoodlu, M. G.; Jandaghi, N.; Farasti, M. Effect of Soil Textural Characteristics on Soil Water Retention Curve. Eurasian Soil Sci. 2026, 2026 59:5, vol. 59(no. 5), 83. [Google Scholar] [CrossRef]
- Skadell, E.; Dettmann, U.; Guggenberger, G.; Don, A. Effects of Agricultural Management on Water Retention via Changes in Organic Carbon in Topsoil and Subsoil. In Journal of Plant Nutrition and Soil Science; STRING:PUBLICATION: WGROUP, Dec 2025; vol. 188, no. 6, pp. 949–963. [Google Scholar] [CrossRef]
- Oyekunle, S. D. EVALUATION OF THE POTENTIAL OF PHOSPHOGYPSUM FOR IMPROVING SOIL STRUCTURE & CROP YIELD. 2026. [Google Scholar]
- Roy, G.; Sivakumar, B. Impact of Surface Soil Texture on the Temporal Dynamics and Spatial Dispersion of Pyrite Oxidation Products in Unsaturated Mine Overburden Dumps. In Environmental Modeling & Assessment 2026; Jul 2026; pp. 1–21. [Google Scholar] [CrossRef]
- Umair, et al. Soil Physical Properties and Their Influence on Plant Growth; 2025; pp. 79–131. [Google Scholar] [CrossRef]
- Vieira, C. B.; et al. Saturated Hydraulic Conductivity of Nine Soils According to Water Quality, Soil Texture, and Clay Mineralogy. Agronomy 2025, vol. 15(no. 4), 864. [Google Scholar] [CrossRef]
- Minhas, S.; Qadir, M. Irrigation Sustainability with Saline and Alkali Waters: Extent, Impacts and Management Guidelines. Irrigation Sustainability with Saline and Alkali Waters: Extent, Impacts and Management Guidelines 2025, 1–304. [Google Scholar] [CrossRef]
- Vranešević, M.; Meseldžija, M.; Grabić, J.; Zemunac, R.; Boukalova, Z. Irrigation water quality in a framework of sustainable development goal 6: a review of challenges impacts policy alignments. Front. Agron. 2025, vol. 7, 1580338. [Google Scholar] [CrossRef]
- Qadir, M.; Sposito, G.; Smith, C. J.; Oster, J. D. Reassessing irrigation water quality guidelines for sodicity hazard. Agric. Water Manag. 2021, vol. 255, 107054. [Google Scholar] [CrossRef]
- Dagar, J. C.; Kumar, J.; Yadav, G. SPECIAL ISSUE on Restoring Salt-affected Ecologies in Changing Climate SPECIAL ISSUE on Restoring Salt-affected Ecologies in Changing Climate in commemoration of Global Soils Conference 2024 in commemoration of Global Soils Conference. 2024. [Google Scholar]
- Wang, Z.; Zhang, B.; Li, J.; Lian, S.; Zhang, J.; Shi, S. Effects of Deficit-Regulated Irrigation on Root-Growth Dynamics and Water-Use Efficiency of Winter Wheat in a Semi-Arid Area. Water 2024 2024, Vol. 16, Page 2678, vol. 16(no. 18), 2678. [Google Scholar] [CrossRef]
- Yan, Y.; et al. Evolution of chemical characteristics and irrigation suitability of groundwater in arid and semi-arid regions. Agric. Water Manag. 2025, vol. 311, 109361. [Google Scholar] [CrossRef]
Table 1.
Physical and Chemical Properties of Soil in Selected Maize Fields at Kagitumba Irrigation Scheme.
Table 1.
Physical and Chemical Properties of Soil in Selected Maize Fields at Kagitumba Irrigation Scheme.
| Parameters | Units | Value | Value |
| Soil depth | Cm | 30.0 | 60.0 |
| Bulk density | g/cm3 | 0.751 | 0.896 |
| Sand | % | 60.8 | 60.0 |
| Silt | % | 25.5 | 20.5 |
| Clay | % | 13.7 | 13.7 |
| FC | % | 16.9 | 18 |
| PWP | % | 8.3 | 9 |
| Available water | % | 8.6 | 8 |
| PH | 6.37 | 6.6 | |
| N | % | 0.1 | 0.1 |
| P | % | 0.02 | 0.18 |
| EC | dS/m | 0.197 | 0.262 |
| Organic matter | % | 2.7 | 3.6 |
| Organic carbon | % | 1.6 | 2 |
Table 2.
Physical and Chemical Properties of Soil in Selected Maize Fields at Nasho Government Irrigation Scheme.
Table 2.
Physical and Chemical Properties of Soil in Selected Maize Fields at Nasho Government Irrigation Scheme.
| Parameters | Units | Value | Value |
| Soil depth | Cm | 30.0 | 60.0 |
| Bulk density | g/cm3 | 1.31 | 1.33 |
| Sand | % | 67.56 | 57.33 |
| Silt | % | 22.44 | 30 |
| Clay | % | 10 | 12.67 |
| FC | % | 15.8 | 18 |
| PWP | % | 6.5 | 8 |
| Available water | % | 9.3 | 10 |
| PH | 7.3 | 7.8 | |
| N | % | 0.095 | 0.1 |
| P | % | 0.02 | 0.017 |
| EC | dS/m | 0.1876 | 0.1968 |
| Organic matter | % | 2 | 2.5 |
| Organic carbon | % | 1.16 | 1.5 |
Table 3.
Mean infiltration-time data obtained by averaging measurements from 20 locations in the Kagitumba irrigation scheme.
Table 3.
Mean infiltration-time data obtained by averaging measurements from 20 locations in the Kagitumba irrigation scheme.
| Run time (min) | Time Interval (min) | Infiltration Depth (mm) | Cumulative Infiltration Depth (mm) | Infiltration rate(cm/hr) |
| 0.0 | 0.0 | 0.0 | 0.0 | 0.0 |
| 5.0 | 5.0 | 10.0 | 10.0 | 12.0 |
| 10.0 | 5.0 | 8.0 | 18.0 | 9.6 |
| 15.0 | 5.0 | 6.0 | 24.0 | 7.2 |
| 20.0 | 5.0 | 4.0 | 28.0 | 4.8 |
| 30.0 | 10.0 | 3.0 | 31.0 | 1.8 |
| 40.0 | 10.0 | 3.0 | 34.0 | 1.8 |
| 50.0 | 10.0 | 3.0 | 37.0 | 1.8 |
| 60.0 | 10.0 | 3.0 | 40.0 | 1.8 |
| 80.0 | 20.0 | 3.0 | 43.0 | 0.9 |
| 100.0 | 20.0 | 3.0 | 46.0 | 0.9 |
| 130.0 | 30.0 | 4.0 | 50.0 | 0.8 |
| 160.0 | 30.0 | 4.0 | 54.0 | 0.8 |
Table 4.
Mean infiltration-time data obtained by averaging measurements from 20 locations in the Nasho GFI scheme.
Table 4.
Mean infiltration-time data obtained by averaging measurements from 20 locations in the Nasho GFI scheme.
| Run time (min) | Time Interval (min) | Infiltration Depth (mm) | Cumulative Infiltration Depth (mm) | Infiltration rate(cm/hr) |
| 0.0 | 0.0 | 0.0 | 0.0 | 0.0 |
| 5.0 | 5.0 | 21.0 | 21.0 | 25.2 |
| 10.0 | 5.0 | 18.0 | 39.0 | 18.60 |
| 15.0 | 5.0 | 15.5 | 54.5 | 15.60 |
| 20.0 | 5.0 | 13 | 67.5 | 6.00 |
| 30.0 | 10.0 | 10 | 77.5 | 4.80 |
| 40.0 | 10.0 | 8.0 | 85.5 | 4.80 |
| 50.0 | 10.0 | 6.0 | 91.5 | 3.60 |
| 60.0 | 10.0 | 6.0 | 97.5 | 3.60 |
| 80.0 | 20.0 | 6.0 | 103.5 | 1.80 |
| 100.0 | 20.0 | 6.0 | 109.5 | 1.80 |
| 130.0 | 30.0 | 6.0 | 115.5 | 1.20 |
| 160.0 | 30.0 | 6.0 | 121.5 | 1.20 |
Table 5.
Water quality at Kagitumba irrigation scheme.
| Parameter | Mean Value | Units | Interpretation (FAO/Water Quality Standards) |
| pH | 7.03 | – | Within acceptable range for irrigation (6–8.4) |
| EC | 319 | µS/cm | 0.319 dS/m is Excellent water for irrigation (<0.7 dS/m) |
| ORP | -61.5 | mV | Slightly reducing environment; generally safe, monitor for anaerobic conditions. |
| DO | 18.83 | mg/L | High dissolved oxygen (good for aerobic processes) |
| Turbidity | 81.25 | NTU | High turbidity (may clog the irrigation system, needs filtration) |
Table 6.
Water quality at the Nasho Government Fund irrigation scheme.
| Parameter | Mean Value | Units | Interpretation (FAO/Water Quality Standards) |
| pH | 7.35 | – | Within acceptable range for irrigation (6–8.4) |
| EC | 324 | µS/cm | 0.324 dS/m is Excellent water for irrigation (<0.7 dS/m) |
| ORP | -71.5 | mV | Slightly reducing environment; generally safe, monitor for anaerobic conditions. |
| DO | 21.4 | mg/L | High dissolved oxygen (good for aerobic processes) |
| Turbidity. | 52.5 | NTU | High turbidity (may clog the irrigation system, needs filtration) |
Disclaimer/Publisher’s Note: The statements, opinions and data contained in all publications are solely those of the individual author(s) and contributor(s) and not of MDPI and/or the editor(s). MDPI and/or the editor(s) disclaim responsibility for any injury to people or property resulting from any ideas, methods, instructions or products referred to in the content. |
© 2026 by the authors. Licensee MDPI, Basel, Switzerland. This article is an open access article distributed under the terms and conditions of the Creative Commons Attribution (CC BY) license.
Copyright: This open access article is published under a Creative Commons CC BY 4.0 license, which permit the free download, distribution, and reuse, provided that the author and preprint are cited in any reuse.