

Submitted:
08 May 2026
Posted:
11 May 2026
You are already at the latest version
Abstract
This article describes the development of a compact and affordable variable temperature NMRinstrument designed primarily to measure dynamic molecular motions in solids and liquids. The instrument consists of Lab-Tools’ Mk4 palm-top time-domain NMR spectrometer fitted with a Peltier-cooled variable temperature probe inside a shimmed Halbach magnet. Measurement of NMR relaxation times T1, T2, T1ρ are possible over the temperature range −20◦C to 70◦C with cooling and heating rates, and data acquisition controlled from an integrated mini-PC. The overall footprint of the instrument is roughly that of a shoe box making both in-the-field and bench-top measurements possible. Applications of this instrument include measuring the pore size distribution in porous rocks, the viscosity of oils and tars trapped in porous rock, the properties of polymers, and the viscosity of the liquid components of foods (e.g. fruits, vegetables and seeds). Results of test measurements on calibrated oils and olive oil are presented together with measurements of the molecular mobility in a sold polymer.
Keywords:
mobile NMR
; materials science
; foodstuff
; oil properties
; porous rock
; seeds
; NMR relaxation
; time-domain NMR
; TD NMR
1. Introduction
Time-domain NMR (TD-NMR) provides direct information on the physical motion in samples, allowing properties such as mobility within the sample, dynamics, viscosity and rigidity to be probed [1,2,3,4,5,6,7,8,9,10,11,12,13].
A simple explanation of this sensitivity to motion in a sample is that the magnetic field experienced by a nucleus is modified by the magnetic moments of adjacent nuclei, changing the rate at which it precesses. In a rigid sample, this perturbation of the external field has a long time to act, and causes the different nuclei in the sample to precess at different rates and rapidly fall out of step with one another. This results in a net rotating magnetic field that decays quickly, possibly on the order of tens of s. In a sample with a significant degree of molecular motion, for example at higher temperatures, the perturbations to the fixed external field start averaging out over an NMR rotational period. This is known as “Motional Narrowing” and results in a longer T2 decay time, extending up to seconds [1].
Many of the NMR material science measurements that make use of the effect described above become significantly more informative if carried out as a function of temperature. In particular, the temperature dependence of the spin-lattice (T1) and spin-lock (T1) relaxation times reveals characteristic minima that correspond to specific correlation times of molecular motion. Concurrently, the spin-spin (T2) relaxation time provides a probe of bulk mobility, eventually reaching a rigid-lattice limit (or ’floor’) at low temperatures as stochastic motions are frozen out. Collectively, these parameters offer a comprehensive mapping of the motional dynamics within the sample [1].
Furthermore, NMR cryoporometry (NMRC), the theory of which is discussed elsewhere [10,14,15,16,17], is a powerful variable-temperature technique for the measurement of pore-size distributions in the range 1 to 1 , and total porosities. NMRC uses the isobaric (constant pressure) variant of the Gibbs equation, the Gibbs-Thomson equation, which describes the melting point depression of liquids confined in pores [14]. Pore-size distributions can also be measured by BET (Brunauer–Emmett–Teller) gas adsorption experiments which use the isothermal variant of the Gibbs equation, the Kelvin equation. A key advantage of NMRC is its applicability to ’wet’ or hydrated systems, such as wet clays, where vacuum-based gas adsorption methods fail.
Here we discuss the development of a compact and affordable bench-top variable temperature TD-NMR instrument designed primarily to measure dynamic molecular motions in solids and liquids. We have recently demonstrated that measurements of T1 can be used to determine the viscosity of liquid components in-situ [18]. Here we present variable temperature measurements on the dynamics of a solid polymer, and apply the viscosity measurements to two liquid oils of significantly different viscosities.
2. Materials and Methods
2.1. Instrumentation
The instrument, shown in Figure 1, consists of a Lab-Tools MK4 NMR spectrometer, a thermo-electrically cooled variable-temperature probe, and a shimmed Halbach magnet. The NMR spectrometer and data acquisition are controlled via a short USB cable by a GMKtec mini-PC NucBox G5 running Windows 11. The thermo-electrically cooling is powered by a M5Stack programmable power supply which is controlled by an ESP32 microcontroller that, in turn, receives commands from the mini-PC. An H-bridge allows the direction of the current to be reversed so that the sample can be heated as well as cooled. Temperature is monitored by a T-type (Cu/Co) thermocouple. The programmable power-supply, microcontroller, H-bridge, and thermocouple amplifier are all housed in a single control box. As can be seen in Figure 1, the NMR spectrometer, mini-PC, variable-temperature probe, and temperature control box all slot into recesses in a 3D printed base. This ensures that the whole system has a compact foot-print and keeps all the components in their respective positions during transportation.
2.1.1. MK4 0–50 Palm-Top NMR Spectrometer
Lab-Tools MK4 NMR Spectrometer is a compact low-cost palm-top instrument [19]. It is primarily a time-domain NMR relaxation spectrometer with digital radio-frequency (RF) processing. Paired with Halbach magnet, the 1H frequency is about 21 . Figure 2 illustrates the compact size of MK4 spectrometer together with an NMR probe and a Halbach magnet.
2.1.2. Variable Temperature Probe
Thermo-electric cooling and heating are achieved by passing a current through a dual-layer 40 x 40 Peltier element in contact with a copper plate that is part of the cold-finger leading to the NMR sample. A thermocouple sensor is mounted on the cold-finger close to the sample to monitor the sample temperature. Waste heat from the Peltier element is removed by a 90 x 89 CPU cooler with a thermal power design (TDP) of 155 . Temperature control is afforded by a proportional–integral–derivative controller (PID) varying the current through the Peltier element. Using this approach sample temperatures from -20 °C–70 °C can be attained.
Samples in 5 NMR tubes insert into TX and RX coils situated in the brass can attached to the cold-finger. By adjusting the variable capacitor on the MK4 spectrometer the probe has a tuning frequency range of 20.4–21.2 allowing both 1H and 19F nuclei to be routinely studied. By adding an internal capacitor of the correct size to the spectrometer 7Li, 23Na, 11B, 31P become accessible.
2.1.3. Temperature Control Box
The temperature of the variable temperature probe is controlled by an ESP32 microcontroller (MCU). This MCU monitors the sample temperature via a T-type thermocouple in combination with a single IC that amplifies the signal and converts the readings to serial data. This IC has a temperature resolution of less than °C and an error of ±0.3%. The MCU receives the desired target temperature from the mini-PC and uses a PID to determine how much current to pass through the Peltier element to reach this set-point. The M5Stack programmable power supply (PPS) receives commands from the MCU and supplies current to the Peltier accordingly. An H-bridge, again controlled by the MCU, allows the direction of the current through the Peltier element to be reversed, providing cooling or heating of the sample as required.
The fan of the CPU cooler helps to remove waste heat. The speed of this fan is controlled from the mini-PC via the MCU and can be varied from 0 - 6000 RPM in 255 increments.
The MCU, PPS, thermocouple IC and H-bridge are all housed in a custom 3D printed box measuring 110 x 70 x 70 . Panel and PCB mounted sockets allow this boxed to be readily unplugged from the other components if required. This control box is also fitted with an 0.42" OLED display which shows the PPS output voltage and current.
2.1.4. Instrument Control and Use
The MK4 NMR spectrometer is controlled by the mini-PC and operated via a GUI [22]. This GUI allows parameters such as NMR Pulse Sequence, and /2 pulse widths, pulse separation and number of repetitions to be set. An example GUI configuration is shown in Figure 3.
Beyond setting the parameters for data acquisition, the GUI allows users to average, plot and process data [22]. An example of the latter would be the single-component fitting of a Free Induction Decay (FID) with a polynomial, exponential or Gaussian function to determine T2.
As well as displaying data, instrument status and acquisition parameters on a monitor attached to the mini-PC, the instrument is also fitted with a 7" IPS-LCD screen to display data from any measurements currently in progress. The presence of this IPS-LCD screen and the OLED display on the temperature control box are particularly useful to for checking the status of the instrument if it is being operated remotely over the internet and for trouble-shooting.
2.2. Performance Testing and Example Data Acquisition
2.2.1. Measuring T2 to Determine the Phase Composition of Nylon 66
The T2 NMR relaxation times of a solid Nylon 66 sample were measured over the temperature range +10 °C–+70 °C, at about 5 °C intervals, in order to follow the evolution of the phase composition with temperature [23].
For the solid Nylon 66 sample capturing the full signal decay required a Carr-Purcell-Meiboom-Gill (CPMG) NMR pulse sequence over 4 ms, with a Tau setting of 25 , resulting in a 50 echo spacing. An averaged trace for the fitted echo peaks for a sample at about °C can be seen in Figure 4 (dots). Fitting this trace with exponentials using the MK4 buit-in two-component fitting routine gave a reasonable fit, but neither signal-to-noise or fitting precision explained the fit imperfections. Thus a three-component off-line routine was evaluated; Figure 4 shows the automatically selected optimum fit of two short Gaussians and one longer exponential. This three component fit was very stable, and will be incorporated as a built-in fitting routine in the future.
2.2.2. Measuring T1 to Determine the Viscosity of Oils
Spin-lock relaxation times (T1) of 4 mineral oils of known viscosity (Brookfield Engineering) were measured at room temperature to verify that we could correctly determine their viscosities [18]. T1 relaxation times of one of these oils (Brookfield Engineering No. B1060) and a sample of Greek olive oil were then measured over the temperature +10 °C–+70 °C to monitor how their viscosities changed as they were heated.
To facilitate the measurement of T1 relaxation data with these rapidly decaying FID data, a 2D NMR routine was written, in the concise array language AplX. This consisted of a full amplitude 90 ° pulse, a reduced amplitude long spin-lock pulse, followed by a CPMG sequence. An example of a single trace capture can be seen in Figure 5. The initial amplitude of the FID following the long spin-lock pulse was determined using the polynomial fitted and algebraically solved CPMG echo peaks, extrapolated back to the end of the spin-lock pulse, as shown in Figure 6. The 2D routine implemented here provided a significant improvement to the precision and signal-to-noise ratio in these measurements.
3. Results and Discussion
3.1. Phase Composition of Nylon 66
The T2 NMR relaxation times of a solid Nylon 66 sample were measured over the temperature range +10 °C–+70 °C to determine the temperature dependence of the phase composition.
As mentioned in Section 2.2.1, it was necessary to use three-components to fit the trace shown in Figure 4. Litvinov and Penning [23] also used a three component fit in their NMR relaxation study of nylon fibres. Following a similar approach to that used in their work, we used the three distinct T2 relaxation times obtained from the fitting process to calculate the amounts of the various phase components present at each temperature, where the shortest, intermediate and longest T2 times correspond to rigid, semi-rigid and soft components, respectively [25]. The results of these calculations are plotted in Figure 8.
In accordance with previous studies [23,26], the latter using using DSC and X-ray techniques, the rigid, semi-rigid and soft components are assigned to a crystalline phase, a semi-rigid amorphous phase, and a soft amorphous phase, respectively. The results presented show an increase in rotational and translational chain mobility with temperature as the crystalline phase transitions toward more disordered states. This behaviour is facilitated by the short statistical segment of the Nylon 66 chain, approximately 6 backbone bonds [27], which allows for rapid relaxation of conformational constraints outside the crystal lattice. Consequently, the three-phase model provides an accurate description of the temperature-dependent phase composition in Nylon 66.
The results presented here demonstrate that variable-temperature NMR T2 relaxation analysis using our compact instrumentation is not only a valuable tool for determining the crystallinity of Nylon 66, but also provides a detailed description of the polymer’s structure, specifically the relative amounts and molecular mobility of the three distinct phases detected.
3.2. Viscosity of Oils
Table 1 shows the measured spin-lock T1 relaxation times and the viscosities calculated from these times [18] for four oils of known viscosity. The viscosities determined here from T1 relaxation using our variable-temperature instrument agree well with the known values, with all the experimental results within 8% of their expected values.
Once we had verified that we could measure viscosity to a satisfactory level of accuracy we proceeded with variable temperature measurements. Figure 9 shows the temperature dependence of the T1 relaxation times of Brookfield Oil No. B1060 and Greek olive oil. As expected, for both oils, T1 increases with temperature as the molecular mobility increases and the efficiency of the relaxation processes decrease.
Figure 10 shows the temperature dependence of the viscosity of Brookfield Oil No. B1060 and Greek olive oil calculated from the data presented in Figure 9. As expected, the viscosities of both oils decrease with temperature as the molecules have greater thermal energy and are more easily able to overcome the attractive intermolecular forces that pull them together. Figure 11 shows an Arrhenius plot of the viscosity-temperature data. The data points in Figure 11 were fitted with a modified Vogel–Fulcher–Tammann (VFT) equation which describes the temperature-dependent viscosity of oil-based systems [28]:
where is the viscosity limit at high temperature, D is the fragility and the Kauzman temperature [29].
The excellent fits to the data in Figure 11 confirm that the temperature-dependent viscosity of both oils is characteristic of complex organic liquids. The fitting process yielded Kauzmann temperatures of 199 ± 10 and 85 ± 15 for Brookfield Oil No. B1060 and Greek olive oil, respectively. Together with the corresponding fragility indices of 2.33 ± 0.5 and 25.2 ± 7.6, these Kauzmann temperatures highlight clear differences in the molecular mobility of the two liquids [29].
The viscosity data presented here demonstrate that our variable-temperature instrument is well suited to measuring the temperature dependence of liquid viscosity up to 70 °C. Furthermore, the instrument is capable of in-situ measurements within solid matrices, such as oils in porous rocks, and can resolve the individual viscosities of multi-component systems, such as the distinct oil and water phases in seeds.
3.3. Other Potential Applications
The cost-effective, compact, and user-friendly bench-top variable-temperature NMR system described here has numerous potential applications in food science, ranging from research and development to quality and process control throughout the supply chain. NMR relaxation is inherently quantitative and highly sensitive to differences in molecular mobility; consequently, the analysis of relaxation decays provides critical information on diffusion, exchange processes, and compartment sizes. Within this framework, bulk components such as water, lipids, and carbohydrates are readily detectable [30]
Furthermore, the instrument described here is sufficiently compact and has low enough power requirements to be truly transportable and well-suited for field studies [31]. Field applications of TD-NMR are diverse, ranging from quantifying oil-water ratios and liquid characteristics in porous rocks and sol-gel silicas [32], to determining the oil, water, and sugar content of agricultural seeds. Mobile TD-NMR has also proven effective in monitoring the aging of rubbers and polymers, as well as tracking environmental markers such as water purity in marshes, soil moisture, and ice deposition. It has even been successfully used to monitor the growth rates of intact plants.
4. Conclusions
This paper describes the development and application of a compact and affordable variable-temperature time-domain NMR instrument, designed primarily to measure dynamic molecular motions in solids and liquids, and thus the physical properties that depend on these.
Here it has been used to study a solid polymer, Nylon 66, to obtain the quantities of the three distinct phases present: crystalline, rigid amorphous, and soft amorphous, over the temperature range 10 °C–70 °C. This technique may also be used to study the aging of rubbers and polymers in service. Furthermore such measurement can be carried out in relatively inhomogeneous magnetic fields, reducing the cost of the magnet required.
We have also used the instrument to determine the viscosities of two liquids, again over the temperature range 10 °C–70 °C, by measuring T1. This instrument is specifically designed for studying the properties of food-stuffs, and the design temperature range is well suited to milk products such as yoghurts and the maturation of cheeses, particularly by NMR T1. Fruits and seeds may also be studied, as well as the viscosity of seed oils, by T1 [18].
Additional applications for this instrument are for measuring pore dimensions, based on the loss of proton spin magnetisation by contact with a pore-wall. This method works well for micron sized pores [6] and is often used for studying sandstone porosities.
While the current instrumentation is not suitable for the thermodynamic NMRC measurements of very small or large pore sizes, it is suitable to measure pores in the mesoporous range (10–100). This range is highly relevant for the characterization of many geological formations and reservoir rocks.
5. Patents
Webber, J.B.W. Nuclear Magnetic Resonance Probes. U.S. Patent 9,810,750 B2, 7th November 2017.
Author Contributions
Conceptualization, David Pickup and J. Beau W. Webber; Methodology, David Pickup and J. Beau W. Webber; Software, David Pickup and J. Beau W. Webber; Validation, David Pickup and J. Beau W. Webber; Investigation, David Pickup and J. Beau W. Webber; Resources, David Pickup and J. Beau W. Webber; Data curation, David Pickup and J. Beau W. Webber; Writing – original draft, David Pickup and J. Beau W. Webber; Writing – review and editing, David Pickup and J. Beau W. Webber; Visualization, David Pickup and J. Beau W. Webber; Supervision, J. Beau W. Webber; Project administration, J. Beau W. Webber; Funding acquisition, J. Beau W. Webber. All authors have read and agreed to the published version of the manuscript.
Funding
This research received no external funding.
Data Availability Statement
The original contributions presented in this study are included in the article. Further inquiries can be directed to the corresponding author(s).
Conflicts of Interest
The authors declare no conflicts of interest.
References
- Abragam, A. The Principles of Nuclear Magnetism; Clarendon Press: Oxford, 1961. [Google Scholar]
- Besghini, D.; Mauri, M.; Simonutti, R. Time Domain NMR in Polymer Science: From the Laboratory to the Industry. Appl. Sci. 2019, 9. [Google Scholar] [CrossRef]
- Vaca Chávez, F.; Saalwächter, K. Time-Domain NMR Observation of Entangled Polymer Dynamics: Universal Behavior of Flexible Homopolymers and Applicability of the Tube Model. Macromolecules 2011, 44, 1549–1559. [Google Scholar] [CrossRef]
- Todt, H.; Guthausen, G.; Burk, W.; Schmalbein, D.; Kamlowski, A. Water/moisture and fat analysis by time-domain NMR. Food Chem. 3rd Int. Workshop Water Foods 2006, 96, 436–440. [Google Scholar] [CrossRef]
- Brownstein, K.R.; Tarr, C.E. Importance of classical diffusion in NMR studies of water in biological cells. Phys. Rev. A 1979, 19, 2446–2453. [Google Scholar] [CrossRef]
- Gladden, L.F. Nuclear-Magnetic-Resonance Studies of Porous-Media. Chem. Eng. Res. Des. 1993, 71, 657–674. [Google Scholar]
- Callaghan, P.; Godefroy, S.; Ryland, B. Diffusion–relaxation correlation in simple pore structures. J. Magn. Reson. 2003, 162, 320–327. [Google Scholar] [CrossRef]
- Fantazzini, P.; Brown, R.J.S.; Borgia, G.C. Bone tissue and porous media: common features and differences studied by NMR relaxation. Magnetic Resonance Imaging Proceedings of the Sixth International Meeting on Recent Advances in MR Applications to Porous Media 2003, 21, 227–234. [Google Scholar] [CrossRef] [PubMed]
- Kimmich, R.; Fatkullin, N.; Mattea, C.; Fischer, E. Polymer chain dynamics under nanoscopic confinements. Magnetic Resonance Imaging Proceedings of the Seventh International Conference on Recent Advances in MR Applications to Porous Media 2005, 23, 191–196. [Google Scholar] [CrossRef] [PubMed]
- Hansen, E.W.; Fonnum, G.; Weng, E. Pore Morphology of Porous Polymer Particles Probed by NMR Relaxometry and NMR Cryoporometry. J. Phys. Chem. B 2005, 109, 24295–24303. [Google Scholar] [CrossRef] [PubMed]
- McDonald, P.J.; Mitchell, J.; Mulheron, M.; Aptaker, P.S.; Korb, J.P.; Monteilhet, L. Two-dimensional correlation relaxometry studies of cement pastes performed using a new one-sided NMR magnet. Cem. Concr. Res.;Cementitious Materials as model porous media: Nanostructure and Transport processes 2007, 37, 303–309. [Google Scholar] [CrossRef]
- D’Agostino, C.; Mitchell, J.; Mantle, M.D.; Gladden, L.F. Interpretation of NMR Relaxation as a Tool for Characterising the Adsorption Strength of Liquids inside Porous Materials. Chem. – A Eur. J. 2014, 20, 13009–13015. Available online: https://chemistry-europe.onlinelibrary.wiley.com/doi/pdf/10.1002/chem.201403139. [CrossRef]
- Webber, J.B.W. Biological, Medical and Nano Structured materials - NMR done Simply. Arch. Biomed. Eng. Biotechnol. (ABEB) Accessed. 2019, 1. (accessed on 2026-03-04). [Google Scholar] [CrossRef]
- Mitchell, J.; Webber, J.B.W.; Strange, J. Nuclear magnetic resonance cryoporometry. Phys. Rep. 2008, 461, 1–36. [Google Scholar] [CrossRef]
- Petrov, O.V.; Furó, I. NMR cryoporometry: Principles, applications and potential. Prog. Nucl. Magn. Reson. Spectrosc. 2009, 54, 97–122. [Google Scholar] [CrossRef]
- Rottreau, T.J.; Parkes, G.E.; Schirru, M.; Harries, J.L.; Granollers Mesa, M.; Topham, P.D.; Evans, R. NMR cryoporometry of polymers: Cross-linking, porosity and the importance of probe liquid. Colloids Surf. A Physicochem. Eng. Asp. 2019, 575, 256–263. [Google Scholar] [CrossRef]
- Webber, J.B.W. Some Applications of a Field Programmable Gate Array Based Time-Domain Spectrometer for NMR Relaxation and NMR Cryoporometry. Appl. Sci. 2020, 10. [Google Scholar] [CrossRef]
- Webber, J.B.W.; Singer, P.M.; Pickup, D.M. Quantified Measurements of Viscosity in The Bulk and In Pores, Using NMR Spin-lattice Relaxation in The Rotating Frame. In Quantitative NMR Journal; Inaugural Issue, 2026; p. 1. [Google Scholar]
- Webber, J.B.W. Updates on an Even More Compact Precision NMR Spectrometer and a Wider Range V-T Probe, for General Purpose NMR and for NMR Cryoporometric Nano- to Micro-Pore Measurements. Micro 2024, 4, 509–529. [Google Scholar] [CrossRef]
- Iverson, K. A Programming Language; Wiley: New York, 1962. [Google Scholar]
- APLX Archive. 2026. Available online: https://www.dyalog.com/aplx.htm (accessed on 2026-02-24).
- Webber, J.B.W.; Demin, P. Digitally Based Precision Time-Domain Spectrometer for NMR Relaxation and NMR Cryoporometry. Micro 2023, 3, 404–433. [Google Scholar] [CrossRef]
- Litvinov, V.M.; Penning, J.P. Phase Composition and Molecular Mobility in Nylon 6 Fibers as Studied by Proton NMR Transverse Magnetization Relaxation. Macromol. Chem. Phys. 2004, 205, 1721–1734. Available online: https://onlinelibrary.wiley.com/doi/pdf/10.1002/macp.200400089. [CrossRef]
- Singer, P.M.; Valiya Parambathu, A.; Wang, X.; Asthagiri, D.; Chapman, W.G.; Hirasaki, G.J.; Fleury, M. Elucidating the 1H NMR Relaxation Mechanism in Polydisperse Polymers and Bitumen Using Measurements, MD Simulations, and Models. J. Phys. Chem. B 2020, 124, 4222–4233. [Google Scholar] [CrossRef] [PubMed]
- Bergmann, K.; Schmiedberger, H. A rapid method for the NMR-measurement of two-phase polymers. Colloid Polym. Sci. 1980, 258, 24–26. [Google Scholar] [CrossRef]
- Qiu, W.; Habenschuss, A.; Wunderlich, B. The phase structures of nylon 6.6 as studied by temperature-modulated calorimetry and their link to X-ray structure and molecular motion. Polymer 2007, 48, 1641–1650. [Google Scholar] [CrossRef]
- Heymans, N. A Novel Look at Models for Polymer Entanglement. Macromolecules 2000, 33, 4226–4234. [Google Scholar] [CrossRef]
- Sirota, E.B. The Viscosity of Oils. Energy Fuels 2025, 39, 14511–14533. [Google Scholar] [CrossRef]
- Kauzmann, W. The Nature of the Glassy State and the Behavior of Liquids at Low Temperatures. Chem. Rev. 1948, 43, 1–42. [Google Scholar] [CrossRef]
- van Duynhoven, J.; Voda, A.; Witek, M.; Van As, H. Chapter 3 - Time-Domain NMR Applied to Food Products. In Annual Reports on NMR Spectroscopy; Academic Press, 2010; Vol. 69, pp. 145–197. [Google Scholar] [CrossRef]
- Webber, J.B.W.; Pickup, D.M. Compact Mobile NMR Spectrometers and Nano-pore NMR Cryoporometers, 2025. Poster presented at Frontiers of Magnetic Resonance, University of Southampton, UK.
- Webber, J.B. Studies of nano-structured liquids in confined geometries and at surfaces. Prog. Nucl. Mag. Res. Sp. 2010, 56, 78–93. [Google Scholar] [CrossRef]
Figure 1.
Variable-temperature mobile NMR Instrument: (a) front view and (b) back view.
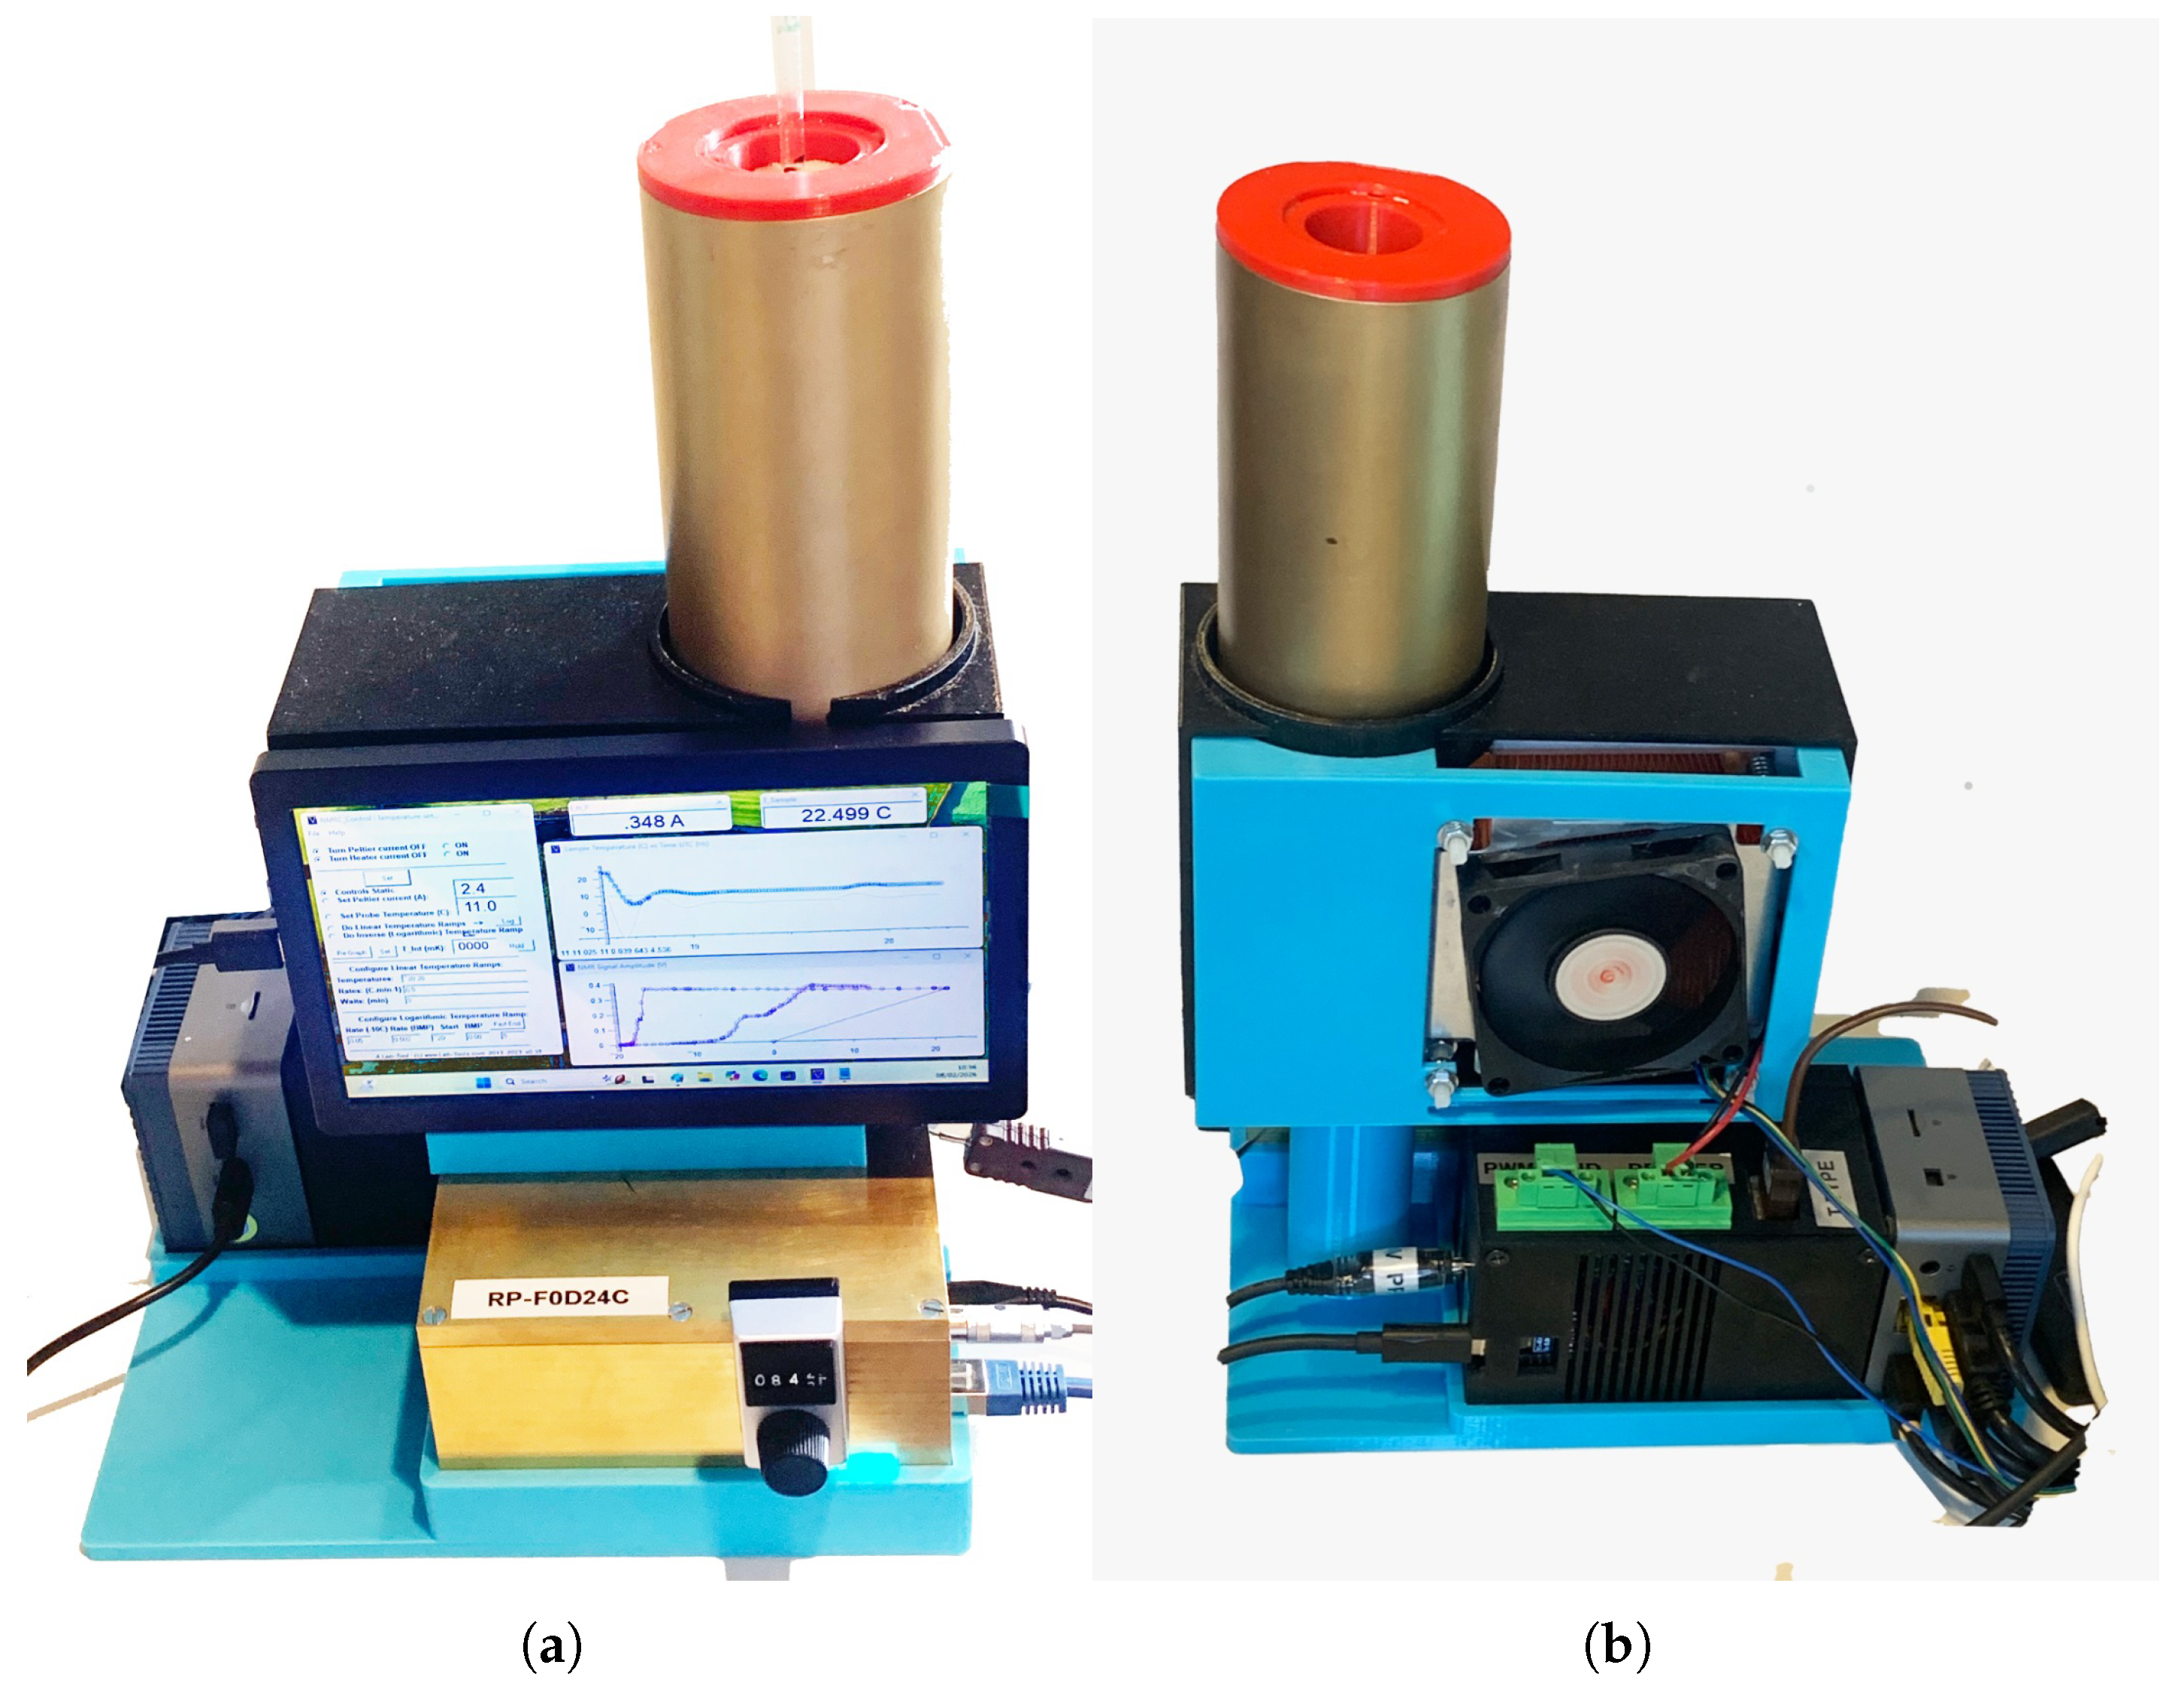
Figure 2.
(a) Lab-Tools MK4 NMR Spectrometer and probe, and (b) Halbach magnet.
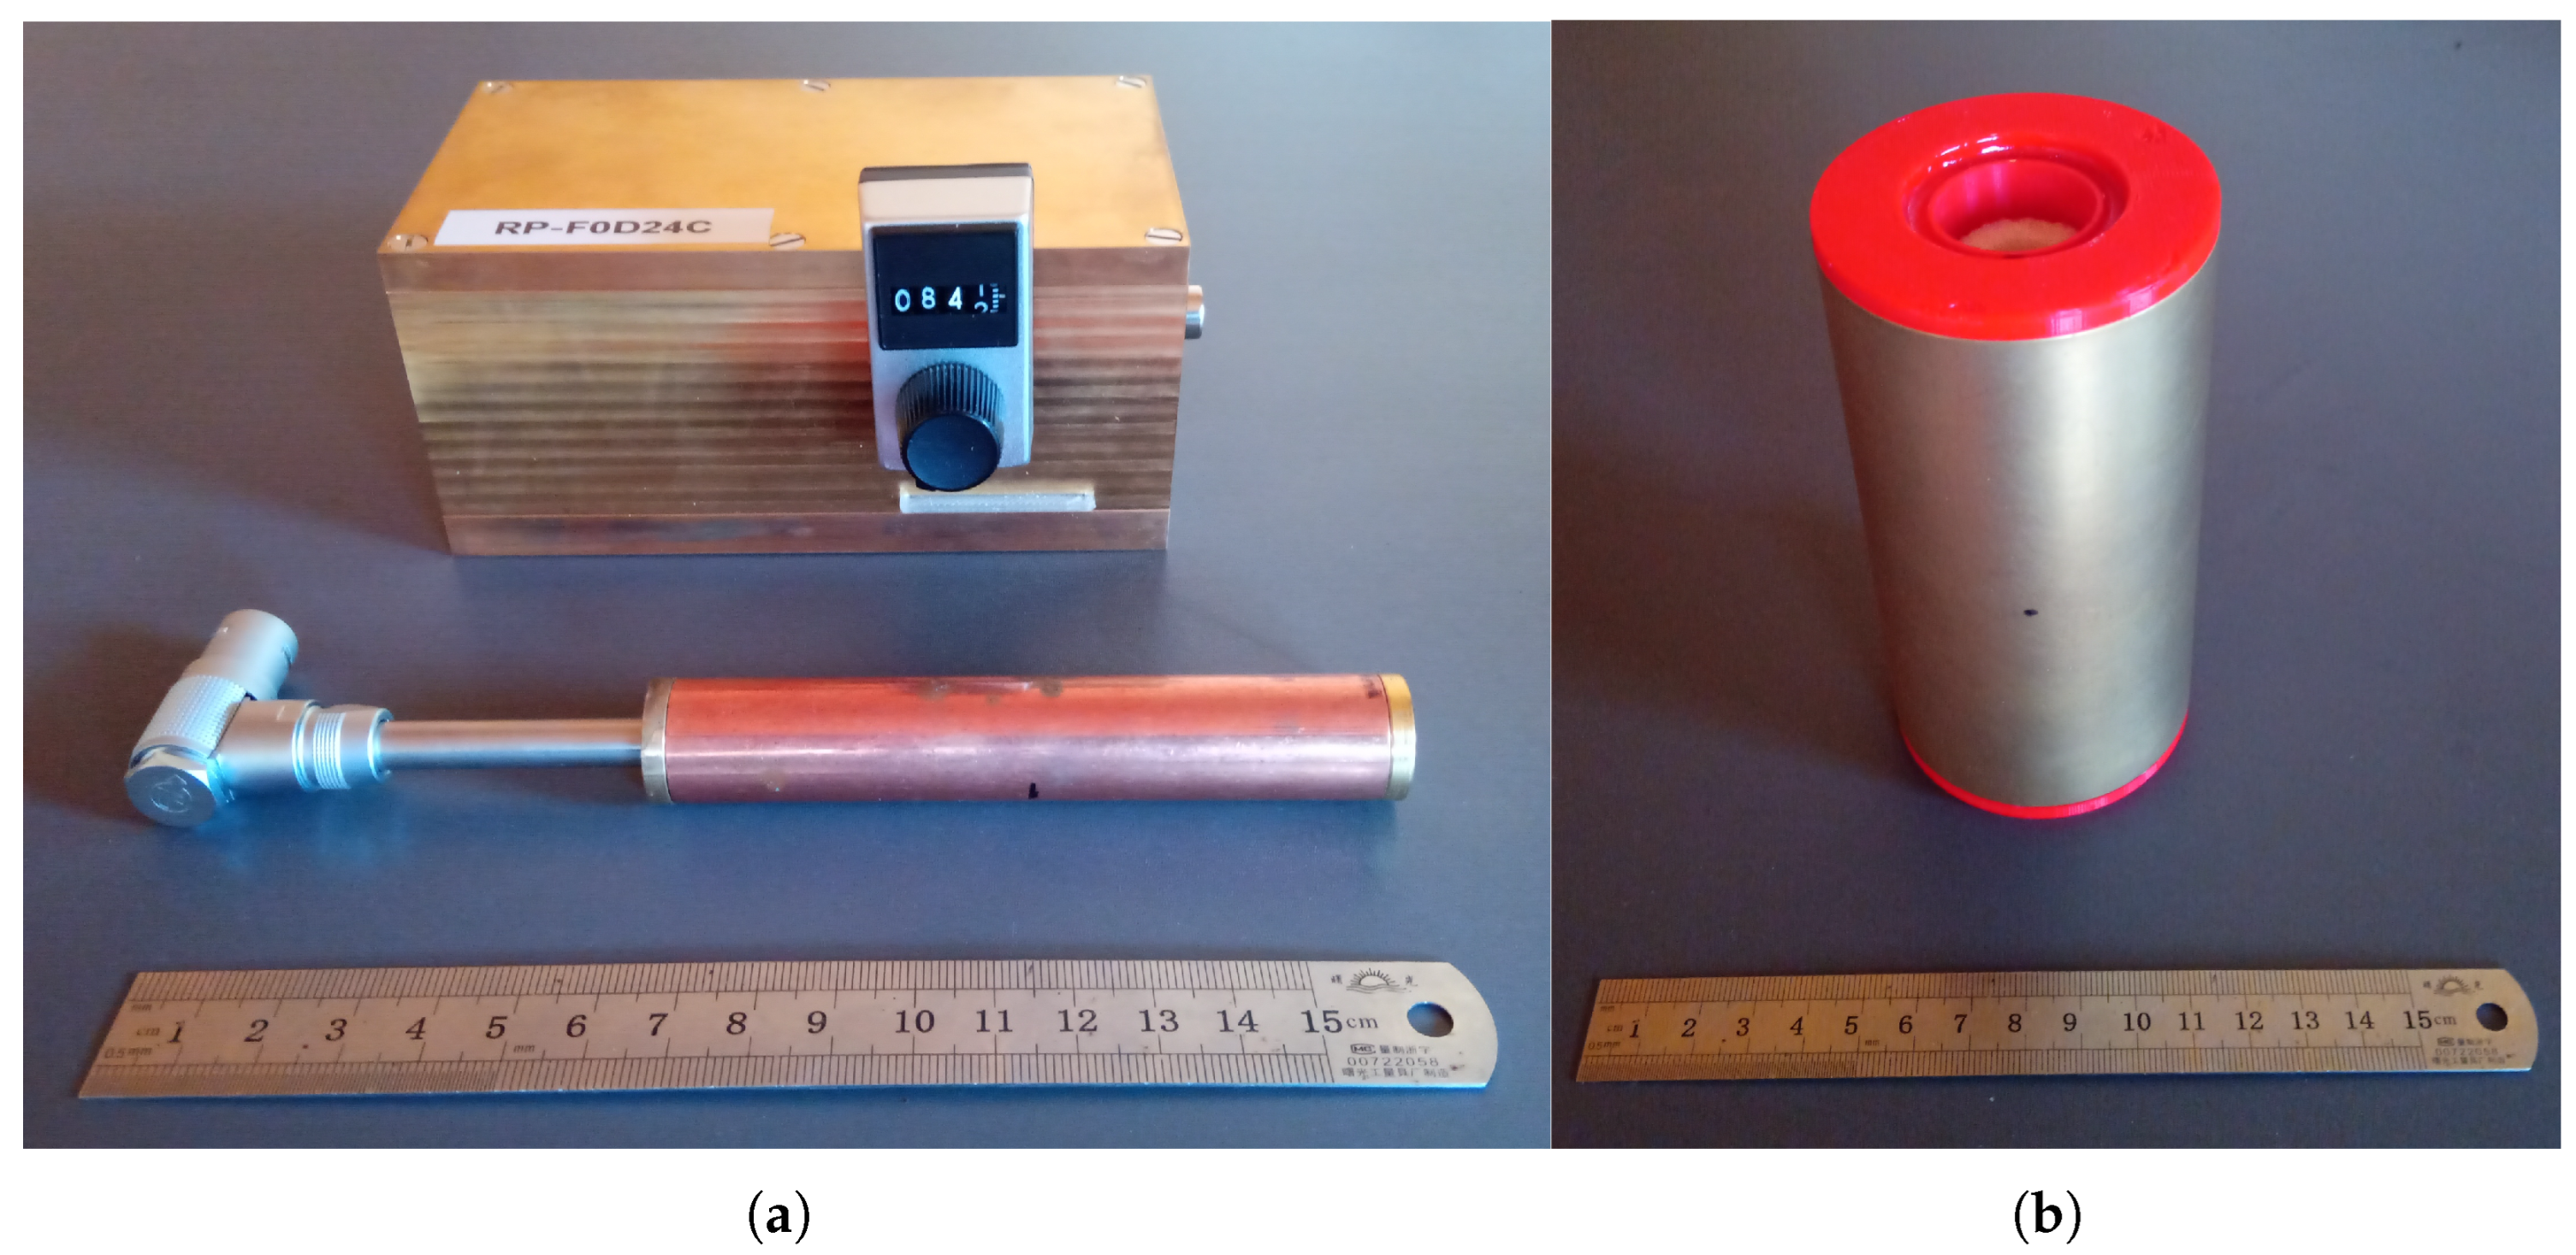
Figure 3.
A typical Graphical User Interface front panel for a CPMG NMR pulse sequence.
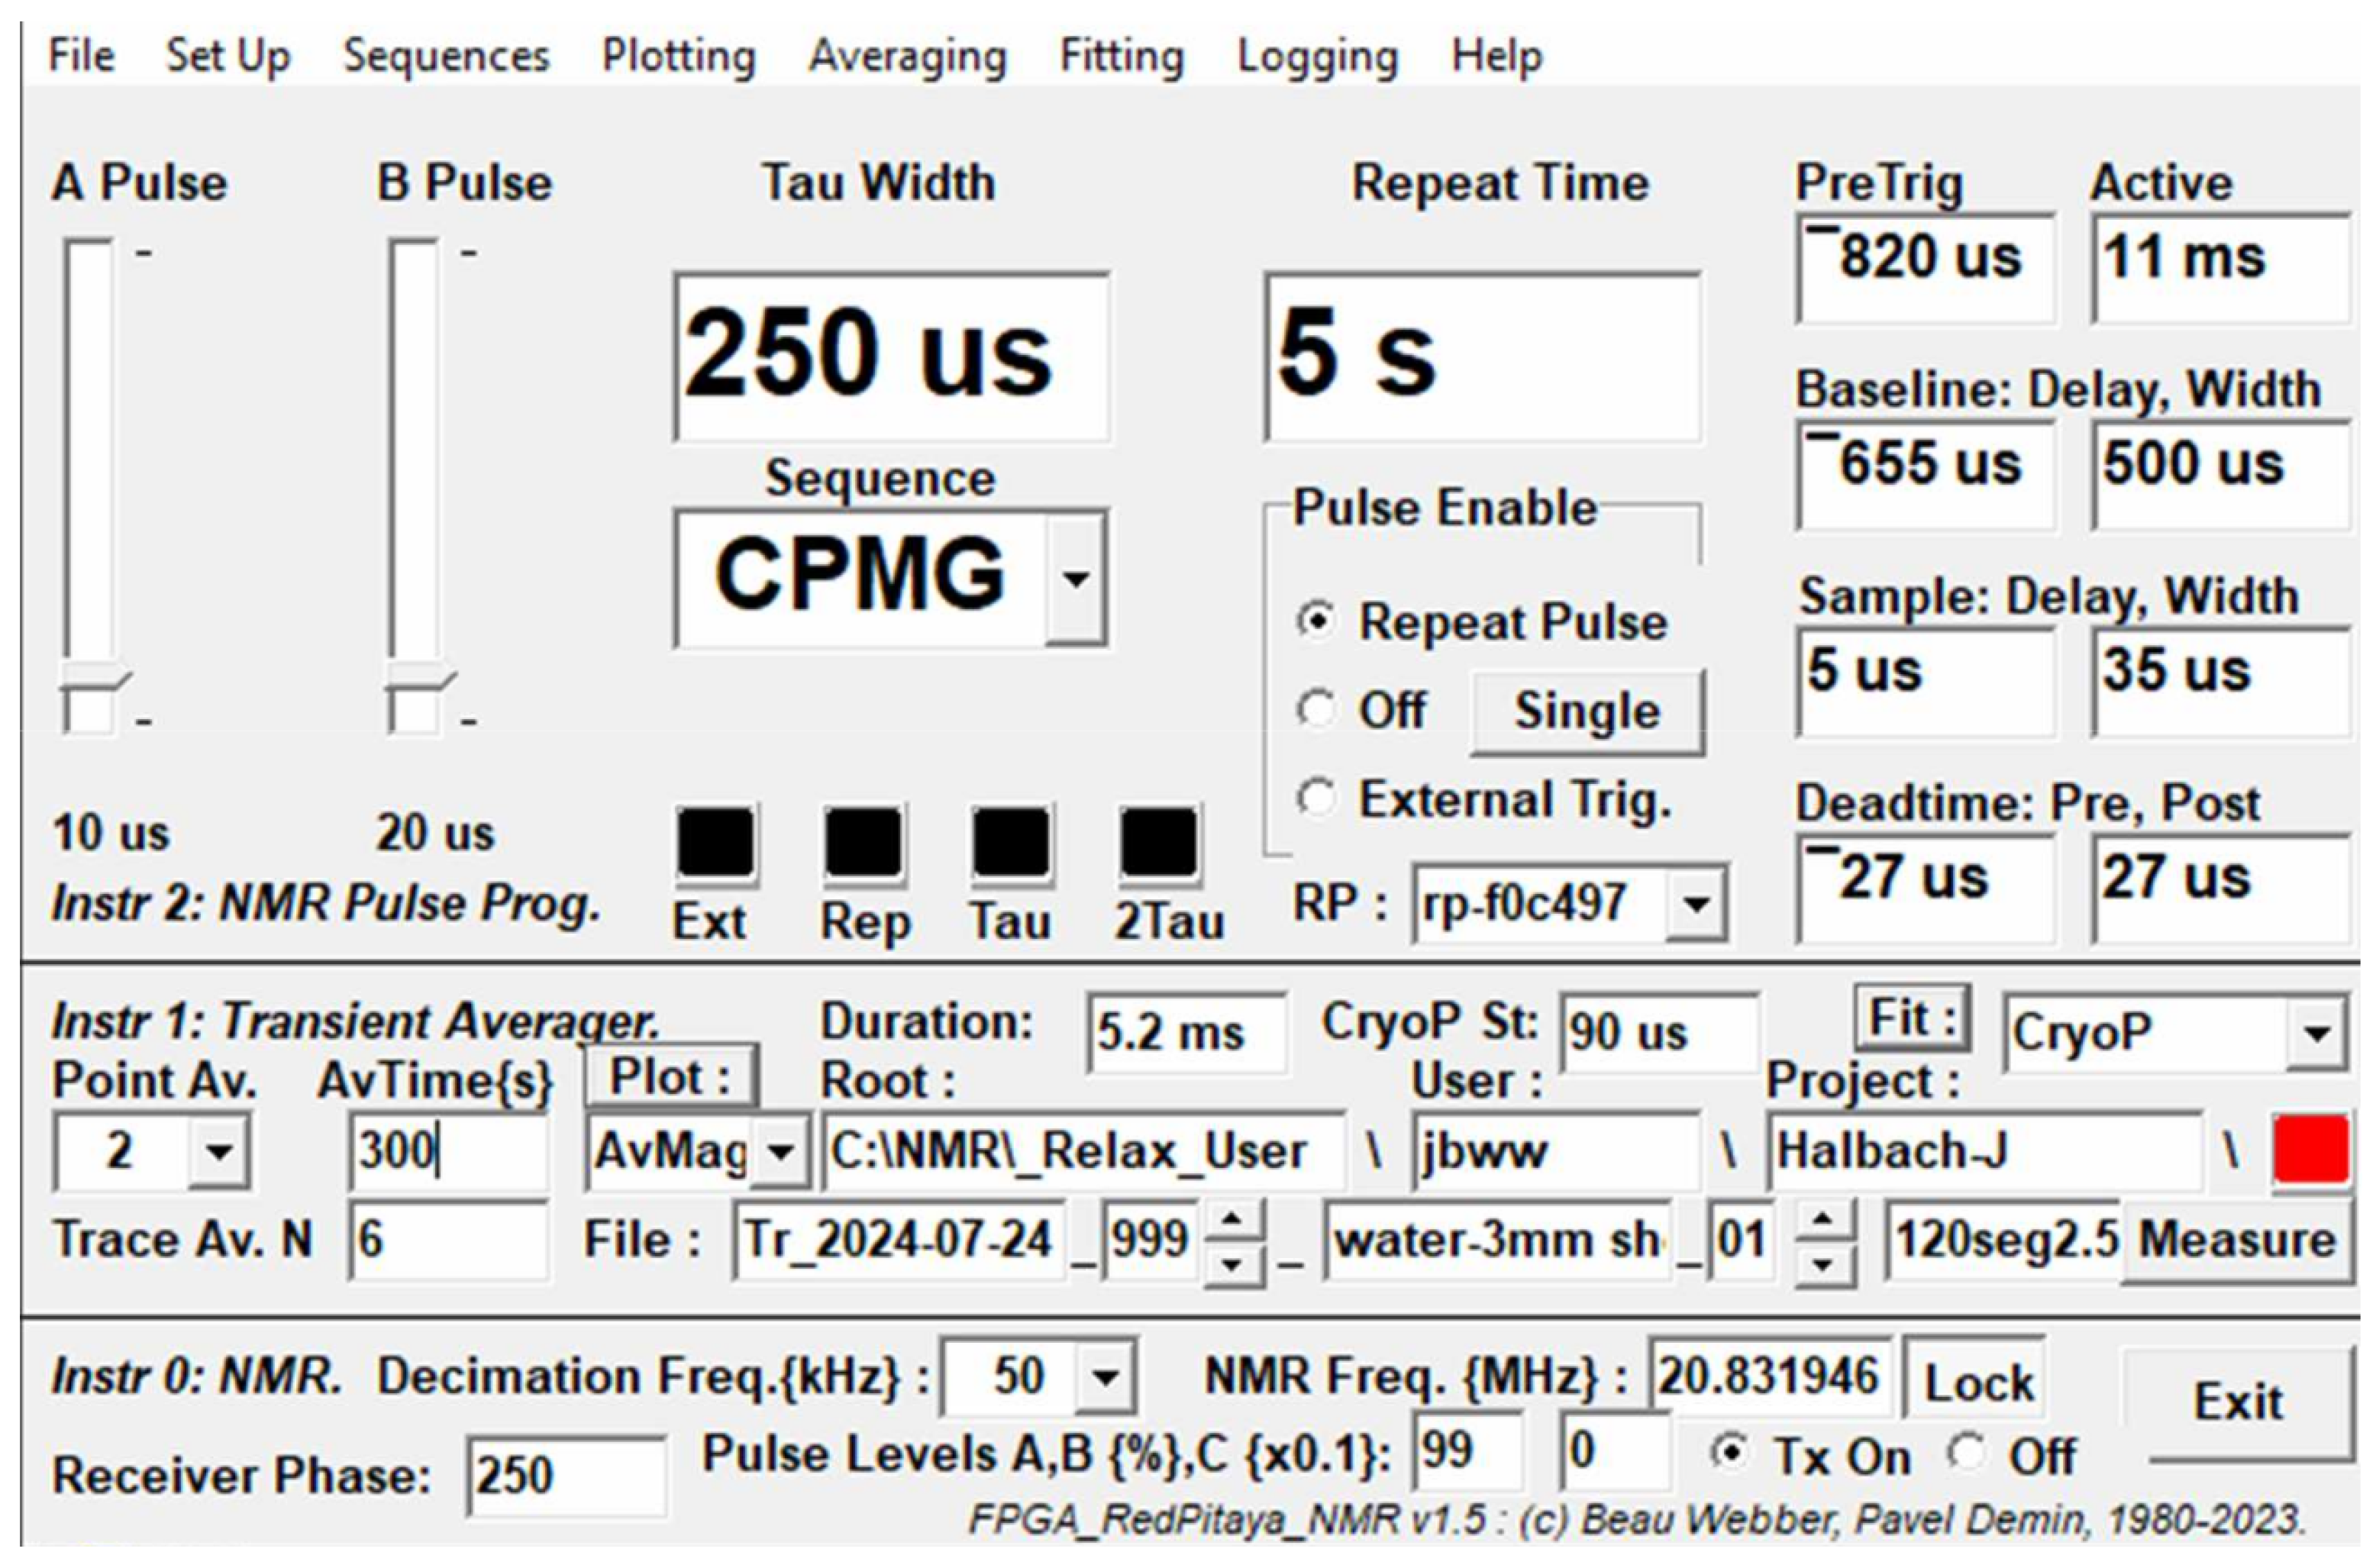
Figure 4.
Representative three-component fit of a CPMG echo envelope for solid Nylon 66 sample. The multi-component decay is resolved into three distinct T2 relaxation times.
Figure 4.
Representative three-component fit of a CPMG echo envelope for solid Nylon 66 sample. The multi-component decay is resolved into three distinct T2 relaxation times.
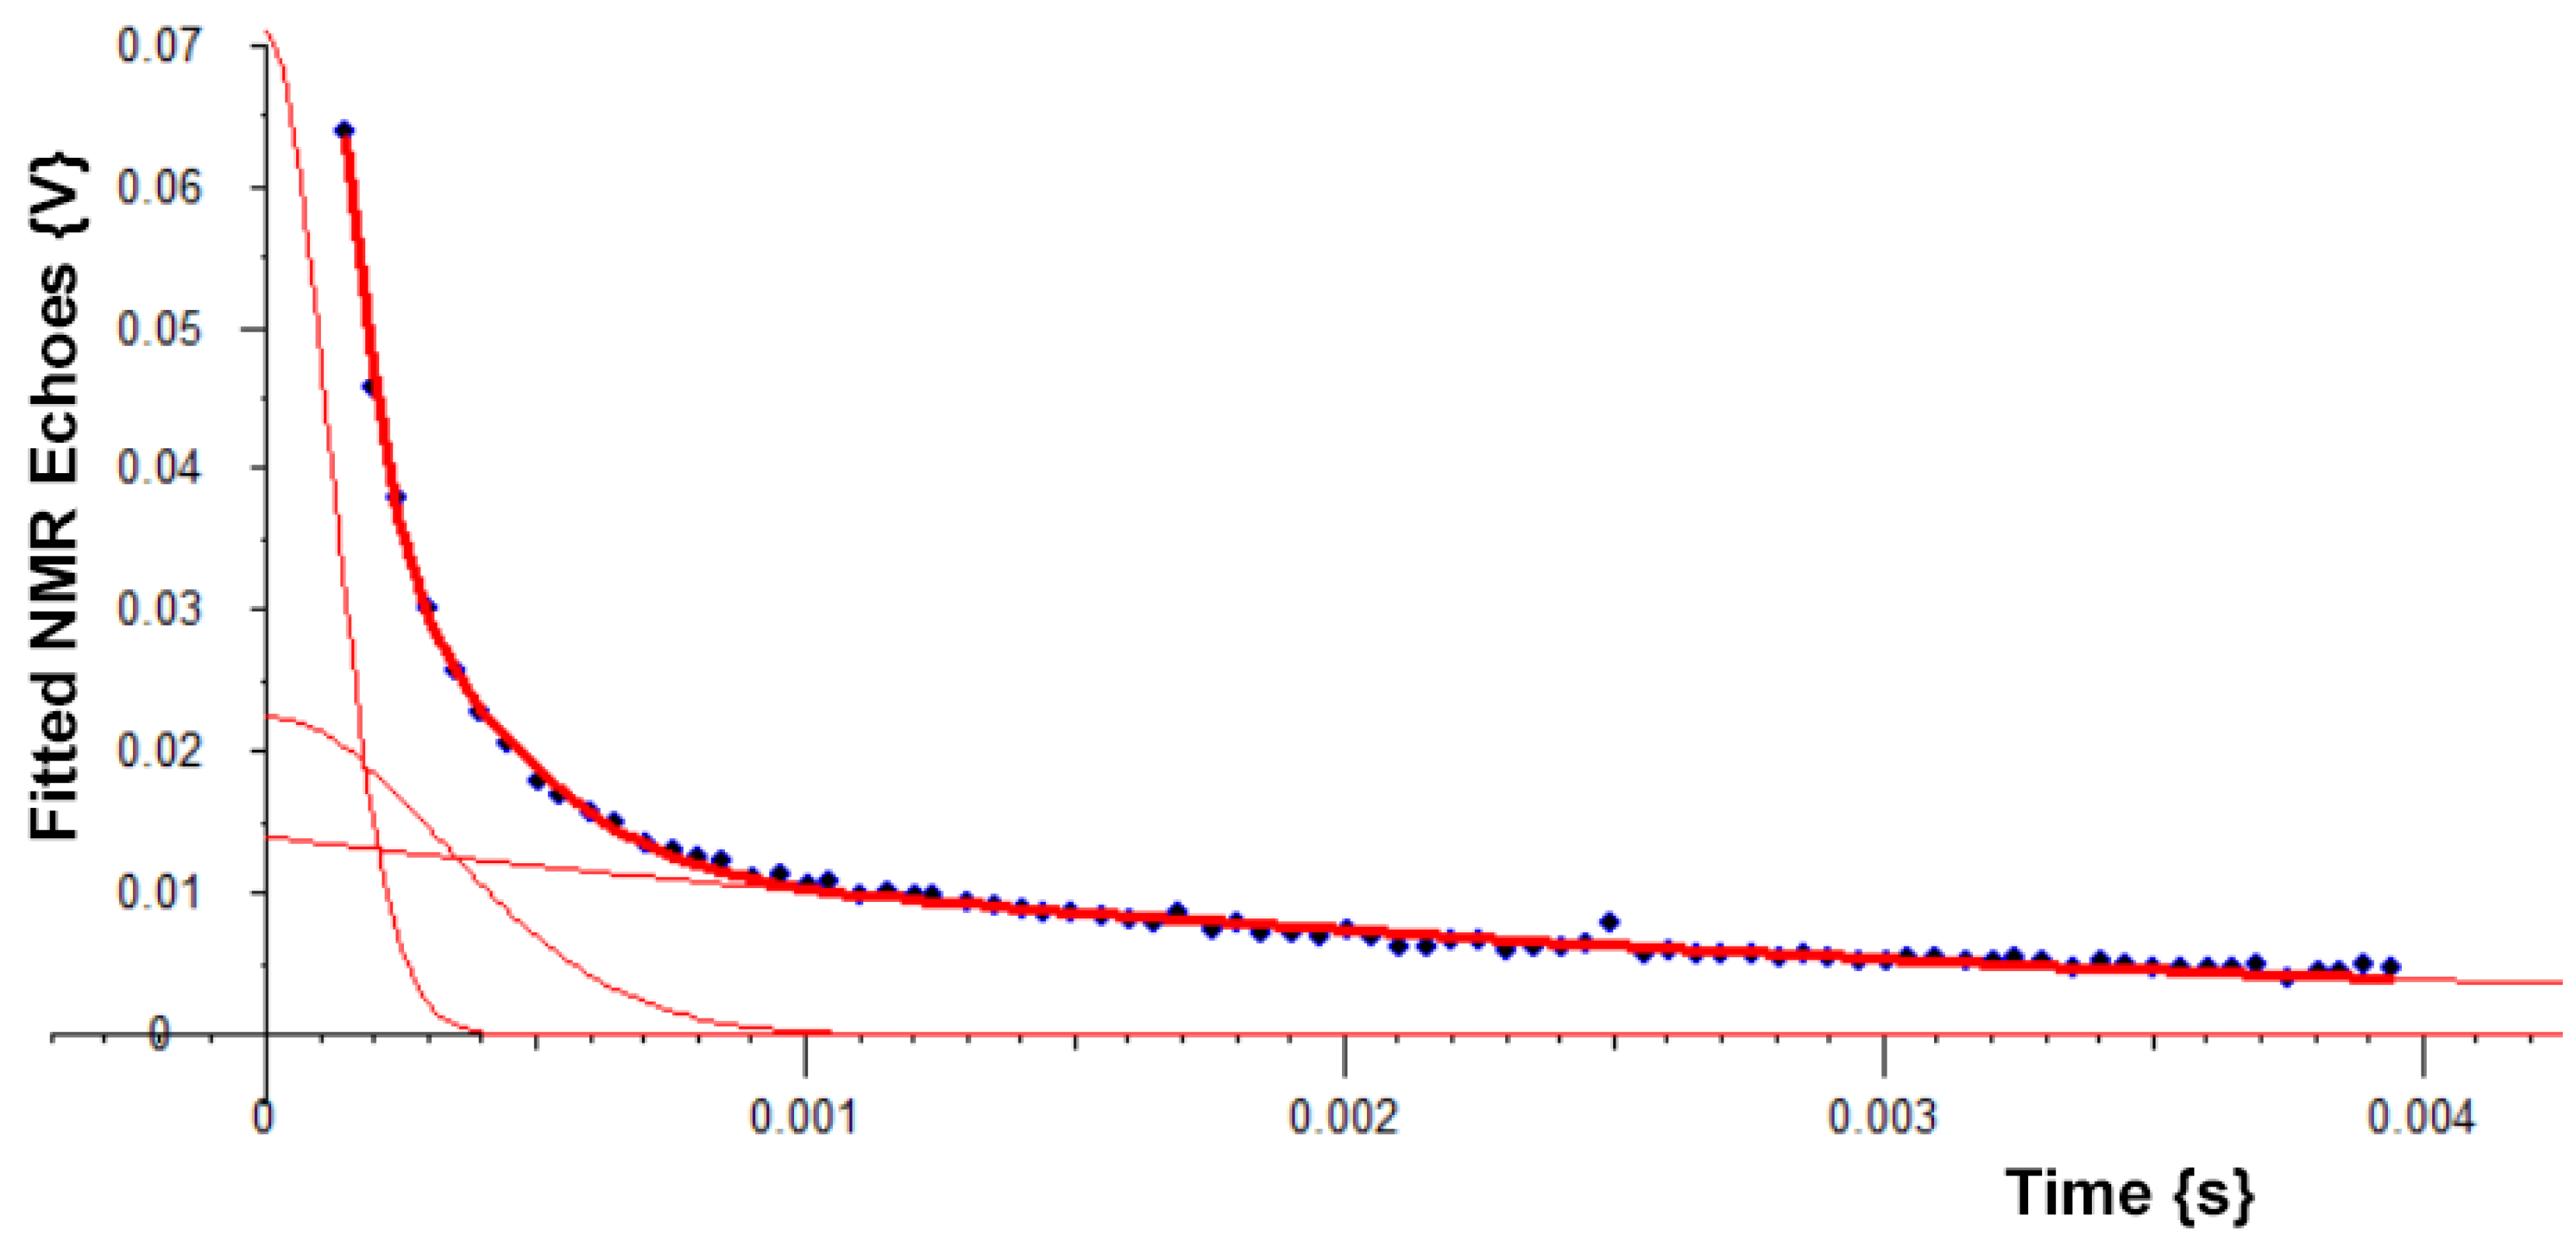
Figure 5.
The NMR receiver output (with pulse-suppression switched off) for a 2D T1-CPMG NMR sequence.
Figure 5.
The NMR receiver output (with pulse-suppression switched off) for a 2D T1-CPMG NMR sequence.
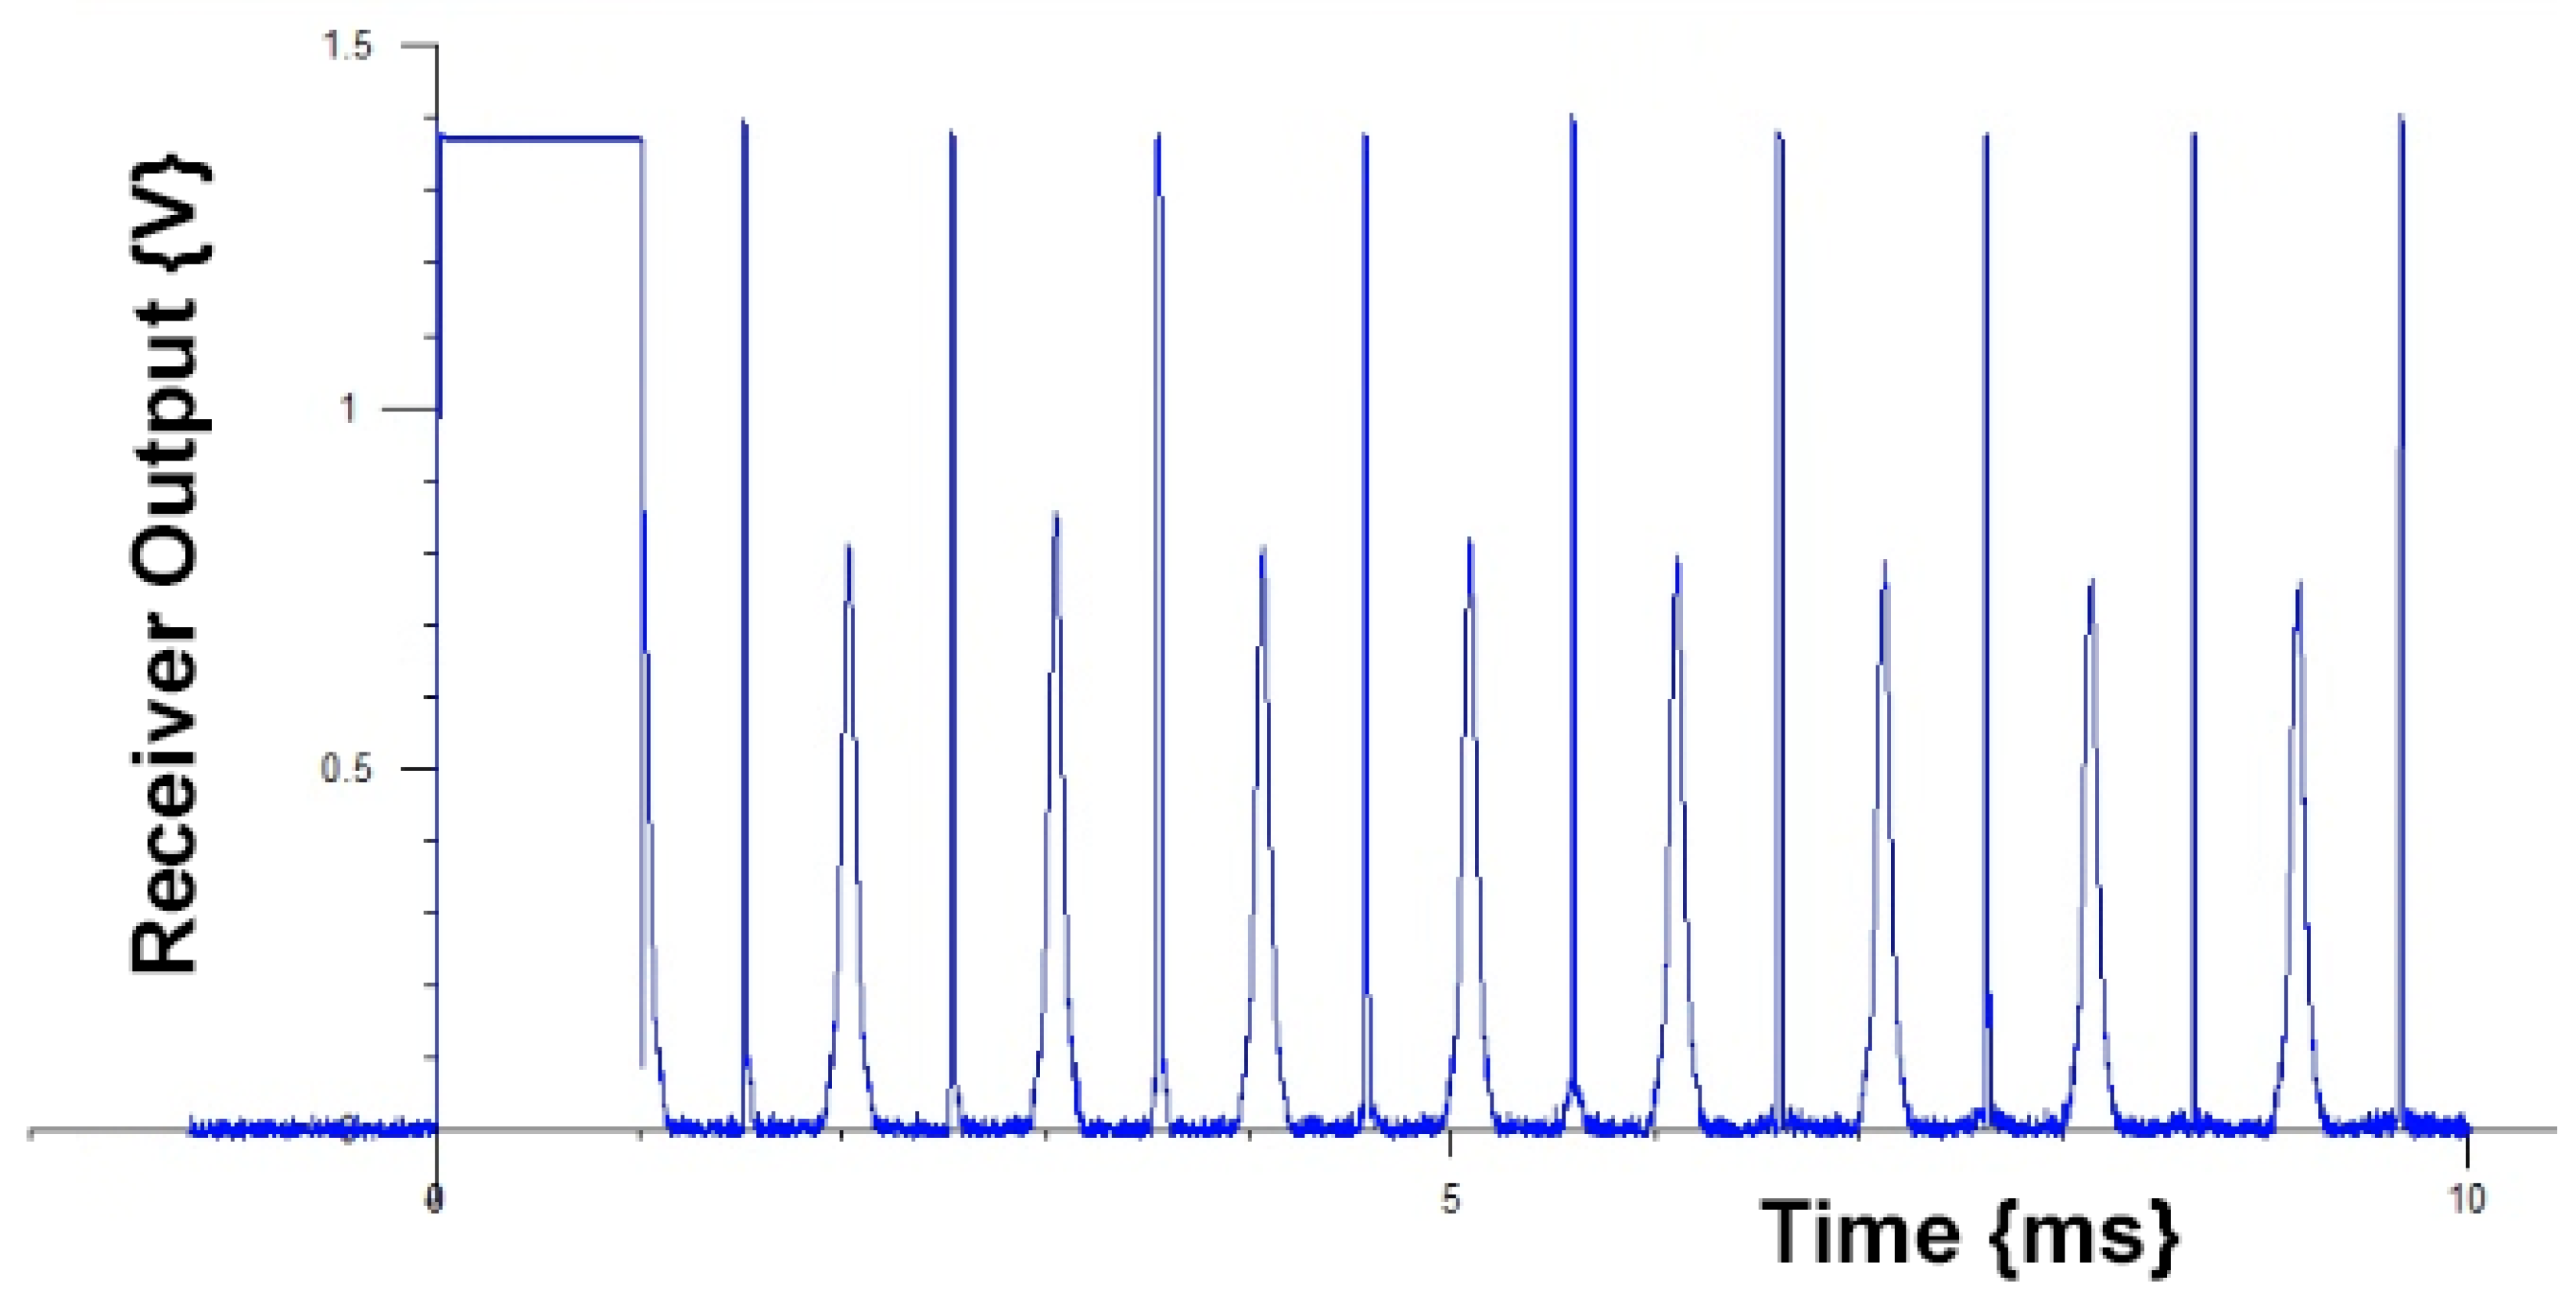
Figure 6.
The polynomial fitted NMR echoes for a 2D T1 CPMG NMR sequence, following the ending of a 5 spin-lock pulse.
Figure 6.
The polynomial fitted NMR echoes for a 2D T1 CPMG NMR sequence, following the ending of a 5 spin-lock pulse.
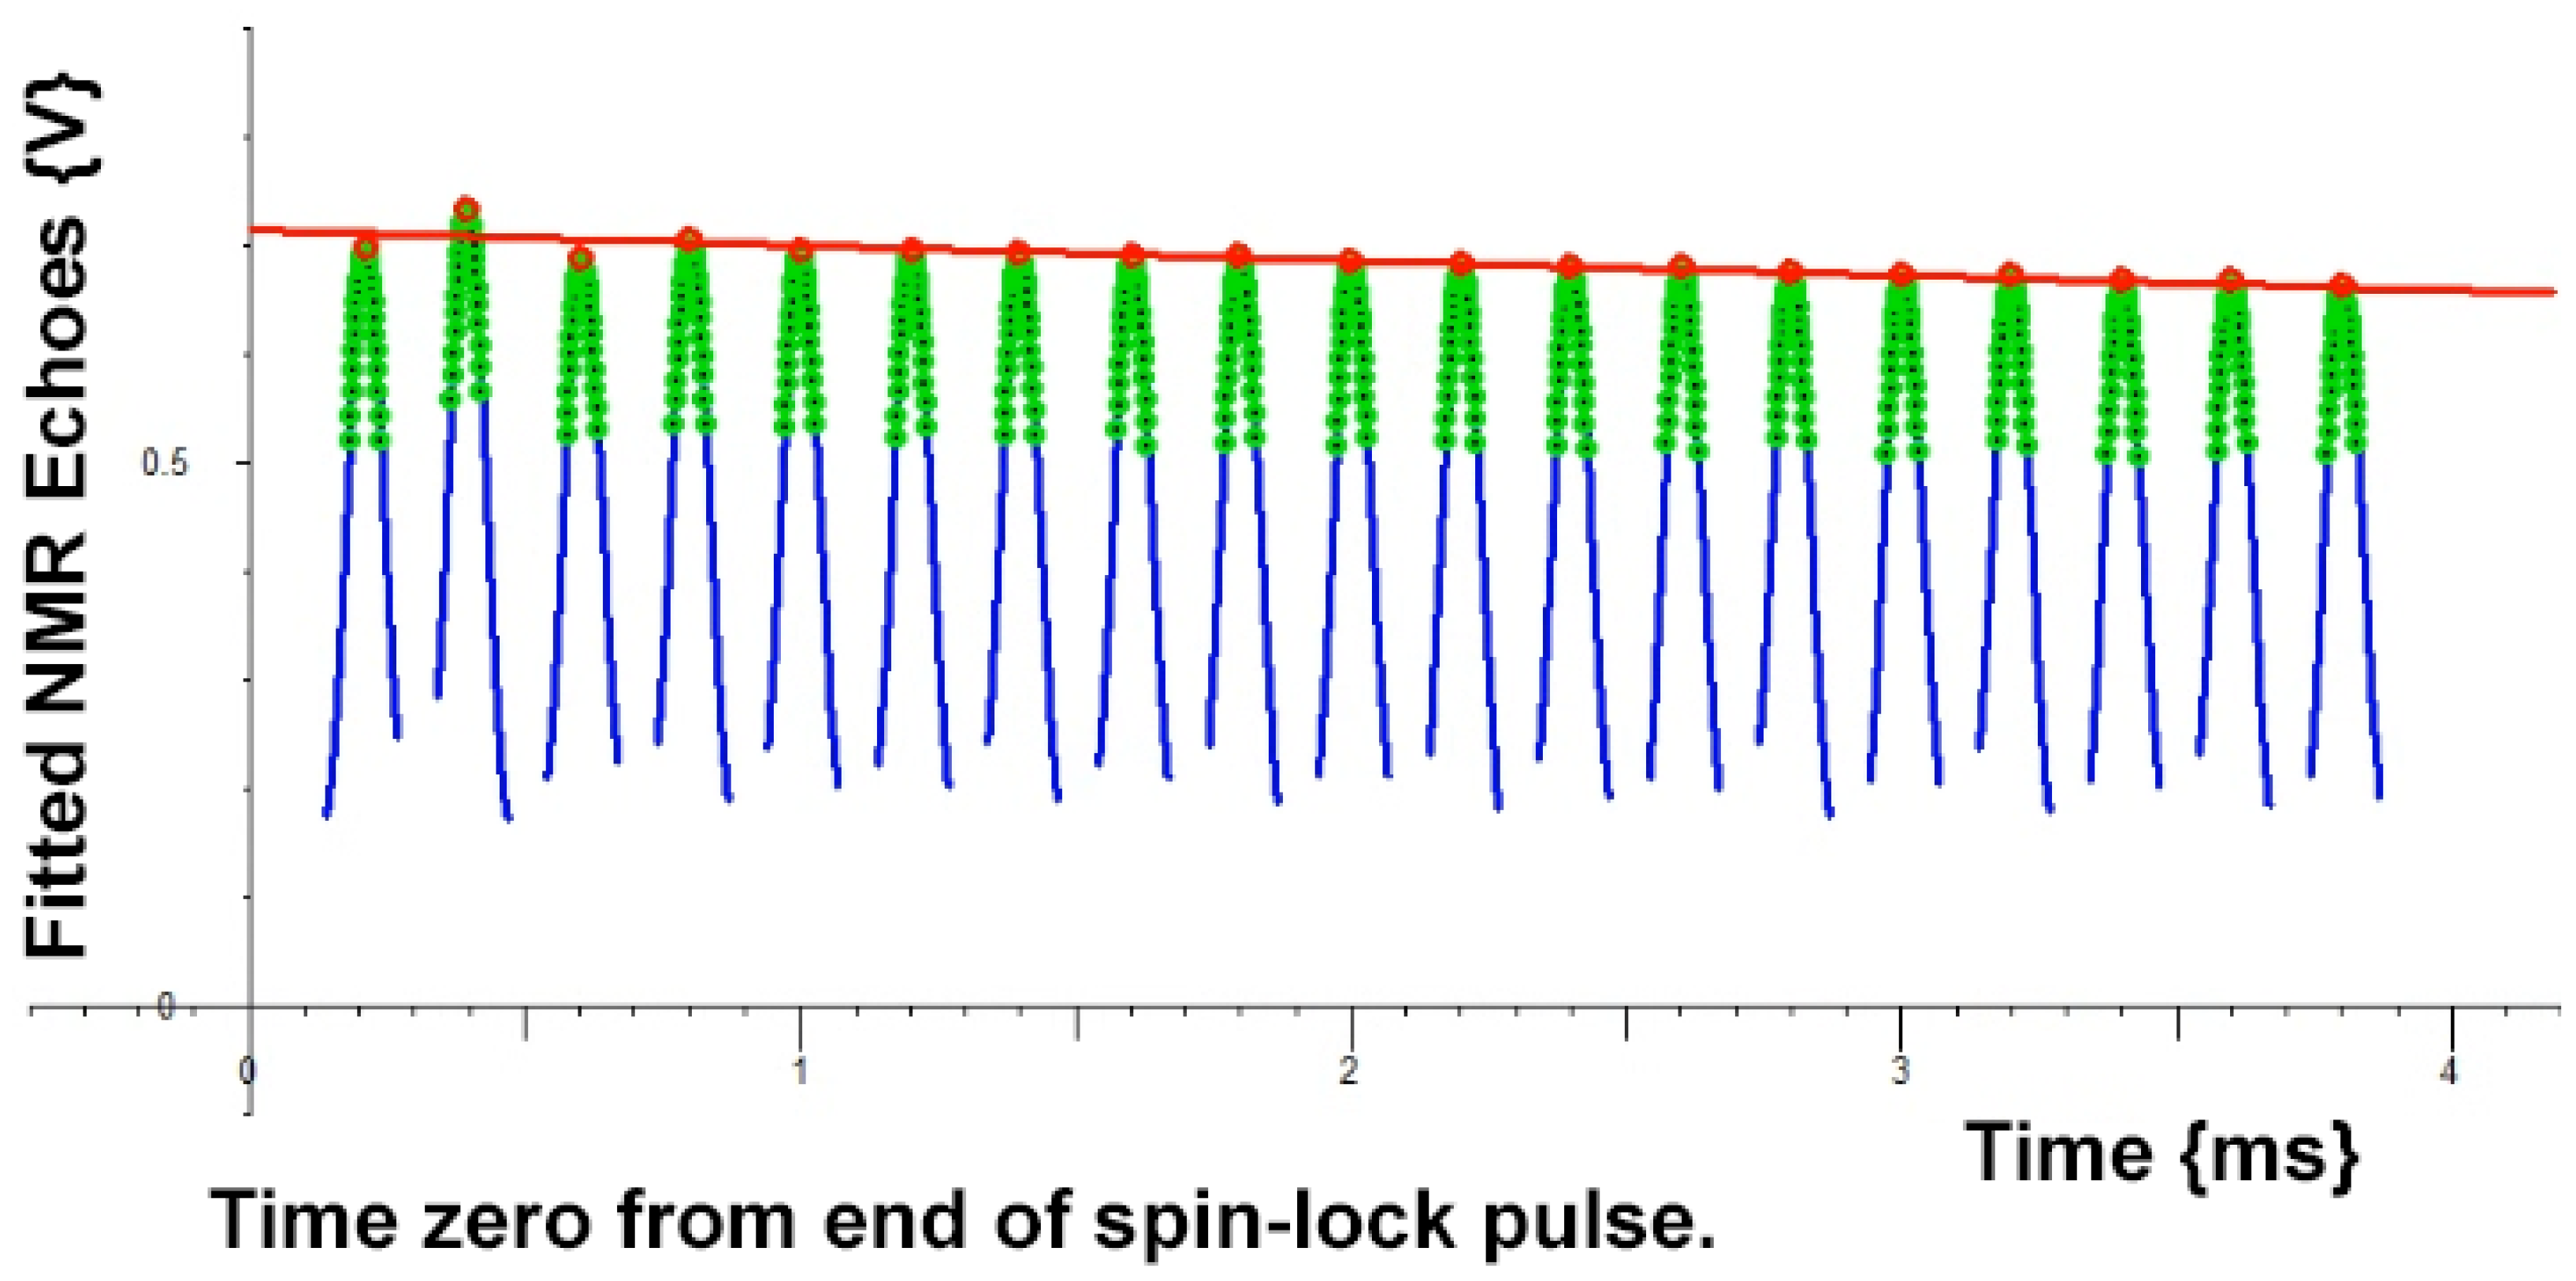
Figure 7.
A plot of 1/viscosity against T1 relaxation time for 10 samples of known viscosity. T1 was measured at a spin-lock frequency of 10 and at or close to 25 °C. These 10 measurements were fitted with a parabola (blue line) with a0 = -0.59791291, b0 = 0.98323349, and c0 = -0.18025699. Blue circles: four Brookfield Engineering oils of calibrated viscosity (Table 1); Cyan circles: five sucrose solutions of known viscosity; and Mauve circle: a dodecane sample of known viscosity. Red circles and red line: four slightly different Brookfield oils previously measured by fast-field-cycling NMR at 40 °C are also plotted [24]. Reproduced from Ref. [18]
Figure 7.
A plot of 1/viscosity against T1 relaxation time for 10 samples of known viscosity. T1 was measured at a spin-lock frequency of 10 and at or close to 25 °C. These 10 measurements were fitted with a parabola (blue line) with a0 = -0.59791291, b0 = 0.98323349, and c0 = -0.18025699. Blue circles: four Brookfield Engineering oils of calibrated viscosity (Table 1); Cyan circles: five sucrose solutions of known viscosity; and Mauve circle: a dodecane sample of known viscosity. Red circles and red line: four slightly different Brookfield oils previously measured by fast-field-cycling NMR at 40 °C are also plotted [24]. Reproduced from Ref. [18]
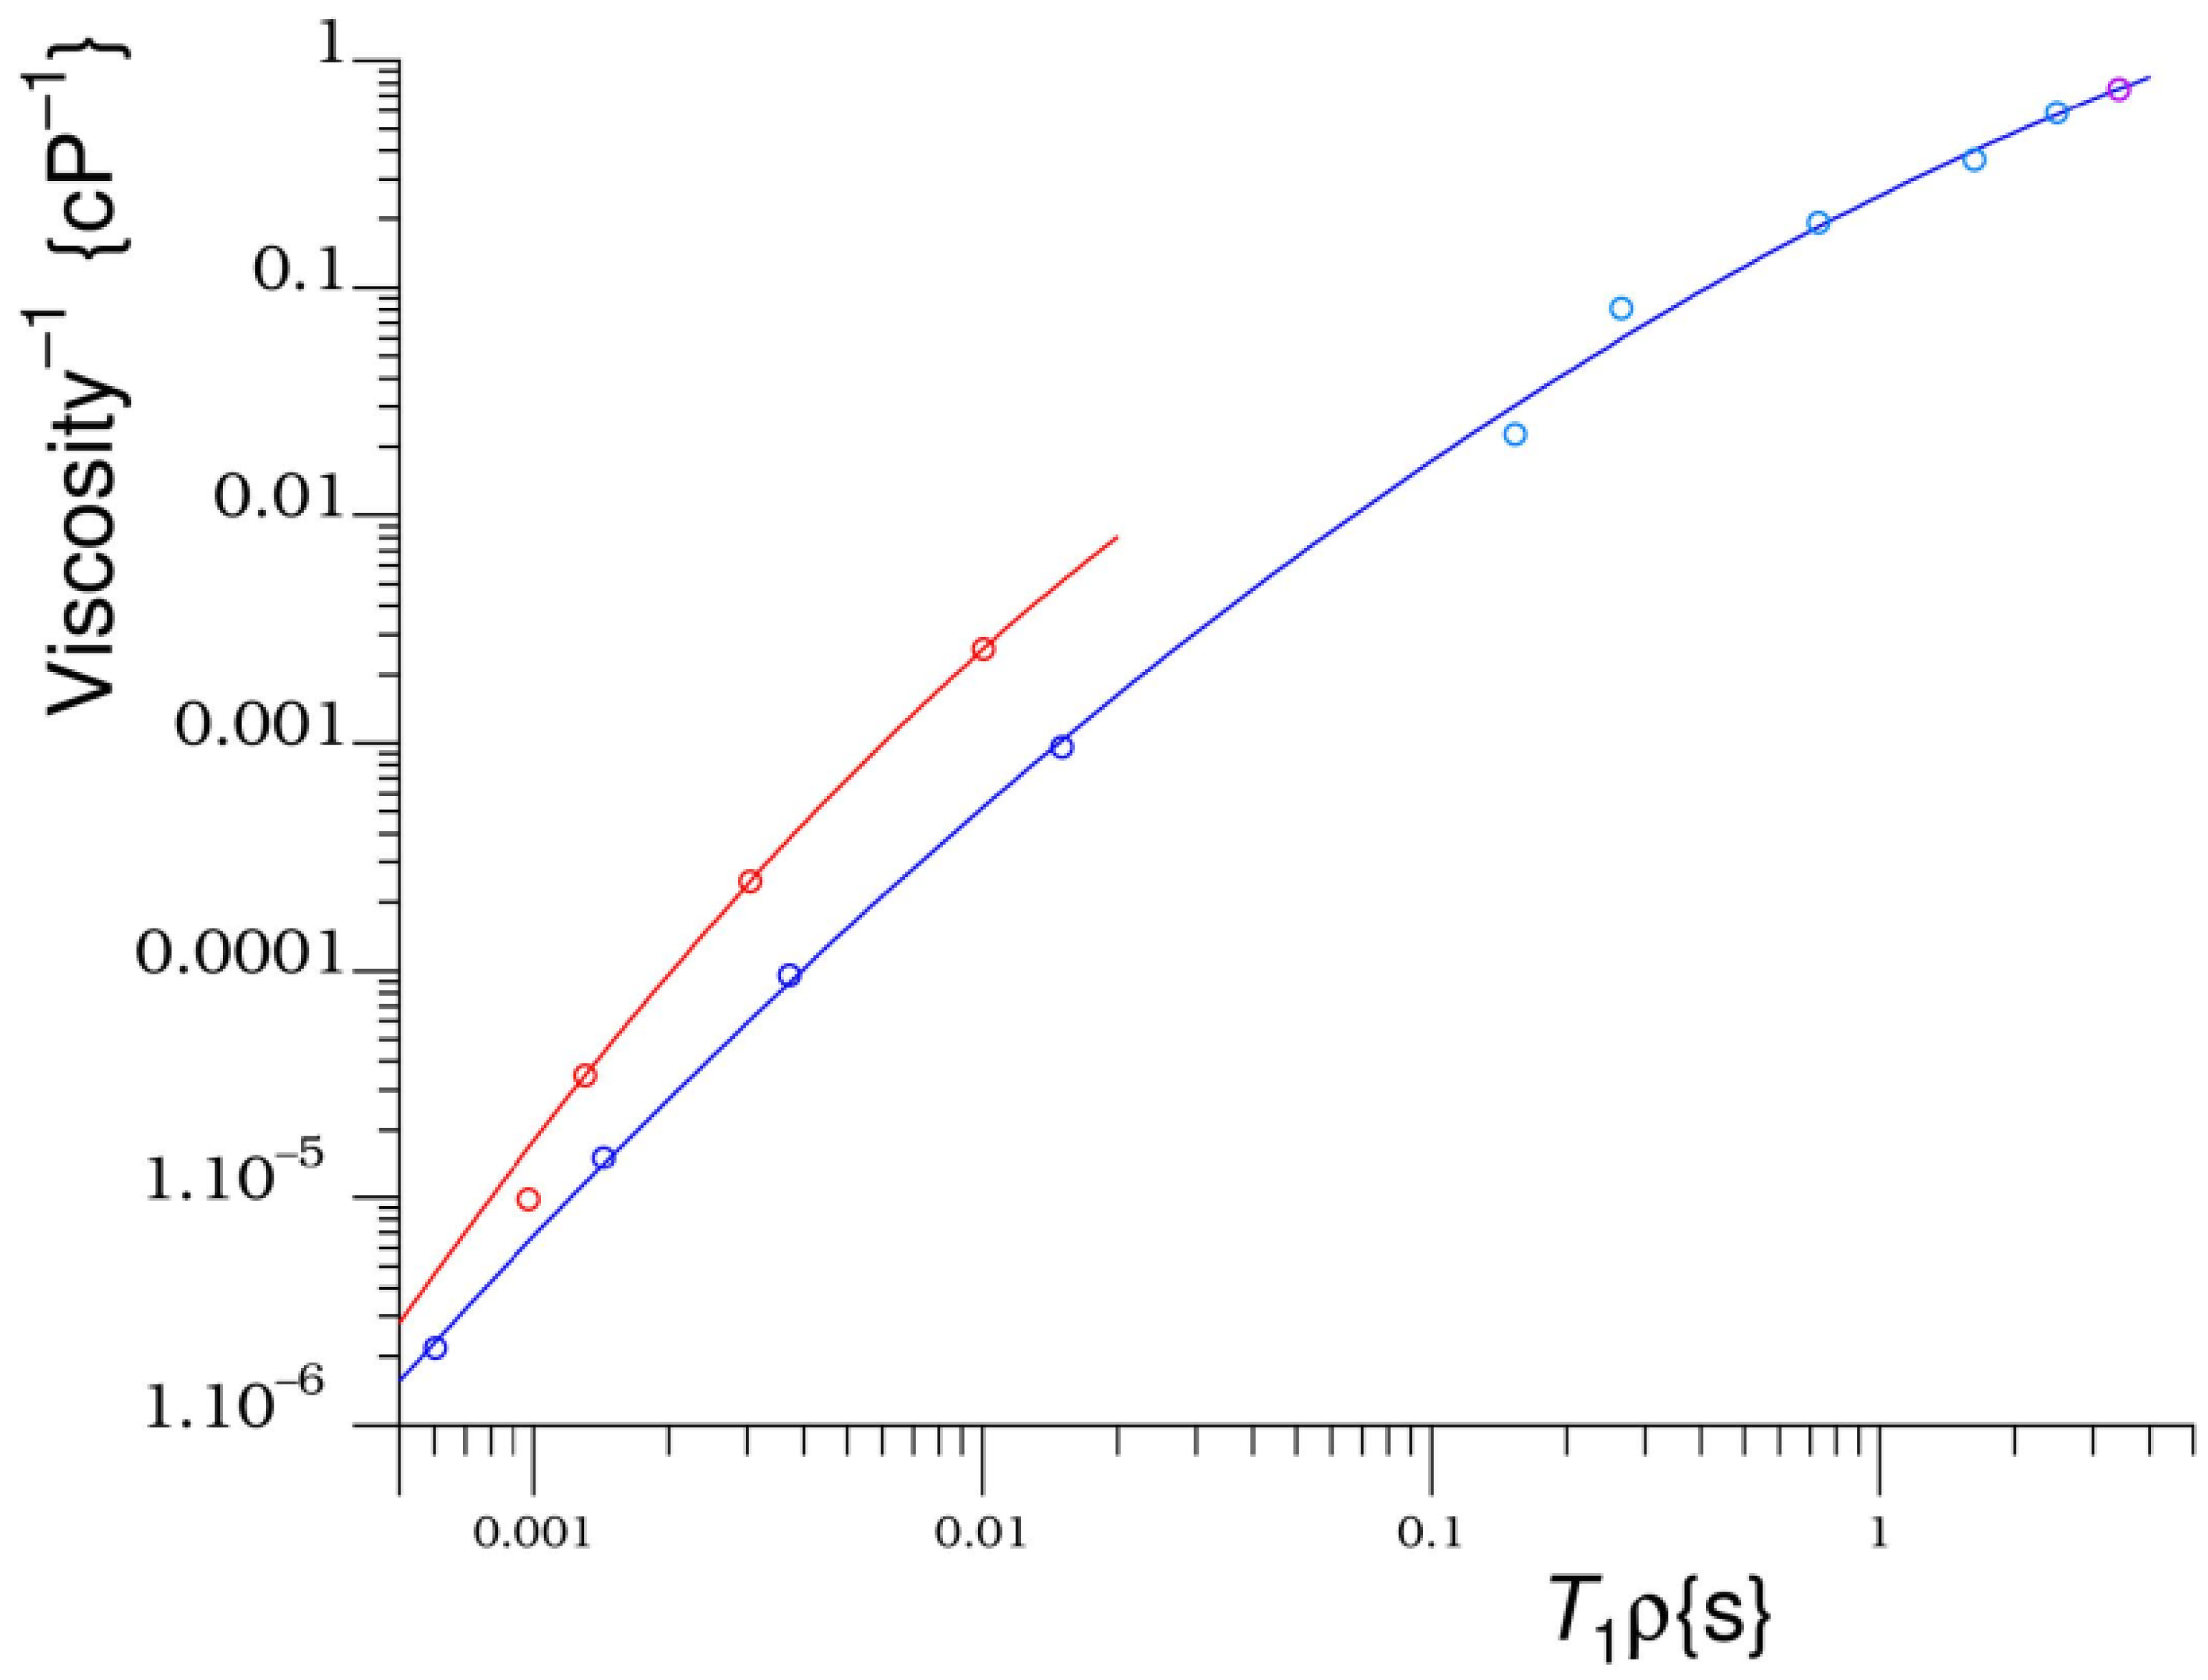
Figure 8.
Temperature dependence of the phase composition of a solid sample of Nylon 66 determined from T2 relaxation times.
Figure 8.
Temperature dependence of the phase composition of a solid sample of Nylon 66 determined from T2 relaxation times.
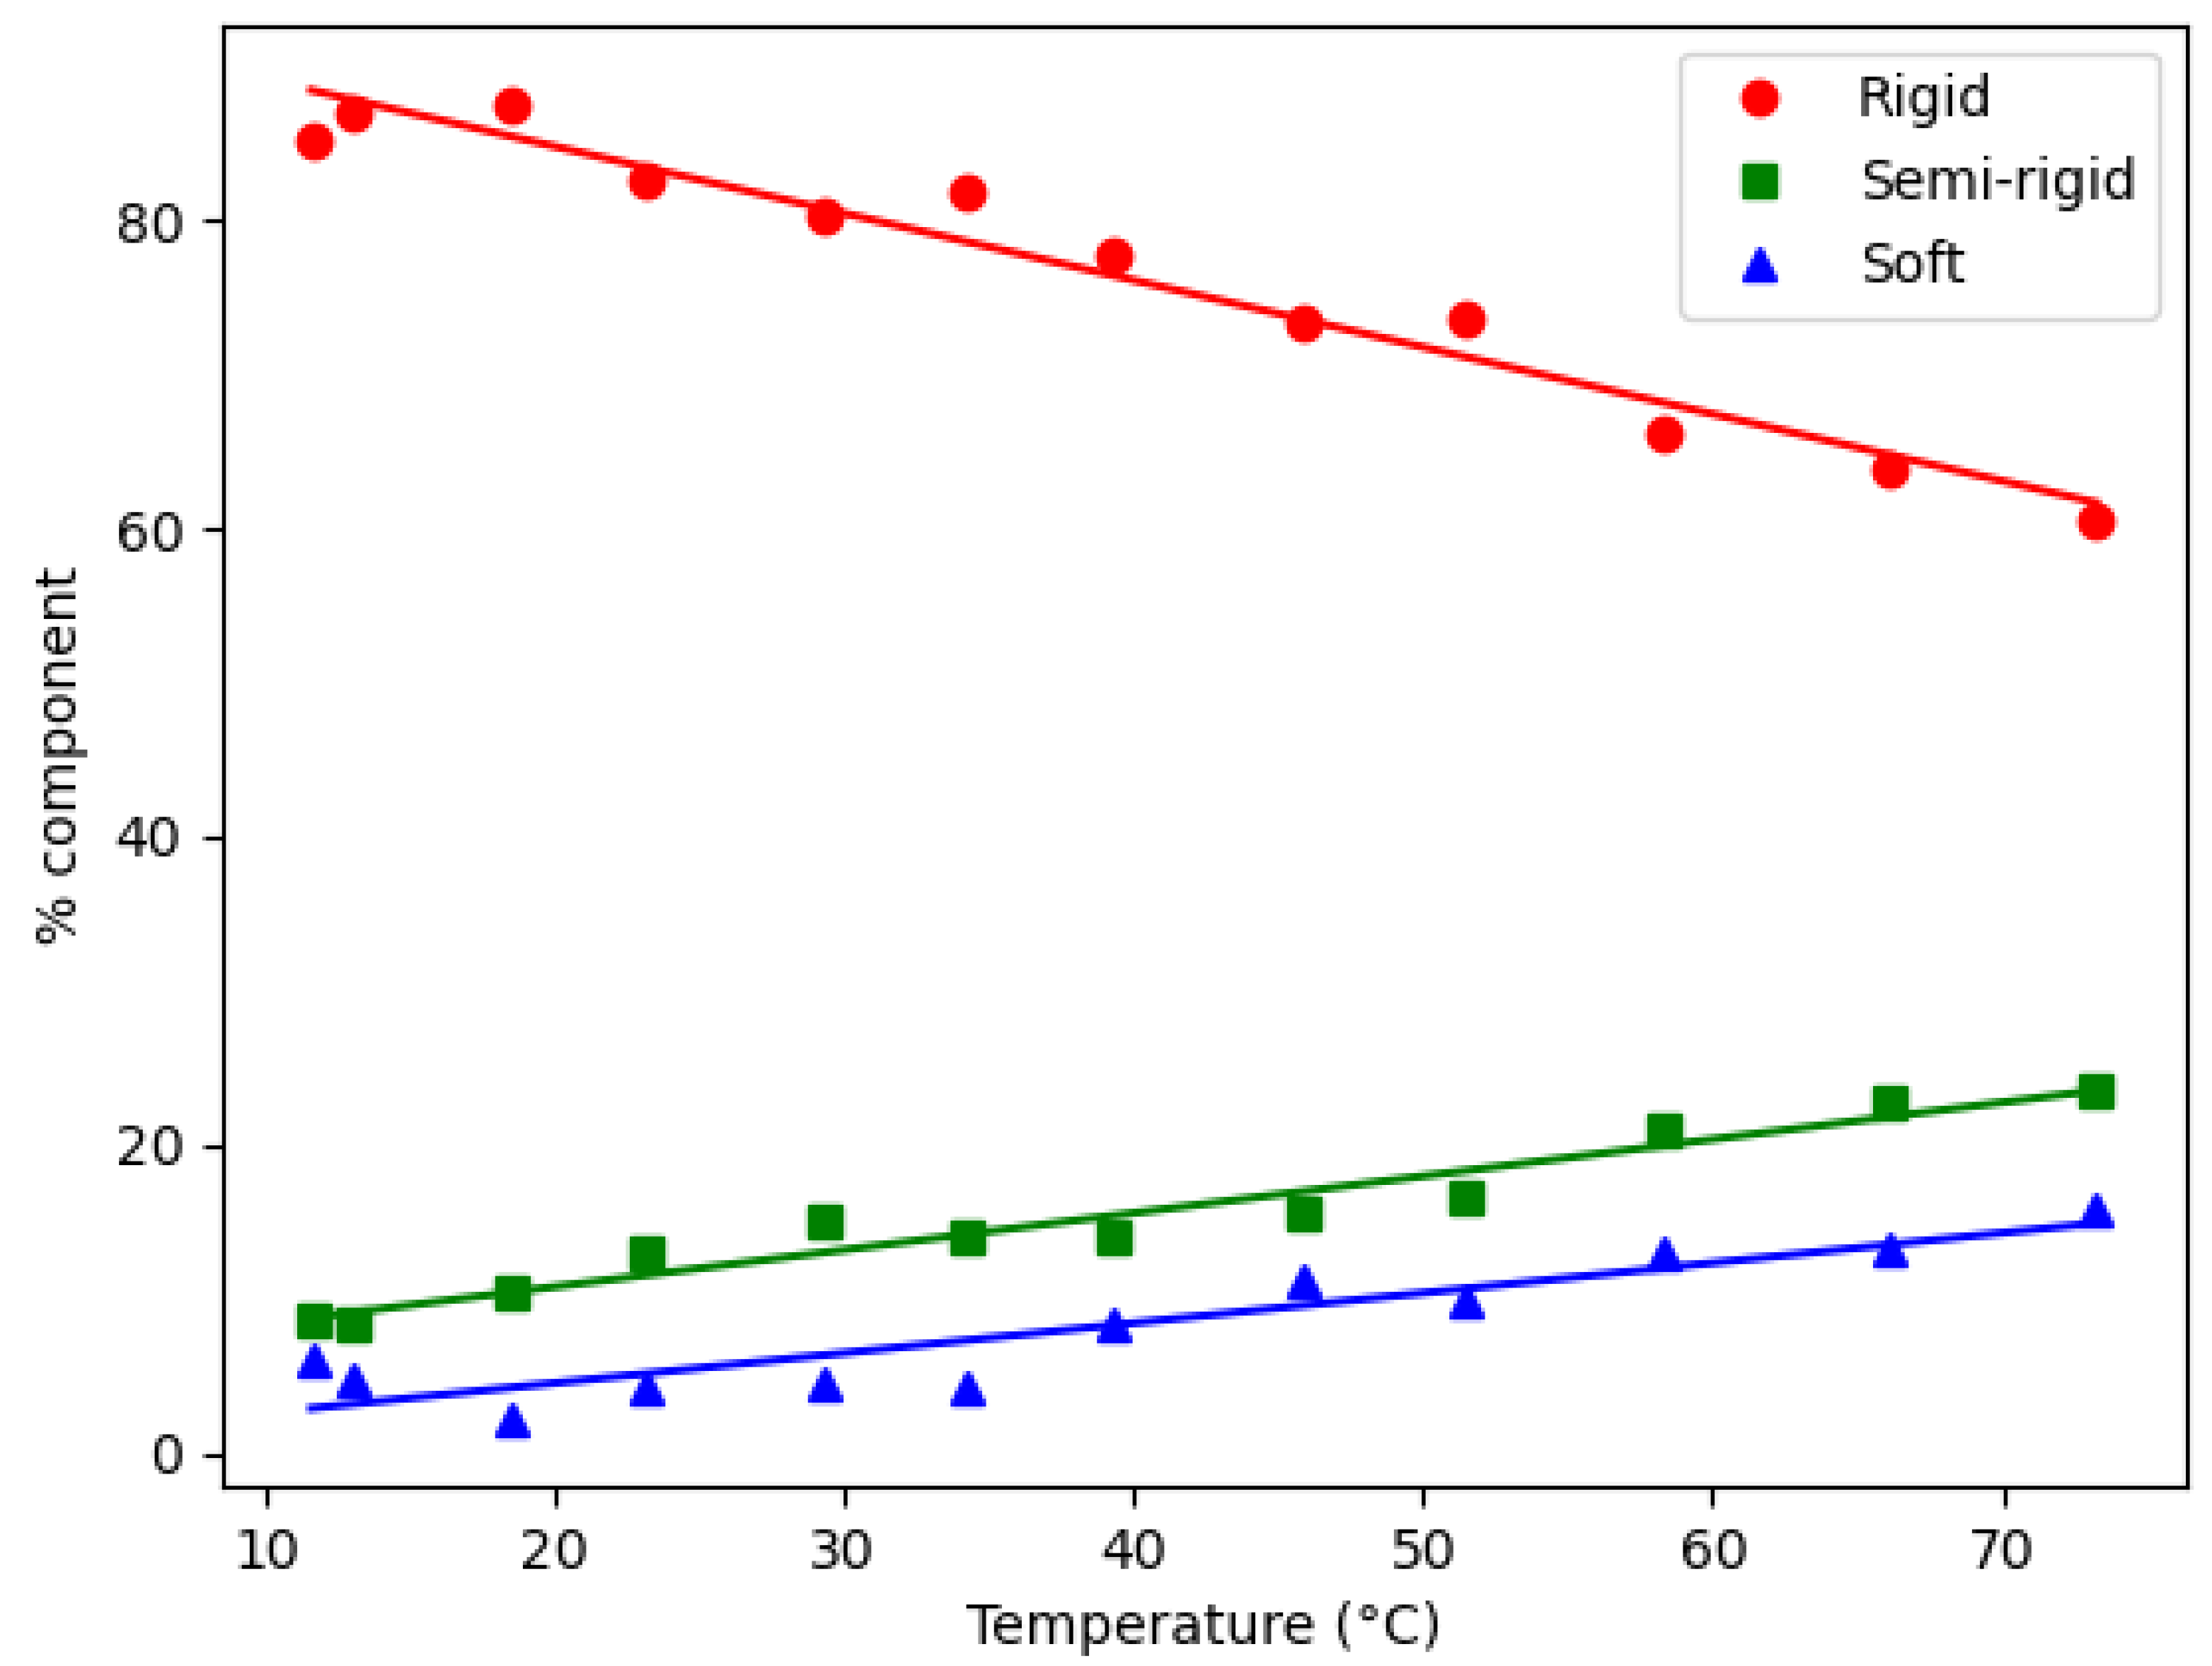
Figure 9.
An NMR spin-lock measurement of the T1 relaxation time of two oils: Red : Brookfield Oil No. B1060 and Blue: Greek olive oil.
Figure 9.
An NMR spin-lock measurement of the T1 relaxation time of two oils: Red : Brookfield Oil No. B1060 and Blue: Greek olive oil.
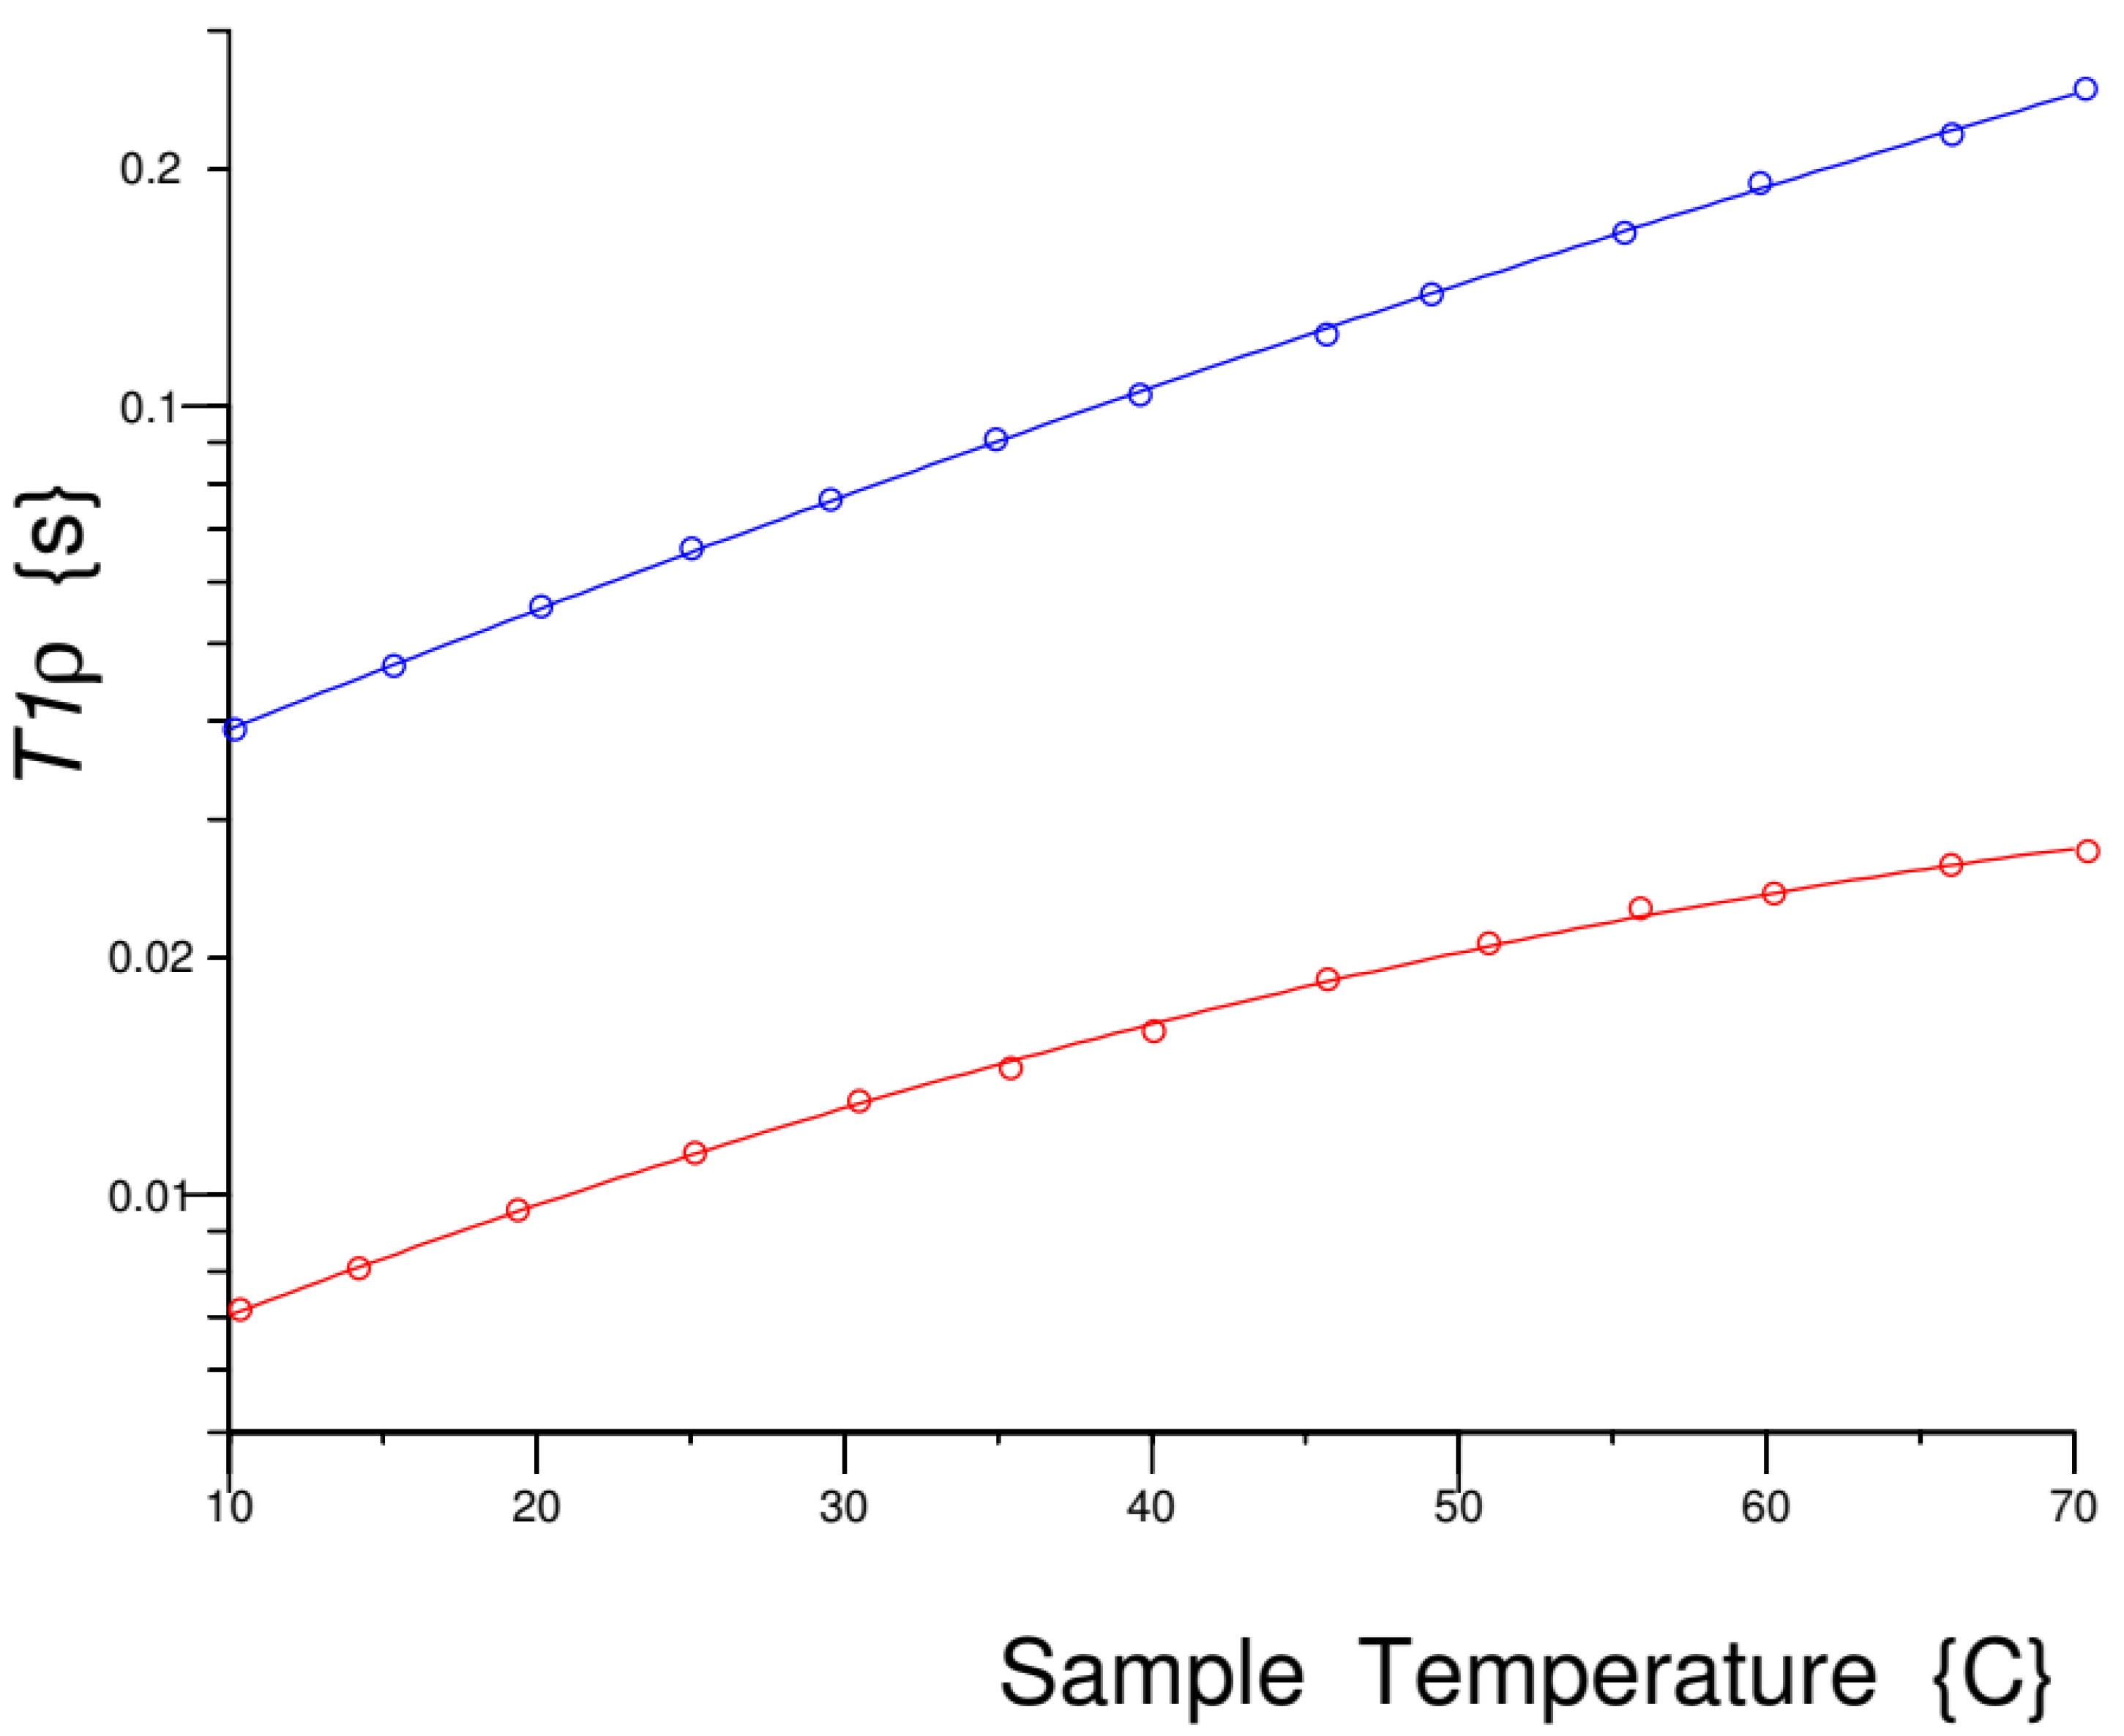
Figure 10.
Temperature dependence of the viscosity of the two oils, from NMR T1.
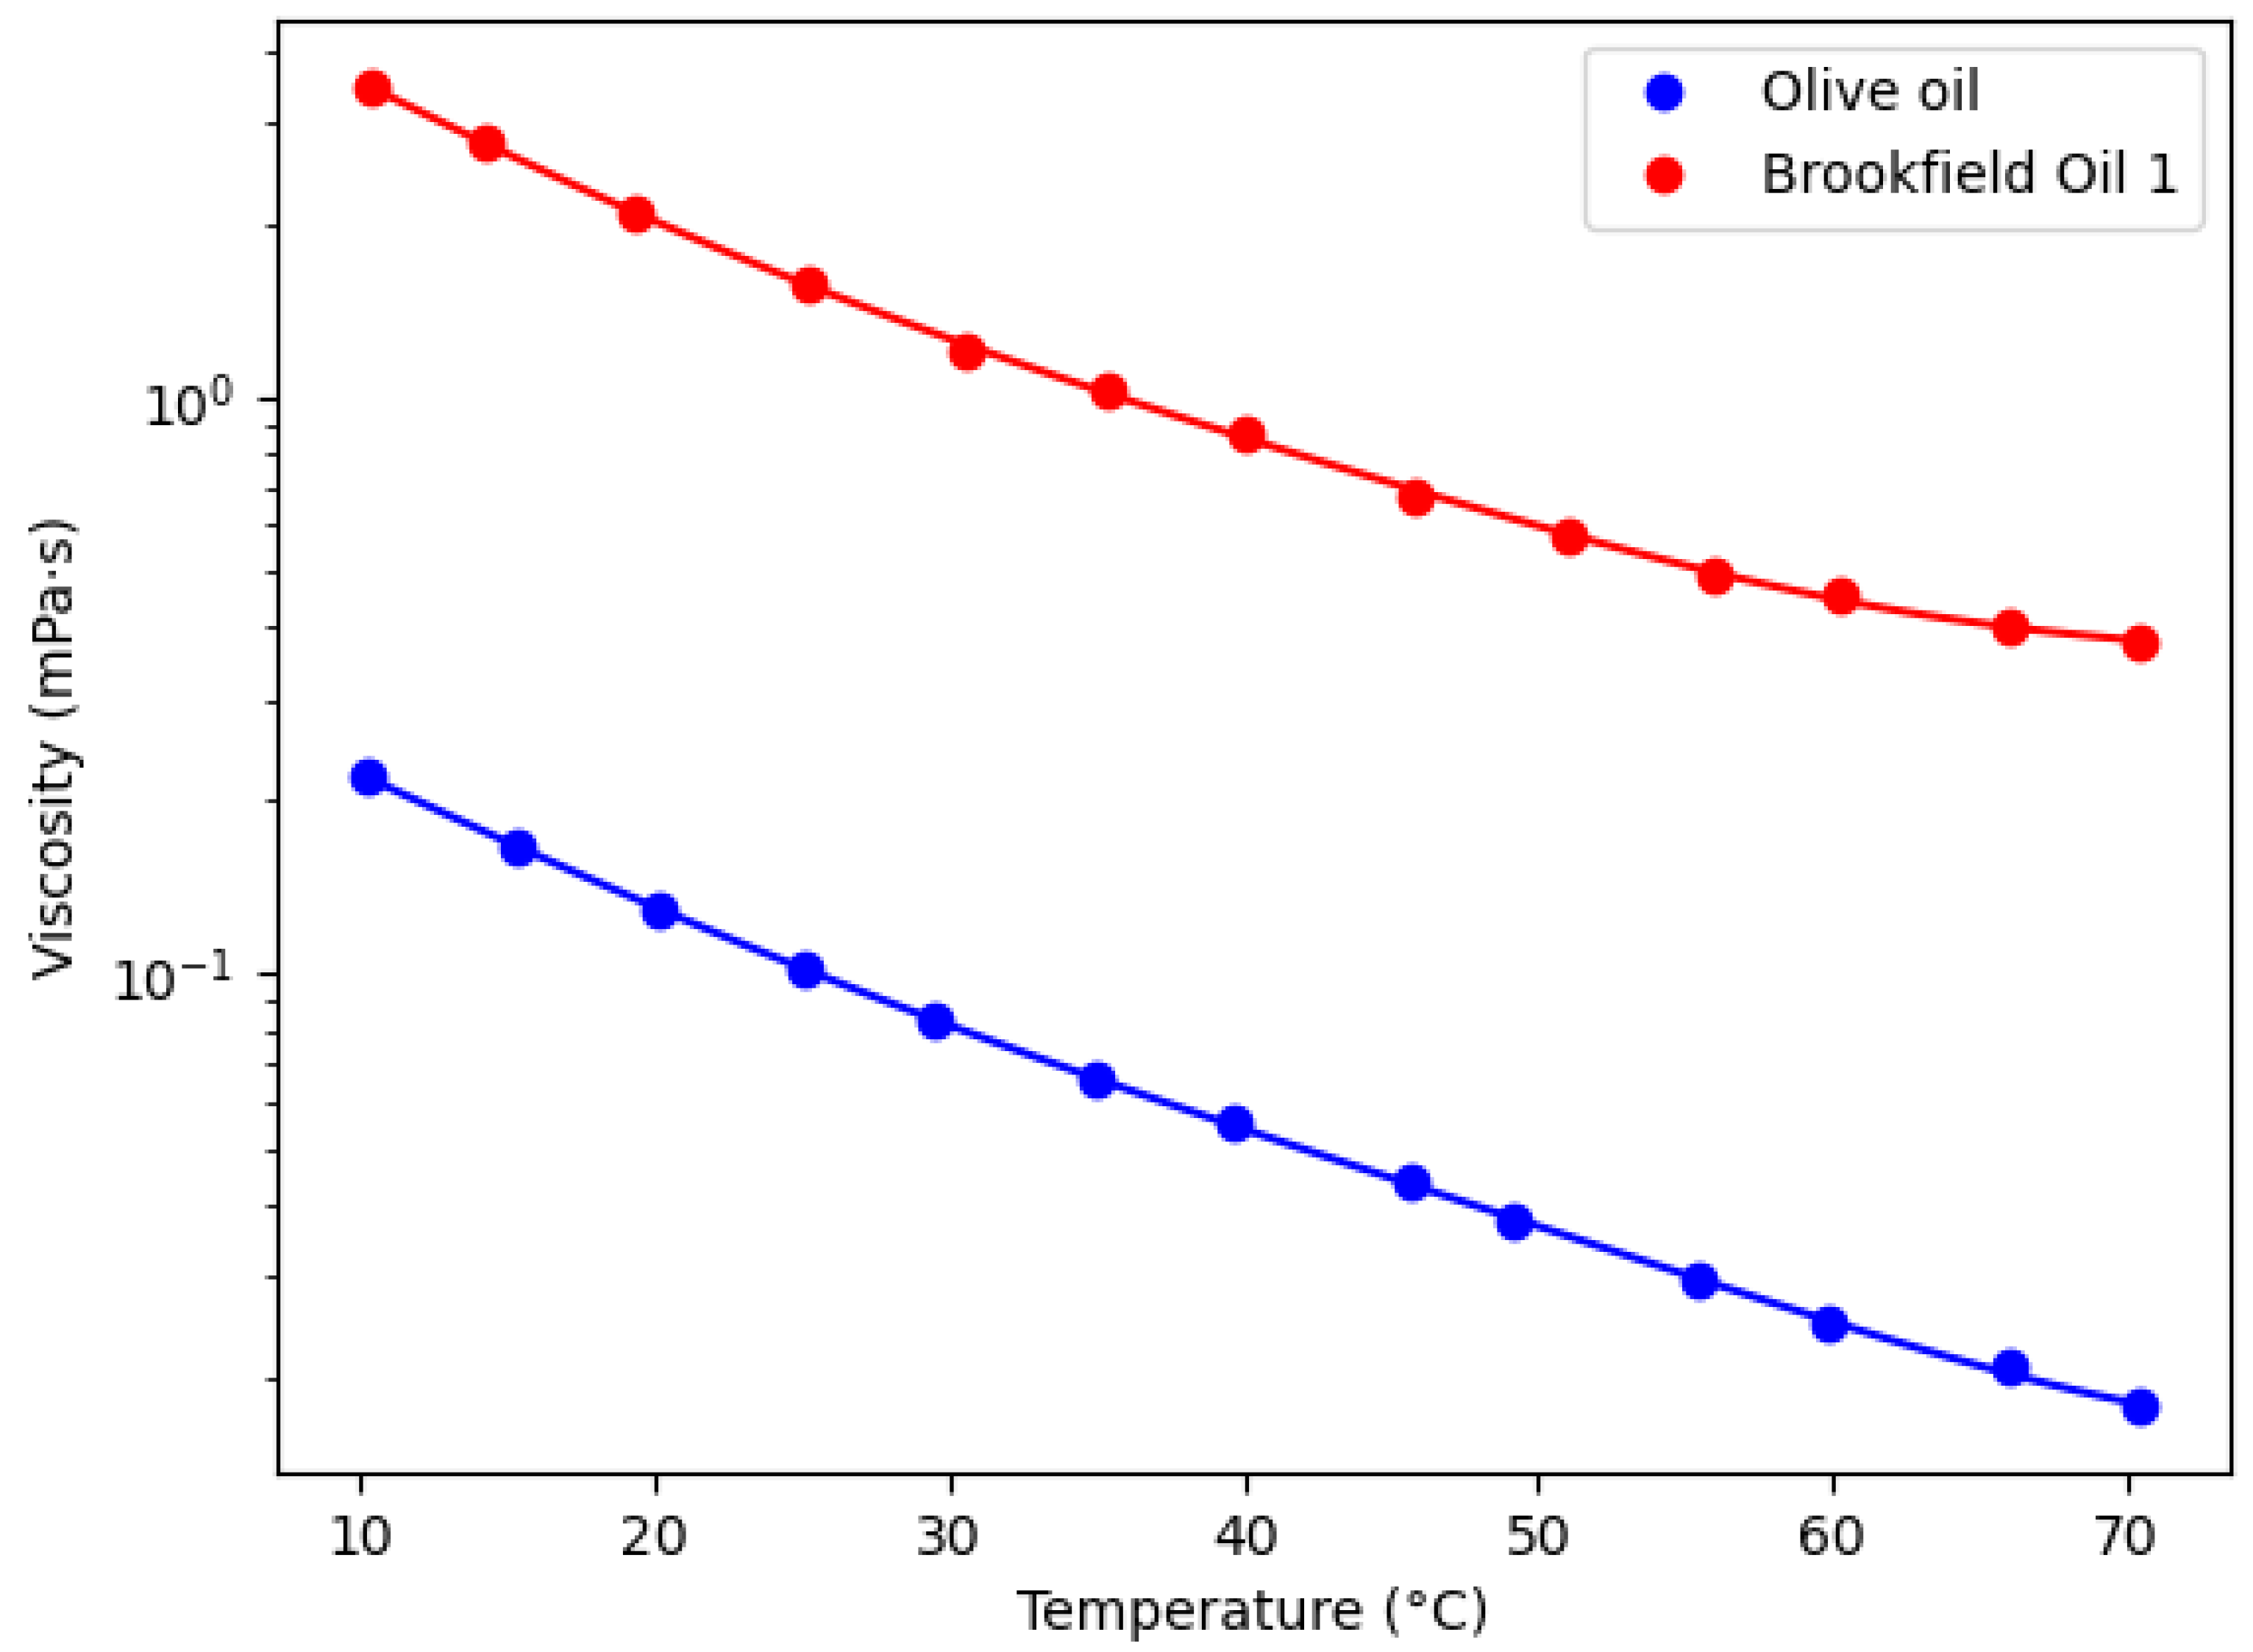
Figure 11.
Arrhenius plots of the viscosity of the two oils. The lines of best fit are modified Vogel–Fulcher–Tammann functions [28].
Figure 11.
Arrhenius plots of the viscosity of the two oils. The lines of best fit are modified Vogel–Fulcher–Tammann functions [28].
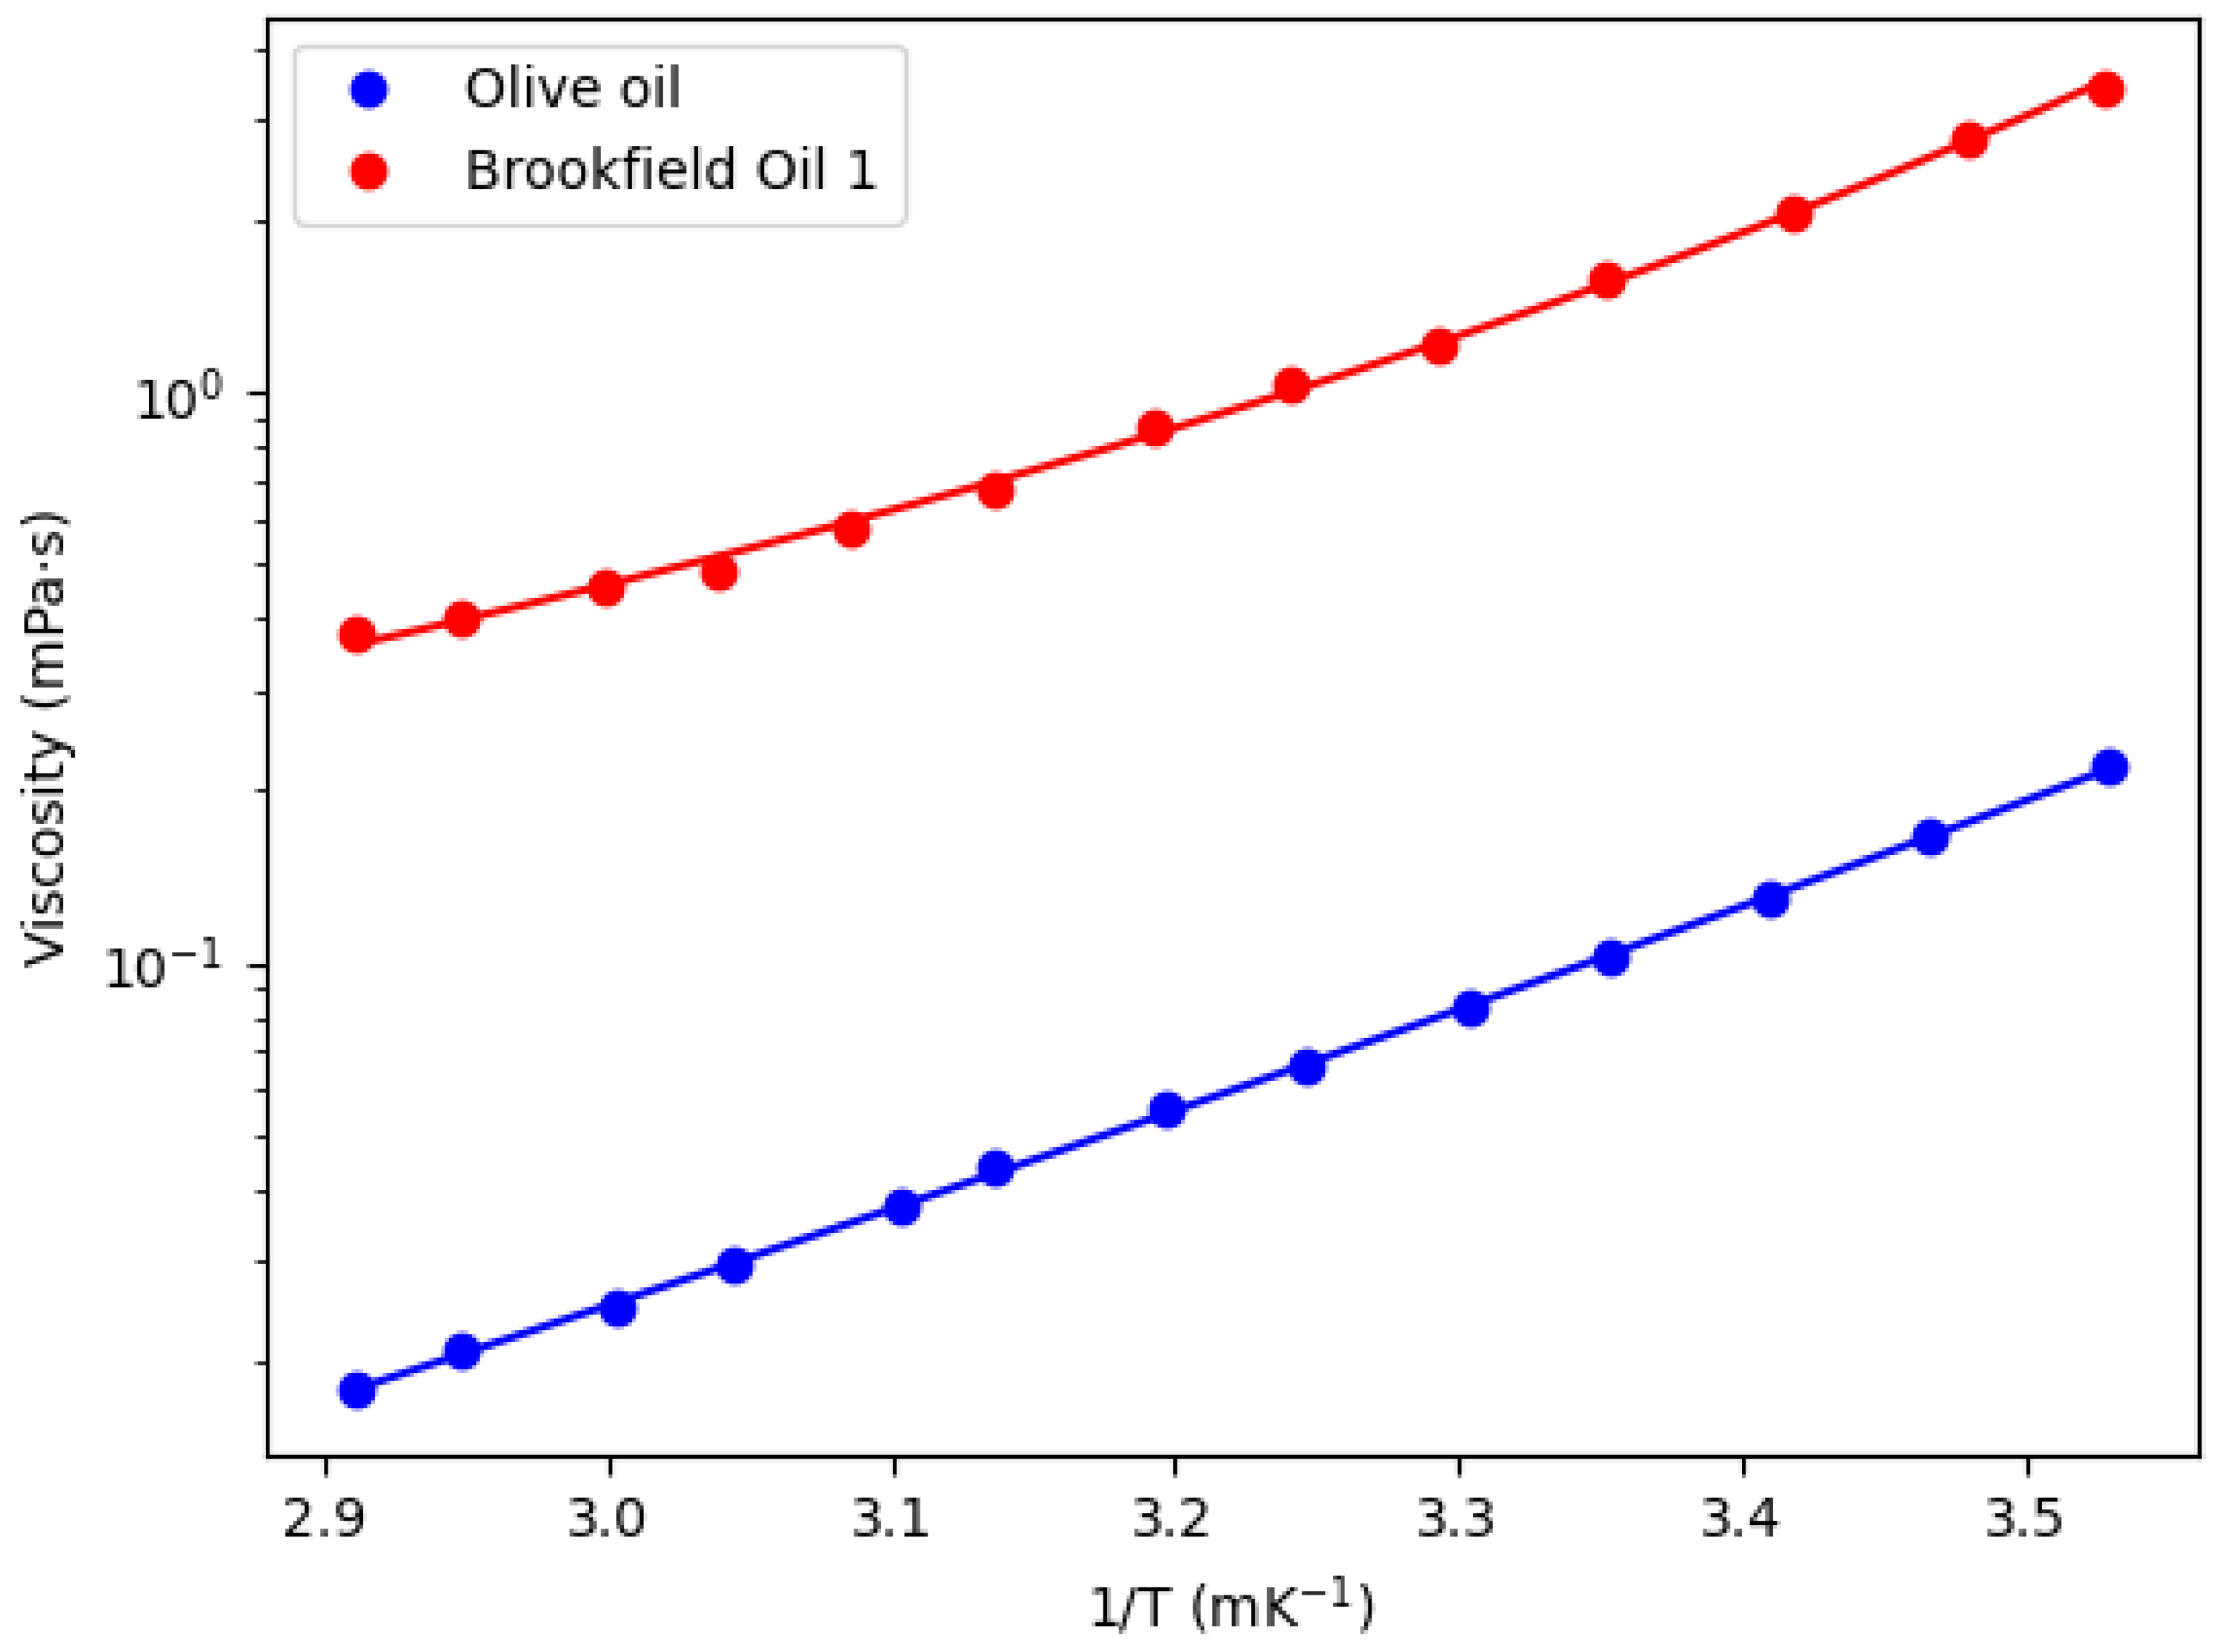

Table 1.
The T1 relaxation times of a Brookfield Engineering oil of calibrated viscosity at 25 °C (1% quoted accuracy), were measured using the Lab-Tools’ MK4 T-D NMR spectrometer at a temperature of 25 °C± °C. The final column uses the calibration curve shown in Figure 7 to evaluate viscosity from the measured T1 relaxation times, as a check on precision.
Table 1.
The T1 relaxation times of a Brookfield Engineering oil of calibrated viscosity at 25 °C (1% quoted accuracy), were measured using the Lab-Tools’ MK4 T-D NMR spectrometer at a temperature of 25 °C± °C. The final column uses the calibration curve shown in Figure 7 to evaluate viscosity from the measured T1 relaxation times, as a check on precision.
| Oil | Brookfield No. | Viscosity (mPa s) (Brookield Data) | Measured T1 (ms) | Viscosity from T1 (mPa s) |
|---|---|---|---|---|
| 1 | B1060 | 1.042 | 15.06 | 0.97285 |
| 2 | B10200 | 10.440 | 3.726674 | 11.1973 |
| 3 | B73000 | 66.410 | 1.436256 | 70.7513 |
| 4 | B360000 | 457.10 | 0.601422 | 431.182 |
Disclaimer/Publisher’s Note: The statements, opinions and data contained in all publications are solely those of the individual author(s) and contributor(s) and not of MDPI and/or the editor(s). MDPI and/or the editor(s) disclaim responsibility for any injury to people or property resulting from any ideas, methods, instructions or products referred to in the content. |
© 2026 by the authors. Licensee MDPI, Basel, Switzerland. This article is an open access article distributed under the terms and conditions of the Creative Commons Attribution (CC BY) license (http://creativecommons.org/licenses/by/4.0/).
Copyright: This open access article is published under a Creative Commons CC BY 4.0 license, which permit the free download, distribution, and reuse, provided that the author and preprint are cited in any reuse.


