

Submitted:
07 May 2026
Posted:
08 May 2026
You are already at the latest version
Abstract
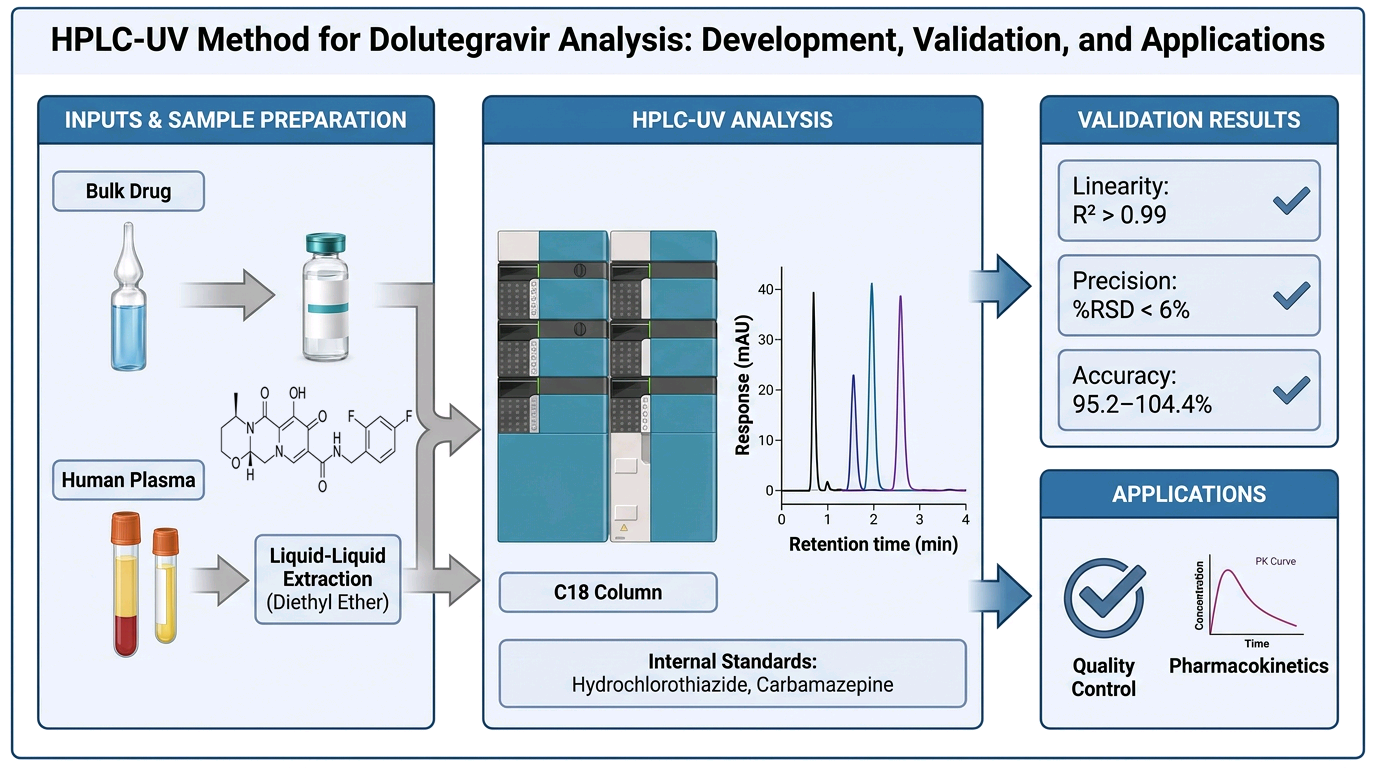
Background/Objectives: Dolutegravir is an integrase strand transfer inhibitor widely used in HIV therapy due to its high resistance barrier and favourable safety profile. As pharmacopoeial coverage continues to evolve and local formulation efforts increase, relia-ble analytical methods are required to ensure drug quality, safety, and efficacy. This study aimed to develop and validate two simple, sensitive, and cost-effective high-performance liquid chromatography with UV detection (HPLC-UV) methods for quantifying dolute-gravir in bulk form and human plasma. Methods: Reverse-phase HPLC methods were developed and validated according to ICH Q2(R2) guidelines. Hydrochlorothiazide and carbamazepine were used as internal standards for bulk and plasma analysis, respective-ly. Chromatographic separation was achieved on C18 columns. Key validation parameters included linearity, accuracy, precision, limit of detection (LOD), limit of quantitation (LOQ), robustness, and system suitability. Plasma samples were prepared using liquid–liquid extraction with diethyl ether. Results: The bulk method showed excellent linearity over 0.5–100 µg/mL with an R2 of 0.9997, while the plasma method was linear over 0.8–10 µg/mL with an R2 of 0.9956. Accuracy ranged from 95.2% to 104.4% for bulk and showed acceptable recoveries for plasma samples. Precision was satisfactory with %RSD values below 6% across all methods. LOD and LOQ were 0.42 µg/mL and 1.26 µg/mL for bulk analysis, and 0.55 µg/ml and 1.68 µg/ml, for plasma analysis respectively. Robustness and system suitability tests confirmed method reliability. Conclusions: The developed HPLC-UV methods are simple, reproducible, and suitable for routine quality control of dolutegravir in pharmaceutical formulations and for its quantification in human plasma for pharmacokinetic applications.
Keywords:
dolutegravir
; high-performance liquid chromatography
; method development
; method validation
; antiretroviral drugs
1. Introduction
The treatment of HIV has witnessed significant advancements over the years, particularly with the introduction of novel antiretroviral therapies [1,2,3,4]. One such breakthrough in HIV management is dolutegravir (DTG), an integrase strand transfer inhibitor (INSTI), which has gained widespread recognition for its efficacy in both treatment-naïve and treatment-experienced individuals [5,6,7,8]. Dolutegravir’s mechanism of action involves the inhibition of the integrase enzyme, crucial for the integration of HIV-1 genetic material into the host DNA, thus preventing viral replication [9,10]. Its introduction has contributed significantly to the improvement of treatment regimens, especially in resource-limited settings, such as Nigeria, where it was incorporated into the National Guidelines for HIV Prevention, Treatment, and Care in 2016 [11].
Before the adoption of dolutegravir, the standard first-line treatment for HIV in Nigeria involved a combination of tenofovir, lamivudine, and efavirenz (TDF + 3TC/FTC + EFV) [12]. However, the inclusion of dolutegravir into alternative regimens has provided a more robust and effective option, potentially improving long-term viral suppression and patient outcomes [13,14]. Although dolutegravir is now well established in clinical practice in Nigeria, the growing interest in its local production and the evolving nature of its representation in major pharmacopoeias underscore the need for reliable analytical methods to ensure its quality, appropriate formulation, and effective use in both pharmaceutical and clinical settings.
Analytical methods are essential for the accurate determination of drug content, quality control, and ensuring therapeutic efficacy [15,16,17]. High-performance liquid chromatography (HPLC) has proven to be one of the most reliable and widely used methods for analysing antiretroviral drugs, including dolutegravir [18,19]. Other techniques, such as UV spectrophotometry, high-performance thin layer chromatography, and liquid chromatography-mass spectrometry, have also been employed for its analysis [20,21,22,23,24,25].
Chromatography, particularly HPLC, is a fundamental separation technique used in analytical chemistry for separating, identifying, and quantifying compounds within a mixture [26,27,28]. It operates on the principle of differential interactions between sample components and the stationary phase, allowing for the effective separation of complex mixtures. The versatility of HPLC makes it a preferred method in pharmaceutical analysis due to its precision, sensitivity, and applicability to a wide range of compounds. It has proven to be an indispensable tool in pharmaceutical analysis. The reverse-phase HPLC method, where a non-polar stationary phase interacts with a polar mobile phase, is particularly effective for pharmaceutical analyses [29], including dolutegravir quantification.
In addition to pharmaceutical quality control, the quantification of dolutegravir in biological matrices such as human plasma is essential for pharmacokinetic studies, therapeutic drug monitoring, and bioavailability assessments [19,30]. Accurate measurement of drug concentrations in plasma requires sensitive, selective, and reproducible analytical methods capable of handling complex biological matrices and potential interferences [30,31,32,33,34,35]. Sample preparation techniques, including liquid–liquid extraction, are often employed to isolate the analyte and improve method performance [36,37]. The use of suitable internal standards further enhances analytical reliability by correcting for variability in extraction efficiency and instrument response.
Given the increasing role of dolutegravir in HIV treatment regimens, there is a need for robust, validated analytical methods to quantify its concentration in both pharmaceutical formulations and biological matrices. This study therefore aimed to develop and validate two separate HPLC UV methods: one for the quantification of dolutegravir in bulk form (using hydrochlorothiazide as internal standard) and another for dolutegravir in human plasma (using carbamazepine as internal standard and liquid-liquid extraction). Both methods were validated according to ICH Q2(R2) guidelines for linearity, accuracy, precision, limits of detection and quantitation, and, where applicable, robustness, system suitability, and ruggedness [38].
2. Results
2.1. Determination of Dolutegravir in Bulk Form
2.1.1. Linearity
2.1.2. Accuracy
Accuracy was evaluated based on the mean percentage recovery of dolutegravir at concentrations of 80, 100, and 120 μg/mL, each containing a constant HCT concentration of 20 μg/mL. Results obtained over 3 days are summarised in Table 2.
2.1.3. Precision
Precision was assessed as intermediate precision at dolutegravir concentrations of 80, 100, and 120 μg/mL. The measured concentrations obtained over 3 days, along with the calculated standard deviation (SD) and relative standard deviation (RSD) values, are presented in Table 3.
2.1.4. Limit of Detection (LOD)
The LOD was calculated using the formula:
where σ = 1.002378 μg/ml (standard deviation of triplicate determinations of DTG at 0.5 μg/ml), and S = 7.9529 (slope of the calibration curve).
Substituting the values:
2.1.5. Limit of Quantitation (LOQ)
The LOQ was calculated using the formula:
With the parameters staying the same, we have:
LOQ = 1.260 μg/ml.
2.2. Determination of Dolutegravir in Human Plasma
2.2.1. Chromatographic Conditions
2.2.2. Linearity and Range
The linearity of the method was assessed over the concentration range of 0.8–10 µg/ml. The calibration data, including peak area ratios and regression parameters, are presented in Table 5. The calibration curve (Figure 4) demonstrated good linearity with a coefficient of determination (R2) of 0.9956.
2.2.3. Accuracy
The accuracy of the method was evaluated at three concentration levels corresponding to 80%, 100%, and 120%. The results, expressed as percentage recovery, are summarised in Table 6.
2.2.4. Precision
2.2.5. Sensitivity (LOD and LOQ)
The LOD and LOQ were calculated to be 0.55 µg/ml and 1.68 µg/ml, respectively, demonstrating the method’s ability to detect and quantify dolutegravir at low concentrations.
2.2.6. Robustness
Robustness was evaluated by introducing small deliberate variations in chromatographic parameters such as flow rate, mobile phase composition, pH, and wavelength. The results are summarised in Table 9.
2.2.7. System Suitability
System suitability parameters were assessed to ensure adequate performance of the chromatographic system. The results are presented in Table 10.
3. Discussion
3.1. Method Development and Relevance of Dolutegravir Analysis
HPLC-UV methods were developed and validated for the analysis of dolutegravir in both bulk form and human plasma. The key objectives of this study, namely the development of robust analytical methods and their validation, were successfully achieved using reversed-phase HPLC approaches. Analytical methods are essential not only for pharmaceutical quality control but also for bioanalytical applications such as pharmacokinetic and bioavailability studies [30,31,32,33,34,35].
Dolutegravir was approved by the FDA in 2013 for the treatment of HIV/AIDS [39], and subsequently by regulatory authorities in Canada and the European Commission in 2014 [40]. In Nigeria, dolutegravir is included in national HIV treatment guidelines [11], further emphasising its clinical importance. Its increasing use, alongside interest in local production, underscores the need for validated analytical methods for both dosage forms and biological matrices.
Dolutegravir is a highly effective antiretroviral agent with a molecular weight of 419.38 g/mol in its active form, and 441.36 g/mol as its sodium salt [41,42,43]. Its chemical structure, characterised by a pyrido-pyrazinone core, underpins its activity as an integrase inhibitor [9,44]. Given its clinical relevance, reliable analytical methods must comply with regulatory expectations such as ICH Q2 (R2) guidelines to ensure accuracy, precision, and reproducibility in both pharmaceutical and clinical settings [38].
3.2. Method Development and Optimization
The development of analytical methods involves careful selection and optimisation of chromatographic conditions to achieve adequate separation, sensitivity, and reproducibility [37,45]. In the present study, reversed-phase HPLC was employed due to its suitability for moderately polar compounds such as dolutegravir [46,47].
For the plasma method, several chromatographic parameters were optimised, including mobile phase composition, pH, flow rate, wavelength, and column selection. The use of a C18 column with a mobile phase consisting of methanol and sodium acetate buffer (pH 4.0) enabled efficient separation of dolutegravir and the internal standard, with good peak symmetry and resolution.
The choice of wavelength (254 nm) was based on the optimal absorbance of dolutegravir, ensuring maximum detector response. Similarly, the selected flow rate (1.2 ml/min) provided a balance between resolution and analysis time. Liquid–liquid extraction using diethyl ether was employed for plasma sample preparation [48,49], yielding clean extracts with minimal interference, thereby enhancing method sensitivity and selectivity.
3.3. Method Validation: Bulk Determination
The linearity of the bulk method demonstrated excellent correlation, with an R2 value of 0.9997 over the concentration range of 0.5–100 μg/mL. According to ICH Q2(R2), linearity reflects the ability of an analytical method to produce results proportional to analyte concentration [38]. These findings are consistent with previously reported methods, including plasma-based and bulk analyses [18,24].
Accuracy, defined as the closeness of agreement between the measured value and the true value [38], is an essential indicator of the trueness of an analytical procedure. In this study, accuracy, expressed as percentage recovery, ranged from 95.2% to 104.4%, indicating good agreement between measured and true values in line with ICH recommendations [38]. Comparable recoveries have been reported in similar studies [18].
Precision refers to the degree of repeatability under normal operating conditions and is typically expressed as the %RSD [38]. The %RSD values in this study ranged from 0.9% to 5.8%, confirming good repeatability and intermediate precision. These values compare favourably with previously reported plasma methods, which showed higher variability [22].
The LOD was calculated to be 0.42 μg/mL, indicating the lowest concentration of dolutegravir detectable by this method without quantification [38]. Similarly, the LOQ was calculated at 1.26 μg/mL, representing the lowest concentration at which dolutegravir can be quantified with accuracy and precision [38]. These values are lower than those reported in a previous study, where the LOD and LOQ were found to be 1.91 µg/mL and 5.17 µg/mL, respectively [18], indicating improved sensitivity of the developed method.
Additionally, the average retention time for dolutegravir was 3.1 min in this study, which is faster than those reported in some other studies. For example, an HPLC-UV method reported a retention time of 4.8 min [22]. Another ultra-performance liquid chromatography method coupled with UV detection yielded a retention time of 4.56 min [50]. The faster retention time observed here underscores the efficiency of the developed method.
3.4. Method Validation: Plasma Determination
The plasma method also demonstrated satisfactory validation characteristics in accordance with ICH guidelines. The optimised chromatographic conditions provided good separation, with dolutegravir exhibiting a retention time of approximately 10.24 min and well-resolved peaks.
Linearity was achieved over the concentration range of 0.8–10 μg/mL, with a coefficient of determination (R2) of 0.9956, indicating a strong linear relationship between concentration and detector response. The calibration curve demonstrated minimal variability, confirming the reliability of the method.
Accuracy results showed acceptable percentage recoveries across the tested concentration levels (80–120%), indicating that the method is capable of producing results close to true values. Precision, assessed at multiple concentration levels, yielded %RSD values below 5.5%, demonstrating good repeatability and reproducibility.
The sensitivity of the plasma method, expressed in terms of LOD and LOQ, confirmed its ability to detect dolutegravir at low concentrations. However, the slightly higher LOD and LOQ values observed in plasma (0.55 µg/mL and 1.68 µg/mL) compared to the bulk method (0.416 µg/mL and 1.260 µg/mL) indicate reduced sensitivity, likely due to matrix effects inherent in biological samples [51,52,53].
Robustness testing demonstrated that small deliberate variations in chromatographic conditions, including pH, mobile phase composition, and detection wavelength, did not significantly affect method performance, as system suitability parameters remained within acceptable limits. However, variation in flow rate resulted in a noticeable decrease in resolution, indicating that this parameter should be carefully controlled to maintain adequate separation. The selection of 254 nm as the detection wavelength was justified by its provision of the highest peak response, indicating enhanced sensitivity, while maintaining acceptable precision, peak symmetry, and resolution. System suitability parameters confirmed the reliability and adequacy of the chromatographic system, as evidenced by appropriate retention factors, excellent resolution between analyte and internal standard, acceptable peak symmetry, high column efficiency, and low injection repeatability (%RSD < 2%).
The use of liquid–liquid extraction provided clean samples with minimal interference, enhancing the selectivity of the method. This makes the method suitable for pharmacokinetic, bioavailability, and bioequivalence studies.
3.5. Comparative Evaluation of Bulk and Plasma Methods
Both methods demonstrated acceptable validation characteristics; however, notable differences were observed due to the nature of the sample matrices [51,52,53]. The bulk method exhibited slightly higher sensitivity and shorter retention time, reflecting the absence of matrix interference and simpler sample preparation.
In contrast, the plasma method required additional sample preparation steps, including extraction and the use of an internal standard, to mitigate matrix effects [53,54]. Despite these complexities, the method showed satisfactory performance, confirming its suitability for bioanalytical applications.
Together, these methods provide complementary analytical tools for the quantification of dolutegravir in pharmaceutical formulations and biological systems, supporting both quality control and clinical studies.
3.6. Limitations of the Study
This study had some limitations that could affect the generalizability and applicability of the findings. For the bulk method, stability studies, robustness testing, and evaluation of interference from excipients or degradation products were not performed. For the plasma method, sample stability issues were observed, with gradual degradation occurring over 24 h, particularly at room temperature. This necessitates the use of freshly prepared samples for accurate analysis, which may increase analytical workload.
Future studies should focus on stability-indicating method development, ruggedness evaluation, and assessment across multiple instruments and laboratories to enhance method applicability.
3.7. Conclusion
In conclusion, reliable and validated HPLC-UV methods were successfully developed for the quantification of dolutegravir in both bulk form and human plasma. The methods demonstrated acceptable linearity, accuracy, precision, and sensitivity in accordance with ICH guidelines.
The bulk method is suitable for routine quality control of pharmaceutical formulations, while the plasma method is applicable to pharmacokinetic and bioanalytical studies. Together, these methods provide a comprehensive analytical framework for the evaluation of dolutegravir in both pharmaceutical and clinical settings.
4. Materials and Methods
4.1. Determination of Dolutegravir in Bulk Form
4.1.1. Materials and Reagents
These included dolutegravir secondary reference standard, Hydrochlorothiazide secondary reference standard (internal standard), purified water (Milli-Q/Direct 8 system; Millipore), methanol (HPLC grade; Merck, Germany), glacial acetic acid, and sodium acetate (BDH Chemicals, Poole, England).
4.1.2. Instrumentation
Chromatographic separations were performed using an Agilent 1260 Infinity quaternary liquid chromatographic system, which included a quaternary pump, an autosampler, a thermostated column compartment, and a diode array detector. Data acquisition and analysis were carried out using the ChemStation software. The weighing of reagents was done with a Mettler Toledo balance (ME 204), and sonication was achieved using an MRC Ultrasonic Cleaner (SN: 2013-190).
4.1.3. Chromatographic Conditions
The chromatographic separations were conducted on a Hypersil BDS C8 column (5 μm particle size, 250 mm × 4 mm). The mobile phase comprised 20 mM sodium acetate buffer (pH 2.20 ± 0.05) and methanol in a 35:65 ratio. The pH of the buffer was adjusted with glacial acetic acid, and the buffer was filtered through a 0.45 μm membrane filter. The mobile phase was pumped isocratically at a flow rate of 1.0 ml/min, with a total run time of 10 min. A 20 μl injection volume was used at ambient temperature, and detection was carried out using a diode array detector at a wavelength of 254 nm.
4.1.4. Preparation of Standard Stock Solutions
Two stock solutions of dolutegravir were prepared in methanol. The first stock solution had a concentration of 2 mg/ml, made by dissolving 8 mg of dolutegravir powder in 4 ml of methanol. The second stock solution, at 100 μg/ml, was prepared by diluting 200 μl of the 2 mg/ml solution with 4 ml of methanol. A stock solution of hydrochlorothiazide (internal standard) was also prepared in methanol at a concentration of 100 μg/ml by dissolving 400 μg of hydrochlorothiazide in 4 ml of methanol. All stock solutions were stored in the refrigerator.
4.1.5. Preparation of Calibration Concentrations
Calibration concentrations of dolutegravir were prepared by diluting the 100 μg/ml and 2 mg/ml stock solutions with a 70:30 water:methanol mixture. The calibration concentrations prepared were 0.5, 1, 5, 10, 60, and 100 μg/ml. For each calibration concentration, a fixed volume of 200 μl of hydrochlorothiazide stock solution (20 μg/ml) was added to ensure a consistent internal standard concentration. The final volume of each solution was adjusted to 1 ml with the diluent.
4.1.6. Method Validation
Linearity
Linearity was assessed by preparing calibration concentrations of dolutegravir ranging from 0.5 to 100 μg/ml. Calibration curves were generated by plotting the average peak areas against the corresponding concentrations. The calibration procedure involved injecting 20 μl of each calibration concentration in triplicate, and the resulting data were used to construct a regression line. Correlation coefficient (R2), slope, intercept, and residuals were evaluated as recommended by ICH Q2(R2) guidelines [38].
Accuracy
The accuracy of the method was determined by analysing dolutegravir concentrations of 80, 100, and 120 μg/ml. In each case, 2 ml of hydrochlorothiazide stock solution was added to achieve a final concentration of 20 μg/ml in a 10 ml final volume. The amounts of dolutegravir and hydrochlorothiazide were determined by applying the peak areas to the regression equation from the calibration curve. The recovery of dolutegravir was calculated over 3 days of testing at each concentration, with three independently prepared replicates per level, in accordance with ICH Q2(R2) recommendations [38].
Precision
Precision was evaluated over 3 days using the same concentrations applied in the accuracy study. Six determinations were performed each day, in the morning and afternoon. The SD and RSD of the results were calculated to assess the method's precision, covering both repeatability (within-day) and intermediate precision (between-day) as defined by ICH Q2(R2) guidelines [38].
LOD
The LOD was calculated using the formula:
where σ represents the standard deviation of the lowest concentration from the calibration curve, and S is the slope of the curve.
LOQ
The LOQ was calculated using the formula:
where σ and S are defined as above.
4.2. Determination of Dolutegravir in Human Plasma
4.2.1. Equipment and Materials
Equipment
Instrumentation included an HPLC system (Agilent Technologies, USA) equipped with a UV/VIS detector and data acquisition software, as well as a pH meter, analytical balance (Mettler Toledo PL 203), fume cupboard, suction pump (Rocker 300, Taiwan), sonicator, vortex mixer, centrifuge, and heating mantle.
Materials
Chromatographic separations were achieved on a C18 reversed-phase Arcus Ep column (5 μm particle size, 250 × 4.6 mm). Additional materials included micropipettes (5–50 μL), 0.45 μm membrane filters, volumetric flasks, polypropylene tubes, test tubes, syringes, syringe filters, and other standard laboratory glassware.
Chemicals and Reagents
Dolutegravir reference standard and carbamazepine (internal standard) were used. The reagents included HPLC-grade methanol, acetonitrile, acetone, anhydrous sodium acetate, and distilled water.
4.2.2. Method Development and Chromatographic Conditions
Preparation of Standard Solutions
A stock solution of dolutegravir (1 mg/ml) was prepared in methanol. Working solutions (1, 10, and 100 μg/ml) were prepared by serial dilution. Moreover, a working internal standard solution of carbamazepine (10 μg/ml) was prepared from a 100 μg/ml stock solution. A fixed volume (50 μL) was added to each sample.
Preparation of Buffer and Mobile Phase
A 0.02 M sodium acetate buffer (pH 4.0) was prepared, adjusted with orthophosphoric acid, and filtered. The mobile phase comprised methanol and sodium acetate buffer (70:30, v/v).
Chromatographic Conditions
Chromatography was performed using a C18 reversed-phase column (250 × 4.6 mm, 5 μm) at ambient temperature. The mobile phase (70:30 methanol:buffer) was pumped at a flow rate of 1.2 ml/min with an injection volume of 20 μl. Detection was carried out using a diode array detector, and the optimal wavelength for dolutegravir analysis was selected from scanned wavelengths (248–270 nm).
4.2.3. Preparation of Calibration Standards
Calibration standards were prepared from working solutions of dolutegravir to yield concentrations of 0.8, 1, 2, 4, 6, 8, and 10 μg/ml. Calibration curves were constructed by plotting peak area against concentration.
4.2.4. Preparation of Plasma Samples
Liquid–liquid extraction was employed for sample preparation. Aliquots (400 μL) of spiked plasma samples were transferred into polypropylene tubes, followed by the addition of 50 μL of internal standard solution. After vortex mixing, 1.0 ml of diethyl ether was added, and the samples were centrifuged at 6000 rpm for 30 min.
The samples were flash-frozen, and the organic layer was separated, evaporated to dryness at 40°C, and reconstituted in the mobile phase. The reconstituted samples were filtered and injected (20 μL) into the HPLC system. The autosampler temperature was maintained at 4°C.
4.2.5. Method Validation
Linearity and Range
Linearity was assessed over the concentration range of 0.8–10 μg/ml. Calibration curves were constructed from triplicate injections, and regression parameters were evaluated.
Accuracy
Accuracy was evaluated at 80%, 100%, and 120% concentration levels (8, 10, and 12 μg/ml) and expressed as percentage recovery.
Precision
Precision (intra-day) was assessed at three concentration levels using replicate analyses, and results were expressed as %RSD. Injection repeatability was also assessed using the 100% concentration level.
LOD and LOQ
LOD and LOQ were determined based on the standard deviation of the response and the slope of the calibration curve using standard equations.
Robustness
Robustness was evaluated by introducing small variations in flow rate, mobile phase composition, pH, and detection wavelength, and assessing their effects on chromatographic performance.
System Suitability
System suitability was determined using replicate injections, evaluating parameters such as retention time, resolution, tailing factor, and theoretical plate count.
Author Contributions
Conceptualization, K.O., A.O.D., and B.C.; methodology, K.O., A.O.D., P.C., A.O.J. and B.C; validation, K.O., A.O.D., P.C., and A.O.J.; formal analysis, K.O., A.O.D., P.C., and A.O.J.; investigation, K.O., A.O.D., P.C., and A.O.J.; resources, K.O., A.O.J, and B.C.; data curation, K.O., A.O.D., P.C., and A.O.J.; writing—original draft preparation, A.O.D.; writing—review and editing, K.O., A.O.D., P.C., A.O.J and B.C; visualization, K.O., A.O.D., P.C., A.O.J. and B.C; supervision, K.O. and B.C.; project administration, K.O. and B.C. All authors have read and agreed to the published version of the manuscript.
Funding
This research received no external funding.
Institutional Review Board Statement
Not applicable.
Informed Consent Statement
Not applicable.
Data Availability Statement
The data presented in this study are available on request from the corresponding author.
Acknowledgments
The authors thank Pharmacist Olubukola Ayinde for providing the dolutegravir secondary reference standard from Adeoyo Maternity Hospital, Yemetu, Ibadan.
Conflicts of Interest
The authors declare no conflicts of interest.
Abbreviations
The following abbreviations are used in this manuscript:
| 3TC | Lamivudine |
| DTG | Dolutegravir |
| EFV | Efavirenz |
| FTC | Emtricitabine |
| HPLC | High-performance liquid chromatography |
| INSTI | Integrase strand transfer inhibitor |
| LOD | Limit of detection |
| LOQ | Limit of quantitation |
| RSD | Relative standard deviation |
| SD | Standard deviation |
| TDF | Tenofovir |
References
- Bailly, F.; Cotelle, P. The Preclinical Discovery and Development of Dolutegravir for the Treatment of HIV. Expert Opin. Drug Discov. 2015, 10, 1243–1253. [CrossRef]
- Fanjul, F.; Gavalda, M.; Campins, A.; Ferré, A.; Martín, L.; Peñaranda, M.; Ribas, M.Á.; Pastor-Ramon, E.; Pinecki, S.; Riera, M. HIV Therapy: The Latest Developments in Antiviral Drugs-A Scoping Review. Biomedicines 2025, 13, 2629. [CrossRef]
- Łupina, K.; Nowak, K.; Lorek, D.; Nowak, A.; Romac, A.; Głowacka, E.; Janczura, J. Pharmacological Advances in HIV Treatment: From ART to Long-Acting Injectable Therapies. Arch. Virol. 2025, 170, 195. [CrossRef]
- Essien, E.J.; Mgbere, O. Long-Acting Antiretroviral Agents in the Prevention and Treatment of HIV/AIDS: A Review of Recent Advances in Sub-Saharan Africa. Int. J. MCH AIDS 2025, 14, e003. [CrossRef]
- Kandel, C.E.; Walmsley, S.L. Dolutegravir - a Review of the Pharmacology, Efficacy, and Safety in the Treatment of HIV. Drug Des. Devel. Ther. 2015, 9, 3547–3555. [CrossRef]
- Bruzzese, E.; Lo Vecchio, A.; Smarrazzo, A.; Tambaro, O.; Palmiero, G.; Bonadies, G.; Guarino, A. Dolutegravir-Based Anti-Retroviral Therapy Is Effective and Safe in HIV-Infected Paediatric Patients. Ital. J. Pediatr. 2018, 44, 37. [CrossRef]
- Dorward, J.; Lessells, R.; Drain, P.K.; Naidoo, K.; de Oliveira, T.; Pillay, Y.; Abdool Karim, S.S.; Garrett, N. Dolutegravir for First-Line Antiretroviral Therapy in Low-Income and Middle-Income Countries: Uncertainties and Opportunities for Implementation and Research. Lancet HIV 2018, 5, e400–e404. [CrossRef]
- Fantauzzi, A.; Mezzaroma, I. Dolutegravir: Clinical Efficacy and Role in HIV Therapy. Ther. Adv. Chronic Dis. 2014, 5, 164–177. [CrossRef]
- Rathbun, R.C.; Lockhart, S.M.; Miller, M.M.; Liedtke, M.D. Dolutegravir, a Second-Generation Integrase Inhibitor for the Treatment of HIV-1 Infection. Ann. Pharmacother. 2014, 48, 395–403. [CrossRef]
- Li, M.; Oliveira Passos, D.; Shan, Z.; Smith, S.J.; Sun, Q.; Biswas, A.; Choudhuri, I.; Strutzenberg, T.S.; Haldane, A.; Deng, N.; et al. Mechanisms of HIV-1 Integrase Resistance to Dolutegravir and Potent Inhibition of Drug-Resistant Variants. Sci. Adv. 2023, 9, eadg5953. [CrossRef]
- Federal Ministry of Health, Nigeria (2016). Integrated national guidelines for HIV prevention, treatment, and care. Available online: http://apps.who.int/medicinedocs/documents/s23252en/s23252en.pdf%0Ahttps://aidsfree.usaid.gov/sites/default/files/ng_national_guidelines_hiv.pdf (accessed on 18 January 2026).
- Abudiore, O.; Amamilo, I.; Campbell, J.; Eigege, W.; Harwell, J.; Conroy, J.; Jiboye, J.; Lufadeju, F.; Amole, C.; Wiwa, O.; et al. High Acceptability and Viral Suppression Rate for First-Line Patients on a Dolutegravir-Based Regimen: An Early Adopter Study in Nigeria. PLoS One 2023, 18, e0284767. [CrossRef]
- Scarsi, K.K.; Havens, J.P.; Podany, A.T.; Avedissian, S.N.; Fletcher, C.V. HIV-1 Integrase Inhibitors: A Comparative Review of Efficacy and Safety. Drugs 2020, 80, 1649–1676. [CrossRef]
- Osterholzer, D.A.; Goldman, M. Dolutegravir: A next-Generation Integrase Inhibitor for Treatment of HIV Infection. Clin. Infect. Dis. 2014, 59, 265–271. [CrossRef]
- Siddiqui, M.R.; AlOthman, Z.A.; Rahman, N. Analytical Techniques in Pharmaceutical Analysis: A Review. Arab. J. Chem. 2017, 10, S1409–S1421. [CrossRef]
- Haque, S.M.; Kabir, A.; Abu-Thabit, N.Y.; Kachhawaha, A.S.; Prajapati, P.; Pa, S.; Siddiqui, M.R. The Advancement of Analytical Techniques in Drug Development and Validation. Crit. Rev. Anal. Chem. 2026, 1–32. [CrossRef]
- Kotadiya, R. Enhancing Pharmaceutical Analysis with Analytical Quality by Design in UHPLC: A Review of Methodological Innovations (2014-2025). Crit. Rev. Anal. Chem. 2025, 1–21. [CrossRef]
- Bhavar, G.B.; Pekamwar, S.S.; Aher, K.B.; Thorat, R.S.; Chaudhari, S.R. High-Performance Liquid Chromatographic and High-Performance Thin-Layer Chromatographic Method for the Quantitative Estimation of Dolutegravir Sodium in Bulk Drug and Pharmaceutical Dosage Form. Sci. Pharm. 2016, 84, 305–320. [CrossRef]
- Tempestilli, M.; Ammassari, A.; D’Avolio, A.; Cicalini, S.; Gallo, A.L.; Fazio, S.; Antinori, A.; Pucillo, L.P. Development and Validation of an HPLC-UV Method for Quantification of Elvitegravir and Two Other New Antiretrovirals, Dolutegravir and Rilpivirine, in the Plasma of HIV-Positive Patients. Biomed. Chromatogr. 2018, 32, e4274. [CrossRef]
- Akinloye, A.; Eniayewu, O.; Adeagbo, B.; Bolaji, O.; Olagunju, A. Validation and Clinical Application of a Liquid Chromatography-Ultraviolet Detection Method to Quantify Dolutegravir in Dried Blood Spots. Ther. Drug Monit. 2022, 44, 430–437. [CrossRef]
- Rackow, A.R.; Pandey, A.; Price, A.L.; Marzinke, M.A. Rapid and Sensitive Liquid Chromatographic-Tandem Mass Spectrometric Methods for the Quantitation of Dolutegravir in Human Plasma and Breast Milk. J. Mass Spectrom. Adv. Clin. Lab 2024, 34, 1–7. [CrossRef]
- Charbe, N.; Baldelli, S.; Cozzi, V.; Castoldi, S.; Cattaneo, D.; Clementi, E. Development of an HPLC-UV Assay Method for the Simultaneous Quantification of Nine Antiretroviral Agents in the Plasma of HIV-Infected Patients. J. Pharm. Anal. 2016, 6, 396–403. [CrossRef]
- Kalpana, T.; Rajeswari, T.R.; Ganji, R. Development and Validation of Analytical Method for Determination of Dolutegravir Sodium, Lamivudine and Tenofovir Disoproxil Fumarate Using Reverse Phase High Performance Liquid Chromatography. Der Pharma Chemica 2017, 9, 117–127.
- Satyadev, T.N.V.S.S; Bhargavi, Ch.; Syam, S.B. Development and Validation of High Performance Liquid Chromatographic Method for the Determination of Dolutegravir in Human Plasma. Der Pharmacia Sinica 2015, 6, 65–72.
- Bennetto-Hood, C.; Tabolt, G.; Savina, P.; Acosta, E.P. A Sensitive HPLC-MS/MS Method for the Determination of Dolutegravir in Human Plasma. J. Chromatogr. B Analyt. Technol. Biomed. Life Sci. 2014, 945–946, 225–232. [CrossRef]
- Thammana, M. A Review on High Performance Liquid Chromatography (HPLC). J. Pharm. Anal. 2016, 5, 22–28.
- Ayyildiz, H.F.; Memon, F.N.; Mangi, I.A.; Kara, H. Separation and Identification of Different Therapeutic Pharmaceutical Drugs on Humic Acid-Based HPLC Column: Method Optimization Using Central Composite Design. J. Sep. Sci. 2023, 46, e2200914. [CrossRef]
- Sobolewska, E.; Biesaga, M. High-Performance Liquid Chromatography Methods for Determining the Purity of Drugs with Weak UV Chromophores - A Review. Crit. Rev. Anal. Chem. 2025, 55, 419–433. [CrossRef]
- Yabré, M.; Ferey, L.; Somé, I.T.; Gaudin, K. Greening Reversed-Phase Liquid Chromatography Methods Using Alternative Solvents for Pharmaceutical Analysis. Molecules 2018, 23. [CrossRef]
- Duan, L.; Dash, S.; Eguchi, M.; Fratte, R.D.; Stephen, Z.R.; Ho, R.J. Novel Liquid Chromatography-Tandem Mass Spectrometry Method for Simultaneous Detection of Three Anti-HIV Drugs Tenofovir, Lamivudine, and Dolutegravir in Plasma. J. Pharm. Sci. 2025, 114, 103927. [CrossRef]
- Guo, Z.-X.; Wu, Y.-E.; Shi, H.-Y.; van den Anker, J.; Liang, P.; Zheng, Y.; Zhao, X.-W.; Feng, R.; Zhao, W. A Liquid Chromatography-Tandem Mass Spectrometry Method for Simultaneous Quantification of Thirty-Nine Tyrosine Kinase Inhibitors in Human Plasma. J. Pharm. Biomed. Anal. 2023, 224, 115159. [CrossRef]
- Cafaro, A.; Mariani, M.; Pigliasco, F.; Baiardi, G.; Barco, S.; Biondi, M.; Mesini, A.; Russo, C.; Saffioti, C.; Mattioli, F.; et al. Liquid Chromatography-Tandem Mass Spectrometry Method for Therapeutic Drug Monitoring of Dalbavancin in Plasma of Pediatric and Young Adult Patients. Ther. Drug Monit. 2025, 47, 363–369. [CrossRef]
- He, X.; Zhang, W.; Xie, F. Liquid Chromatography-Tandem Mass Spectrometry Methods for Clinical Quantitation of Antibiotics. Bioanalysis 2025, 17, 817–833. [CrossRef]
- Mahesh, P.; Haque, M.A. A Validated Quantitative LC-MS/MS Method for Determination of Deucravacitinib in Rat Plasma and Its Application to a Pharmacokinetic Study. Biomed. Chromatogr. 2025, 39, e70169. [CrossRef]
- Zhang, Y.-Y.; Wang, J.; Guo, H.-L.; Wu, S.-Y.; Zhang, H.-F.; Zheng, P.-F.; Miao, H.-J.; Chen, F. A Validated LC-ESI-MS/MS Assay for Simultaneous Plasma Quantification of 11 Antimicrobials to Support Personalized Dosing in Critically Ill Children. Front. Mol. Biosci. 2026, 13, 1745458. [CrossRef]
- Wu, L.; Zhang, X.; Liao, N.; Ye, Z.; Yu, X.; Liu, X. A Validated UPLC-MS/MS Method for the Quantification of Immunosuppressive Drugs in Peripheral Blood Mononuclear Cells Using Liquid-Liquid Extraction with Low Temperature Purification without Complex Pretreatment Steps. J. Pharm. Biomed. Anal. 2024, 250, 116389. [CrossRef]
- Lentzas, A.; Venekamp, N.; Beijnen, J.H.; van Tellingen, O. Development and Validation of an LC-MS/MS Method for Simultaneous Quantification of Eight Drugs in Plasma and Brain: Application in a Pharmacokinetic Study in Mice. J. Chromatogr. B Analyt. Technol. Biomed. Life Sci. 2024, 1247, 124308. [CrossRef]
- International Council for Harmonisation of Technical Requirements for Pharmaceuticals for Human Use (2023). Validation of Analytical Procedures: ICH Q2(R2). Available online: https://database.ich.org/sites/default/files/ICH_Q2(R2)_Guideline_2023_1130.pdf (accessed on 18 January 2026).
- Shah, B.M.; Schafer, J.J.; Desimone, J.A., Jr Dolutegravir: A New Integrase Strand Transfer Inhibitor for the Treatment of HIV. Pharmacotherapy 2014, 34, 506–520. [CrossRef]
- Ballantyne, A.D.; Perry, C.M. Dolutegravir: First Global Approval. Drugs 2013, 73, 1627–1637. [CrossRef]
- Castellino, S.; Moss, L.; Wagner, D.; Borland, J.; Song, I.; Chen, S.; Lou, Y.; Min, S.S.; Goljer, I.; Culp, A.; et al. Metabolism, Excretion, and Mass Balance of the HIV-1 Integrase Inhibitor Dolutegravir in Humans. Antimicrob. Agents Chemother. 2013, 57, 3536–3546. [CrossRef]
- Weller, S.; Borland, J.; Chen, S.; Johnson, M.; Savina, P.; Wynne, B.; Wajima, T.; Peppercorn, A.F.; Piscitelli, S.C. Pharmacokinetics of Dolutegravir in HIV-Seronegative Subjects with Severe Renal Impairment. Eur. J. Clin. Pharmacol. 2014, 70, 29–35. [CrossRef]
- Chan, A.; Tseng, A. Selected Properties of Dolutegravir. Available online: https://hivclinic.ca/main/drugs_properties_files/Integrase%20Inhibitor%20dolutegravir.pdf (accessed on 18 January 2026).
- Hare, S.; Smith, S.J.; Métifiot, M.; Jaxa-Chamiec, A.; Pommier, Y.; Hughes, S.H.; Cherepanov, P. Structural and Functional Analyses of the Second-Generation Integrase Strand Transfer Inhibitor Dolutegravir (S/GSK1349572). Mol. Pharmacol. 2011, 80, 565–572. [CrossRef]
- Li, T.; Huang, B.; Li, D.; Zhu, Y.; Ding, L.; Shu, C. Development and Validation of a Specific and Sensitive LC-MS/MS Method for Determination of Eslicarbazepine in Human Plasma and Its Clinical Pharmacokinetic Study. J. Chromatogr. B Analyt. Technol. Biomed. Life Sci. 2019, 1112, 61–66. [CrossRef]
- Ganesh, V.; Poorna Basuri, P.; Sahini, K.; Nalini, C.N. Retention Behaviour of Analytes in Reversed-Phase High-Performance Liquid Chromatography-A Review. Biomed. Chromatogr. 2023, 37, e5482. [CrossRef]
- Canene-Adams, K. Reverse-Phase HPLC Analysis and Purification of Small Molecules. Methods Enzymol. 2013, 533, 291–301. [CrossRef]
- Aydoğdu, M.; Ertaş, H.; Ertaş, F.N.; Akgür, S.A. Liquid-Liquid Extraction Solvent Selection for Comparing Illegal Drugs in Whole Blood and Dried Blood Spot with LC-MS-MS. J. Anal. Toxicol. 2025, 49, 26–35. [CrossRef]
- Hammad, S.F.; Abdallah, I.A.; Bedair, A.; Mansour, F.R. Salting-out Induced Liquid-Liquid Microextraction for Alogliptin Benzoate Determination in Human Plasma by HPLC/UV. BMC Chem. 2021, 15, 2. [CrossRef]
- Wang, X.; Penchala, S.D.; Amara, A.; Else, L.; McClure, M.; Boffito, M. A Validated Method for Quantification of Dolutegravir Using Ultra Performance Liquid Chromatography Coupled with UV Detection. Ther. Drug Monit. 2016, 38, 327–331. [CrossRef]
- Nasiri, A.; Jahani, R.; Mokhtari, S.; Yazdanpanah, H.; Daraei, B.; Faizi, M.; Kobarfard, F. Overview, Consequences, and Strategies for Overcoming Matrix Effects in LC-MS Analysis: A Critical Review. Analyst 2021, 146, 6049–6063. [CrossRef]
- Huppertz, B.; Möller-Friedrich, S.; Baum, K. Matrix Effects of Urine Marker Substances in LC-MS/MS Analysis of Drug of Abuse. Ther. Drug Monit. 2024, 46, 118–126. [CrossRef]
- Fu, Y.; Li, W.; Picard, F. Assessment of Matrix Effect in Quantitative LC-MS Bioanalysis. Bioanalysis 2024, 16, 631–634. [CrossRef]
- Rebane, R.; Herodes, K. Matrix Interference in LC-ESI-MS/MS Analysis of Metanephrines in Protein Precipitated Plasma Samples. Eur. J. Mass Spectrom. (Chichester, Eng.) 2020, 26, 46–54. [CrossRef]
Figure 1.
Average peak area against dolutegravir concentrations.
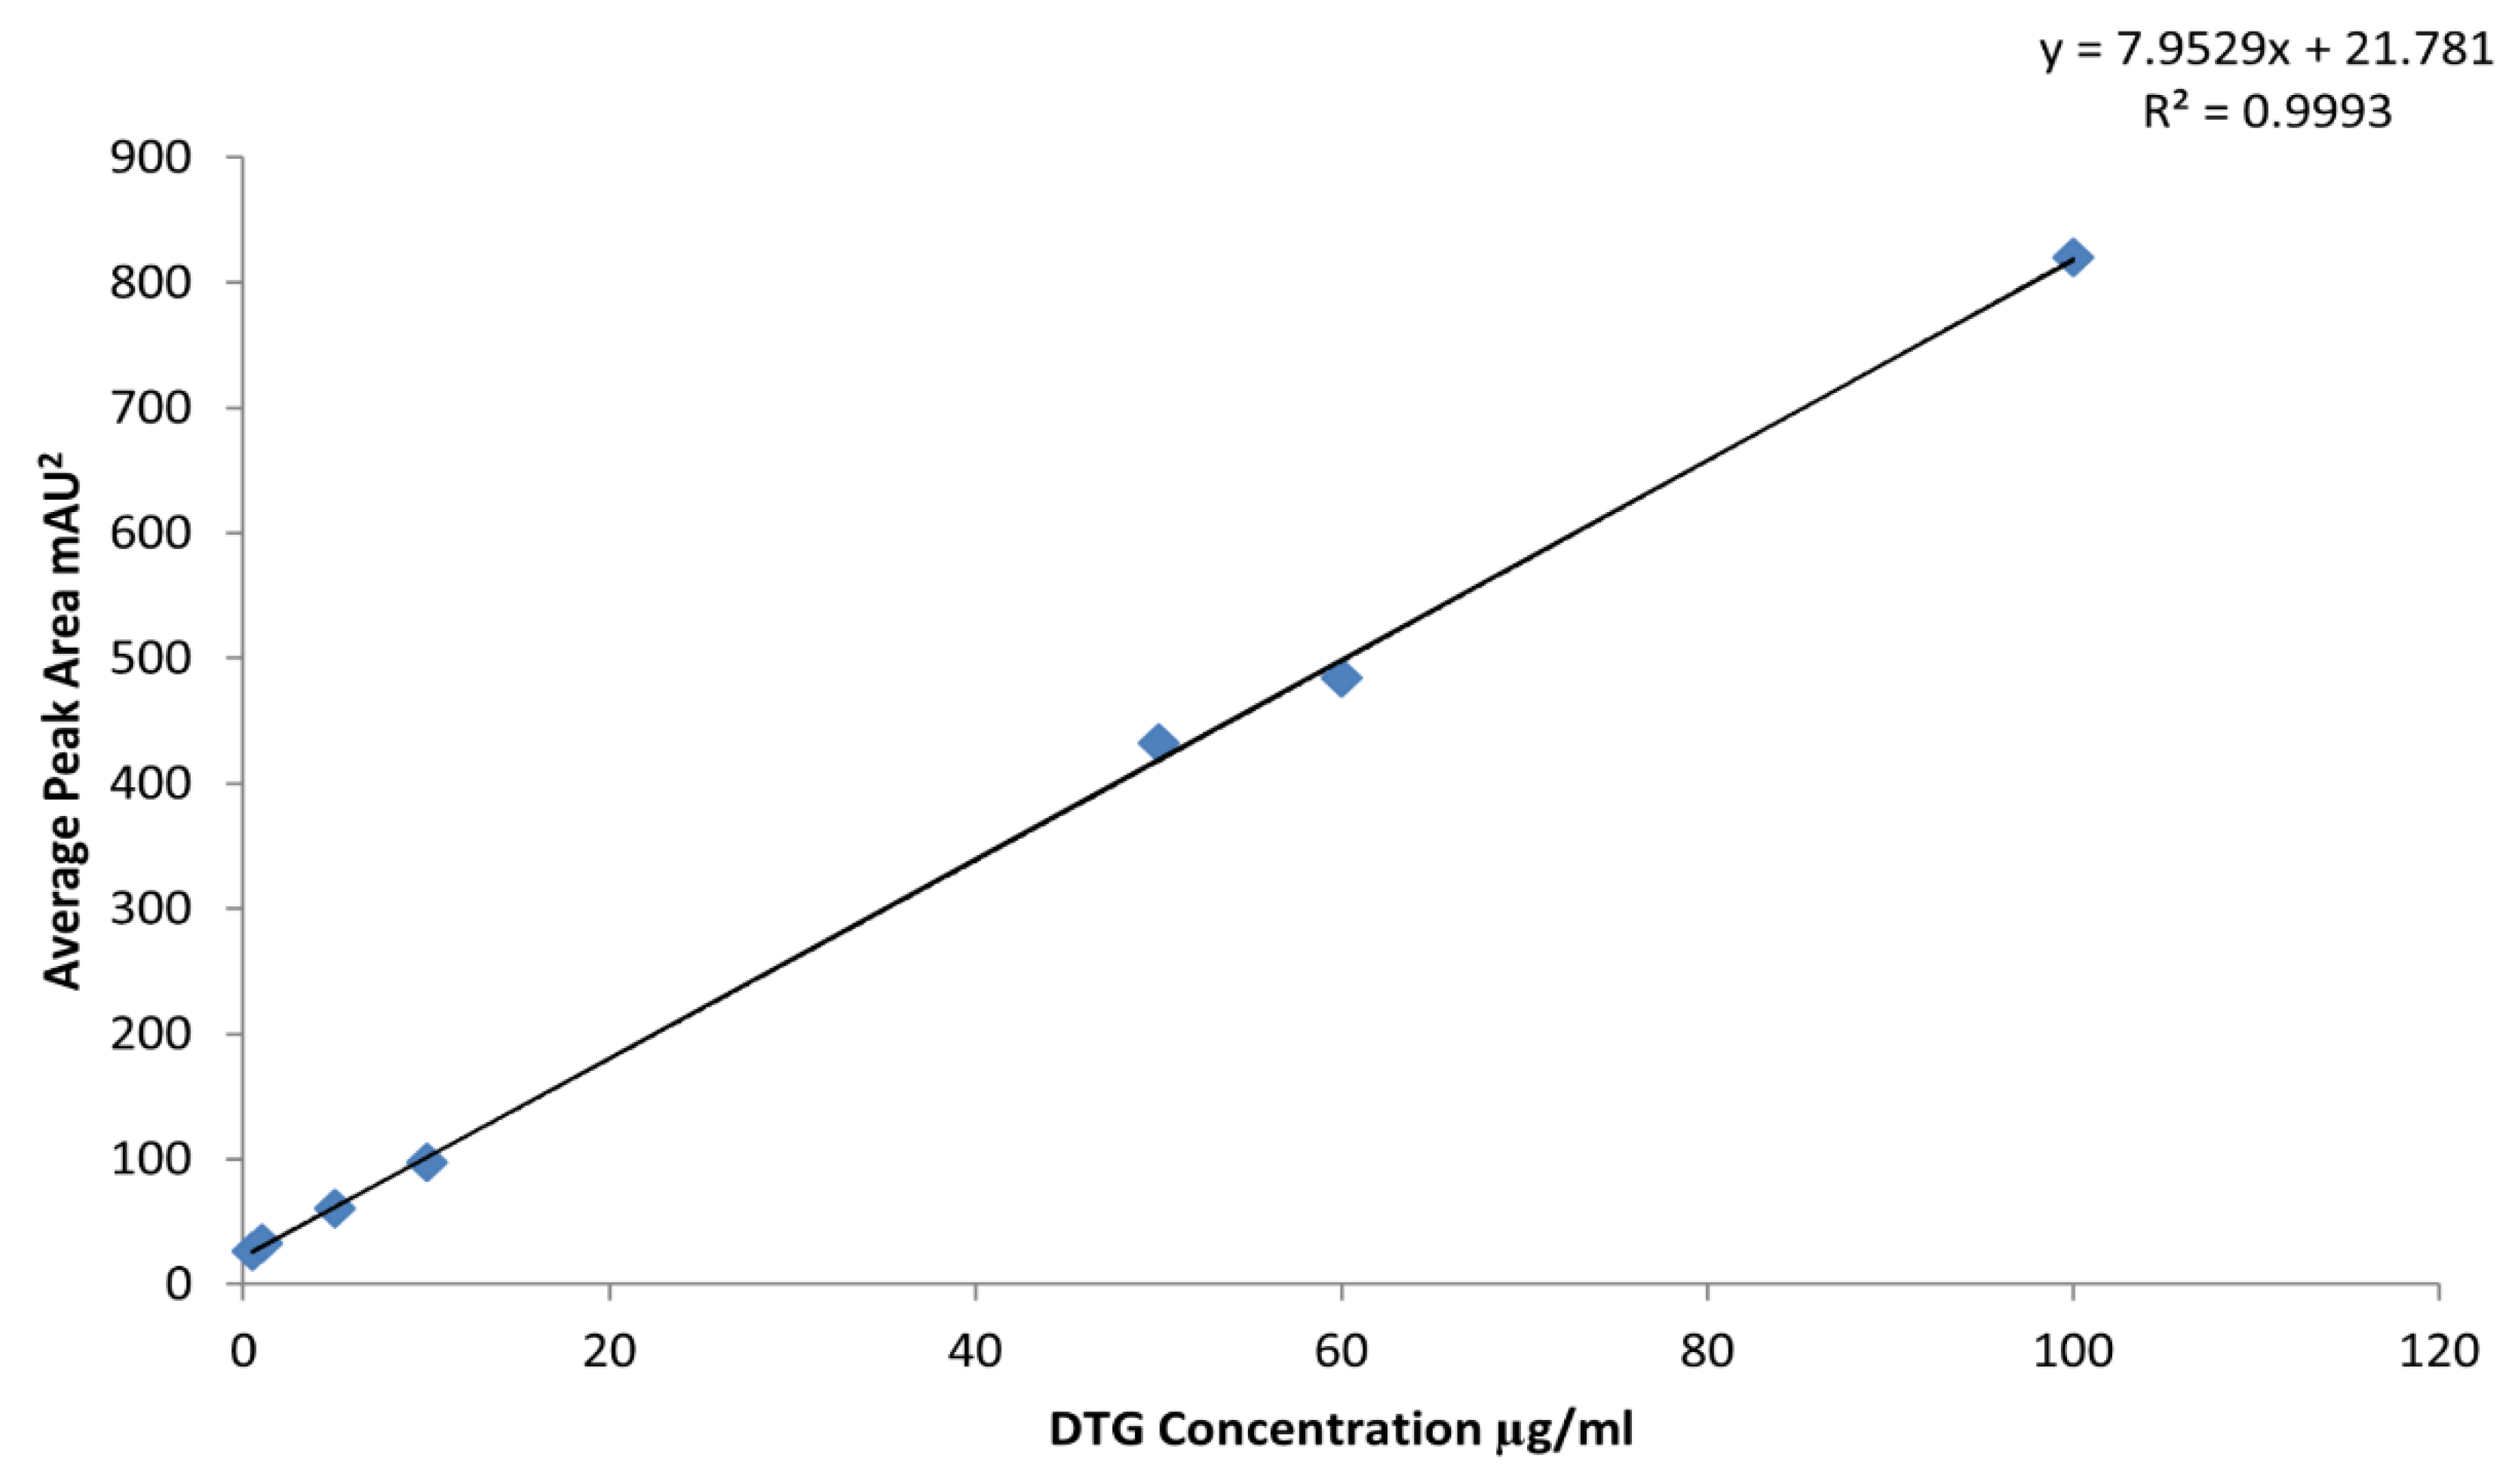
Figure 2.
Typical HPLC chromatogram showing hydrochlorothiazide (20 μg/mL, first peak) and dolutegravir (100 μg/mL, second peak).
Figure 2.
Typical HPLC chromatogram showing hydrochlorothiazide (20 μg/mL, first peak) and dolutegravir (100 μg/mL, second peak).
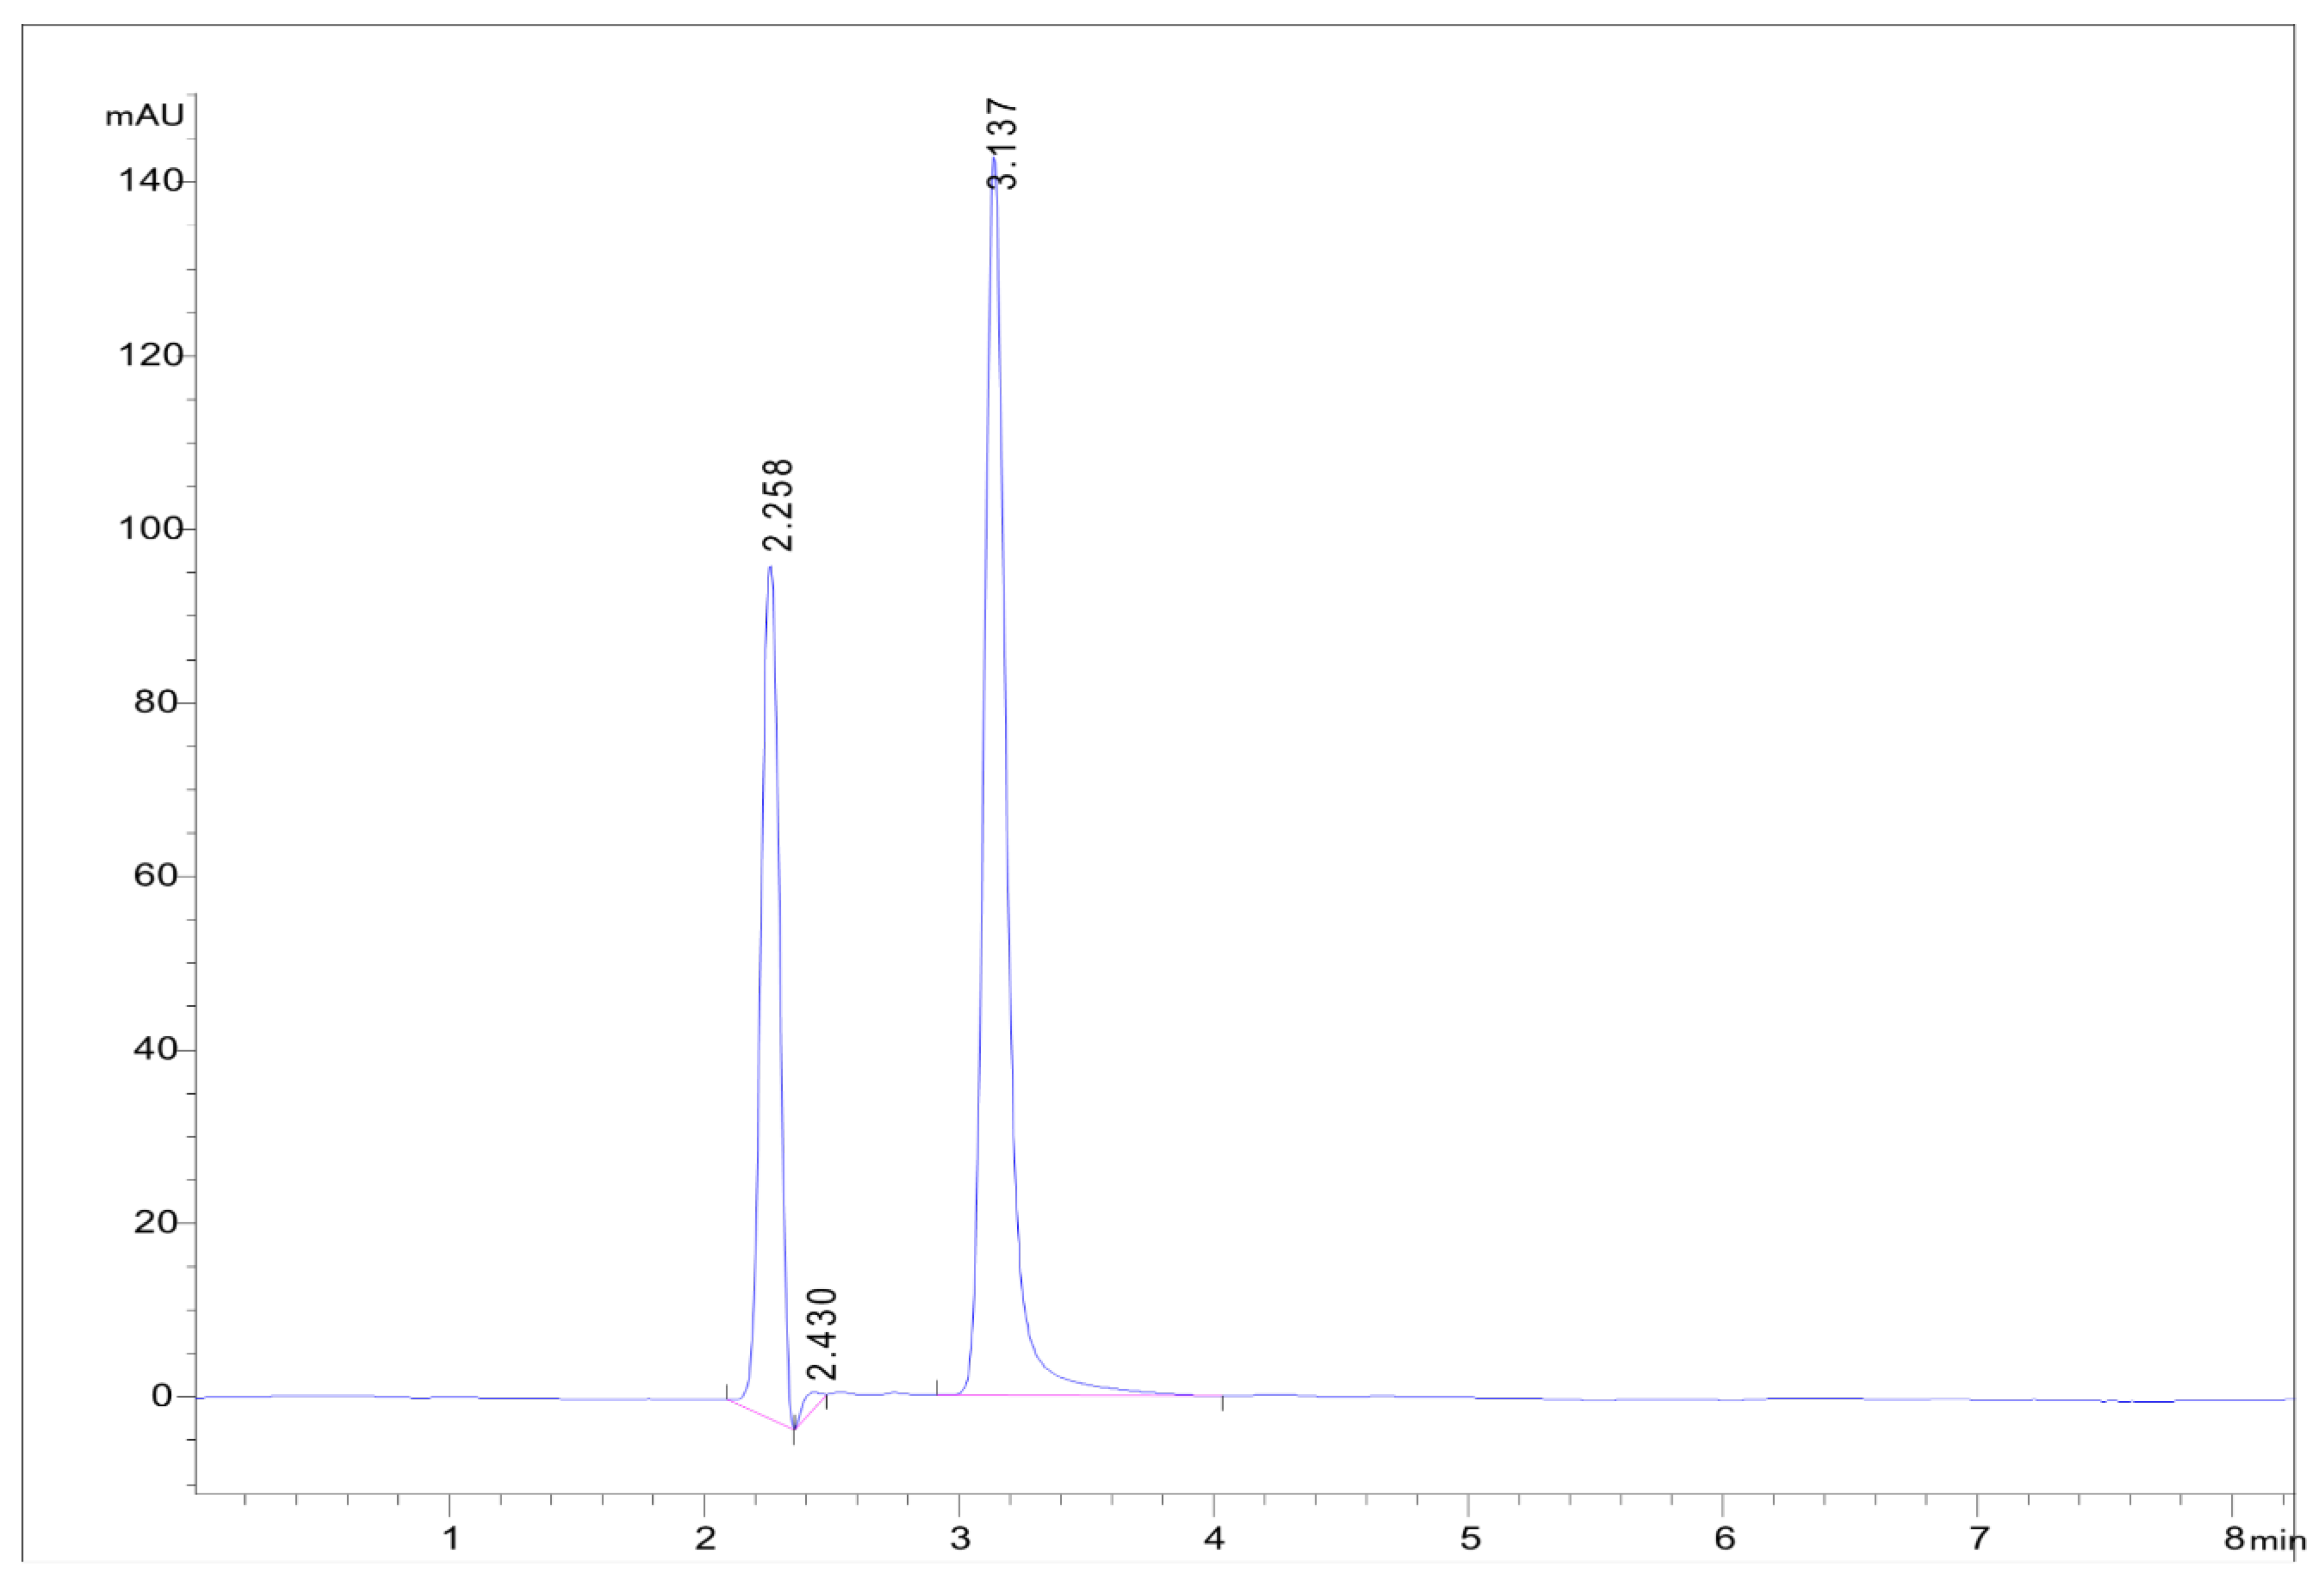
Figure 3.
Representative chromatogram of dolutegravir at 10 µg/mL.
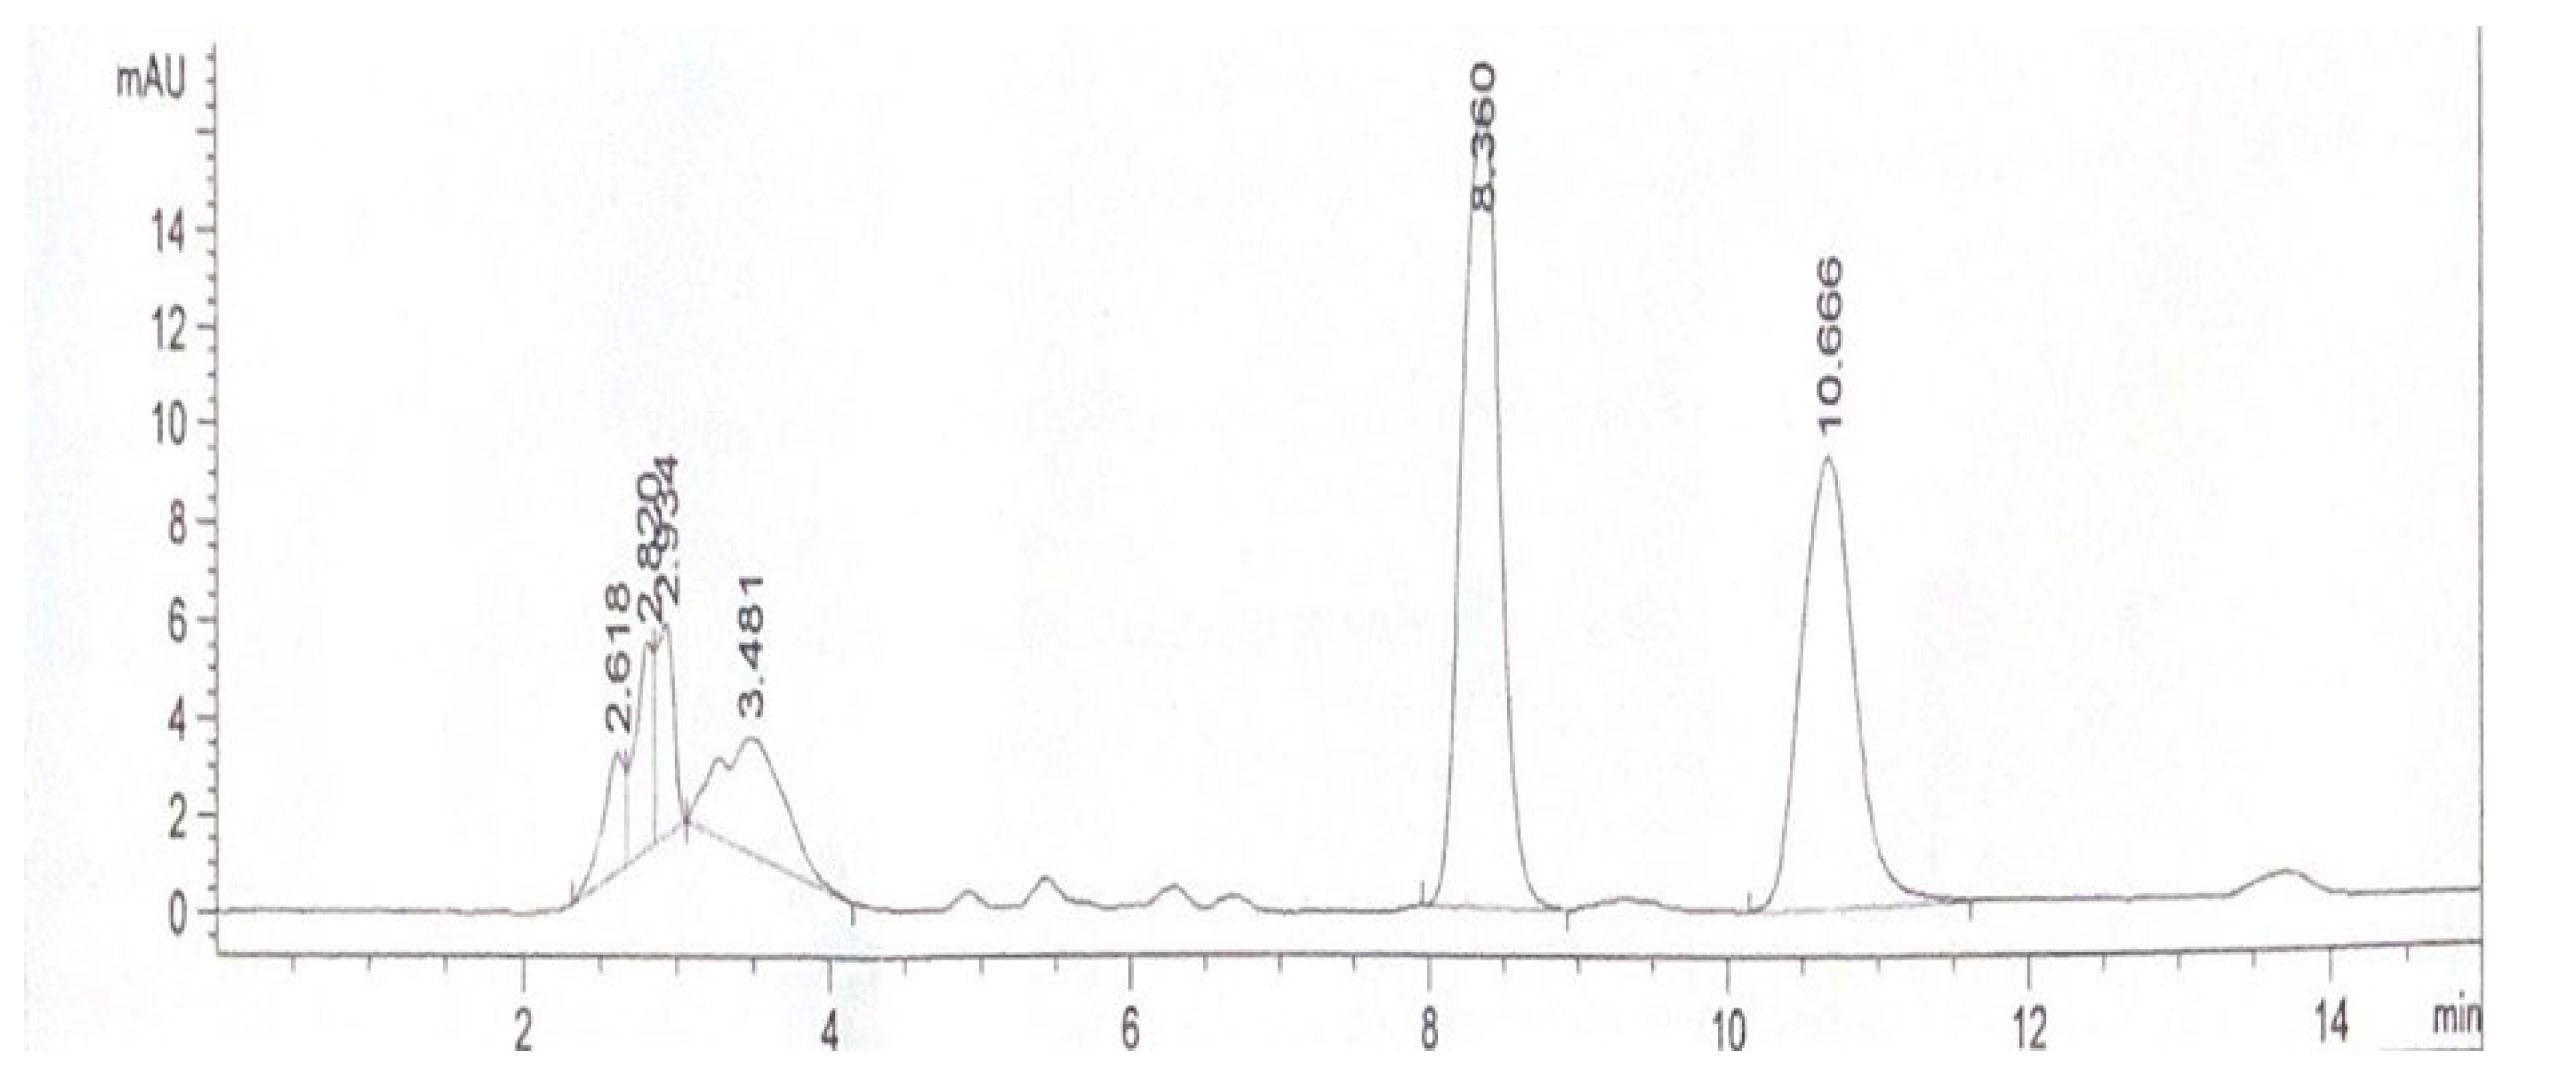
Figure 4.
Calibration curve of dolutegravir over the concentration range of 0.8–10 µg/mL.
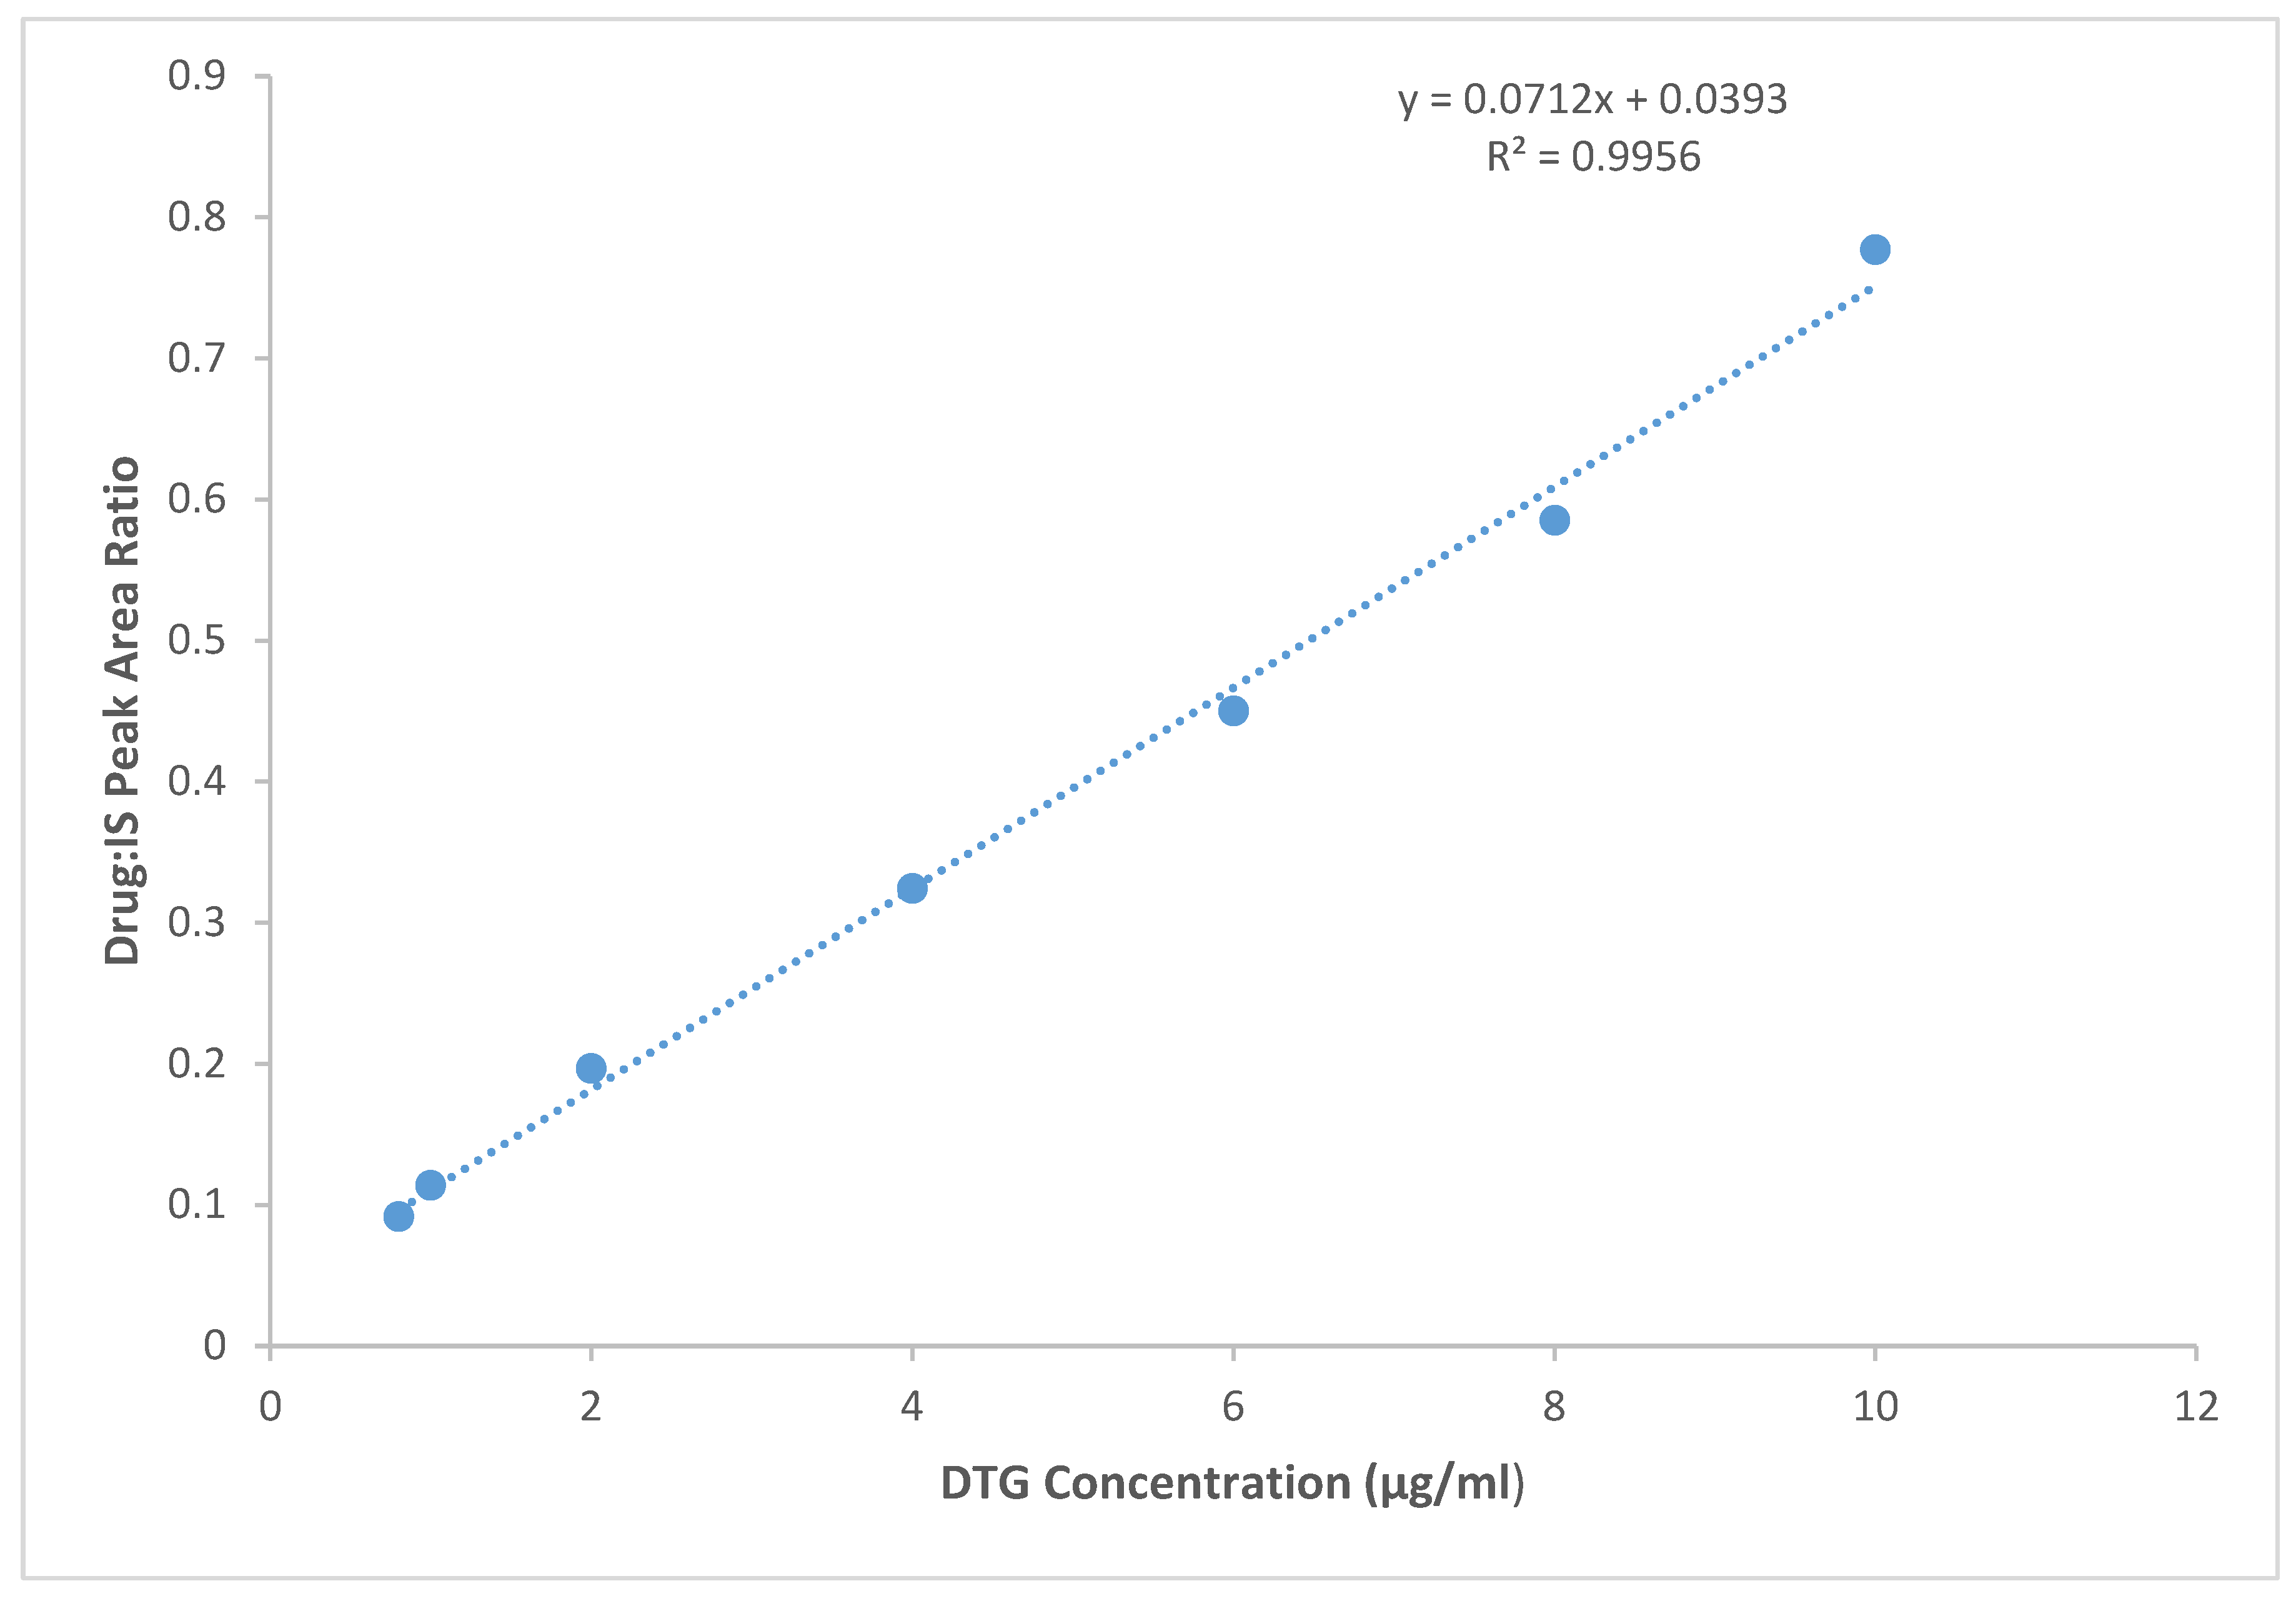

Table 1.
Average peak areas for the respective calibration concentrations.
| Dolutegravir (DTG) Concentration (µg/ml) | Mean peak area ± SD (mAU2) |
|---|---|
| 0.5 | 26.44 ± 1.00 |
| 1 | 33.00 ± 0.70 |
| 5 | 60.69 ± 0.57 |
| 10 | 97.53 ± 4.03 |
| 50 | 431.98 ± 0.99 |
| 60 | 483.98 ± 5.15 |
| 100 | 820.17 ± 12.20 |
(n = 3 for each level). SD, standard deviation.
Table 2.
Mean percentage recovery of dolutegravir at different concentrations.
| Concentration (μg/mL) | Mean %Recovery ± SD |
|---|---|
| 80 | 104.36 ± 1.03 |
| 100 | 97.67 ± 5.65 |
| 120 | 95.22 ± 5.31 |
n = 3; results obtained over three days. SD, standard deviation.
Table 3.
Intermediate precision for dolutegravir at different concentrations.
| Day | 80 μg/mL | 100 μg/mL | 120 μg/mL |
|---|---|---|---|
| 1 | 82.74 | 91.21 | 107.03 |
| 2 | 84.37 | 101.65 | 119.06 |
| 3 | 83.35 | 100.15 | 116.70 |
| Mean | 83.49 | 97.67 | 114.26 |
| SD | 0.83 | 5.65 | 6.36 |
| RSD (%) | 0.99 | 5.78 | 5.58 |
RSD, relative standard deviation; SD, standard deviation.
Table 4.
Optimized chromatographic conditions for the analysis of dolutegravir in plasma.
| Parameter | Description |
|---|---|
| Equipment | HPLC-UV, Agilent Technologies |
| Mobile phase | 0.02 M Sodium acetate pH 4.0: Acetonitrile (70:30 v/v) |
| Column | Arcus Ep C18, 250 x 4.6 mm, 5 µm |
| Column temperature | Ambient |
| Flow rate | 1.2 ml/min |
| Wavelength | 254 nm |
| Injection volume | 20 µL |
| Retention time | 10.24 min |
Table 5.
Linearity results and calibration data for dolutegravir over the range of 0.8–10 µg/mL.
| Dolutegravir concentration (µg/ml) | Response (mean peak area ratio) |
|---|---|
| 0.8 | 0.09 |
| 1 | 0.11 |
| 2 | 0.20 |
| 4 | 0.32 |
| 6 | 0.45 |
| 8 | 0.59 |
| 10 | 0.78 |
| Parameter | Value |
| Slope, b | 0.0712 |
| Intercept, a | 0.0393 |
| Coefficient of determination, R2 | 0.9956 |
| Linear equation | y = 0.0712x + 0.0393 |
| Range | 0.8–10 µg/ml |
n = 7.
Table 6.
Accuracy (recovery) results for dolutegravir at different concentration levels.
| Parameter | 80% (8 µg/ml) | 100% (10 µg/ml) | 120% (12 µg/ml) |
|---|---|---|---|
| Mean concentration found (µg/ml) | 7.64 | 10.43 | 13.34 |
| %Recovery | 95.44 | 104.29 | 111.16 |
Table 7.
Repeatability (intra-day precision) results for dolutegravir at different concentration levels.
Table 7.
Repeatability (intra-day precision) results for dolutegravir at different concentration levels.
| Parameter | 80% (8 µg/ml) | 100% (10 µg/ml) | 120% (12 µg/ml) |
| Mean concentration found (µg/ml) | 7.64 | 10.43 | 13.34 |
| SD | 0.10 | 0.13 | 0.06 |
| %RSD | 1.36 | 1.29 | 0.44 |
RSD, relative standard deviation; SD, standard deviation.
Table 8.
Precision (injection repeatability) results for dolutegravir at 100% test concentration.
| Injections | Drug concentration (µg/ml) |
|---|---|
| 1 | 10.32 |
| 2 | 10.57 |
| 3 | 10.37 |
| 4 | 10.23 |
| 5 | 10.48 |
| 6 | 10.60 |
| Mean | 10.43 |
| SD | 0.13 |
| %RSD | 1.29 |
RSD, relative standard deviation; SD, standard deviation. n = 6.
Table 9.
Evaluation of the robustness of the chromatographic method for dolutegravir (Mean ± SD (%RSD)).
Table 9.
Evaluation of the robustness of the chromatographic method for dolutegravir (Mean ± SD (%RSD)).
| Parameter | Condition | Retention time (min) | Peak area | Tailing factor | Resolution |
|---|---|---|---|---|---|
| Flow rate | 0.8 mL/min | 7.36 ± 0.03 (0.35%) | 421.27 ± 0.62 (0.15%) | 1.07 ± 0.05 (4.88%) | 0.89 ± 0.08 (9.30%) |
| 1.0 mL/min | 5.88 ± 0.01 (0.10%) | 335.37 ± 0.28 (0.08%) | 1.06 ± 0.08 (7.44%) | 0.64 ± 0.02 (2.45%) | |
| pH of mobile phase | 3.5 | 9.93 ± 0.02 (0.16%) | 209.44 ± 4.40 (2.10%) | 1.11 ± 0.02 (1.52%) | 2.21 ± 0.13 (5.85%) |
| 4.0 | 10.56 ± 0.10 (0.90%) | 229.93 ± 1.84 (0.80%) | 1.06 ± 0.06 (6.05%) | 3.30 ± 0.07 (2.10%) | |
| Mobile phase composition (0.02 M Sodium acetate pH 4.0: Acetonitrile) | 38:62 | 9.33 ± 0.01 (0.05%) | 42.40 ± 0.43 (1.01%) | 1.08 ± 0.06 (5.44%) | 2.35 ± 0.15 (6.55%) |
| 40:60 | 9.97 ± 0.03 (0.26%) | 51.34 ± 2.00 (3.90%) | 1.17 ± 0.04 (3.09%) | 3.03 ± 0.17 (5.56%) | |
| Wavelength | 248 nm | 9.83 ± 0.02 (0.18%) | 175.32 ± 4.21 (2.40%) | 1.16 ± 0.01 (0.76%) | 3.03 ± 0.18 (5.91%) |
| 250 nm | 9.84 ± 0.02 (0.18%) | 182.74 ± 4.12 (2.26%) | 1.12 ± 0.07 (5.80%) | 3.01 ± 0.19 (6.27%) | |
| 254 nm | 9.84 ± 0.02 (0.18%) | 193.12 ± 4.10 (2.12%) | 1.12 ± 0.07 (5.80%) | 3.01 ± 0.19 (6.27%) | |
| 260 nm | 9.83 ± 0.02 (0.18%) | 191.29 ± 4.36 (2.28%) | 1.15 ± 0.04 (3.04%) | 3.01 ± 0.19 (6.25%) | |
| 265 nm | 9.84 ± 0.01 (0.07%) | 163.27 ± 3.19 (1.95%) | 1.12 ± 0.07 (5.80%) | 3.01 ± 0.19 (6.27%) | |
| 270 nm | 9.83 ± 0.02 (0.18%) | 128.30 ± 3.01 (2.34%) | 1.12 ± 0.07 (5.80%) | 3.01 ± 0.19 (6.27%) |
Table 10.
System suitability results for dolutegravir at 100% test concentration.
| Parameters | Value |
|---|---|
| Capacity factor (k′, drug) | 2.72 |
| Capacity factor (k′, IS) | 1.98 |
| Precision (%RSD, Drug/IS ratio) | 1.83 |
| Resolution (Rs) | 3.47 |
| Tailing Factor (T) | 1.21 |
| Theoretical plate (N, Drug) | 3400 |
| Theoretical plate (N, IS) | 4260 |
IS, internal standard; RSD, relative standard deviation. n = 6.
Disclaimer/Publisher’s Note: The statements, opinions and data contained in all publications are solely those of the individual author(s) and contributor(s) and not of MDPI and/or the editor(s). MDPI and/or the editor(s) disclaim responsibility for any injury to people or property resulting from any ideas, methods, instructions or products referred to in the content. |
© 2026 by the authors. Licensee MDPI, Basel, Switzerland. This article is an open access article distributed under the terms and conditions of the Creative Commons Attribution (CC BY) license (http://creativecommons.org/licenses/by/4.0/).
Copyright: This open access article is published under a Creative Commons CC BY 4.0 license, which permit the free download, distribution, and reuse, provided that the author and preprint are cited in any reuse.


