
Submitted:
30 April 2026
Posted:
05 May 2026
You are already at the latest version
Abstract
Pulse wave propagation through blood vessels is affected by many biophysical parameters that change with aging. The aim of this study was to investigate both theoretically and experimentally how the pulse wave velocity changes in the vertical position and to introduce a new parameter in biophysics - pulse wave acceleration - PWA. On a biophysical model of the cardiovascular system, placed in horizontal and vertical position, pressure waveforms were measured along the arterial tree at several sites at different diastolic pressures and pump frequencies. Blood flow waveforms on the carotid and femoral arteries in the supine and standing position were measured on the subjects. The results showed that the pulse pressure wave accelerates in the direction of gravity and decelerates in the opposite direction both in the model and in humans. A new biophysical parameter - PWA - was defined, and the experimental results are in agreement with the mathematical model. Due to the acceleration of the pulse wave, the reflected wave in the standing position arrives earlier in systole and affects the increase in pressure. The novel biophysical parameter provides a more accurate assessment of the age of the cardiovascular system and a more precise diagnosis of increased blood pressure.
Keywords:
pulse wave acceleration
; wave reflection
; biophysical model
; diastolic pressure
1. Introduction
Vascular aging is a biophysical process that involves complex structural, functional, and molecular changes in the arterial wall that gradually develop throughout life [1]. Vascular aging processes lead to increased arterial stiffness, decreased arterial compliance, changes in pulse wave amplification, and remodeling of the arterial tree [2,3,4]. Changes in the blood vessel wall determine cardiovascular risk, which increases with aging [5,6,7]. One of the main biophysical parameters used in cardiology to assess the age of the cardiovascular system is pulse wave velocity – PWV [8,9]. These age-related changes also affect the wave propagation of blood through the blood vessels [10,11]. Understanding the physics of pulse wave propagation and the correct interpretation of cardiovascular parameters that influence and accelerate vascular aging is the foundation for accurate diagnosis and successful therapy.
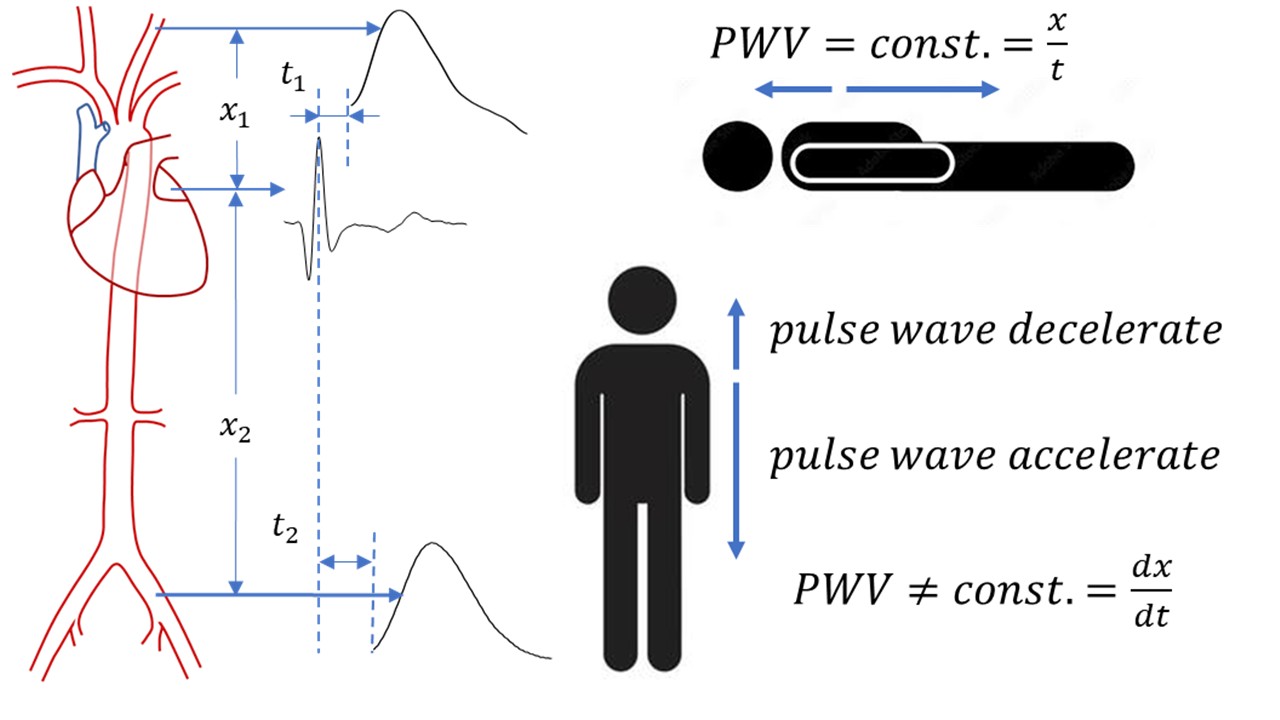
The standard for assessing arterial stiffness in cardiology today is the determination of PWV. Physicians calculate PWV as the ratio of the distance between two measurement points on the body and the time the pulse pressure wave travels between them. In humans, PWV is usually measured at the carotid-femoral [12], carotid-radial [13] or brachial-ankle [14] arterial sites.
The velocity of propagation of pulse waves through an elastic tube filled with a viscous fluid depends on many parameters such as tube diameter, Young’s modulus of elasticity of the tube wall, fluid density, tube wall density, wall thickness, fluid pressure, viscosity, geometry of the tube and many others.
The Moens-Korteweg equation [15,16,17] is mainly used to estimate the stiffness of the blood vessel wall, i.e., the Young’s modulus value:
Where c - PWV, E - Young’s modulus, h - thickness, R - radius, ρ - density.
If this equation is used, an error is introduced in the estimation of stiffness, since it does not include the above-mentioned parameters such as fluid viscosity, initial fluid pressure, wall density, heart rate or Poisson’s ratio.
Equation (2) shows how PWV depends on all these parameters and how it changes with changes in diastolic pressure [18]:
Where p0 – the initial pressure of the fluid, m – the viscosity, s – Poisson’s ratio, w=2pn where n – heart rate, ρ0 – the wall density (). As diastolic pressure increases, PWV also increases.
PWV measurement is generally performed non-invasively. Various methods are used and sensors or probes are placed over the site where the artery is close to the surface of the skin [19]. Common sites for placement of probes on the body are above the carotid, femoral, radial, and brachial arteries, and at the ankle. Measurements are performed by optical methods with photoplethysmographic sensors, tonometric methods (Applanation tonometry), ultrasound methods or, in the case of extensive research, NMR.
When measuring to determine PWV, the patient/subject is in a supine position. The heart and blood vessels are at a relatively constant height, so the effect of gravity on pressure is minimal. Also, if invasive measurements are made with catheters containing pressure sensors in the blood vessels, the subject is also in a horizontal position. Then the initial fluid pressure - diastolic pressure, p0 in Equation (2) is a constant value.
What happens to the wave propagation when the patient is standing? Gravity affects diastolic pressure by causing it to change with height, increasing from the heart to the feet and decreasing towards the head. Does PWV change then?
This paper shows, using mathematical equations, a demonstration on a biophysical model and measurements on subjects, how PWV changes in a vertical position. A new parameter in biophysics is defined - pulse wave acceleration (PWA).
2. Materials and Methods
2.1. Mathematical Model
If the fraction in equation 2 is multiplied by
and can be neglected. By squaring Equation (3) and arranging
Where
After rearranging and neglecting terms that tend to zero
The change in hydrostatic pressure with height is given by equation 7
If the pressure in equation 6 is replaced by equation 7
Comparing the eq.9 with the basic equation of uniform accelerated motion
2.2. Biophysical Model
The model of the cardiovascular system (shown in Figure 1) used for the measurements is similar to the model published in Ref. [20].
The main component of the biophysical model is a silicone model of the aorta with branches and integrated pressure sensors. The aortic model was placed in a pool that was in a horizontal or vertical position. A 3D printed valve was placed between sensor 1 and sensor 2. Silicone one-way valves were located in several places in the silicone tubes on the model (Figure 1). One tank was closed, filled with air up to 1/3 (compliance chamber), and the second was open with an adjustable height for setting the diastolic pressure in the fluid. A system of serial and parallel tubes (or two tubes connected into one with a larger diameter) was connected downstream behind the pool (Figure 1). Six points of interest along the model of the aorta and its branches were selected for pressure measurement: before the valve, after the valve, along the model of the aorta at a distance of 10 cm, at the bifurcation of the aorta and one aortic branch. Through the wall of the aorta model, a silicone tube is inserted, through which a pressure sensor is attached. We used the pressure sensor SPD-015. A small PCB with a sensor and amplifier circuit with SMD components is inserted into the plastic housing. The output signal from the sensor module is connected to the DAQ input. The USB 6001 (National Instruments USA) DAQ digitized the signal in 14-bit resolution, with LabView software for real-time signal display and data acquisition. A solution of ethyl alcohol 40% viscosity 2.76mPas at a temperature of 21 °C was used. A Terumo Sarns™ 8000 Roller Pump with adjustable amplitude and frequency generated a pulse wave and pushed the fluid.
2.3. Measurement Protocol
The set diastolic pressure in the model was achieved by adjusting the height of reservoir 1. Measurements were made at pressures of 80, 90 and 100 mmHg. The manometer was placed at the level with the tubes and in a vertical position of the model at the level with sensor 2. The pump was adjusted so that the systolic pressure in the tubes at the lowest frequency did not exceed 20 mmHg above the diastolic pressure. The frequency of the pump is increased after every 6-7 beats. The frequency was from 24bpm to 120bpm with a step of 6bpm.
2.4. Measurement of Cardiovascular Parameters in Study Subjects
ECG and blood flow in the carotid and femoral arteries were measured for the subjects. The optical sensors [21] were positioned above the left carotid artery and above the femoral artery on the left groin above the site where the pulse could be palpated (Figure 5A). The subject was in two positions: supine and standing. After applying the ECG electrodes and sensors, the measurement was started after a few minutes, first in the supine position and then in the standing position.
3. Results
Figure 2 (multiple Y-axes) shows the results of comparing a single pulse pressure waveform in the horizontal (solid line) and vertical (dashed line) positions of the model at a pump rate of 72bpm and a diastolic pressure of 100mmHg (horizontal model position) recorded on sensor S3.
Figure 3a (multiple Y-axes) shows the results of a comparison of a single pulse waveform recorded on sensors S2 – S5 in a horizontal (solid line, diastolic pressure of 90mmHg) and after rotating the model in a vertical (dashed line, diastolic pressure of 90mmHg on sensor S2) position at a pump frequency of 72bpm. Figure 4b (Multi Y-axes) shows changes in pulse pressure waveform with an increase in diastolic pressure from 80mmHg to 90mmHg (on sensors S2-S5) at a pump frequency of 66bpm in the vertical position of the model.
Figure 4 (Multi Y-axes) shows the differences in pressure amplitudes after rotating the model from horizontal to vertical position at a pump frequency of 108bpm and a diastolic pressure of 80mmHg.
Figure 5B shows recorded ECG signals and blood flow waveforms in the carotid and femoral arteries of a 55-year-old subject in a supine position. The PTT is the time from the R peak of the EKG to the foot-of-the-wave of the blood flow waveform
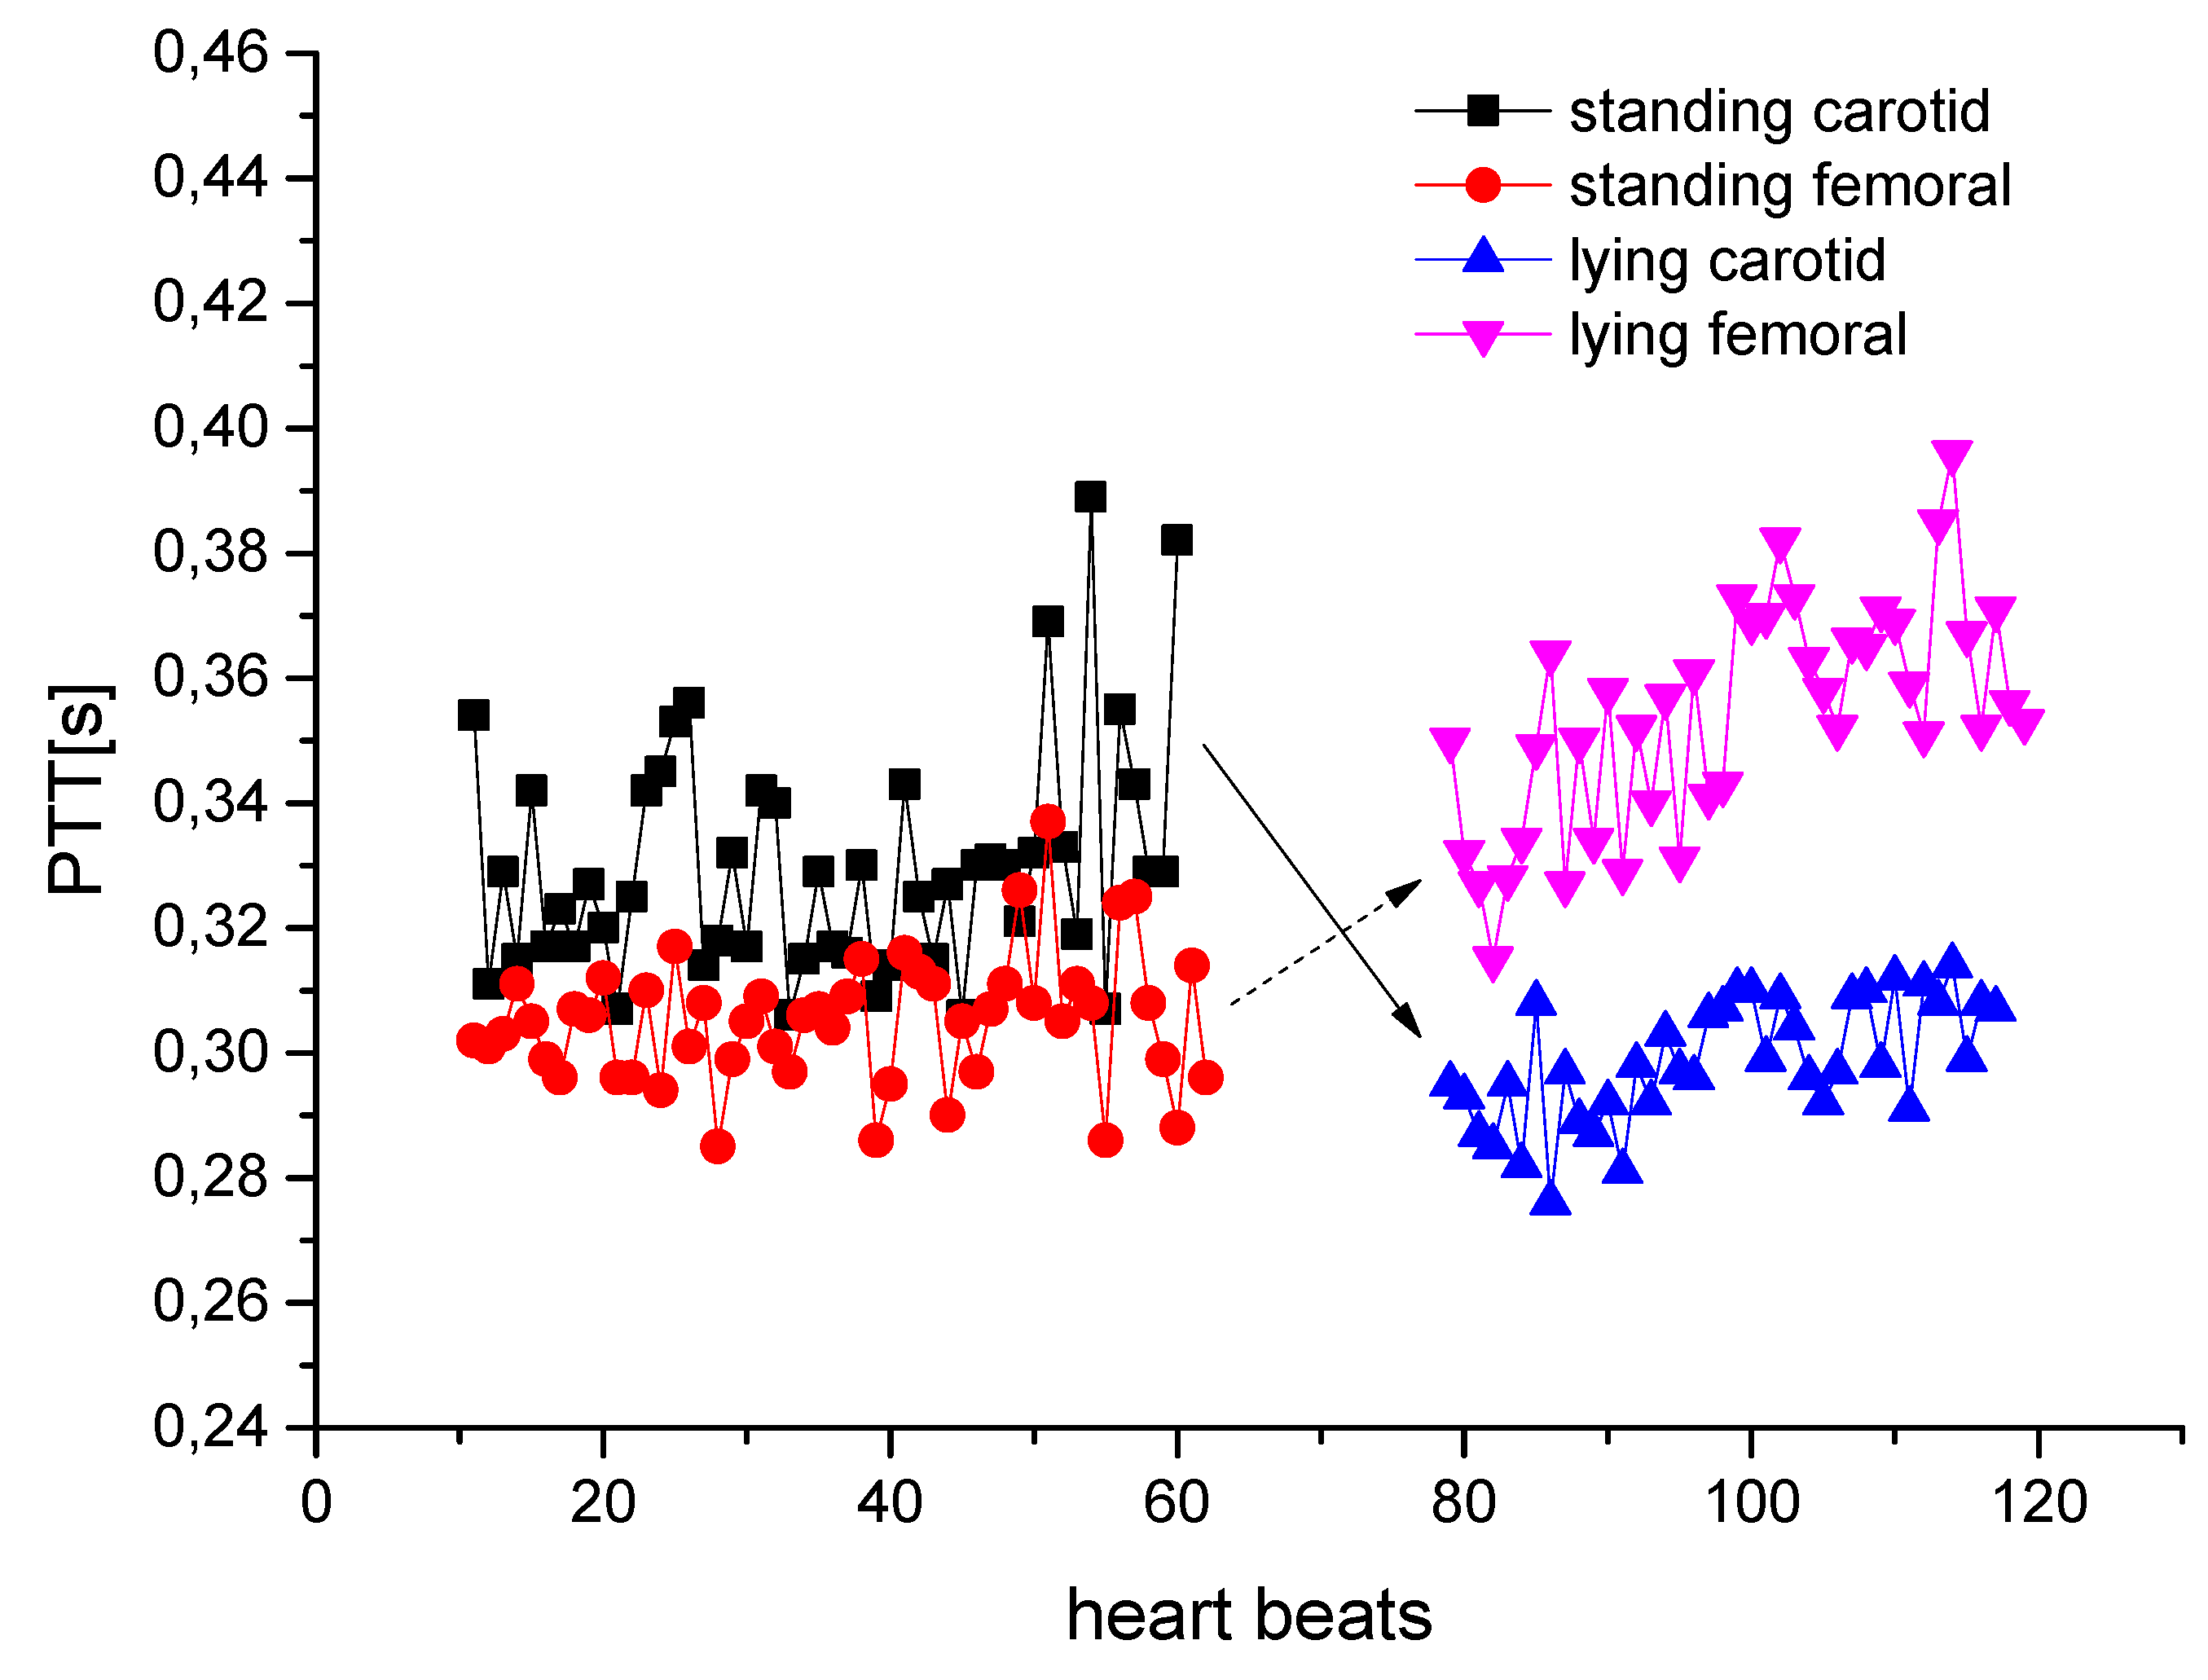
Figure 6 shows a comparison of the calculated Pulse Transmit Time vs. heart beat for the carotid sensor and for the femoral artery sensor. The figure shows the results in supine and standing of a 39-year-old subject.
4. Discussion
To show that pulse waves are accelerating, wave propagation was measured in the horizontal and vertical positions of the model. In both positions, the pressure on sensor S2 had the same value, while in the vertical position, the pressure on sensors S3-S6 increased. In the vertical position of the model, the pressure pulse wave reached the reflection site faster and the reflected wave is closer to the systole of the forward wave than in the horizontal position.
Figure 2 shows the differences in the pressure waveforms on the S3 sensor in both positions of the model. The larger amplitude in the vertical position proves the assumption that the wave travels faster when it is affected by gravity.
This can be clearly seen in Figure 3A, where comparisons of the pulse waveforms on the sensors in both positions of the model are shown. On sensor S2, the amplitude of the wave is greater and the maximum of the wave is shifted to the left for the model in vertical position compared to horizontal. From sensor S2 to sensor S5, the maxima are closer and the difference in amplitudes decreases - sensors downstream are closer to the reflection site.
Since the pressure increases in the vertical position of the model, the velocity also increases and the wave accelerates according to equation 6. The wave will reach the reflection site faster than in the horizontal position, and after reflection it will propagate vertically upwards with negative acceleration. The wave velocities on the sites where the sensors are placed will be higher in both directions in the vertical than in the horizontal position of the model, and the reflected wave arrives faster and shifts the maximum to the left and increases the amplitude. The second reflected wave also reached the sensor faster in the vertical position than in the horizontal position.
Another experimental proof that pressure changes PWV - Figure 3B shows how the pulse waveform changes with increasing diastolic pressure. At a higher diastolic pressure, the PWV are higher, so the maxima of the forward and reflected wave superposition will have a higher value. These results agree with equation 6.
The best example of the pressure waveform changing when the model is in a vertical position compared to horizontal is in Figure 4. At high frequencies, the eject time is very short and the forward half-period of the pulse wave is also short and the reflected wave arrives in diastole and does not affect the forward wave shape. With all sensors, a pressure wave is first detected in a vertical position in relation to a horizontal one in both forward and reflected waves. The line connecting the wave maxima on sensors S3-S5 has a higher slope when the model is in a vertical position than when it is in a horizontal position: the impulse wave arrived earlier, i.e., the wave is accelerating.
The ratio of the amplitudes of the reflected and forward pulse waves is the reflection coefficient. The higher the reflection coefficient, the sooner the reflected wave will form and move backward. In our experiment, we were unable to experimentally determine the reflection coefficient, but from the results and based on the simulation in MatLAB, the reflection coefficient was between 0.3 and 0.6.
As the elasticity of blood vessel walls decreases with aging, PWV increases, which causes the reflected wave to form earlier and increase systolic pressure. This is one of the causes of pressure increase in the elderly since the superposition of forward and reflected waves does not occur in systole instead of diastole. In our model, we measured only one value of Young’s modulus of elasticity, and it can be seen in Figure 2, Figure 3 and Figure 4 that due to higher PWV, the pressure value is higher.
When the model is vertical, the diastolic pressure in the tube increases towards the bottom due to the hydrostatic pressure. Pulse wave velocity is no longer constant and changes with the change in hydrostatic pressure (Equation (8)). When the pulse wave propagates vertically downwards, it accelerates, and when it propagates upwards, it decelerates. The pulse wave acceleration - PWA is shown by equation 10. Velocities and accelerations from the experiment agree with the mathematical model. The velocity was calculated as the ratio of the distance between the two sensors (S2 – S5) and the propagation time for the model in a horizontal position. The PWA was calculated from the basic equation for uniform acceleration. The experimental PWA for the model at set diastolic pressures was 5.5±0.8m/s2 for the lowest pump frequency to 5.7±0.5m/s2 for the highest pump frequency. Determining the beginning of the wave (foot-of-the-wave) was done manually because there is no precisely defined point on the signal that marks the beginning, so the error is therefore large.
Figure 5B shows the results of measuring the ECG signal and blood flow on the femoral and carotid arteries of one subject. The picture also shows the method of determining the pulse transmit time - PTT. The starting point was the R point of the ECG signal and the end point was the beginning of the wave (foot-of-the-wave) on the blood flow signal.
The time required for the blood flow wave to reach the carotid sensor in standing is longer than when the subject is in supine position (Figure 6). At the same time, the time required for the blood flow wave to reach the sensor on the femoral artery is shorter when the subject is standing than when he is in supine. It follows that the pulse wave propagates faster from the heart towards the legs when standing and slower towards the head, i.e., that the wave accelerates in the direction of gravity and slows down in the opposite direction. The acceleration estimate from the PTT results was between 4.221 and 6.343m/s2 and the calculated value from equation 10 was 5.891 – 5.958 m/s2. Here it must be taken into account that we did not have the exact length from the heart to the sensor. Additionally, the diameter of the aorta decreases towards branching (from 3-4cm to 2-3cm), while in Equations (2) and (10) R0 has a constant value, so a smaller error was made in determining the initial PWV. Moreover, the position of the sensor is above the artery (carotid and femoral), which has a smaller diameter than the aorta. Unlike the biophysical model where pressure sensors were used, optical sensors were used to measure arterial blood flow, so the assumption was that there was no phase shift between the pressure and flow waveforms. With all the approximations we made, the measured acceleration values agree with the mathematical model in equation 10 that the wave acceleration is a=5g/8•A.
In published papers [22,23,24,25], the effect of changing body position on wave propagation was measured. The authors investigated how the PWV changes between the carotid and femoral artery (cfPWV) in sitting and supine position [22,23], but the results were incorrectly analyzed and explained. The authors assumed that there is no acceleration of pulse waves in the upright position of the body and calculated PWV in the classic way. By using the wrong physics equations, they got incorrect results. As shown with our the model and by measurement, the pulse wave accelerates vertically downwards and decelerates upwards, which the authors did not apply in the analysis. In papers [24,25], the authors compared the pulse arriving time - PAT in the sitting and supine positions and also analyzed the data without wave acceleration. It was found [25], that the augmentation index (AI) in standing is higher than in supine, which we also showed on our model due to the different speed of the reflected wave, but their explanation of these findings is incorrect.
5. Conclusions
A novel biophysical parameter – pulse wave acceleration, presented in this work is very significant for physics: a new phenomenon and physics law that governs the propagation of pulse waves through an elastic tube filled with a viscous fluid in a gravitational field. It is very important to take into account when calculating in e.g., devices with vertical pulse propagation of fluid, or if there is wave reflection during vertical wave propagation, in medical devices with pulsed fluid flow or blood flow, etc.
The application of PWA in biophysics or medicine has not yet been investigated, since no studies have been conducted on the propagation of pulse waves through blood vessels in the vertical position of the subject, with the exact physics under analysis. Our experiments have shown that the pulse wave accelerates in the direction of gravity and decelerates in the opposite direction. A pilot study with subjects showed that there is a significant difference in the blood pulse wave velocity in the supine and standing position - the blood pulse wave accelerates and decelerates when standing. Our research may advance the diagnosis of hypertension and explain the origin of the higher augmentation index.
Funding
This work was partially supported by the Ministry of Science, Technological Development and Innovation of Republic of Serbia Grant No 200110.
Conflicts of Interest
The authors have no relevant conflicts of interest to disclose.
Ethical Statement
Data used in this study were obtained as part of a research project approved by the Ethics Committee of the Faculty of Medicine, University of Belgrade (approval number 1550/IX-8). Informed written consent was obtained from each person who agreed to participate in the study and they approved the use of their data for research. The research was conducted in accordance with the Declaration of Helsinki.
References
- Herzog, M.J.; Müller, P.; Lechner, K.; et al. Arterial stiffness and vascular aging: mechanisms, prevention, and therapy. Sig. Transduct. Target. Ther. 2025, 10, 282. [Google Scholar] [CrossRef]
- O’Rourke, M.; Nichols, W.W.; Vlachopoulos, C. McDonald’s Blood Flow in Arteries, 6th ed.; Hodder Arnold: London, UK, 2011. [Google Scholar] [CrossRef]
- O’Rourke, M. Arterial hemodynamics in hypertension. Circ. Res. 1970, 27 (Suppl. 2), 123. [Google Scholar]
- Lee, H.Y.; Oh, B.H. Aging and arterial stiffness. J. 2010, 74, 2257–2262. [Google Scholar] [CrossRef]
- O’Rourke, M. Arterial stiffness, systolic blood pressure, and logical treatment of arterial hypertension. Hypertension 1990, 15, 339–347. [Google Scholar] [CrossRef]
- Hashimoto, J.; Ito, S. Pulse pressure amplification, arterial stiffness, and peripheral wave reflection determine pulsatile flow waveform of the femoral artery. Hypertension 2010, 56(5), 926–933. [Google Scholar] [CrossRef]
- Li, J.K. Increased arterial pulse wave reflections and pulsatile energy loss in acute hypertension. Angiology 1898, 40(8), 730–73. [Google Scholar] [CrossRef] [PubMed]
- The Reference Values for Arterial Stiffness’ Collaboration. Determinants of pulse wave velocity in healthy people and in the presence of cardiovascular risk factors: Establishing normal and reference values. Eur. Hear. J. 2010, 31, 2338–2350. [CrossRef] [PubMed]
- Safar, M.; Henry, O.; Meaume, S. Aortic pulse wave velocity: an independent marker of cardiovascular risk. Am. J. Geriatr. Cardiol. 2002, 11(5), 295–304. [Google Scholar] [CrossRef] [PubMed]
- Jozwiak, M.; Monnet, X.; Teboul, J.L. Pressure waveform analysis. Anesth. Analg. 2018, 126(6), 1930–1933. [Google Scholar] [CrossRef]
- Willemet, M.; Alastruey, J. Arterial pressure and flow wave analysis using time-domain 1-D hemodynamics. Ann. Biomed. Eng. 2015, 43(1), 190–206. [Google Scholar] [CrossRef]
- Van Bortel, L.M.; Laurent, S.; Boutouyrie, P.; Chowienczyk; Cruickshank, P.; De Backer, J.K.T.; et al. Expert consensus document on the measurement of aortic stiffness in daily practice using carotid-femoral pulse wave velocity. J. Hypertens. 2012, 30, 445–448. [Google Scholar] [CrossRef] [PubMed]
- Liu, Y.; Beck, A.; Olaniyi, O.; et al. Carotid-radial pulse wave velocity responses following hyperemia in patients with congestive heart failure. J. Am. Soc. Hypertens. 2014, 8, 687–692. [Google Scholar] [CrossRef] [PubMed]
- Yang, Y.; Li, D.; Liu, R.; et al. Brachial-ankle pulse wave velocity is a stronger predictor than blood pressure for atherosclerotic cardiovascular diseases and all-cause mortality: a cohort study. Hypertens. Res. 2023, 46, 2100–2112. [Google Scholar] [CrossRef] [PubMed]
- Korteweg, D.J. Ueber die Fortpflanzungsgeschwindigkeit des Schalles in elastischen Röhren. Ann. Phys. 1878, 241, 525–542. [Google Scholar] [CrossRef]
- Moens, A.I. Die Pulskurve; E. J. Brill: Leiden, 1878. [Google Scholar]
- Moens, A.I. Over de voortplantingssnelheid van den pols. Ph.D. thesis, S.C. Van Doesburgh, Leiden, 1877. [Google Scholar]
- Žikić, D.; Žikić, K. Wave propagation through a viscous fluid-filled elastic tube under initial pressure: theoretical and biophysical model. Eur. Biophys. J. 2022, 51(4-5), 365–374. [Google Scholar] [CrossRef]
- Charlton, P.H.; Paliakaitė, B.; Pilt, K.; et al. Assessing hemodynamics from the photoplethysmogram to gain insights into vascular age: a review from VascAgeNet. Am. J. Physiol. Hear. Circ. Physiol. 2022, 322(4), H493–H522. [Google Scholar] [CrossRef]
- Ilić, L.; Žikić, K.; Nestorović, Z.; et al. Development of novel experimental setup for hands-on cardiovascular biophysics education. Eur. Biophys. J. 2025, 54, 521–525. [Google Scholar] [CrossRef]
- Djurić, B.; Suzić, S.; Stojadinović, B.; et al. An improved design of optical sensor for long-term measurement of arterial blood flow waveform. Biomed. Microdevices. 2017, 19(3), 48. [Google Scholar] [CrossRef]
- Karaki, M.; Kunimatsu, N.; Watanabe, K.; Tomoto, T.; Fukuie, M.; Sugawara, J.; Ogoh, S. The validity of carotid-femoral pulse wave velocity in the seated posture as an index of central arterial stiffness. Am. J. Physiol.-Regul. Integr. Comp. Physiol. 2025, 328:2, R145–R153. [Google Scholar] [CrossRef]
- Karaki, M.; Saito, S.; Iwamoto, E.; Katayama, K.; Sugawara, J.; Ogoh, S. Effect Of Body Position On Carotid-femoral Pulse Wave Velocity: 1213. Med. Sci. Sports Exerc. 2023, 55(9S), 392–393. [Google Scholar] [CrossRef]
- Obata, Y.; Ong, Q.J.; Magruder, J.T.; et al. Noninvasive Assessment of the Effect of Position and Exercise on Pulse Arrival to Peripheral Vascular Beds in Healthy Volunteers. Front. Physiol. 2017, 8, 47. [Google Scholar] [CrossRef]
- Nürnberger, J.; Michalski, R.; Türk, T.; et al. Can arterial stiffness parameters be measured in the sitting position? Hypertens. Res. 2011, 34, 202–208. [Google Scholar] [CrossRef]
Figure 1.
Schematic diagram of the cardiovascular model: S1–S6 — pressure sensors, P — peristaltic pump, M — manometer, DAQ — data acquisition system, V – one-way valve.
Figure 1.
Schematic diagram of the cardiovascular model: S1–S6 — pressure sensors, P — peristaltic pump, M — manometer, DAQ — data acquisition system, V – one-way valve.
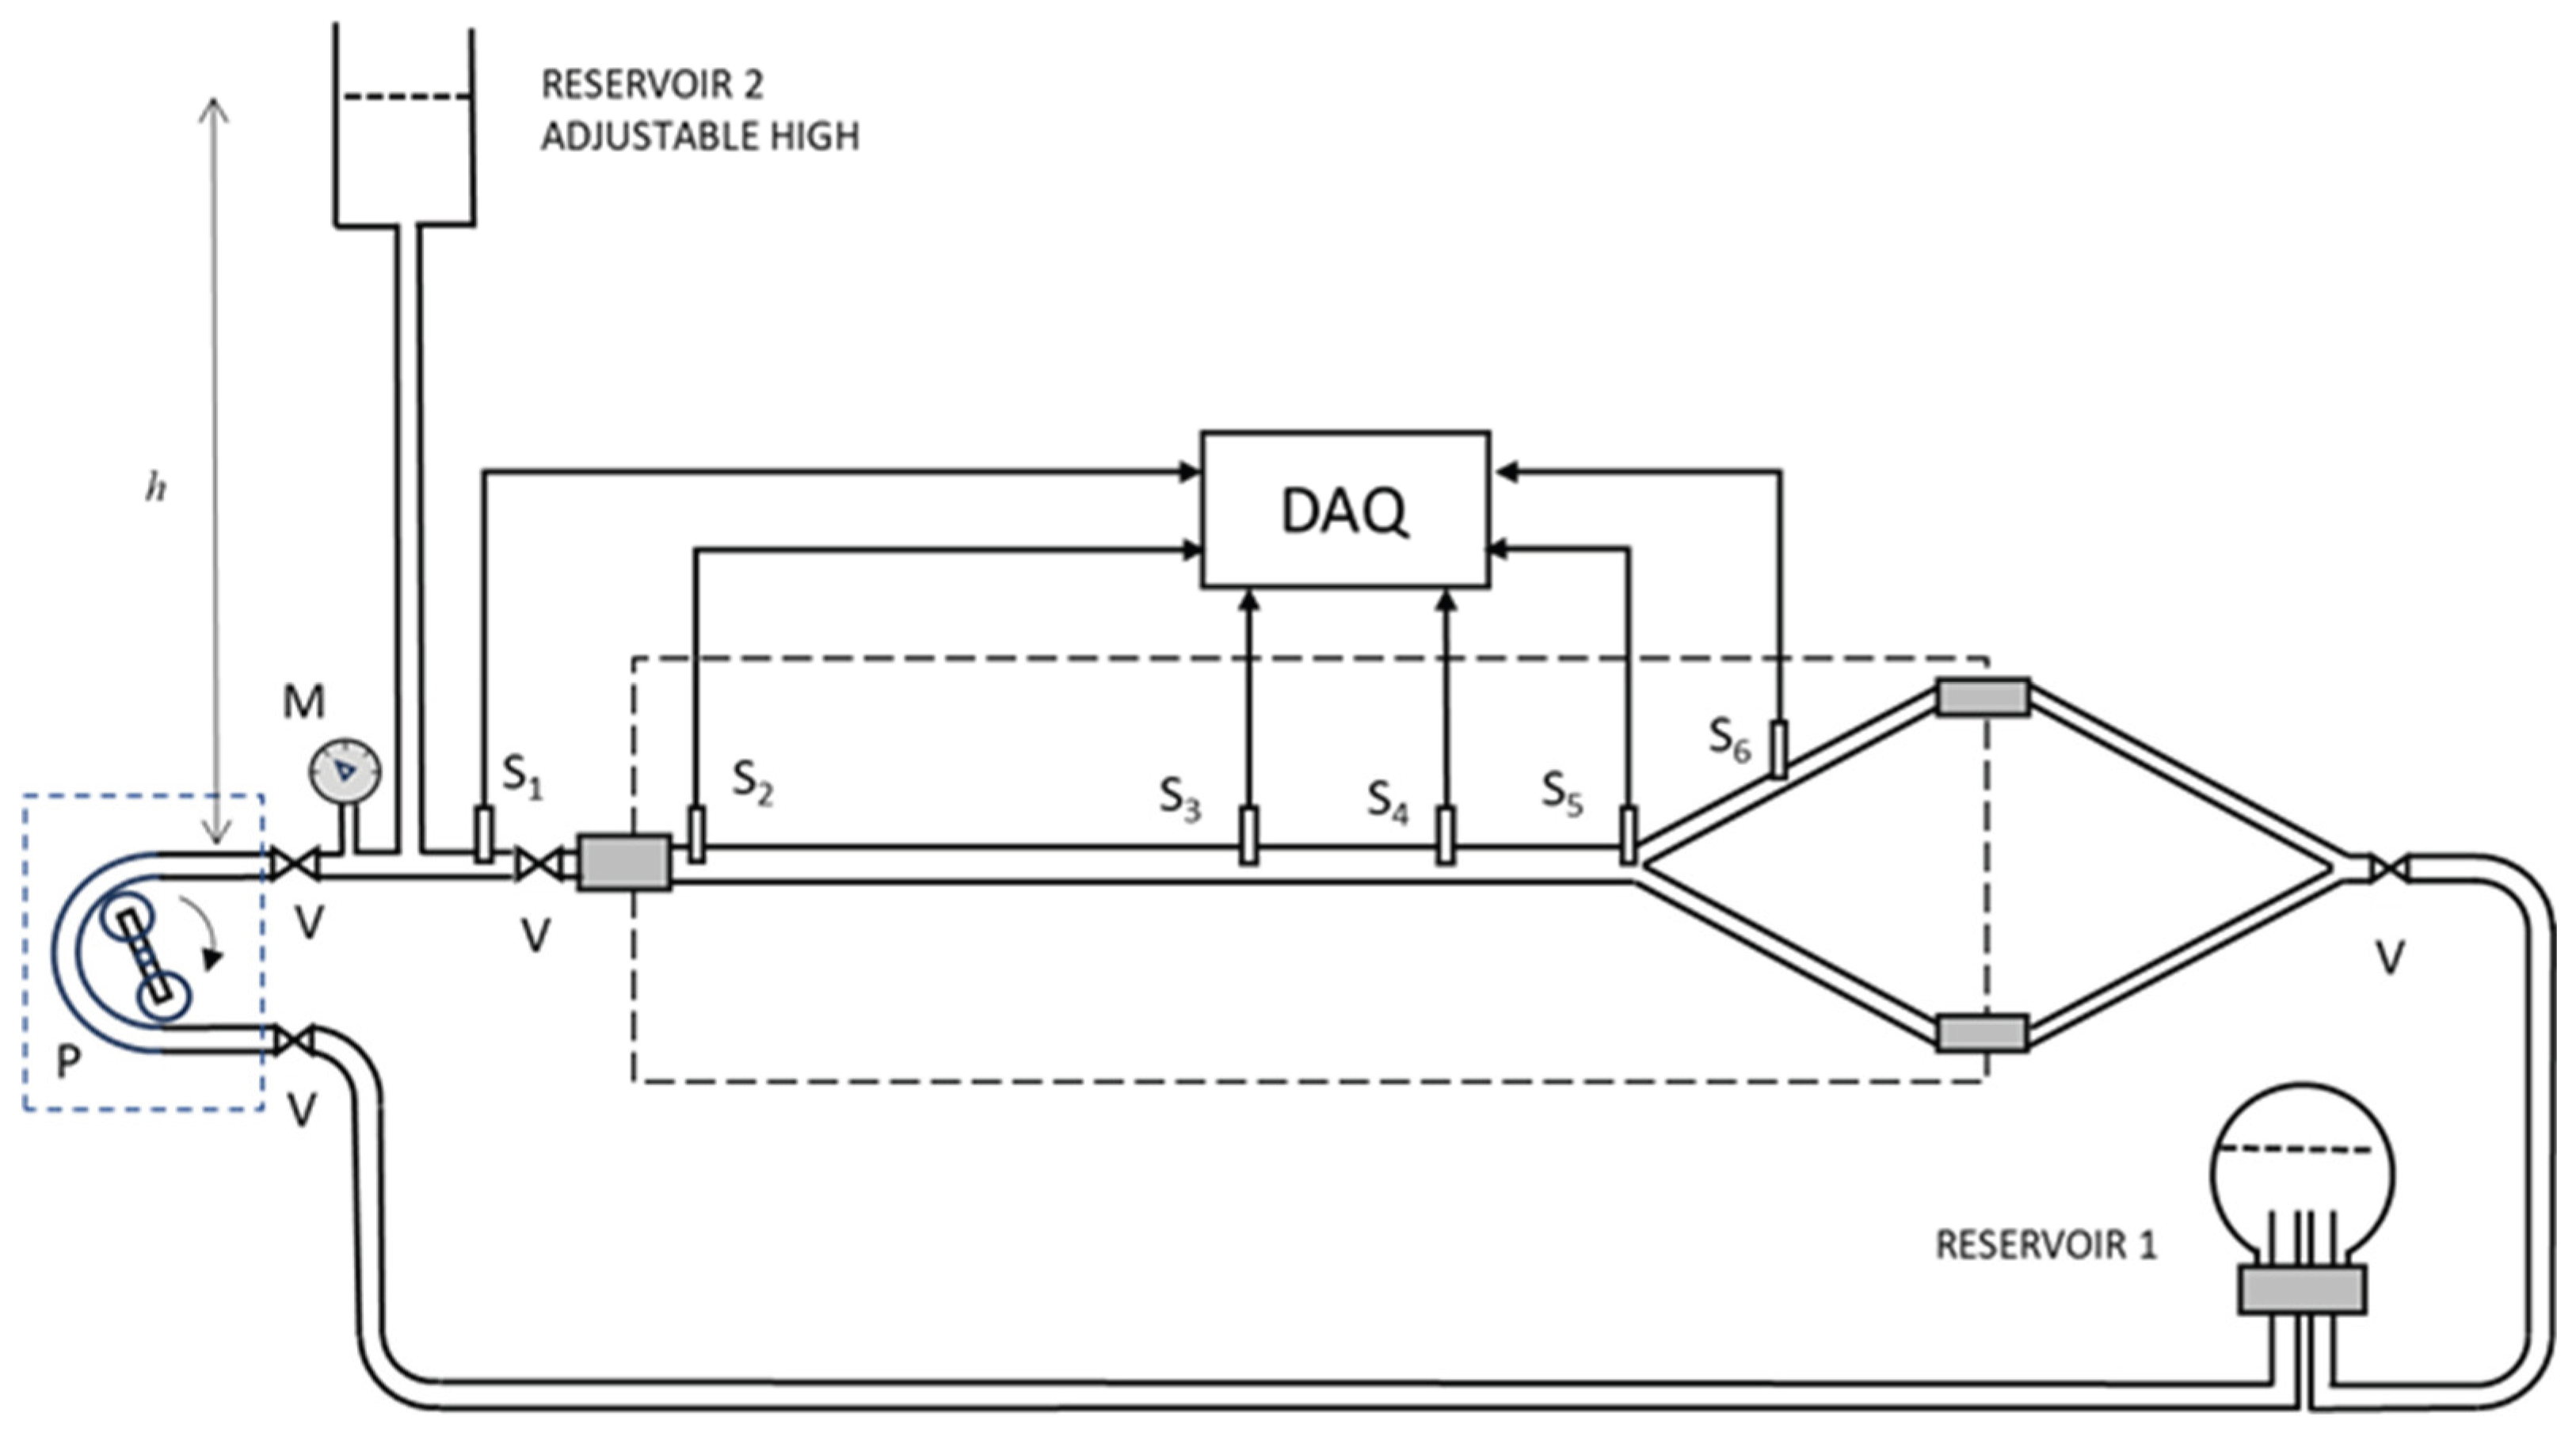
Figure 2.
Pulse pressure waveforms on sensor S3 in the horizontal and vertical position of the model.
Figure 2.
Pulse pressure waveforms on sensor S3 in the horizontal and vertical position of the model.
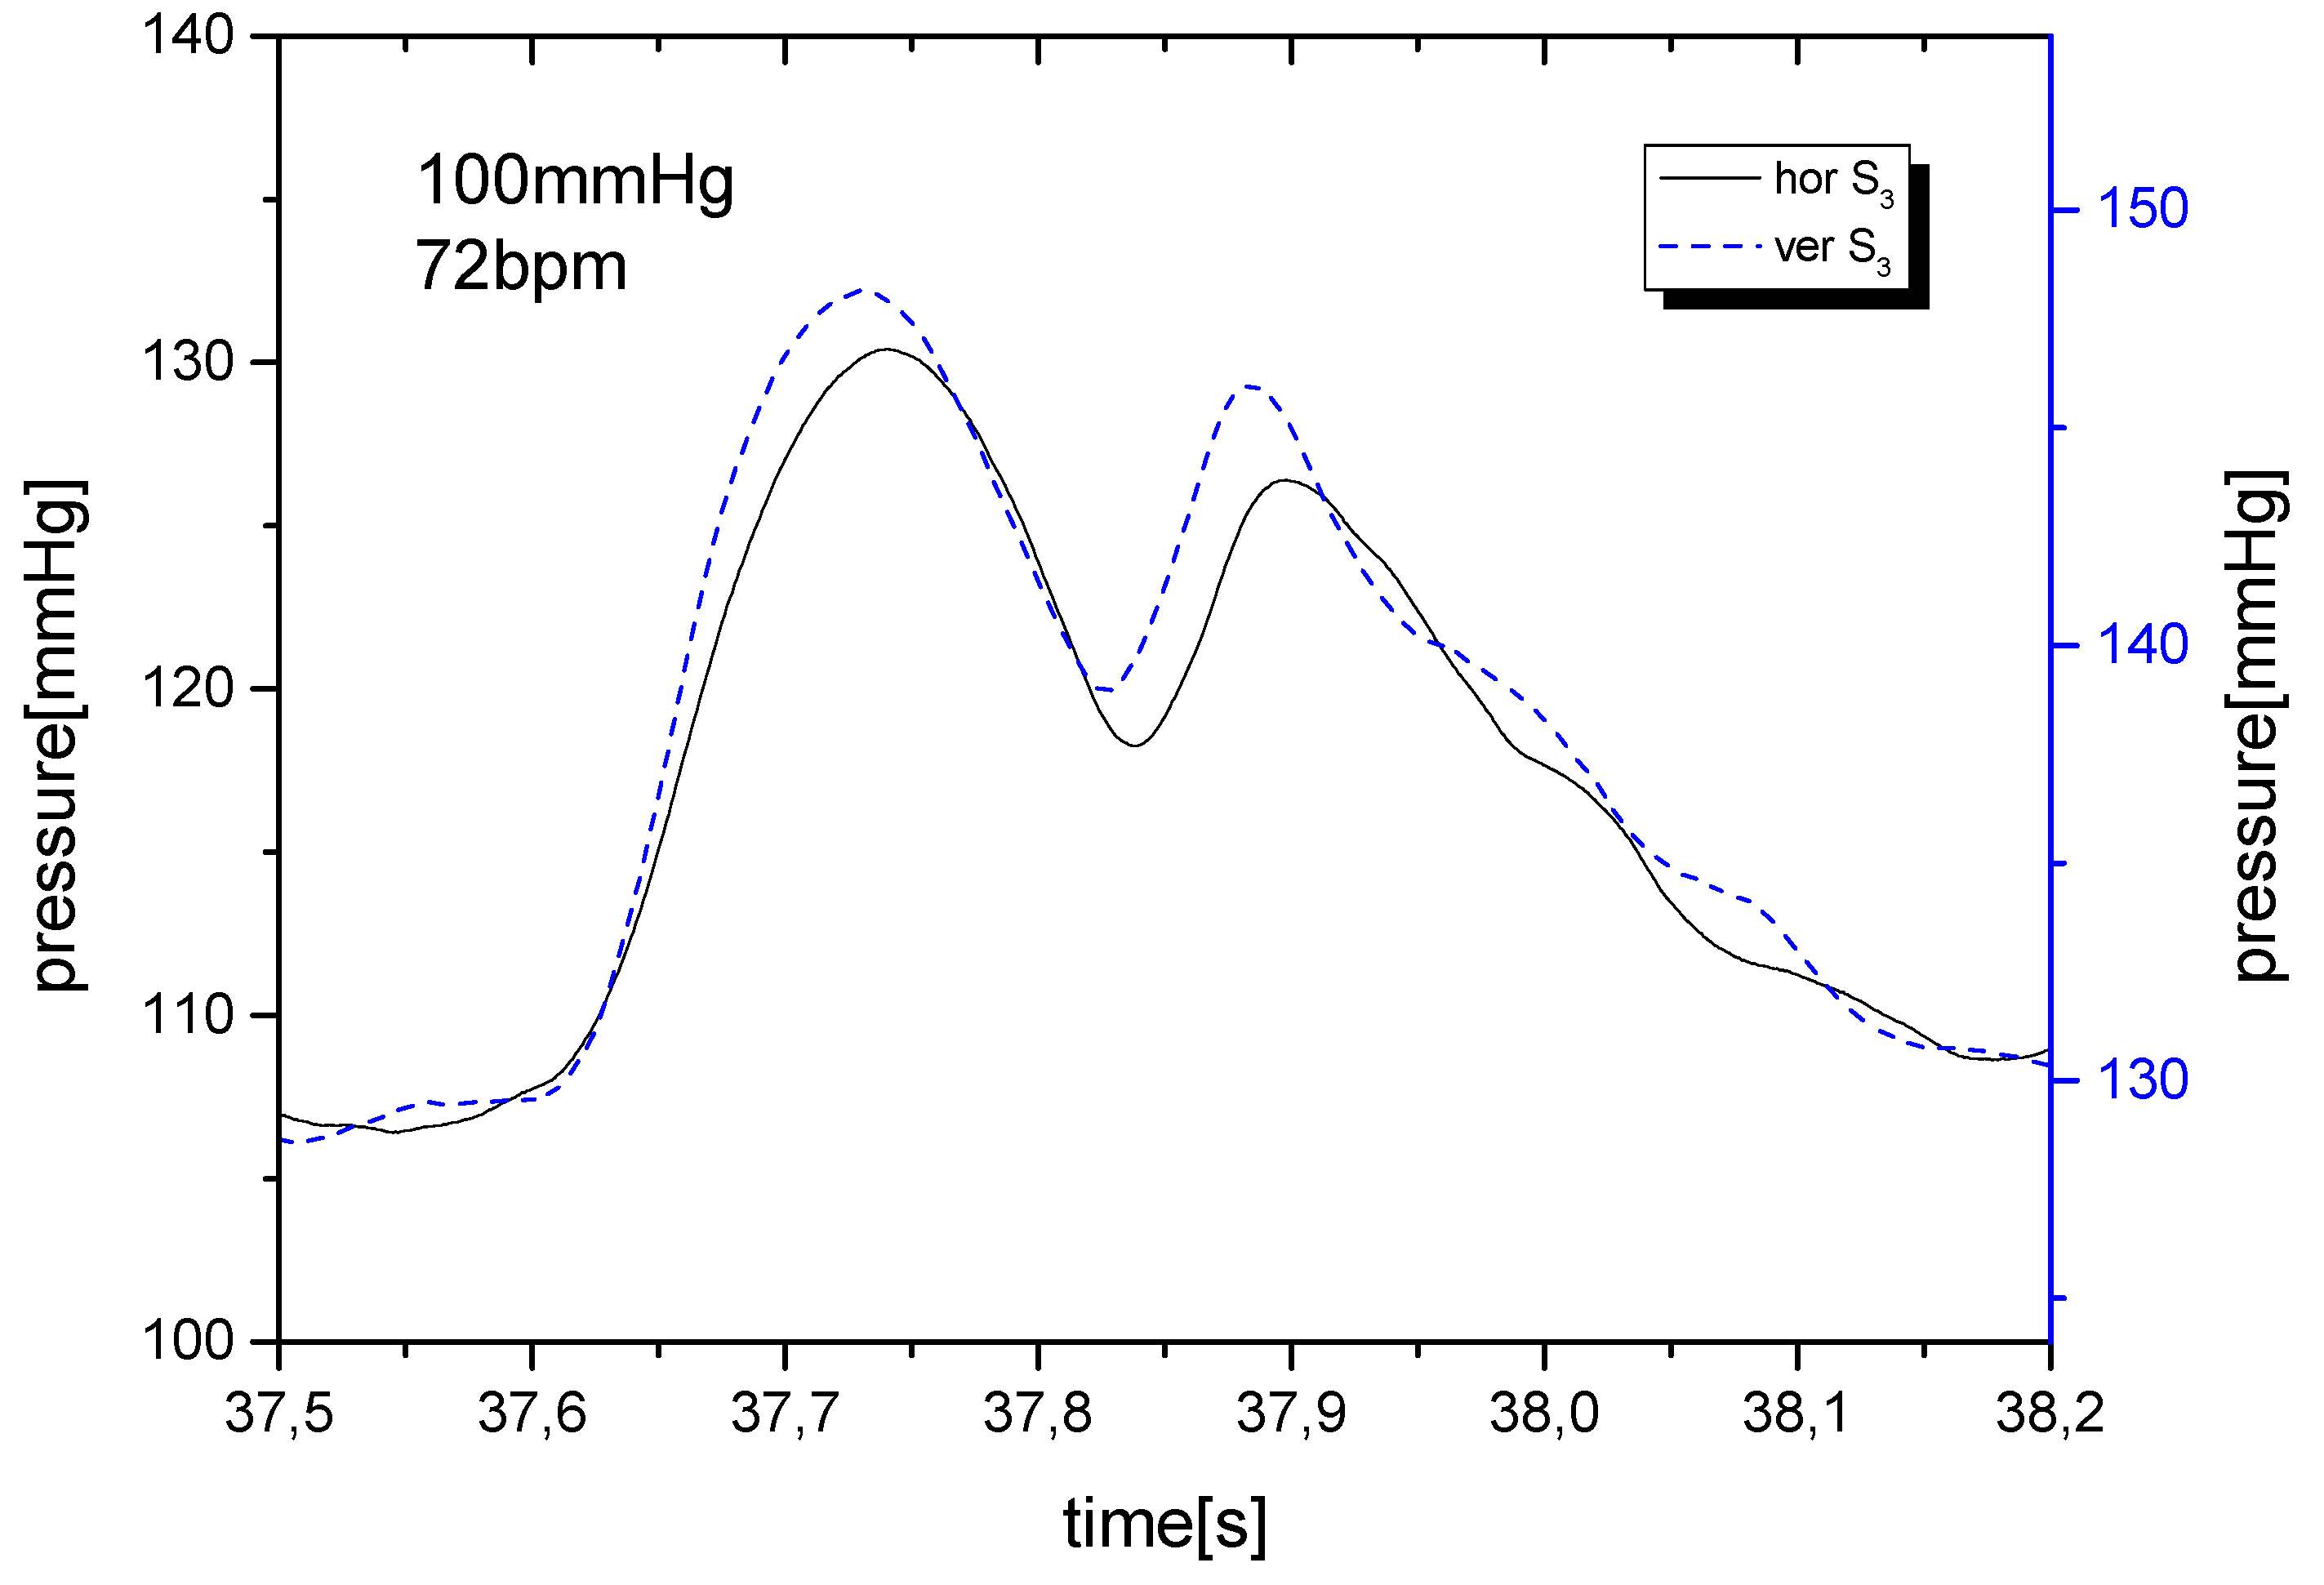
Figure 3.
A – Pulse pressure waveforms on sensors S2-S5 in the horizontal (solid line) and vertical position of the model (dashed line). B – Comparison of pulse pressure waveforms on sensors S2-S5 at diastolic pressure of 80 mmHg (solid line) and 90 mmHg (solid line) in the vertical position of the model.
Figure 3.
A – Pulse pressure waveforms on sensors S2-S5 in the horizontal (solid line) and vertical position of the model (dashed line). B – Comparison of pulse pressure waveforms on sensors S2-S5 at diastolic pressure of 80 mmHg (solid line) and 90 mmHg (solid line) in the vertical position of the model.
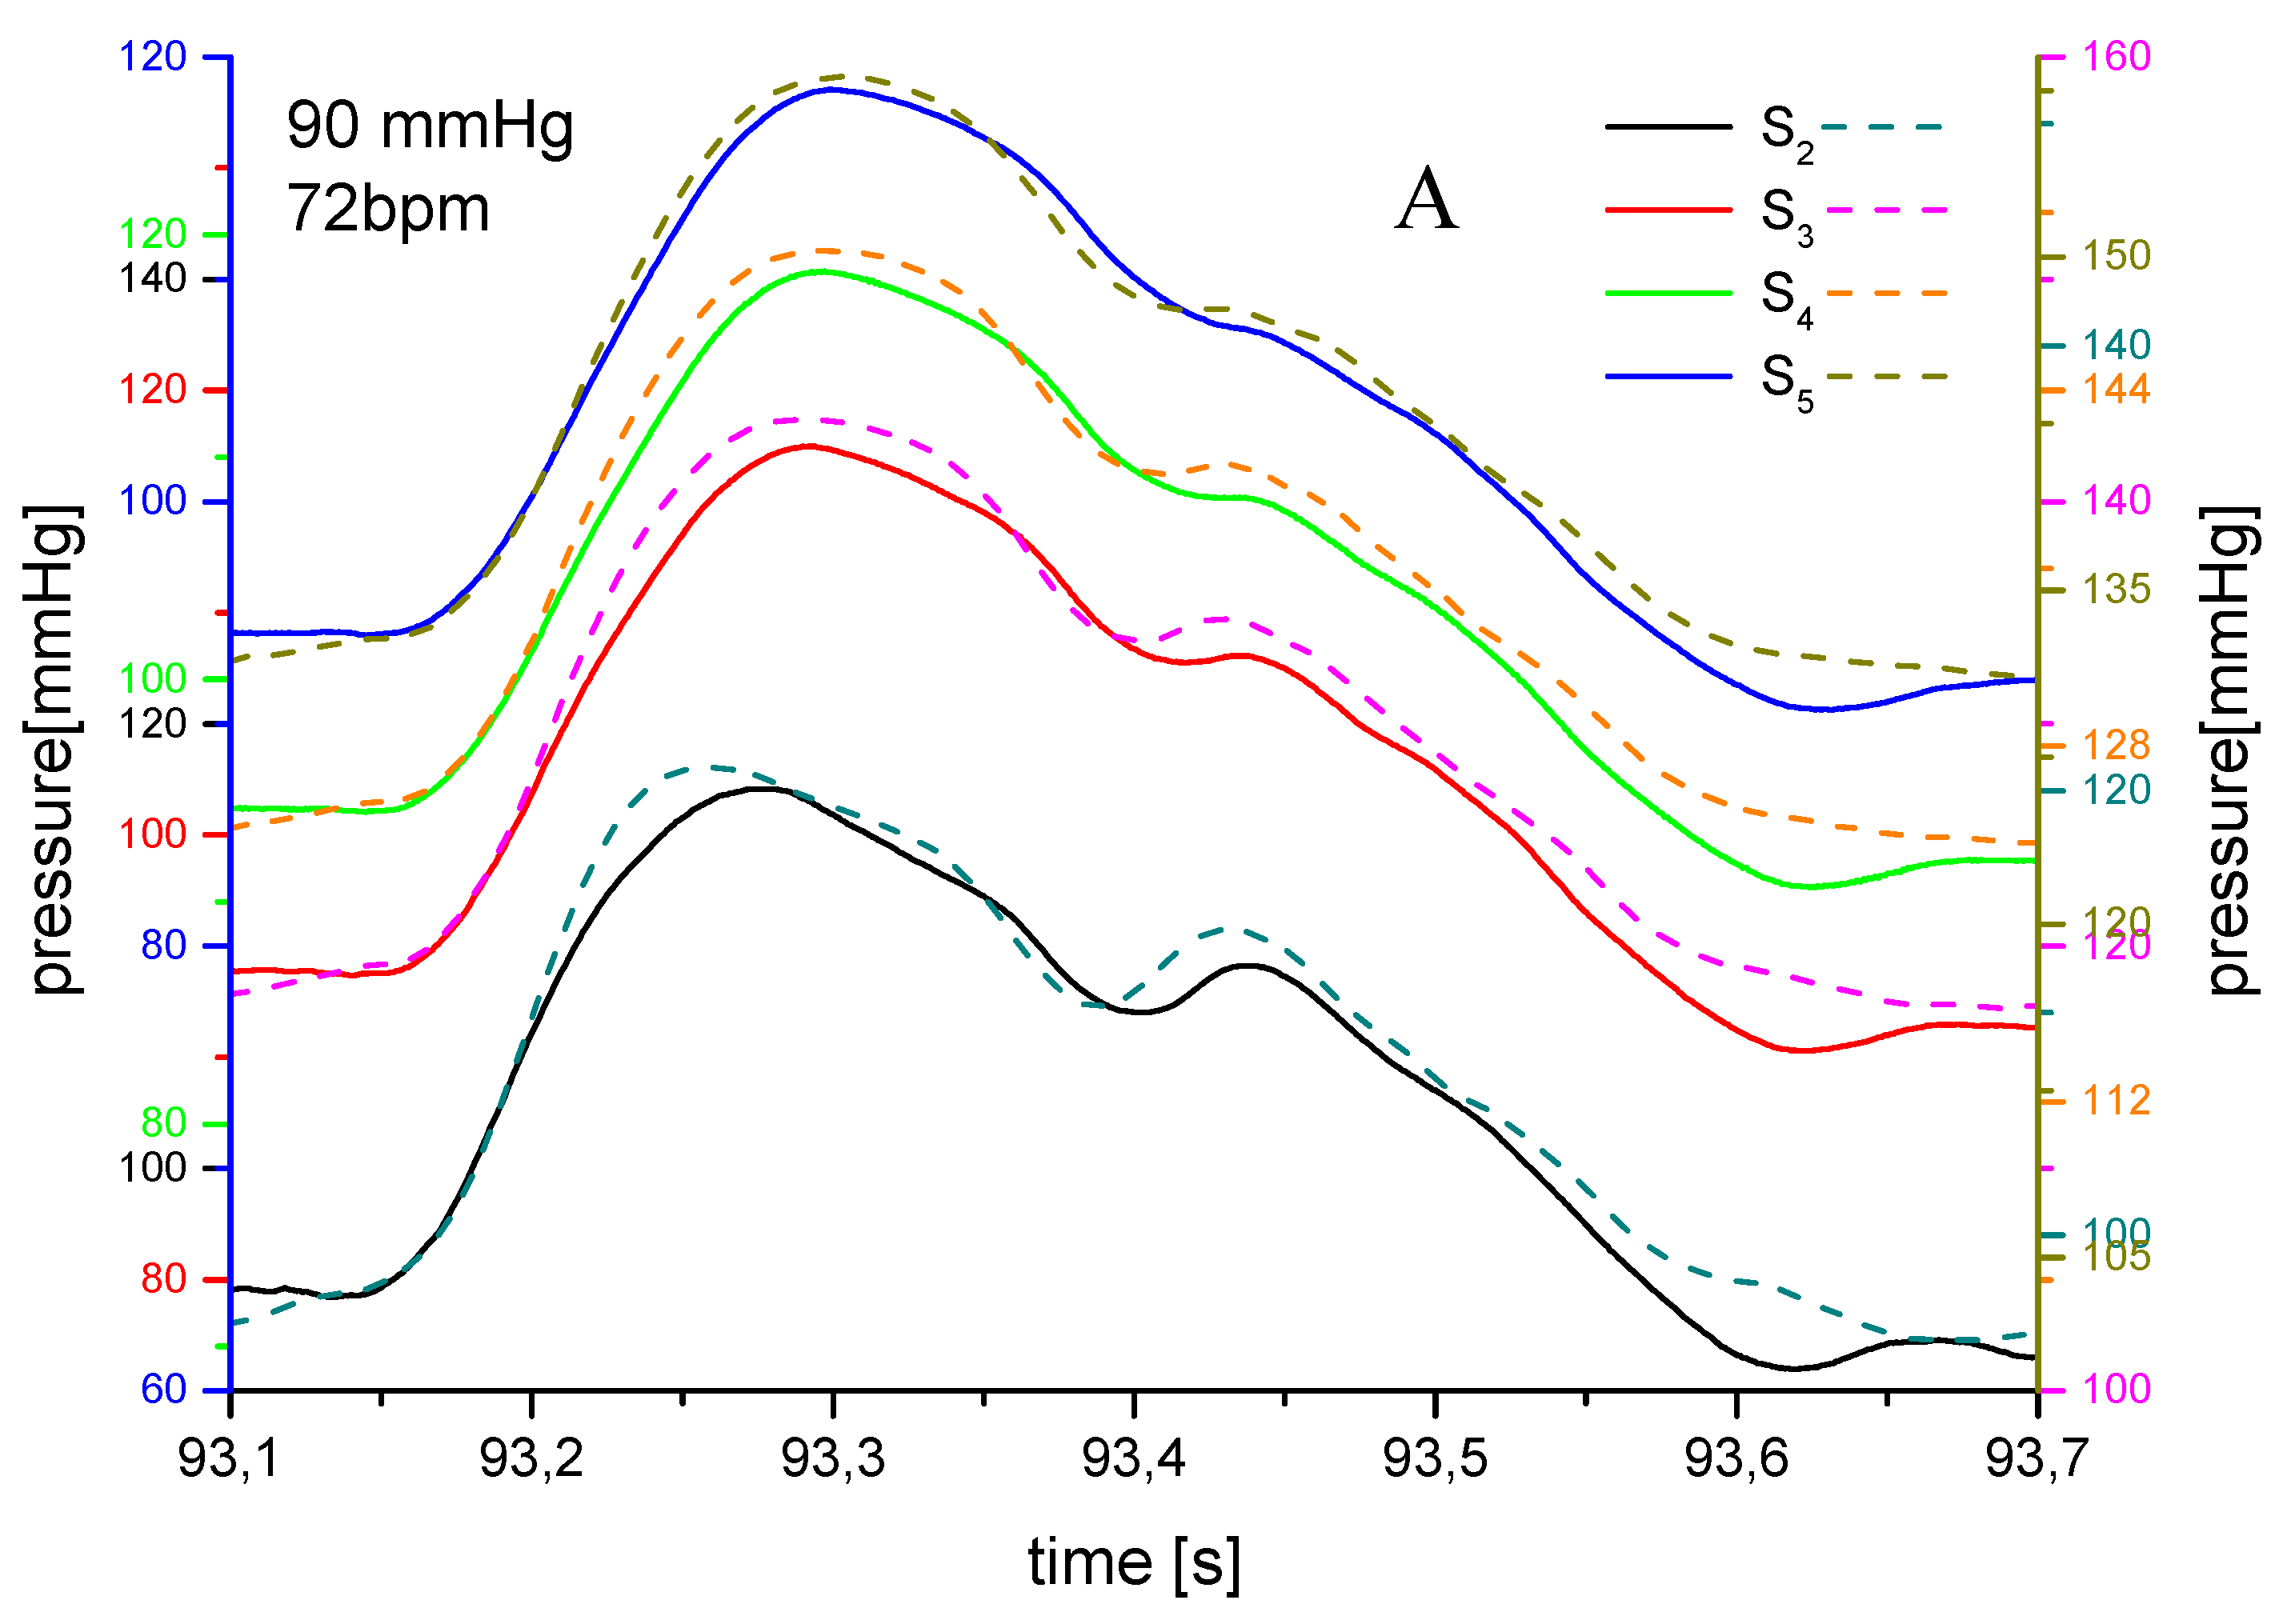
Figure 4.
Pulse waveforms of pressure on the sensors in the horizontal and vertical position of the model. The maximum pressure values are higher when the model is in a vertical position.
Figure 4.
Pulse waveforms of pressure on the sensors in the horizontal and vertical position of the model. The maximum pressure values are higher when the model is in a vertical position.
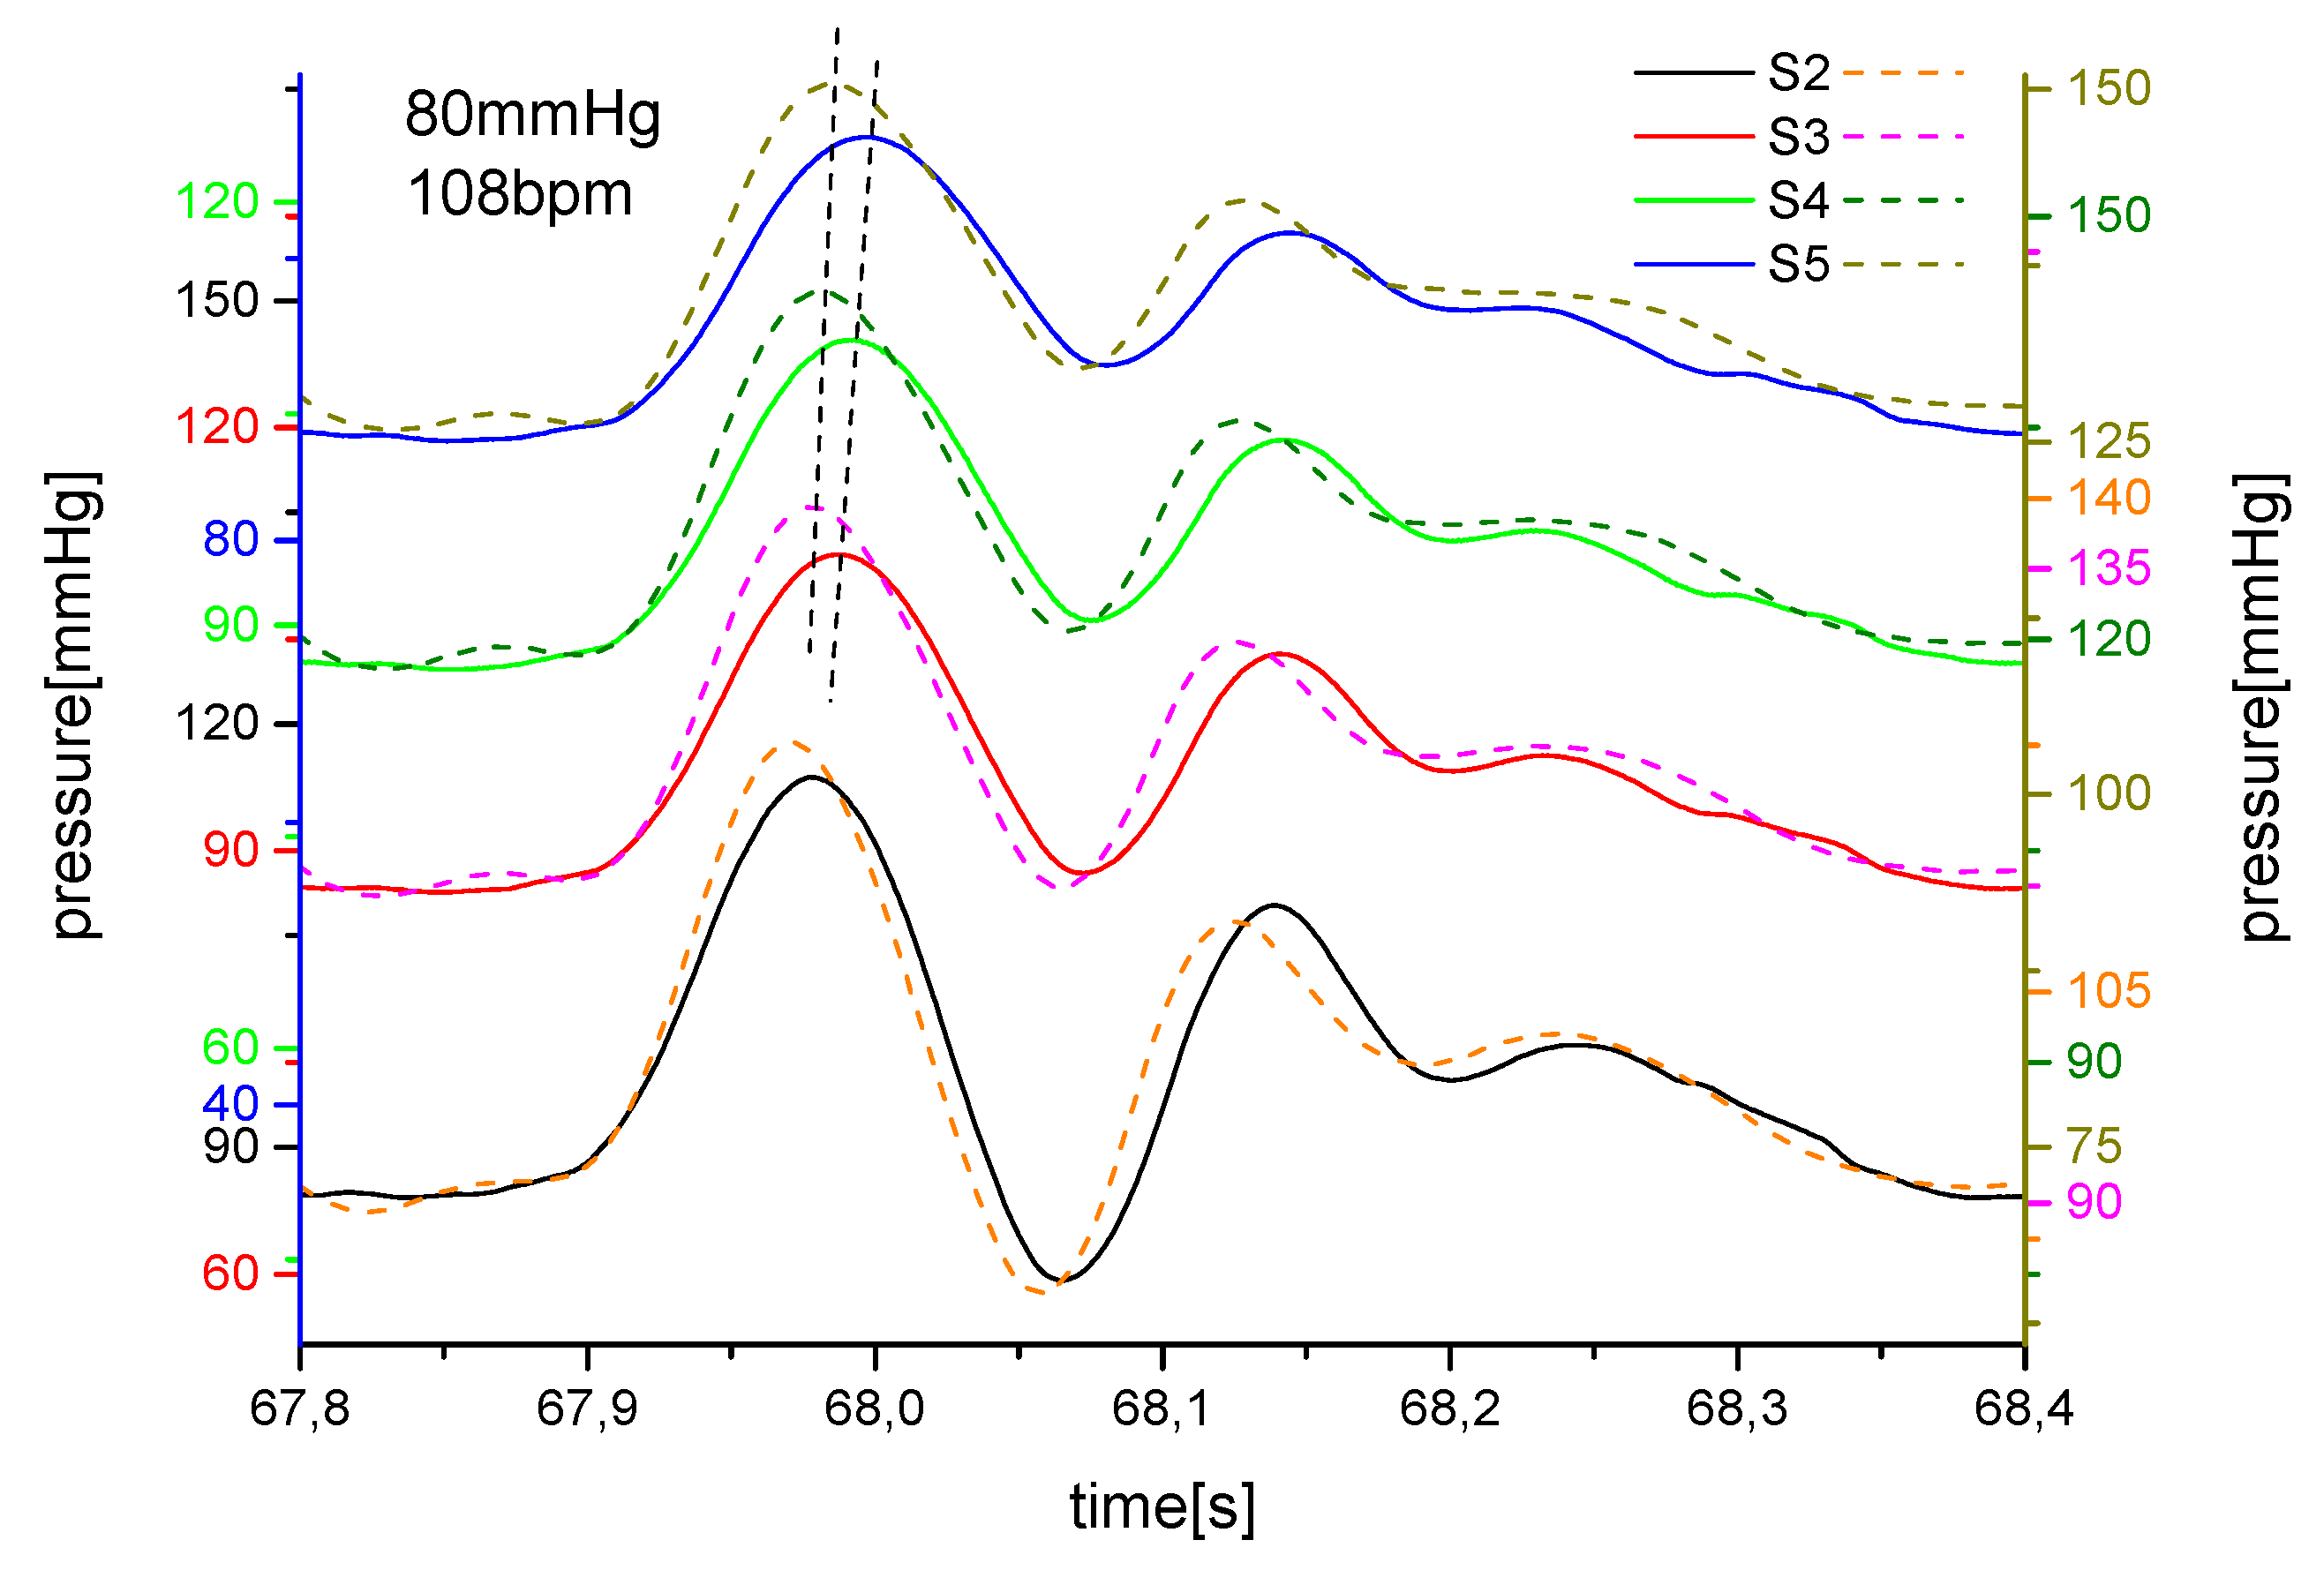
Figure 5.
A – Sensor application sites. B – Recorded ECG and blood flow waveforms on the carotid and femoral artery. Dt - wave propagation time from the heart to the recording site.
Figure 5.
A – Sensor application sites. B – Recorded ECG and blood flow waveforms on the carotid and femoral artery. Dt - wave propagation time from the heart to the recording site.
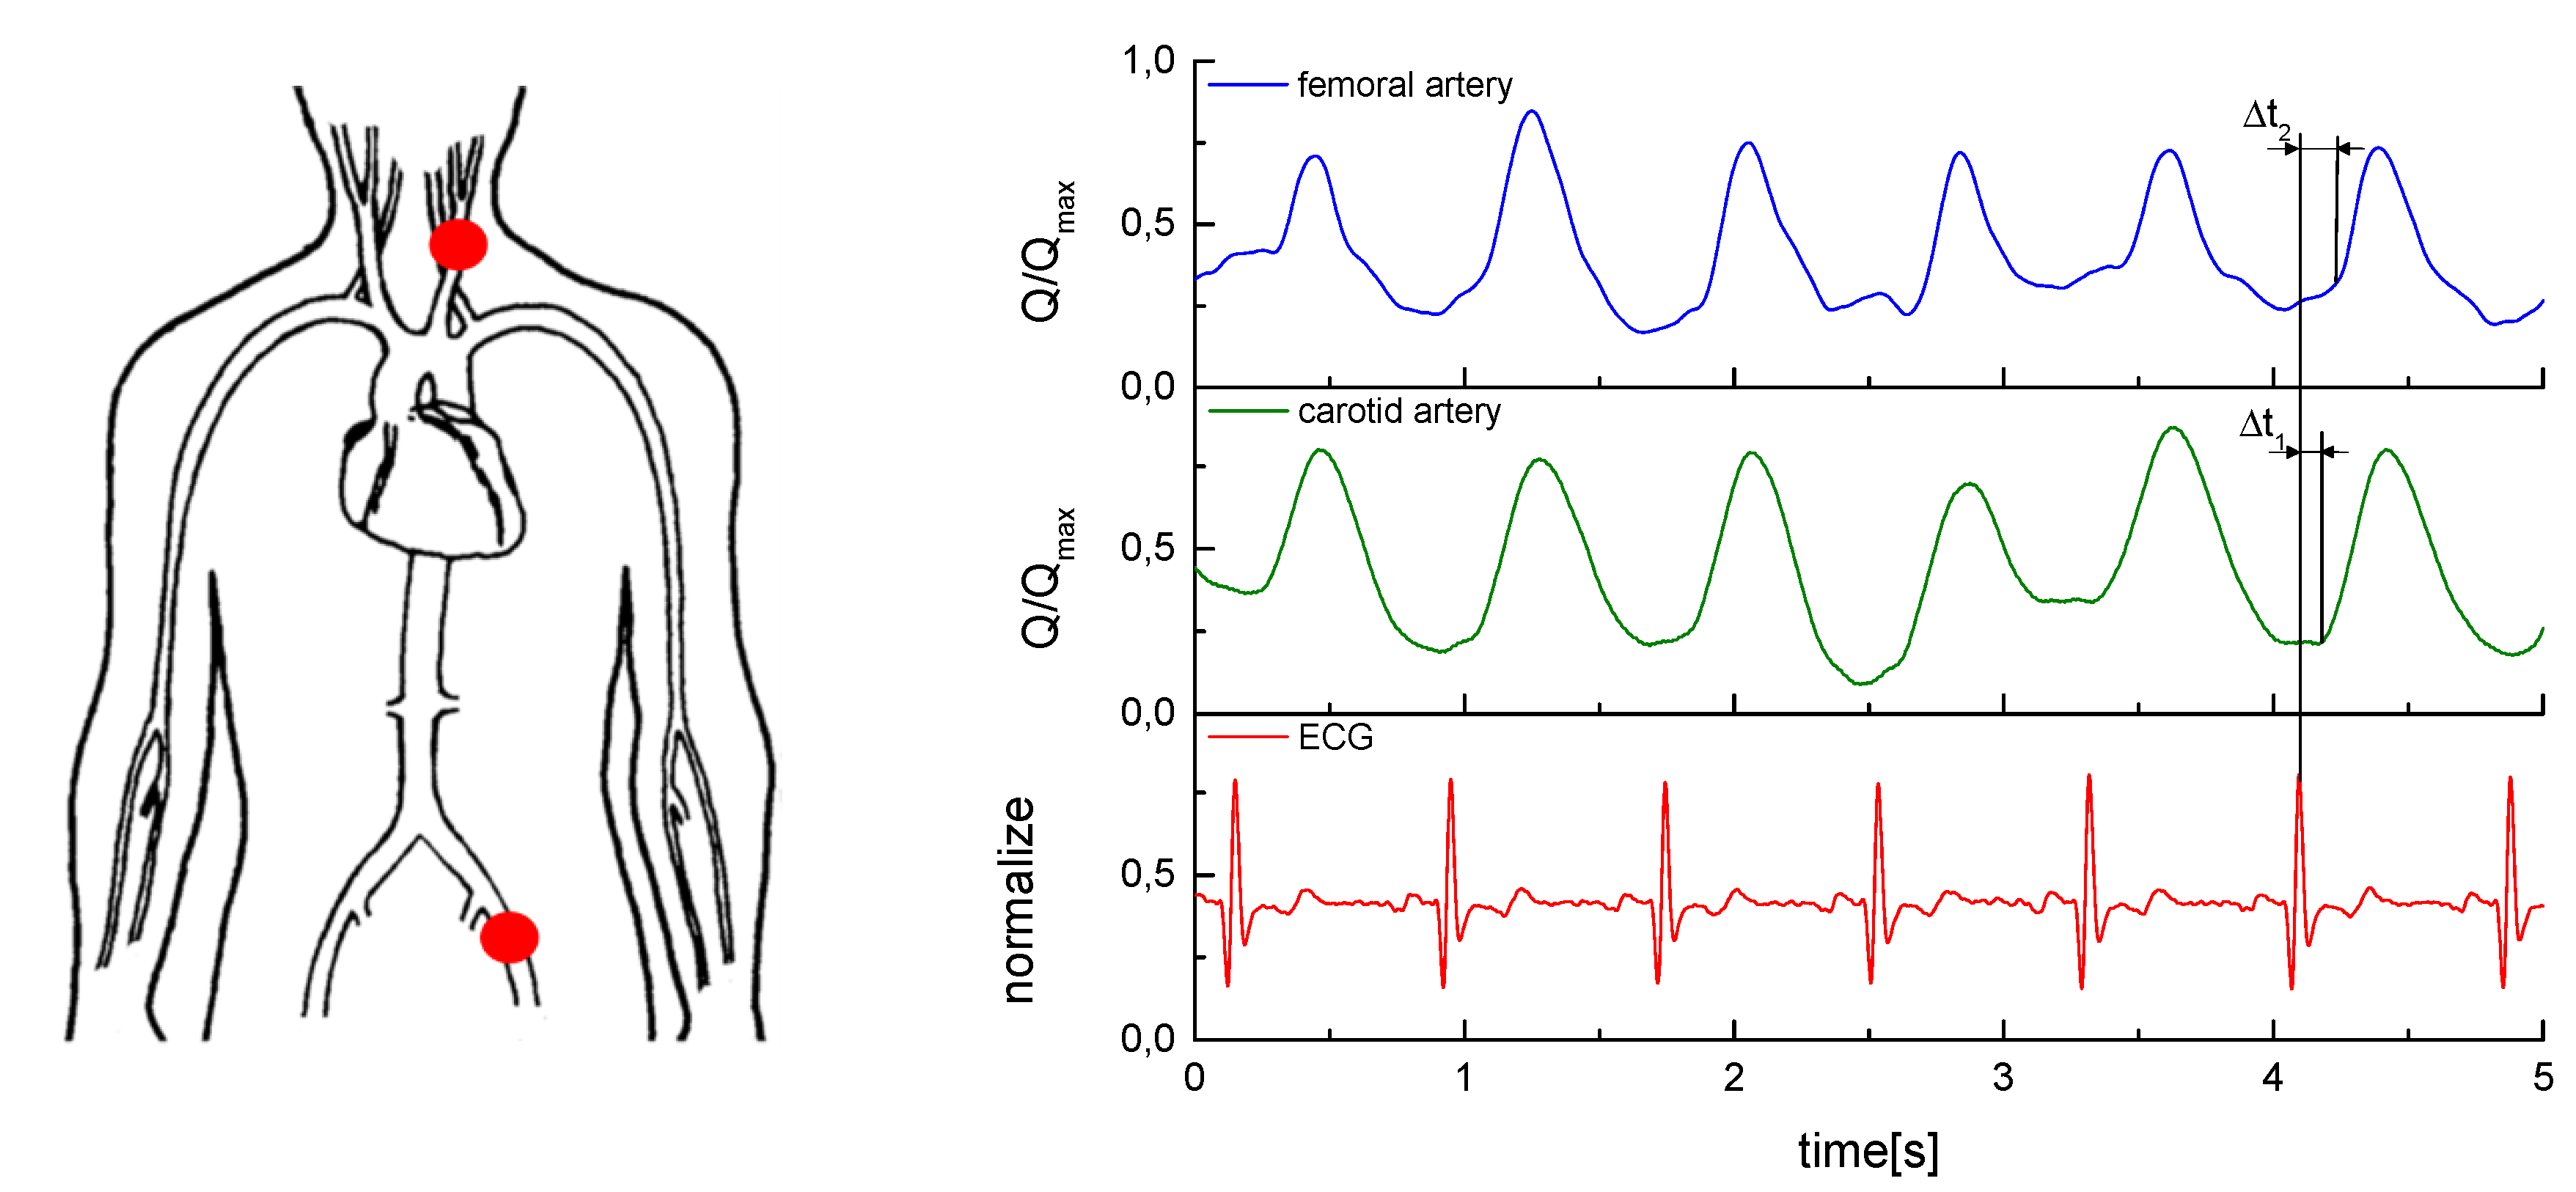
Figure 6.
Calculated pulse transit times from the heart to the recording site on the carotid and femoral arteries vs. heart beats in the supine and standing positions for one subject.
Figure 6.
Calculated pulse transit times from the heart to the recording site on the carotid and femoral arteries vs. heart beats in the supine and standing positions for one subject.
Disclaimer/Publisher’s Note: The statements, opinions and data contained in all publications are solely those of the individual author(s) and contributor(s) and not of MDPI and/or the editor(s). MDPI and/or the editor(s) disclaim responsibility for any injury to people or property resulting from any ideas, methods, instructions or products referred to in the content. |
© 2026 by the authors. Licensee MDPI, Basel, Switzerland. This article is an open access article distributed under the terms and conditions of the Creative Commons Attribution (CC BY) license (http://creativecommons.org/licenses/by/4.0/).
Copyright: This open access article is published under a Creative Commons CC BY 4.0 license, which permit the free download, distribution, and reuse, provided that the author and preprint are cited in any reuse.