

Submitted:
30 April 2026
Posted:
05 May 2026
You are already at the latest version
Abstract
Output-based indicators in entrepreneurial ecosystem governance systematically misclassify pre-threshold structural progress as policy failure, because feedback dynamics produce no immediate output signal. This study examines how institutional coordination shapes those dynamics. Using system dynamics modelling, we construct a three-stock model (active startups, entrepreneurial capabilities, and institutional support). Calibration is performed via structured expert elicitation using the Repertory Grid Technique (RGT), enabling institutionally grounded parameter estimation where comparable time-series data are unavailable. Three policy scenarios — fragmented support, financial intensification without coordination, and coordinated early intervention — are simulated for Mexico and the United Kingdom. Resource intensification alone yields only temporary gains when feedback structures remain fragmented. Coordinated intervention activates reinforcing feedback among all three stocks, enabling self-sustaining growth beyond a critical coordination threshold. The United Kingdom crosses this threshold earlier due to stronger baseline conditions; Mexico responds later but with larger proportional gains. The model provides a feedback-structural diagnostic that distinguishes pre-threshold structural assembly from genuine stagnation, with direct implications for the design of evaluation frameworks in fragile institutional contexts. RGT demonstrates potential as a calibration strategy for feedback models in data-sparse settings.
Keywords:
system dynamics
; Systems thinking
; systems practice
; entrepreneurial ecosystems
; institutional coordination
; policy evaluation
; threshold dynamics
; capability accumulation
1. Introduction
In some institutional settings, additional financing, mentoring, or policy efforts generate durable capability growth. In others, the same interventions produce only temporary activity before the system returns to stagnation. The central problem is not whether ecosystems perform better at a given moment, but why similarly resourced ecosystems follow different long-run trajectories. This study applies systems thinking — specifically, system dynamics modelling — to explain this divergence by examining how the structure of feedback shapes an ecosystem’s developmental capacity independently of resource endowment.
Static indicators do not merely fail to capture this problem — they actively mislead it. Research increasingly describes ecosystem evolution through feedback, accumulation, delay, and path dependence. Yet much empirical work still relies on cross-sectional proxies and correlational designs, producing a systematic mismatch between how the field theorises change and how it measures it.
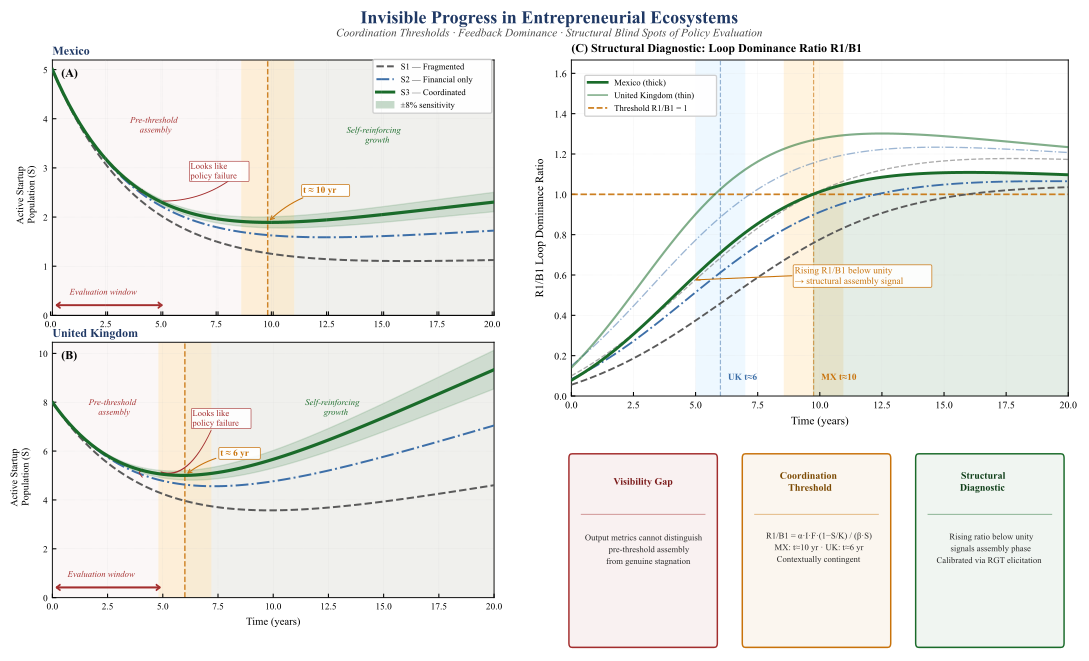
This mismatch creates a visibility gap. The structural changes that determine long-run ecosystem trajectories occur at the level of feedback architecture. They produce no immediate output signal. Policymakers relying on output indicators — startup counts, funding volumes, short-run activity rates — see the same surface pattern in two structurally different situations. One system is stagnating. The other is assembling the preconditions for self-reinforcing growth. The indicators cannot tell them apart. The consequence is predictable: resource-volume policies fail in fragmented ecosystems, not because of insufficient effort, but because reinforcing feedback mechanisms do not activate. Below a critical coordination threshold, additional inputs dissipate rather than compound. Acting on misleading signals, practitioners withdraw support at the moment it is most structurally necessary. Addressing this gap requires dynamic modelling that makes the feedback structure analytically visible before that misreading becomes irreversible.
System dynamics is well-suited to this problem because it analyses long-run trajectories as properties of the feedback structure rather than as outcomes of isolated inputs. We develop a comparative model of technology-oriented entrepreneurial ecosystems with three interacting stocks: the active startup population, accumulated entrepreneurial capabilities, and institutional support. The model examines how these feedback structures generate divergent long-run trajectories under the institutional conditions represented by Mexico and the United Kingdom.
The analysis identifies a model-derived coordination threshold — a structural condition in the simulation below which ecosystems remain in self-limiting regimes regardless of resource availability. The study provides a feedback-structural diagnostic for ecosystem analysis. It specifies the institutional conditions under which coordinated intervention becomes self-reinforcing. It does not replace static indicators — it shows when they mislead.
The findings carry conditional implications for systems practice within the model’s scope. The visibility gap identified above — the structural invisibility of pre-threshold assembly within conventional evaluation frameworks — is not only an analytical problem. It is a governance problem: it systematically misclassifies structural progress as policy failure, leading practitioners to withdraw coordination support precisely when sustained commitment is most structurally consequential. Policymakers, universities, incubators, and intermediaries may use the model’s structural logic to assess whether a given institutional configuration is positioned to generate self-reinforcing development, to identify the coordination conditions under which that transition becomes structurally plausible, and to distinguish pre-threshold assembly from genuine stagnation before that distinction becomes visible in aggregate output metrics.
This leads to the central research question:
How does institutional coordination shape the feedback dynamics through which entrepreneurial ecosystems develop, and under what conditions can coordinated intervention trigger threshold-driven transformation?
We address this question through a comparative system dynamics analysis of Mexico and the United Kingdom. The article makes three contributions. First, it provides simulation-based evidence suggesting that feedback structure, rather than resource volume, is a primary determinant of ecosystem trajectories under the modelled conditions, reframing underperformance as a problem of structural misalignment. Second, it formalises the coordination threshold as a diagnostic variable that specifies when reinforcing loops dominate balancing loops, providing a model-based tool for policy sequencing and intervention design. Third, it shows that short-cycle evaluation frameworks are structurally misaligned with pre-threshold system assembly in the simulated contexts — a pattern with implications for how evaluation criteria and intervention timelines are designed in practice.
The remainder of the article is organised as follows. Section 2 reviews the relevant literature. Section 3 presents the model design and structure. Section 4 reports the simulation results. Section 5 discusses the findings. Section 6 outlines implications for practice and research. Section 7 concludes.
2. Literature Review
2.1. Entrepreneurial Ecosystems as Feedback-Driven Systems
Research on technology-oriented entrepreneurship has shifted from individual-level explanations to ecosystem-level frameworks that treat institutional, relational, and infrastructural conditions as endogenous drivers of entrepreneurial outcomes. This shift matters because ecosystem performance cannot be explained by isolated resource inputs. It depends on how actors, institutions, and support structures interact over time to shape venture creation, survival, and capability accumulation [1,2,3].
Entrepreneurial ecosystem theory offers a useful framework for analysing these interdependencies. Isenberg [4] highlighted the policy relevance of the ecosystem approach by showing that performance depends on interactions across multiple domains rather than on a single input. Spigel [5] showed that outcomes depend not only on resource availability but also on the quality of the relationships linking them. This insight supports this study’s focus on coordination as a structural property rather than a policy label. Stam [6] and, more recently, Wurth et al. [7] argued that entrepreneurial outcomes emerge from the interaction of systemic conditions over time, while noting that much research remains descriptive rather than dynamically explanatory.
These insights are critical when comparing ecosystems with distinct institutional histories and capacities for coordinated action. Prior studies caution against transferring policy lessons directly from high-performing contexts to weaker institutional settings [8,9]. The same intervention may yield different effects because outcomes depend on institutional density, the quality of coordination, and the absorptive capacity of intermediary organisations. Ecosystems, therefore, differ not only in current performance but also in the structural conditions that shape their potential development paths.
From a systems-thinking perspective, this entails a key analytical shift. The focus is not only on why some ecosystems generate more startups at a given moment, but also on how institutional configurations create the feedback conditions that sustain capability development over time. This study adopts that perspective by examining how system structure determines whether available inputs translate into reinforcing, cumulative growth.
2.2. The Structural Role of Universities in Ecosystem Feedback
Within the broader ecosystem architecture, universities occupy a distinctive structural role because they preserve knowledge, relationships, and organisational routines over timescales that exceed most policy cycles. The model developed here does not disaggregate university contributions from those of other long-lived intermediary actors — both are aggregated into the capability stock C and the institutional support stock I to maintain parsimony. Universities are treated as the primary theoretical exemplar of this class of actor, informed by the entrepreneurial university literature, but the model’s formal structure applies equally to any intermediary whose contributions are slow-depreciating and persist across policy cycles. In the model, universities are treated as contributors to the slow-depreciating dimensions of ecosystem capability — an interpretive rationale for why the capability stock C has a longer time constant than S, informed by the entrepreneurial university literature [10,11], rather than a validated sub-model of university behaviour. Their contribution extends beyond knowledge transfer. Universities sustain entrepreneurial capacities through training, mentoring, convening, legitimacy-building, and cross-sector relationships. These contributions flow primarily into the capability stock C — the model’s slow stock — rather than into the faster-moving institutional support stock I. Because C has a substantially longer time constant than either S or I, university contributions accumulate gradually but persist across policy cycles. They provide a structural foundation that outlasts individual programmes and endures shifts in political priorities. This slow-depreciating character is precisely what makes universities analytically distinct from other ecosystem actors: their value lies not in rapid output but in maintaining the capability that the R1 loop requires to remain viable during periods of institutional disruption.
This modelling choice aligns with the Triple Helix perspective, in which universities, industry, and government co-evolve through hybrid institutional arrangements rather than as separate functions [12]. It also reflects the entrepreneurial university literature, which shows that universities act as anchors for venture formation, capability development, and regional innovation renewal [10,11]. In fragmented ecosystems, this anchoring role becomes even more important. Where policy support is intermittent and intermediary capacity is limited, Universities may, in some contexts, provide a relatively stable source of institutional continuity. The model captures this through the capability depreciation rate (η). It does not, however, differentiate university contributions from those of other long-lived intermediary organisations.
In the system dynamics model, this role is represented by the institutional support (I) and capability (C) stocks. Universities contribute to both inflows through programme delivery and by preserving experiential knowledge and network capital that might otherwise decay during institutional disruption. Treating universities as embedded feedback actors, rather than peripheral service providers, is supported by evidence that their influence operates through slow, cumulative processes rather than discrete outputs [10,13,14]. This is an analytical simplification that assigns universities a structural position in the feedback system without resolving which specific activities matter most. Its structural implication, however, is precise: in fragile or fragmented institutional contexts, universities serve as the primary mechanism by which the ecosystem retains its capability stock C during periods when the institutional support stock I declines. When policy effort contracts — whether through budget cuts, programme discontinuity, or inter-administration ruptures — the decay rate of I accelerates, and B1 loop dominance strengthens, pushing the system back toward self-limiting dynamics. Universities slow this regression by maintaining the slow-depreciating dimensions of C. These include experiential knowledge, mentoring density, and network capital. Without that maintenance, these stocks erode faster than new policy efforts can rebuild them. In this sense, universities are not merely contributors to ecosystem development — they are the institutional memory that prevents the B1 loop from becoming structurally permanent during governance discontinuities.
2.3. System Dynamics as a Framework for Ecosystem Feedback Analysis
If entrepreneurial ecosystems evolve through interdependence, delay, and the development of cumulative capabilities, static analysis is insufficient. System dynamics provides an appropriate framework because it examines development as a function of dynamic structure rather than static associations. Rather than identifying inputs that correlate with performance at a given moment, it explains how feedback loops, delays, accumulation, and structural constraints generate divergent trajectories over time [15,16]. This approach fits the present problem: it explains not only differences in current performance but also why similar interventions yield different long-run outcomes under varying institutional conditions.
System dynamics has been applied to innovation and entrepreneurship systems in contexts such as university–industry–government interactions, regional innovation, and technology policy. These studies share a common logic: they model institutions and policies as stocks that accumulate, decay, and interact via feedback mechanisms. This study extends that approach to compare coordination quality across ecosystems with unequal institutional depth—a question static designs cannot address.
This methodological choice also links directly to systems practice. Systems practice uses structural insight to inform decisions, identify leverage points, and design interventions aligned with system dynamics rather than surface outcomes [16,17]. The distinction is practical. Policymakers who rely on output indicators observe results but not the feedback conditions that determine whether those results persist. Structural diagnostics redirect attention to the trajectory of the underlying structure — whether the system is moving toward or away from self-reinforcing coordination — even when visible outputs remain modest.
The coordination threshold operationalises this diagnostic capacity. It is introduced here as a model-derived concept and formally defined in Section 4. It is not directly observable in real ecosystems. In the model, it marks the point at which the reinforcing loop driving startup growth (R1) equals and then exceeds the balancing loop governing exit (B1), expressed as R1/B1 = 1. As an analytical concept, it distinguishes systems with self-limiting dynamics from those with self-reinforcing dynamics. In practice, it reframes pre-threshold periods—where outputs may appear unchanged—as phases of structural assembly rather than policy failure. The coordination threshold is a model-derived analytical construct whose usefulness as a governance concept depends on whether real-world proxy indicators — such as those identified in Section 5.3 — can sufficiently approximate the underlying structural dynamics that the model formalises; the construct itself does not transfer to practice independently of that approximation.
This clarification of which feedback conditions support or constrain development provides a systems-thinking basis for sequencing interventions and for designing evaluation criteria aligned with the system’s temporal structure.
2.4. Research Gap and Contribution
Despite advances in entrepreneurial ecosystem research, three limitations remain relevant to this study. First, much of the literature explains ecosystem performance through static inventories of actors, resources, or support domains, with limited attention to how these elements interact over time to produce divergent trajectories. Second, although coordination is widely recognised as important, it is often treated descriptively rather than analysed as a structural mechanism that shapes capability formation through feedback processes. Third, comparative studies do not fully explain why similar policy interventions yield different long-run outcomes across ecosystems with varying degrees of institutional depth and coordination capacity.
System dynamics research has demonstrated the value of modelling innovation and entrepreneurship systems as endogenous feedback structures, including university–industry–government interactions in Latin America. This study does not introduce dynamic modelling to the field. Instead, it integrates three elements rarely combined in a single design: a model centred on the coordination–capability relationship; a comparison of an emerging and a mature ecosystem under equivalent scenarios; and a systematic analysis of the implications of feedback dynamics for intervention design and evaluation.
The gap addressed is both methodological and structural. The question is not whether ecosystems can be modelled dynamically, but whether such models clarify how the quality of coordination shapes feedback dominance and, in turn, which institutional configurations sustain cumulative capability growth over a policy-relevant horizon. By focusing on coordination, capability accumulation, and institutional continuity, the study explains why increasing resources alone may fail to shift trajectories and under which conditions coordinated institutional structures activate different feedback regimes. Whether these dynamics hold beyond the two cases examined remains an empirical question that the discussion section takes up.
This framing situates the study within applied systems thinking. It treats ecosystem development as a structural problem: how institutional arrangements configure the feedback conditions that shape trajectories. The study brings together three concerns often treated separately—conditions for feedback-driven growth, the coordination threshold as a diagnostic concept, and the mismatch between slow system change and short evaluation cycles—within a single model. In doing so, it contributes to both entrepreneurial ecosystem research and systems practice by providing a framework for assessing feedback structures, identifying coordination bottlenecks, and designing interventions aligned with system dynamics.
The study addresses the following research question: how does institutional coordination shape the feedback dynamics through which entrepreneurial ecosystems develop, and under what conditions can coordinated intervention trigger threshold-driven transformation? This question requires a dynamic approach because the issue is not only whether inputs differ across contexts, but also how coordination-sensitive feedback structures shape the emergence, delay, or suppression of self-reinforcing dynamics. The next section presents a comparative system dynamics design to examine these interactions in Mexico and the United Kingdom.
3. Research Design and Model Structure
3.1. Methodological Approach and Calibration Logic
To address the research question, the study adopts a comparative system dynamics design. This approach suits the problem because ecosystem development depends on interdependence, accumulation, feedback, and delay—features that static methods cannot capture. This aligns with the established epistemological position of system dynamics modelling, in which a model’s explanatory value lies in its ability to reproduce qualitative behavioural patterns and reveal structural mechanisms, not in the precision of any individual parameter estimate [16,18]. The present model is explicitly designed for structural explanation and scenario exploration: its purpose is to specify which feedback conditions, under plausible calibration assumptions, generate qualitatively distinct long-run trajectories — not to estimate the precise parameter values at which those trajectories occur or to predict empirical outcomes in the two national contexts. This design purpose defines the appropriate standard of evidence against which the model should be evaluated: the robustness of qualitative behavioural patterns across the calibration space, rather than the point accuracy of any individual simulation output [15,16].
The model follows standard procedures: causal loop mapping, stock-and-flow formulation, and mathematical specification. The construction sequence followed a deliberate logic. First, the causal loop structure was specified and qualitatively validated by the expert panel before any numerical values were assigned. This ensured that the feedback architecture was grounded in institutional knowledge rather than derived from parameter fitting. Second, equations were specified to match the loop structure. Third, parameters were assigned using four procedures, based on their nature and available evidence. Fourth, the model was tested behaviourally to confirm that trajectories reflect plausible ecosystem dynamics before running scenarios.
The model includes four parameter classes. Literature-informed parameters include the startup formation responsiveness (α), the returns-to-experience exponent (δ), and the performance feedback coefficient (φ). Their calibration ranges draw on published research in ecosystem and innovation systems. All are cross-validated against the empirical basis cited in Table 1. Expert-elicited parameters include baseline institutional support (I0), policy effectiveness (λ), learning intensity (γ), capability depreciation (η), institutional decay (μ), and the institutional capacity ceiling (K6). These were established through the structured RGT elicitation process described in Section 3.6. Panel medians serve as central values; interquartile ranges define plausible intervals. Design —fixed parameters—the financing scalar (F) and policy effort multiplier (P)—are set by the scenario design and remain fixed, representing controlled variation. We adjusted behaviourally tuned parameters — particularly the initial stock values (S0, C0) — to match the qualitative ecosystem behaviour the expert panel judged plausible, rather than fitting them to any specific time series. Calibration relies on consistency with qualitative behaviour and the literature, not on matching exact empirical values. The four parameter classes differ in evidential status.
Literature-informed parameters carry the strongest grounding. Their ranges are bounded by published findings that can be independently verified.
Expert-elicited parameters carry intermediate status. They are traceable to a documented elicitation procedure with reliability checks, but they represent structured judgement rather than direct measurement. The model’s inferential limits are most sensitive to uncertainty in this class — particularly in the Mexican context, where thinner documentation and the visibility gap in informal support structures constrain the precision of baseline estimates. Design-fixed parameters carry no calibration uncertainty. Their values are set by scenario logic, not estimated. Behaviourally tuned parameters carry the weakest external grounding. Their values were adjusted to reproduce qualitatively plausible trajectories — standard practice in exploratory SD modelling —, but the model’s dynamic behaviour was partly shaped by modelling judgement rather than independent evidence. Readers should weigh inferences accordingly. The model is designed for structural explanation and scenario exploration, not parameter estimation. Conclusions about the direction and qualitative pattern of ecosystem dynamics are more robust than conclusions about specific numerical thresholds or precise timing. Because the model serves as an exploratory structural tool rather than a predictive instrument, reported values should be interpreted as theoretically grounded calibration ranges rather than precise measurements. This aligns with system dynamics principles, in which explanatory value lies in reproducing behavioural patterns and identifying structural mechanisms rather than in estimating exact parameters [16,18]. The model’s diagnostic capacity is therefore conditional: it distinguishes structural states within the calibrated parameter space, and the strength of inference depends on how well the parameters reflect the characteristics of each institutional context. Further validation and robustness details appear in the appendices.

Table 1.
Model Parameters, Calibration Intervals, and Empirical Basis.
| Symbol | Parameter | Mexico (sim. value [interval]) | UK (sim. value [interval]) | Empirical / theoretical basis |
|---|---|---|---|---|
| A. Context-invariant parameters — same calibration across institutional settings | ||||
| α | Startup formation responsiveness to coordinated institutional support and financing | 0.18 [0.12–0.24] | 0.22 [0.15–0.28] | Isenberg [4]; Stam [6]; Spigel [5]; behavioural calibration |
| δ | Returns-to-experience exponent governing increasing returns in capability accumulation | 0.55 [0.40–0.70] | 0.60 [0.45–0.75] | Arrow [19]; Sterman [20]; behavioural calibration |
| φ | Performance feedback coefficient from startup population to institutional support (R2 loop) | 0.09 [0.06–0.14] | 0.12 [0.08–0.18] | Stam [6];Wurth et al. [7]; expert elicitation (RGT panel) |
| F | Financing availability scalar (scenario design — not subject to sensitivity analysis) | S1: 1.0 / S2: 1.5 / S3: 1.4 | S1: 1.0 / S2: 1.5 / S3: 1.4 | Scenario design; OECD [21]; LAVCA [22] |
| P | Policy effort multiplier (scenario design — not subject to sensitivity analysis) | S1–S2: 1.0 / S3: 1.6 | S1–S2: 1.0 / S3: 1.6 | Scenario design; Isenberg [4] |
| Sᴿᵉᶠ | Reference startup population for performance feedback normalisation | 1.0 (fixed) | 1.0 (fixed) | Model scaling constant; Sterman [16] |
| B. Context-specific parameters — calibrated separately via RGT expert elicitation | ||||
| β | Natural exit rate of early-stage startups (market selection and resource depletion) | 0.22 [0.20–0.28] | 0.18 [0.15–0.22] | GEM [23] discontinuation rates; World Bank Doing Business [24]; LAVCA [22] |
| γ | Learning intensity — rate at which active startup density generates ecosystem-level capabilities | 0.28 [0.24–0.32]* | 0.35 [0.31–0.40] | Expert elicitation (RGT panel); Spigel [5]; serial entrepreneur prevalence. GEM [23] |
| η | Capability depreciation rate (talent emigration, programme discontinuity, memory erosion) | 0.10 [0.08–0.12] | 0.06 [0.04–0.08] | OECD International Migration Outlook [25]; Guerrero and Urbano [11] |
| λ | Policy effectiveness — rate at which policy effort translates into institutional support | 0.11 [0.08–0.14] | 0.20 [0.16–0.24] | Expert elicitation (RGT panel); Wilson [26]; OECD SME Outlook [21] |
| μ | Institutional decay rate — deterioration of support without sustained policy effort | 0.08 [0.06–0.10] | 0.05 [0.03–0.06] | INADEM dissolution [27]; British Business Bank continuity record; Mason and Brown [9] |
| I0 | Baseline institutional support level at simulation start | 0.35 [0.30–0.42] | 0.60 [0.55–0.68] | GEM [21,23,28]; Kantis et al. [29] |
| K6 | Institutional capacity ceiling for capability accumulation (operationalises B2 loop) | 150 [125–175] | 250 [210–290] | Expert elicitation (RGT panel); Spigel [5]; derived proportionally to I0 differential |
* Values are expressed in normalised model units. For context-specific parameters, the reported simulation value is the panel median, and the interval is the interquartile range from the expert elicitation exercise. Scenario-design parameters (F, P) are fixed by design and are excluded from uncertainty analysis.
Having established the calibration logic and the empirical basis for the parameter ranges, the next subsection outlines the model’s internal structure through which these institutional differences generate divergent entrepreneurial trajectories.
To support independent verification and extension of these findings, the full model specification — including the governing differential equations, all parameter values and calibration intervals, scenario implementation logic, sensitivity perturbation routines, and numerical integration code — is provided in the Supplementary Material. The model was implemented in Python, and all simulation outputs reported in Section 4 are reproducible from the provided files. Reviewers wishing to replicate the threshold-crossing times, loop-dominance trajectories, or sensitivity-grid results can do so using the Supplementary Material without reference to any additional sources.
3.2. Model Boundary and Stock Structure
Building on the conceptualisation, we developed a stock-and-flow model to represent the dynamic relationships among startup activity, capability accumulation, and institutional support. The model boundary comprises three primary stocks: the active population of early-stage startups (S), the accumulated level of entrepreneurial capabilities (C), and the effective level of institutional support (I). These stocks interact through reinforcing and balancing feedback processes that shape ecosystem trajectories over time.
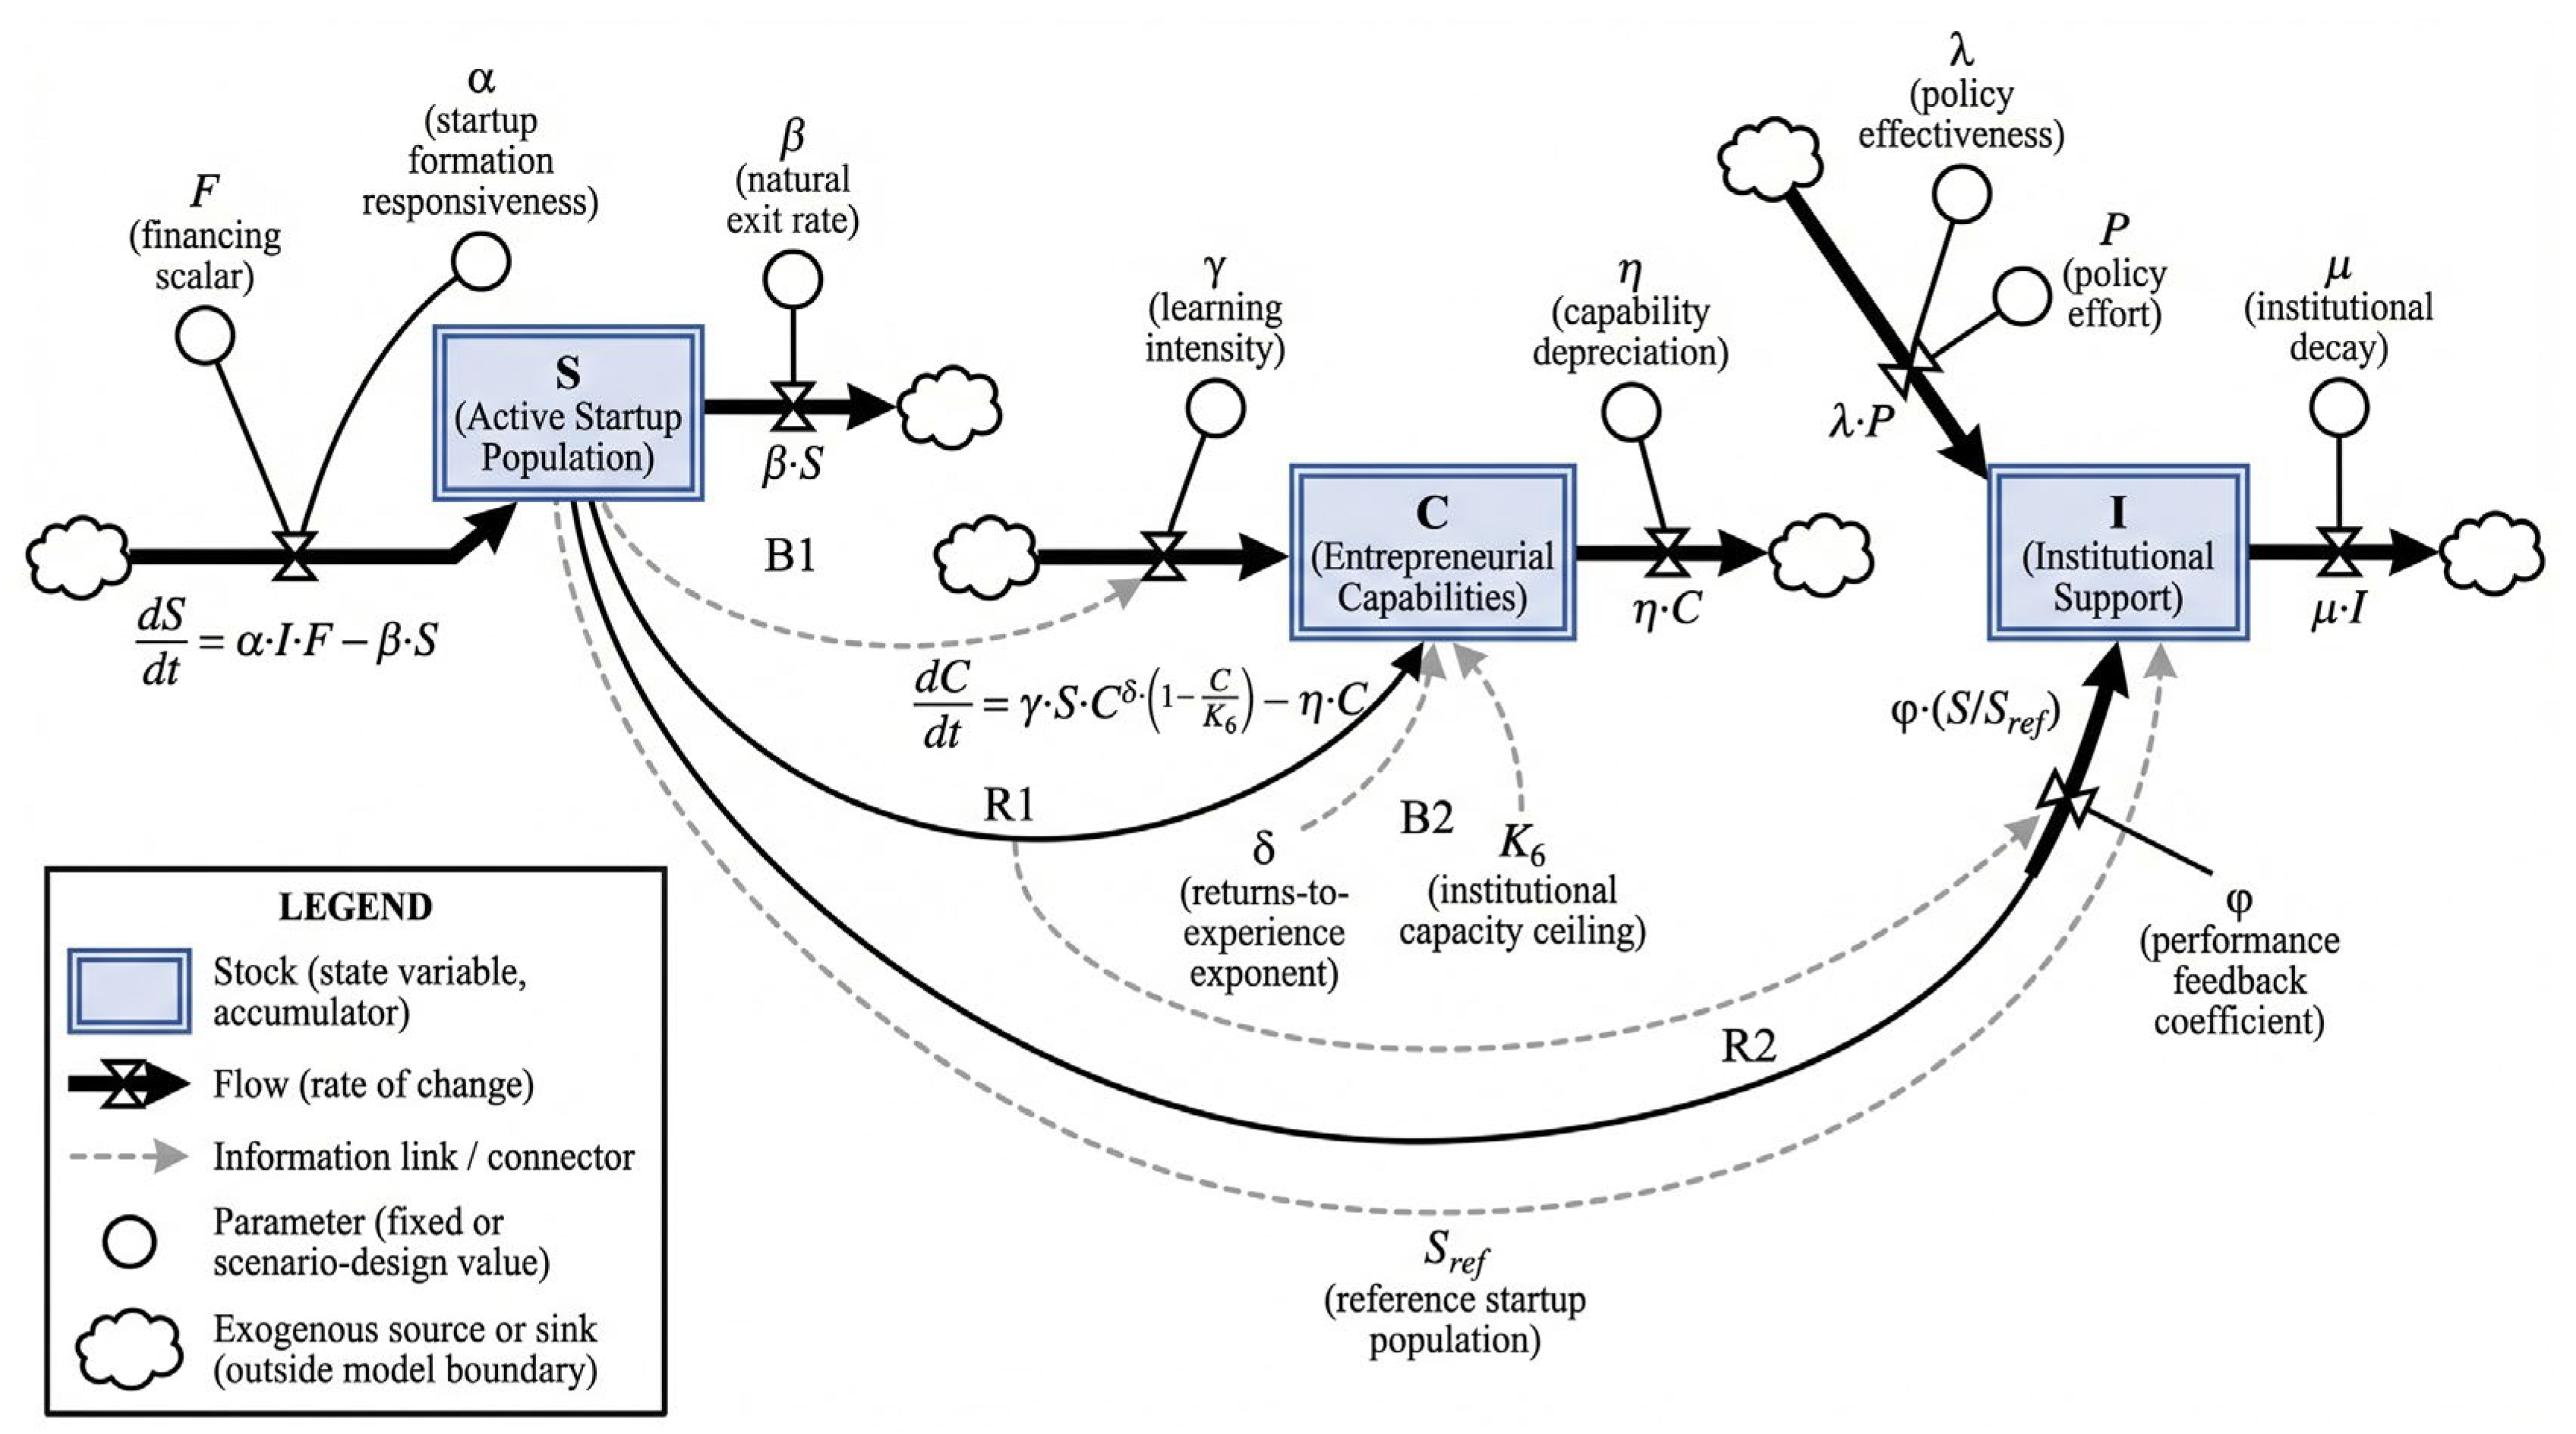
The startup stock (S) evolves through institutional support, access to financing, and exit dynamics. Coordinated support and financing increase startup formation, with the effect moderated by a logistic saturation term . This term reduces the effective creation rate as approaches the carrying capacity , thereby preventing unbounded growth and keeping formation dynamics consistent with the threshold ratio defined in Section 3.3. In practice, K captures the point at which market depth, talent availability, and intermediary bandwidth are fully absorbed. Observable signals of proximity to K include three patterns: graduate-to-venture ratios exceeding local absorption capacity, declining venture survival rates despite stable financing, and increasing founder emigration to larger markets. Practitioners monitoring these signals can treat them as indicators that the S inflow is approaching structural saturation. At that point, the policy priority shifts from volume-based entry support toward capability deepening and market expansion. Exits reflect market selection and resource constraints. The capability stock (C) captures ecosystem-level learning generated by startup activity. Inflows arise from learning-by-doing and knowledge spillovers, while outflows reflect depreciation from talent mobility, programme discontinuity, and loss of institutional memory. Capability accumulation is bounded by an institutional capacity ceiling (K6). The institutional support stock (I) represents the level of coordinated support available to startups. It increases with policy effort and performance feedback and declines when institutional continuity weakens, allowing the model to capture how coordination reinforces or constrains ecosystem development over time.
3.3. Feedback Loop Architecture
The three stocks generate two reinforcing and two balancing loops. Their interaction determines whether the ecosystem enters a self-reinforcing growth regime or remains self-limiting. Interpreting the simulation results requires understanding the causal logic of each loop.
Reinforcing loop R1 — Learning and Capability Formation. A larger startup population (S) increases ecosystem learning through spillovers, serial entrepreneurship, and peer knowledge exchange, thereby raising accumulated capabilities (C). Higher capabilities reduce failure rates and improve venture quality, reinforcing startup growth. This loop captures the learning-by-doing dynamic through which ecosystems become progressively more capable of sustaining new ventures. It activates only when startup density is sufficient to generate meaningful knowledge circulation. When R1 dominates, the system enters an accelerating growth regime driven by cumulative capability.
Reinforcing loop R2 — Ecosystem Attractiveness and Institutional Reinforcement. Growth in startup activity and visible performance attract institutional investment, strengthening institutional support (I). Increased support raises startup formation rates, reinforcing population growth. This loop reflects the political economy of ecosystem development: performance attracts resources, which expand the conditions for growth. R2 amplifies R1 when both loops are active. It remains dormant if startup activity is too low to generate visible performance signals.
Balancing loop B1 — Exit Pressure and Resource Constraints. Market selection and resource limits remove ventures from the startup population. When creation rates, driven by coordination and financing (α·I·F·(1−S/K)), fall below exit rates (β·S), B1 dominates, and the ecosystem remains self-limiting. Resource injections may produce temporary increases. Without reinforcing loop activation, activity reverts to a low equilibrium. B1 reflects the system’s baseline condition when coordination remains insufficient.
Balancing loop B2 — Institutional Capacity Ceiling. As capabilities approach the absorptive limit of intermediary infrastructure (K6), accumulation slows, producing an S-curve rather than exponential growth. B2 shapes the long-run plateau and prevents unrealistic expansion. The ceiling differs between Mexico and the United Kingdom. It reflects differences in institutional capacity and determines the long-run plateau under coordinated scenarios.
The model addresses a key structural question: when does dominance shift from B1 to R1, and at what level of coordination does this transition occur? The coordination threshold is defined formally as the condition at which the R1/B1 dominance ratio crosses unity — that is, the point at which the startup creation rate equals the exit rate:
R1/B1 = α · I · F · (1 − S/K) / (β · S)
The numerator is the full creation rate: policy-coordinated startup formation α·I·F, scaled by the logistic saturation term (1−S/K). This term approaches zero as S approaches the carrying capacity K. The denominator is the exit rate β·S. This condition is derived directly from setting dS/dt = 0 in the governing equation dS/dt = α·I·F·(1−S/K) − β·S: the threshold R1/B1 = 1 corresponds exactly to the boundary between net positive and net negative growth in the startup population. When the ratio exceeds 1, creation outpaces exit and R1 dominates; when it falls below 1, exit pressure prevails, and the system remains self-limiting. The coordination threshold is a derived diagnostic variable of the model, not an externally imposed parameter.
Under baseline calibration, the ratio begins below unity in both national contexts and across all scenarios at t = 0. This is consistent with the design intention that neither system starts in a reinforcing regime, and supports the interpretation that the threshold crossings observed in Scenario 3 are endogenously generated rather than artefacts of the initial specification.
Figure 1.
Feedback architecture of the entrepreneurial ecosystem model: reinforcing loops R1 (learning and capability formation) and R2 (ecosystem attractiveness), and balancing loops B1 (exit pressure) and B2 (institutional capacity ceiling).
Figure 1.
Feedback architecture of the entrepreneurial ecosystem model: reinforcing loops R1 (learning and capability formation) and R2 (ecosystem attractiveness), and balancing loops B1 (exit pressure) and B2 (institutional capacity ceiling).
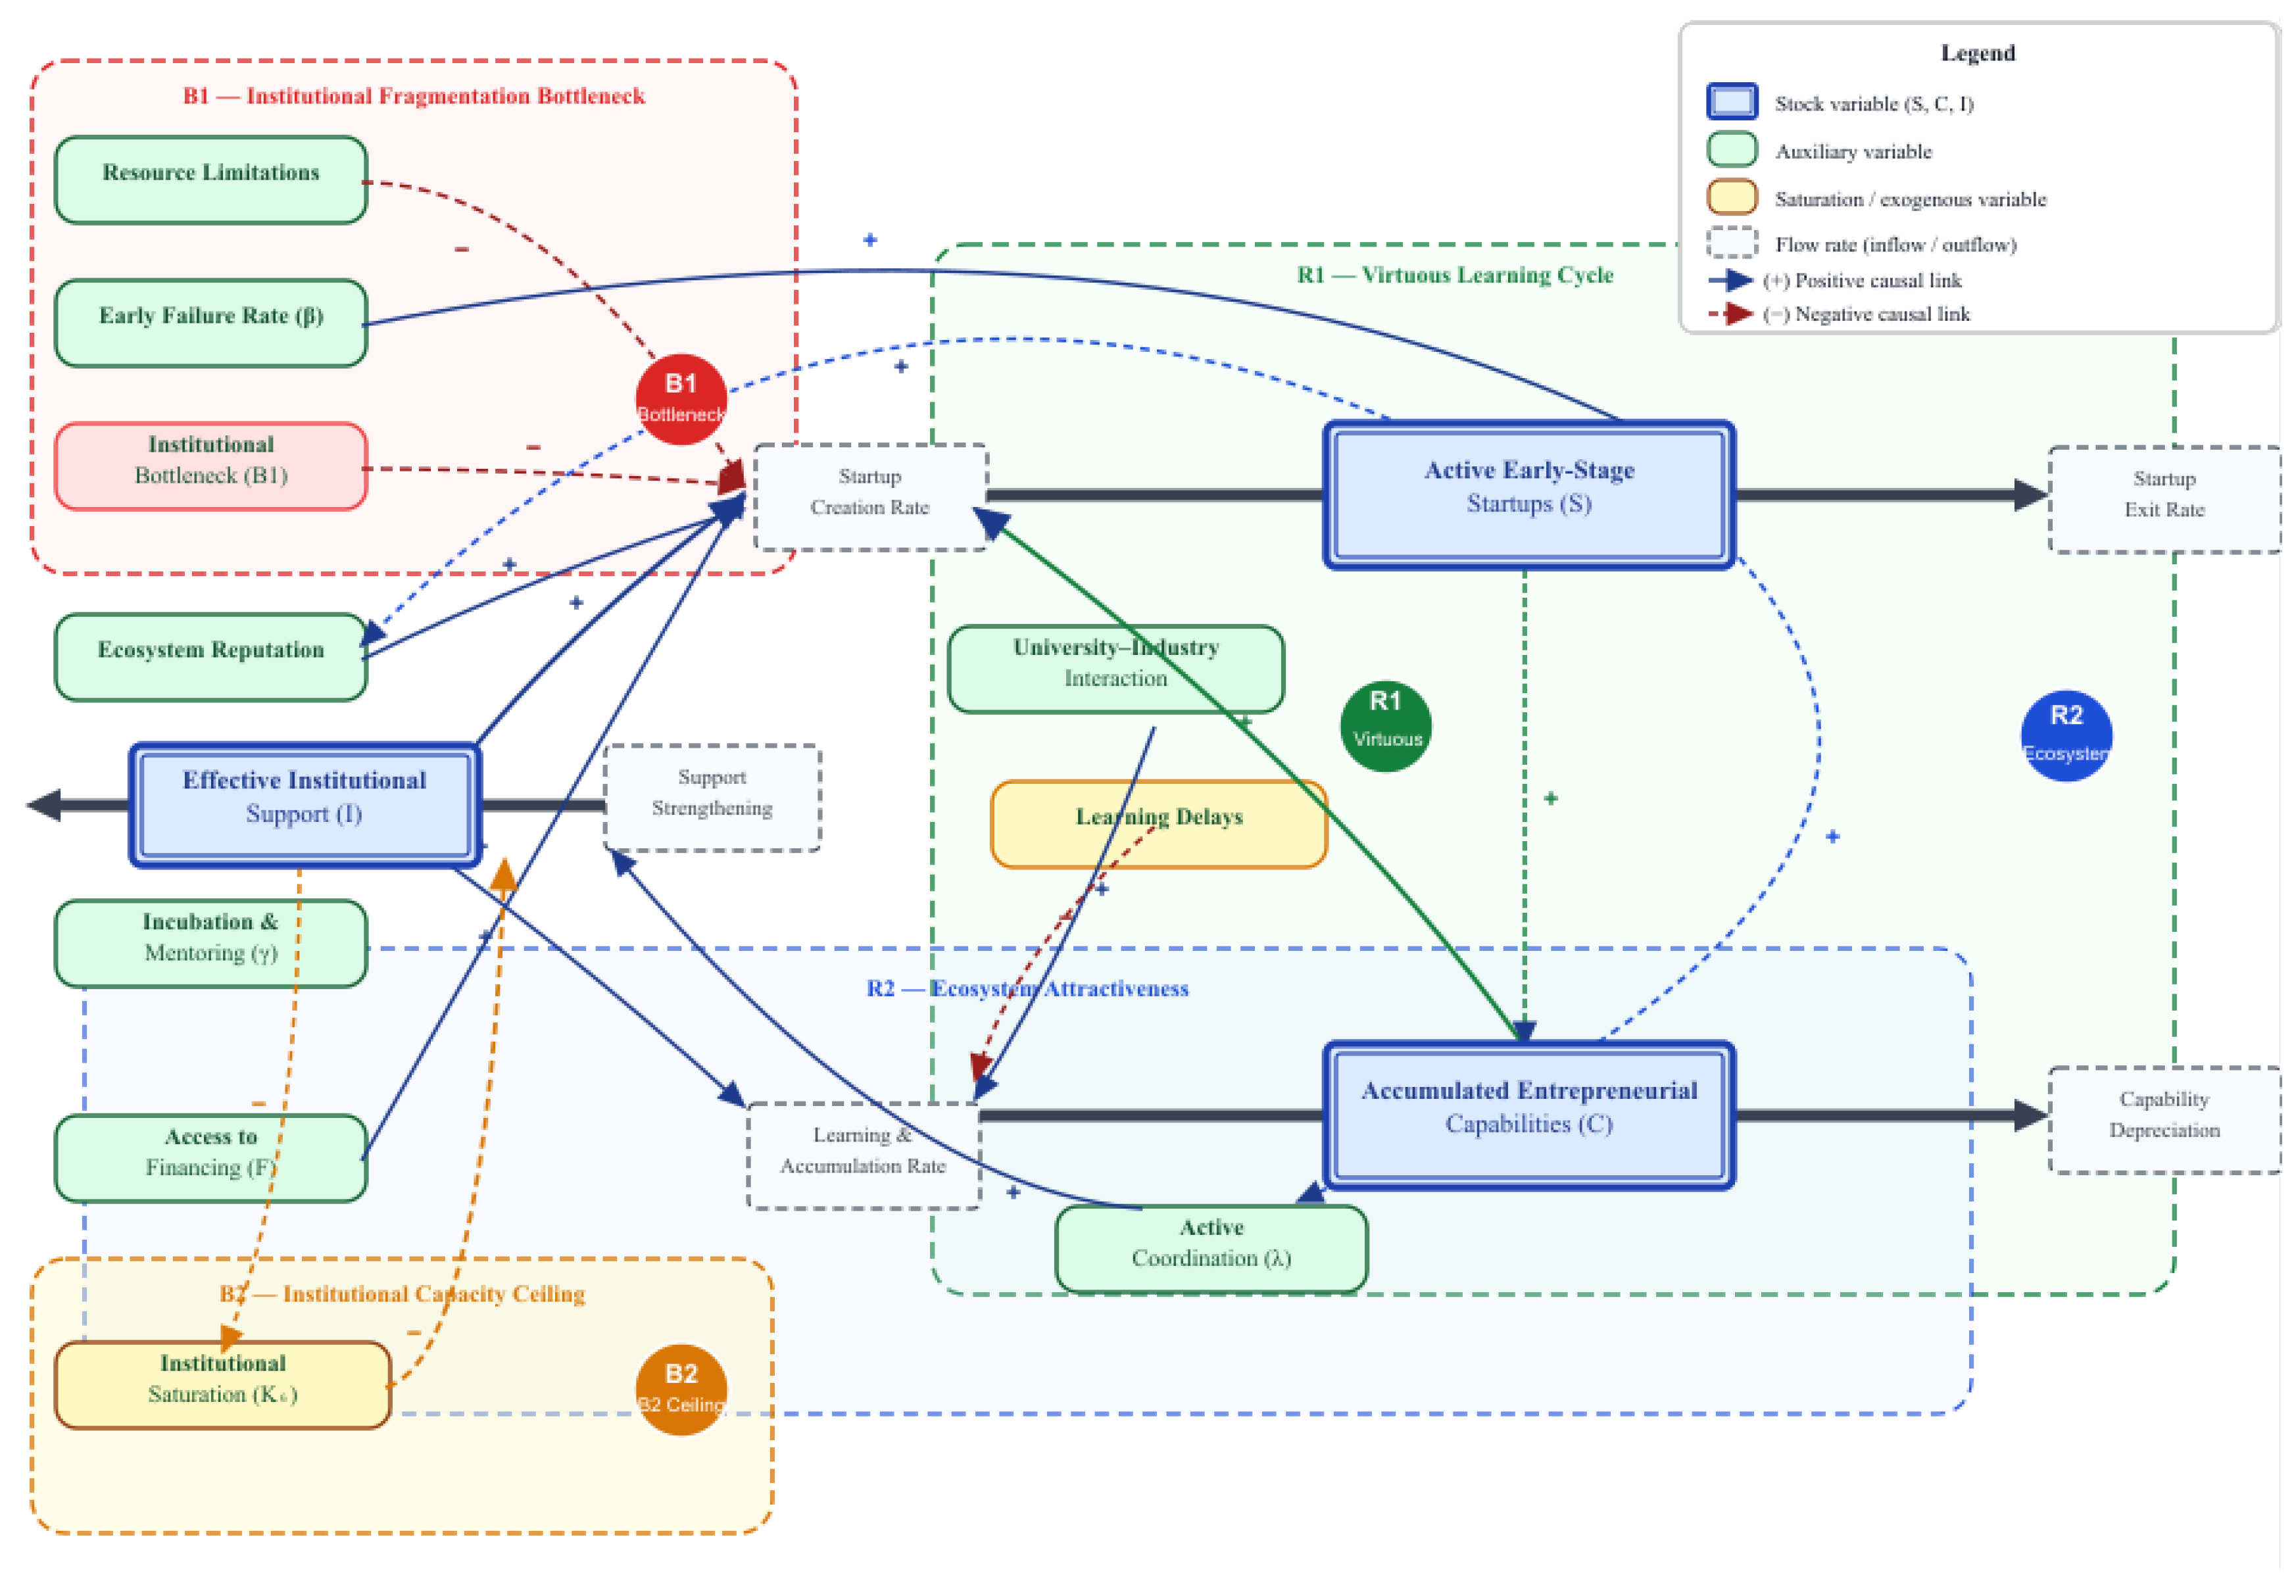
Figure 2 uses standard stock-and-flow conventions. Double-bordered rectangles represent stocks. Thick arrows with valve symbols represent flows, with governing equations labelled inline. Grey arrows indicate auxiliary parameter connections, and cloud symbols denote exogenous model boundaries. The three dimensions of the capability stock—experiential knowledge, network capital, and institutional memory—are aggregated into a single stock. This modelling choice preserves parsimony and tractability, aligning with the article’s focus on ecosystem-level threshold dynamics rather than on optimal capability composition. A robustness sub-analysis assessed whether this aggregation affects the main findings. The qualitative scenario ranking remains stable under disaggregation, although the Mexican coordinated trajectory becomes more sensitive. This indicates that the aggregate specification is parsimonious but conservative in threshold-proximate regimes. Full details are reported in Appendix C.
Figure 2.
Stock-and-flow structure of the comparative entrepreneurial ecosystem model (S: active startup population; C: accumulated entrepreneurial capabilities; I: institutional support).
Figure 2.
Stock-and-flow structure of the comparative entrepreneurial ecosystem model (S: active startup population; C: accumulated entrepreneurial capabilities; I: institutional support).
The institutional capacity ceiling (K6) operationalises the upper bound on capability accumulation imposed by each ecosystem’s absorptive capacity and intermediary infrastructure. Its values were derived from expert elicitation and cross-validated against indicators of incubator and accelerator density in both contexts. The model implicitly captures administrative delay through the dynamics of the institutional support stock I. An explicit delay stock was considered during model development, but was not implemented because reliable and comparable estimates of administrative processing time were unavailable for both contexts at the level of precision the model requires.
The mathematical consequence of this exclusion is tractable and reinforces rather than undermines the paper’s central argument. An explicit first-order material delay would introduce an intermediate stock D — pending institutional activation — between policy commitment and effective institutional support, governed by dD/dt = Policy inflow − D/τₐᵈᵐ and dI/dt = D/τₐᵈᵐ − μ·I + φ·(S/Sref). Under this formulation, the effective I available to drive the R1/B1 numerator (α·I·F·(1−S/K)) at any given t would be lower than in the production specification, because committed policy effort would take τₐᵈᵐ additional time units to translate into operational institutional support. The coordination threshold condition R1/B1 = 1 would therefore require either more time, more policy effort, or stronger initial coordination to be reached — all of which shift the threshold crossing later in the simulation horizon, not earlier. The omission of the delay stock thus makes the reported threshold timings conservative in a precise sense: the production model reaches R1 dominance faster than a delay-inclusive version would, meaning the paper’s claims about how long pre-threshold assembly takes are, if anything, underestimates. This conservatism directly reinforces the evaluation misalignment argument: if explicit administrative delay were modelled, the pre-threshold period during which output-level evaluation systematically misclassifies structural progress would extend further rather than contract. The formal delay specification and its symbols are documented in Appendix B.
Table 2.
Stock Variables: Dynamic Structure, Governing Equations, and Feedback Architecture.
| Symbol | Variable and definition | Governing equation | Feedback loop structure and theoretical basis |
|---|---|---|---|
| S | Active startup population Total stock of active early-stage technology-based ventures at simulation time t (normalised units). |
dS/dt = α·I·F·(1 − S/K) − β·S Creation: institutional support × financing (α·I·F). Exit: natural exit at rate β. |
R1 (reinforcing) — S → C → ecosystem quality → S R2 (reinforcing) — S → I → S B1 (balancing) — Exit pressure counteracts creation when α·I·F < β·S The term (1−S/K) in the creation rate introduces a logistic saturation effect: as S approaches the carrying capacity K, the effective creation rate declines smoothly toward zero, preventing unbounded exponential growth in the startup population. This term is the structural basis for the R1/B1 ratio’s numerator and ensures that the threshold condition R1/B1 = 1 is derivable directly from setting dS/dt = 0. Stam [6]; Spigel [5]; Isenberg [4] |
| C | Entrepreneurial capabilities Aggregate ecosystem stock of three dimensions: experiential knowledge, network capital, and institutional memory (composite index, baseline = 1.0). Represented as a single stock for parsimony; see Section 3.2 for the disaggregation limitation. |
dC/dt = γ·S·Cᵟ·(1 − C/K6) − η·C Learning inflow: bounded by institutional ceiling K6 (B2 loop). Depreciation: talent emigration and memory erosion at rate η. |
R1 (reinforcing) — Learning loop: S → C → ecosystem quality → S B2 (balancing) — Institutional ceiling: accumulation slows as C → K6 The K6 ceiling prevents unbounded exponential growth and produces the S-curve in Figure 3. Arrow [19]; Spigel [5]; Audretsch and Fiedler [10] |
| I | Institutional support Effective level of coordinated public, university, and intermediary support available to startups at time t (normalised units). Classified as a stock — not an auxiliary — because it accumulates over time and retains memory of prior policy investment. |
dI/dt = λ·P − μ·I + φ·S/Sref Policy inflow: effort P scaled by effectiveness λ. Decay: institutional deterioration at rate μ. Performance feedback: growing S reinforces I via R2 loop. |
R2 (reinforcing) — Performance feedback: S → I → S Higher μ in Mexico means policy effort must first offset ongoing deterioration before generating net institutional growth, raising the effective threshold. This is the primary mechanism driving the Mexico–UK differential in threshold geometry. Isenberg [4]; Tõnurist & Hanson [30]; Mason Brown [9] |
Note. This table documents the three state variables (stocks) of the model and their governing differential equations. Parameters in the equations (α, β, γ, δ, η, λ, μ, φ, K6, I0) are defined, calibrated, and interval-valued in Table 1. Scenario design parameters (F, P) are described in Section 3.4. The four feedback loops (R1, R2, B1, B2) are depicted inFigure 1 (causal loop diagram). The coordination threshold (R1/B1 = 1) is a derived diagnostic variable — not a stock or parameter — defined and justified in Section 4.2. The note δ in the C equation denotes the returns-to-experience exponent; this symbol is distinct from administrative delay, which is not formalised in this model (see Section Discussion, limitations subsection). All stock variables are expressed in normalised model units; initial conditions (S0, C0) are specified in Appendix A.
Figure 3.
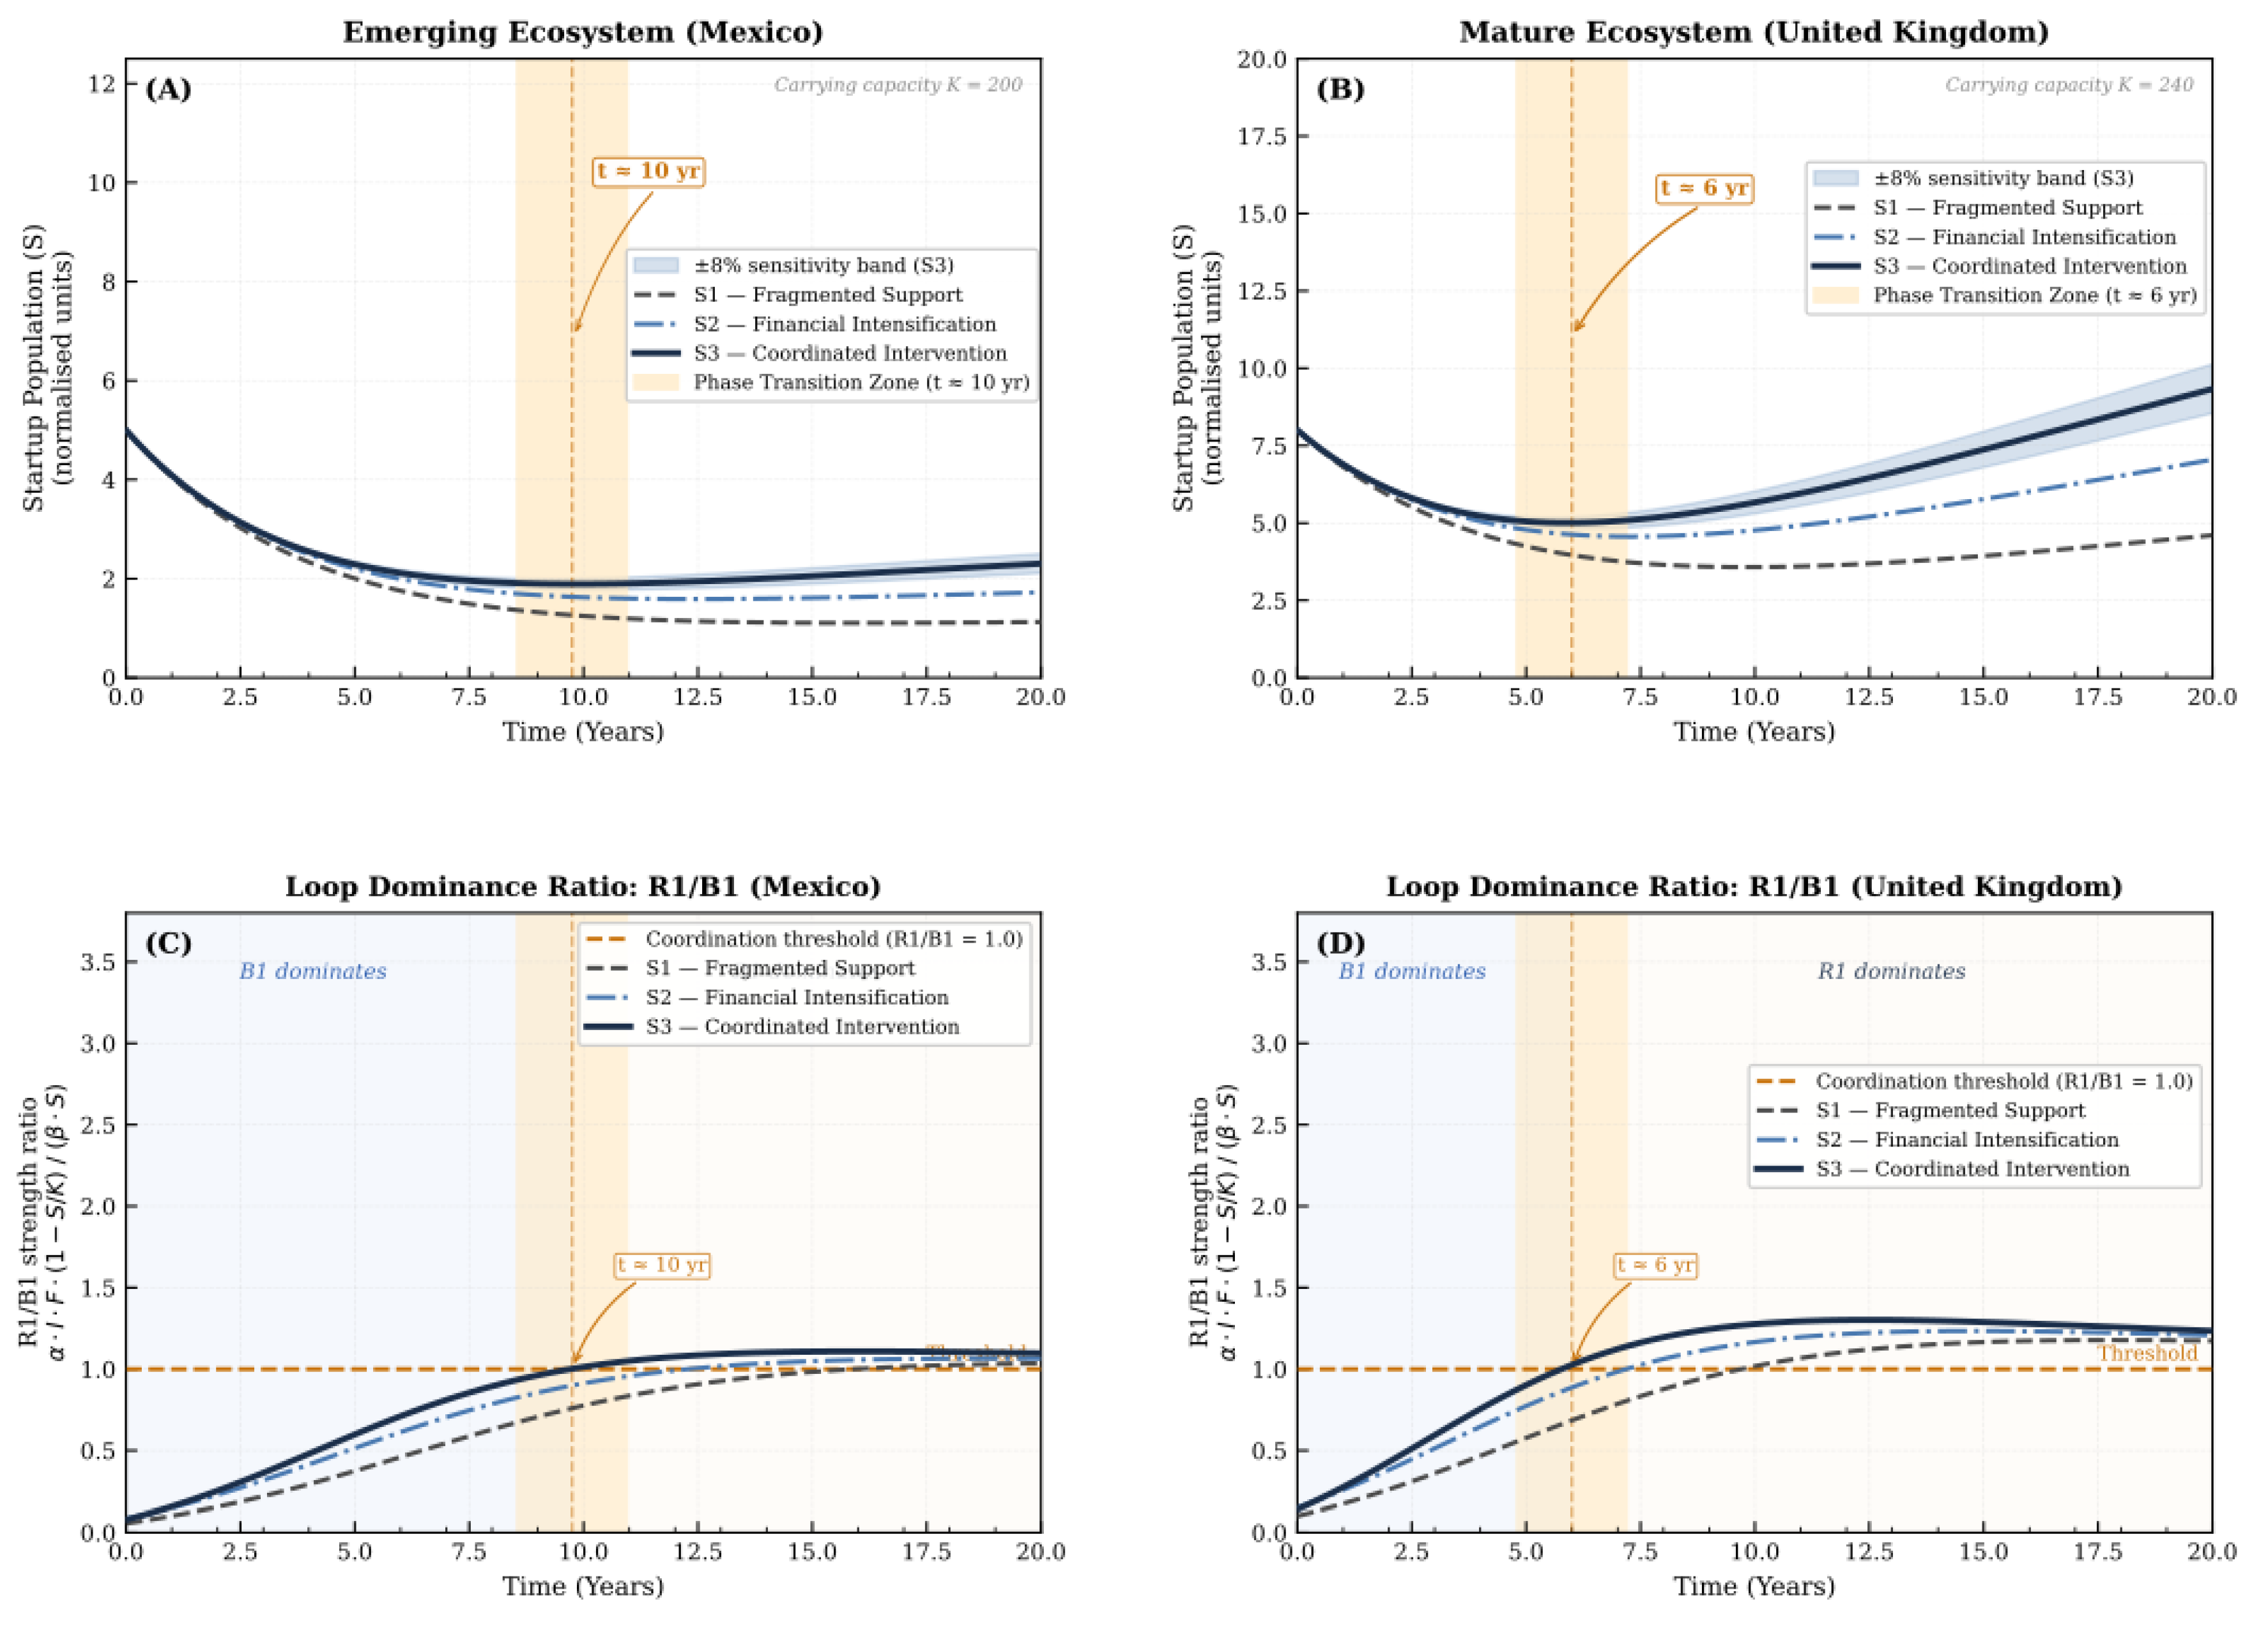
Ecosystem phase transition and loop dominance analysis: active startup population S under three policy scenarios (panels A–B) and R1/B1 loop dominance ratio (panels C–D) for Mexico and the United Kingdom over a 20-year simulation horizon.
Figure 3.
Ecosystem phase transition and loop dominance analysis: active startup population S under three policy scenarios (panels A–B) and R1/B1 loop dominance ratio (panels C–D) for Mexico and the United Kingdom over a 20-year simulation horizon.
3.4. Validation and Robustness Strategy
Model validation followed established system dynamics practice and combined three categories of tests [16,18]. Table 3 summarises the tests conducted; full computational details are reported in Appendices D–F.
Table 3.
Validation and Robustness Strategy: Summary of Tests Performed.
| Test category | Tests performed | Outcome |
|---|---|---|
| Structural validity | Equation dimensional consistency; boundary adequacy review with expert panel; extreme-condition tests (I → 0; η → max; λ → 0) | All equations dimensionally consistent; extreme-condition behaviour qualitatively plausible in both contexts |
| Behavioural validity | Baseline trajectory plausibility confirmed by expert panel; behaviour reproduction under S1 matches qualitative pattern of observed low-growth equilibria in fragile ecosystems; S-curve shape under S3 consistent with published SD ecosystem models | Baseline and coordinated trajectories judged credible by panel in both national contexts |
| Robustness | Univariate parameter perturbations (±20%) across six parameters; multivariate grid over λ × μ (48 combinations); disaggregated capability robustness extension (Appendix C); numerical convergence comparison (Euler Δt = 0.25 vs. Δt = 0.05 vs. RK4) | Core qualitative scenario ranking preserved across all perturbations except one: λ −20% in Mexico produces qualitative regime change in S3 (reported and discussed as a structural finding, not an anomaly) |
Note. S1 = Baseline (Fragmented Support); S3 = Coordinated Early Intervention. SD = system dynamics. RK4 = fourth-order Runge–Kutta integration. Δt = numerical time step. Full computational details are reported in Appendices D–F.
The simulations are not empirical forecasts. They are structurally grounded explorations of how different coordination regimes produce divergent long-run system behaviour. The model’s diagnostic capacity operates within the calibrated simulation: it reliably distinguishes between structural states inside the tested parameter space. However, any claim about real ecosystems derived from the model carries the uncertainty associated with its calibration intervals and the simplifications embedded in its boundary conditions.
Table 4.
Sensitivity Analysis: Parameter Perturbations and Ecosystem Trajectory Effects.
| Parameter | Perturbation | Effect on S (Mexico) | Effect on S (United Kingdom) | Qualitative conclusion |
|---|---|---|---|---|
| I0 (baseline institutional support) | −20% | Large ↓ in all scenarios; S3 threshold delayed ~2 yr; Mexico’s S3 remains qualitatively intact | Moderate ↓; S3 still substantially outperforms S1; threshold character preserved | Results are consistent with I0 being a primary structural driver of the Mexico–UK response gap. Mexico’s threshold appears fragile to baseline erosion in the model, as the system begins closer to the B1-dominance boundary. The UK’s stronger I0 provides structural buffering that sustains threshold character under equivalent perturbation. |
| λ (policy effectiveness) | −20% | S3 loses threshold character entirely; converges toward S2 trajectory — no inflection point | S3 threshold delayed but qualitatively preserved | Qualitative regime change in Mexico (not merely a quantitative shift). Under equivalent perturbation, the UK threshold is preserved while Mexico’s S3 collapses to S2 behaviour. This asymmetry is a structural property of baseline institutional geometry: Mexico operates closer to the B1/R1 boundary, so reduced policy coherence is sufficient to suppress threshold crossing. This finding directly supports Proposition 2: the coordination threshold level is not universal but depends on the prior institutional geometry of each ecosystem. |
| γ (learning intensity) | +20% | S3 inflection accelerated by ~1.5 yr; S1/S2 modestly improved | S3 inflection accelerated by ~1.0 yr; S1/S2 modestly improved | Learning intensity amplifies coordination effects in both contexts; proportionally larger leverage in Mexico because the system starts further from its capability ceiling K6. Investments in mentor network density and serial entrepreneur ecosystems yield disproportionate returns in emerging institutional contexts. |
| β (startup exit rate) | +20% | Substantial ↓ in S1 and S2; S3 partially buffered by reinforcing loops | Moderate ↓ in S1 and S2; S3 well-buffered; threshold character preserved | Under elevated β, the S3 trajectory shows greater resilience than S1 and S2 in both simulated contexts, as the reinforcing dynamics of R1 and R2 partially offset the increased outflow from S. S1 and S2 prove more sensitive to the perturbation, consistent with their lower degree of feedback activation. The pattern is consistent with, but does not confirm, the proposition that coordination architecture rather than resource volume is the primary determinant of resilience to adverse market conditions. |
| η (capability depreciation rate) | +20% | C plateau reduced ~15%; S3 inflection delayed ~1.5 yr; S1/S2 minimally affected | C plateau reduced ~10%; S3 timing and threshold character largely preserved | Capability retention is more consequential in Mexico, consistent with the higher talent emigration rate embedded in the Mexican η calibration. The S-curve shape of the C trajectory is preserved, confirming that the K6 ceiling and the learning mechanism (γ·S·Cᵟ) are the dominant structural determinants of capability trajectories. |
| μ (institutional decay rate) | +20% | I stock recovers more slowly; S3 threshold delayed ~1 yr; coordination window narrowed | Modest effect on timing; S3 plateau and threshold character largely unaffected | Institutional continuity is a structural vulnerability in fragmented regimes. In Mexico, higher μ means more policy effort is consumed offsetting deterioration before net institutional growth occurs, narrowing the window for threshold crossing. The UK’s arms-length agency architecture (Innovate UK, British Business Bank) provides resilience through programme continuity, explaining asymmetric sensitivity. |
Note. Each parameter is perturbed in the direction most informative for the study’s central claims, following an asymmetric perturbation design (Barlas, 1996; Sterman, 2000). Negative perturbations (−20%) are applied to I0 and λ, whose reduction undermines threshold activation. Positive perturbations (+20%) are applied to γ, β, η, and μ, thereby amplifying coordination benefits or stressing system resilience. All other parameters are held at their calibrated baseline values during each perturbation. The core qualitative behavioural patterns are robust across all perturbations with one exception: the λ perturbation in the Mexican context produces a qualitative regime change (highlighted in dark red) — S3 loses its threshold character and converges to S2 behaviour rather than exhibiting a delayed or attenuated version of the same trajectory. This is a structural finding, not a quantitative shift, and is discussed in Section 4.2. S = active startup population; C = entrepreneurial capabilities stock. ↓/↑ indicate directional change relative to the central-value simulation.
3.5. Scenario Design
Three scenarios were developed to analyse how alternative policy configurations influence entrepreneurial ecosystem trajectories over time. The scenarios are not probabilistic forecasts of a single outcome. Following the exploratory role of SD models in policy analysis, they are structured explorations of how different coordination architectures generate distinct long-run behavioural modes [16]. Each scenario maintains fixed core policy settings throughout the simulation horizon, isolating the structural effects of each coordination configuration and testing the model’s sensitivity to sustained, rather than episodic, institutional differences.
Scenario 1 — Baseline (Fragmented Support Environment) models a condition in which financing, incubation, and institutional coordination remain at historically observed levels, with weak alignment across actors. This scenario serves as the reference trajectory against which intervention effects are interpreted and represents the behavioural mode that arises when B1 loop dominance is never overcome.
Scenario 2 — Financial Intensification without Coordination models a sustained increase in early-stage financing without corresponding gains in coordination. The financing increment is permanent by design. This tests the resource-volume hypothesis under the most favourable conditions. If sustained financing alone does not generate lasting improvements in startup survival and capability accumulation, resource scarcity cannot be the primary structural constraint on ecosystem development.
Scenario 3 — Coordinated Early Intervention models an integrated policy package in which financing, incubation quality, and institutional coordination are strengthened simultaneously from the early simulation period. This scenario is designed to activate the reinforcing feedback associated with learning, coordination, and the formation of cumulative capability—that is, to test whether coordinated intervention is sufficient to shift the system from B1-dominant to R1-dominant behaviour.
To account for contextual variation, each scenario was run under two parameter configurations that reflect the institutional differences between Mexico and the United Kingdom.
3.6. Comparative Parameterisation
Context-specific parameters were determined through expert elicitation using the Repertory Grid Technique (RGT). RGT was chosen because several parameters reflect institutional qualities — such as coordination effectiveness, capability depreciation, and support continuity — for which no comparable cross-national time series exist. This technique provides a systematic way to translate tacit institutional knowledge into structured comparative judgements [31,32].
The panel comprised ten experts selected according to three criteria: direct professional experience in the entrepreneurial ecosystem of either Mexico or the United Kingdom (five per context), familiarity with innovation policy or university–industry–government relations, and willingness to participate in a four-session protocol. Exclusive panel assignment — one expert per national panel — prevented anchoring effects. Their expertise spanned technological entrepreneurship, university incubation, regional innovation policy, venture capital, and system dynamics, ensuring that parameter judgements were informed by institutional knowledge and modelling literacy.
The elicitation followed a four-phase protocol detailed in Appendix E. During the construct elicitation phase, experts generated comparative judgments about ecosystem properties using triadic comparisons, identifying how two elements differed from a third on relevant dimensions. Across the panel, 65 constructs were elicited and coded thematically using a two-stage blind reclassification process. Initial reassignment rates of 84% and 73% improved to 89% and 86% after category relabelling, confirming the coding scheme’s interpretive stability. In the parameter assignment phase, experts translated their judgments into numerical range estimates on a normalised scale, using calibration interval sheets to illustrate the implications of alternative values for baseline trajectory shapes. Panel medians served as central values, and interquartile ranges defined plausible calibration intervals reported in Table 1. During the joint synthesis phase — conducted in two virtual plenary sessions — cross-context parameter differentials were reviewed collectively and finalised through anonymous voting. Persistent disagreements were retained as wider interquartile ranges to preserve genuine uncertainty in institutional judgments.
A panel of ten experts — five per national context — is smaller than survey-based calibration designs but consistent with established practice in RGT-based parameter elicitation for exploratory system dynamics models. The justification for this scale rests on three methodological properties of the RGT protocol as applied here. First, RGT is designed for in-depth comparative judgement rather than statistical aggregation: each expert participates in at least two structured sessions, generating a construct-rich response profile that yields substantially more calibration-relevant information per respondent than a single-item survey. Second, the ten-expert design matches the study’s comparison structure— five experts per context, each with direct ecosystem knowledge — which is the relevant unit of analysis for comparative parameterisation, rather than the total panel size. Third, the two-stage blind reclassification procedure (achieving reassignment rates of 89% and 86% after relabelling) provides an internal reliability check independent of panel size: it evaluates the stability of the construct coding scheme, not the representativeness of the panel as a population sample. The resulting parameter values are therefore better understood as structured expert judgements with documented inter-rater reliability than as population estimates, and the inferential limits of the calibration are those of expert-elicited exploratory modelling rather than those of statistical inference from a representative sample [33].
This process was particularly critical for parameters capturing institutionally sensitive features: baseline institutional support (I0), policy effectiveness (λ), capability depreciation (η), and institutional decay (μ). Given the stronger documentation of the UK ecosystem compared with Mexico, the calibrated I0 differential should be interpreted as a conservative lower bound rather than a precise institutional measure.
A multivariate sensitivity analysis that varied λ and μ jointly confirmed that the coordinated scenario’s qualitative threshold character remains robust across the calibration space, with Mexico showing significantly greater sensitivity to joint deterioration in policy effectiveness and institutional continuity. Full results are provided in Appendix F.
Together, the calibration strategy, validation procedures, and comparative parameterisation provide the structural basis for interpreting the simulation results in the following section. The analysis examines simulated trajectories of startup populations and entrepreneurial capabilities across the three scenarios, focusing on coordination thresholds, timing differences, and the contrasting structural sensitivities of Mexico and the United Kingdom. These are understood as model-derived properties under calibrated conditions, rather than as directly observed features of the real systems.
4. Results
This section presents simulation results from the comparative system dynamics model across three policy scenarios and two institutional settings. The analysis focuses on how differences in feedback-loop dominance — rather than in resource volume — produce divergent long-run trajectories under the two institutional configurations. The analysis reports results for two key stock variables: the active startup population (S) and accumulated entrepreneurial capabilities (C). It attends to threshold dynamics, comparative timing, and structural sensitivity across contexts.
4.1. Startup Population Dynamics Under Three Scenarios
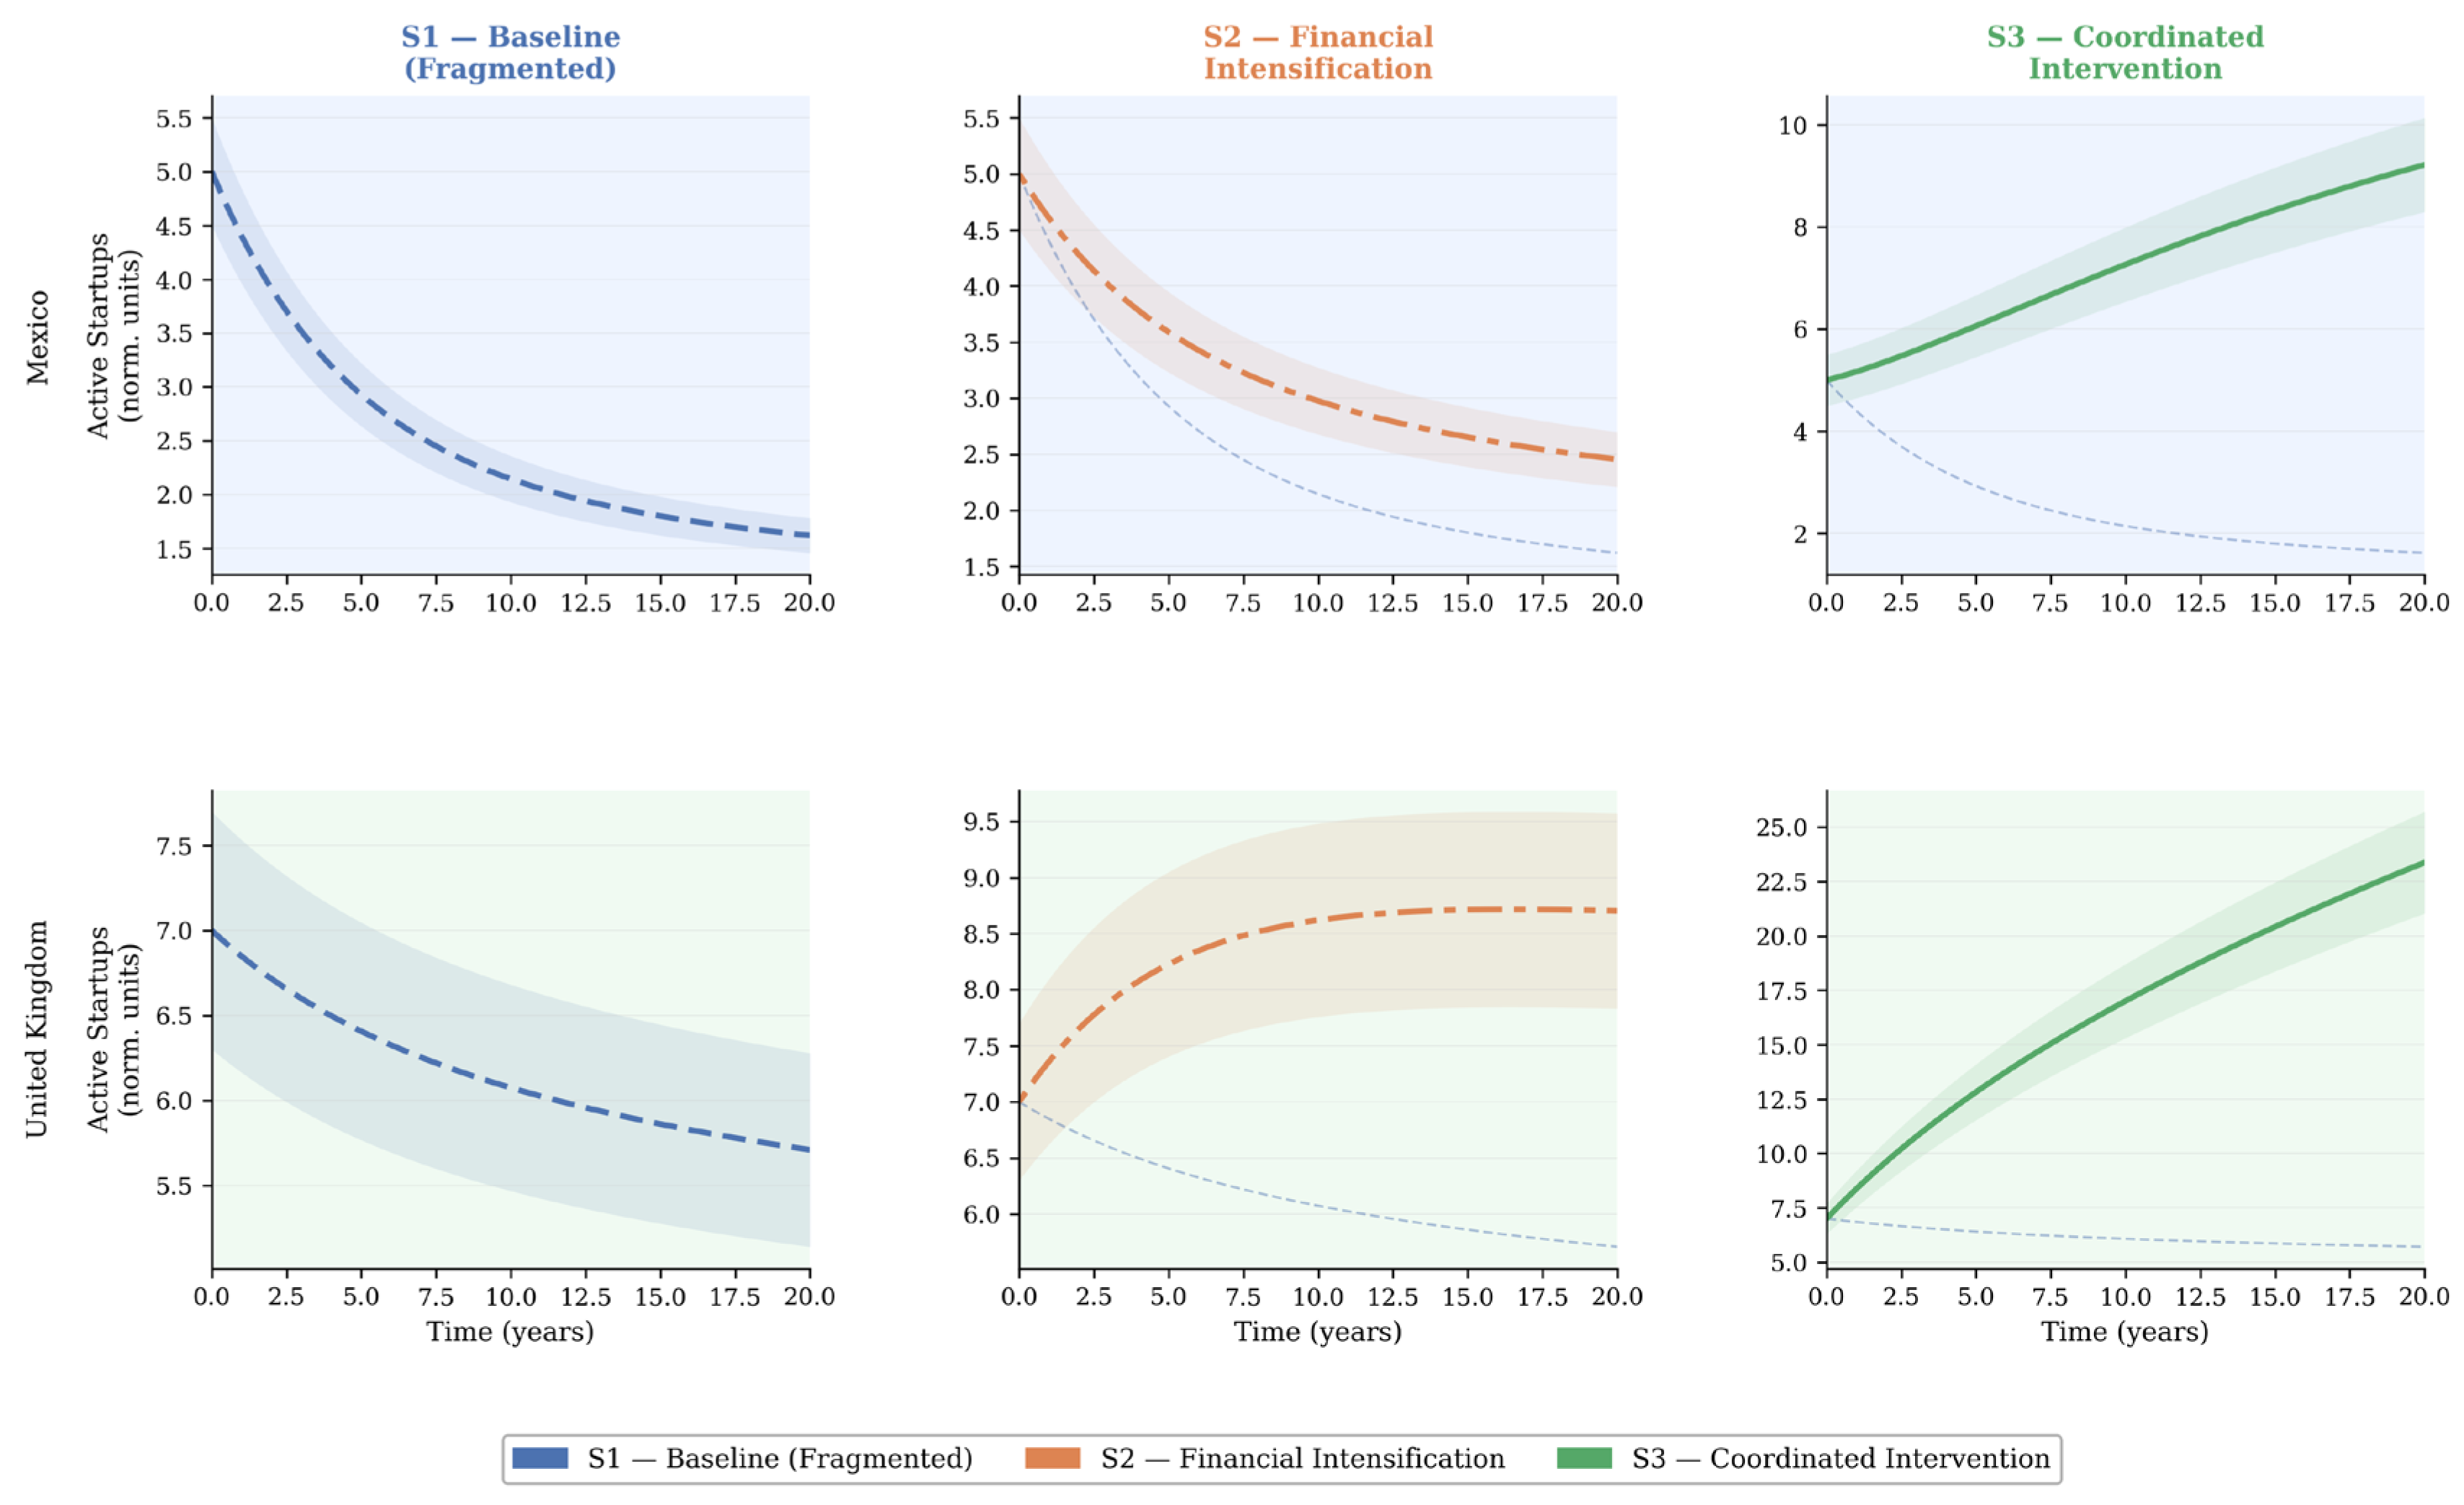
The startup population trajectories across the three scenarios produce a structural distinction that resource-volume interpretations of ecosystem policy cannot fully capture. In Scenario 1, B1 loop dominance persists throughout the simulation horizon. Exit pressure continuously counteracts the creation rate driven by fragmented institutional support. The system settles into a low-level quasi-equilibrium. Scenario 2 temporarily raises the creation rate through intensified financing, generating visible short-run gains in startup activity. R1 and R2 never activate, however. Institutional support remains fragmented, and learning spillovers are insufficient to sustain the accumulation of capabilities. The additional financing dissipates rather than compounds, and the trajectory returns to the S1 baseline. Scenario 3 produces a qualitatively different system response: coordinated early intervention activates R1 and R2 simultaneously, and once the reinforcing dynamics gain sufficient momentum, the system crosses the coordination threshold and enters a sustained growth regime.
The comparison across the two institutional contexts clarifies the structural source of this divergence. In the simulated UK context, the higher baseline institutional support (I0 = 0.60) places the reinforcing loops R1 and R2 closer to activation at the start of the simulation. This is a structural consequence of the calibrated parameter values, not a direct reflection of UK institutional conditions. The S3 trajectory, therefore, departs from the S1 baseline earlier, and the cumulative gain accrues over a longer portion of the twenty-year horizon. In Mexico, the lower baseline (I0 = 0.35) means that the same coordinated scenario must first repair the structural conditions for reinforcing feedback before those dynamics can become self-sustaining. The S3 trajectory in Mexico diverges from the S1 baseline later, but once the threshold is crossed, the proportional improvement relative to the baseline is larger, because the structural gap between the fragmented and coordinated regimes is wider.
The contrast between Scenario 2 and Scenario 3 is a central finding of the simulation analysis. Both scenarios deliver sustained increases in financing. Only Scenario 3 activates the reinforcing loops that convert those inputs into cumulative capability accumulation. The difference is not in resources — it is in feedback structure. In Scenario 2, the system receives additional resources. Its feedback architecture remains unchanged. R1 and R2 stay dormant because institutional fragmentation prevents learning spillovers and performance feedback from gaining traction. The additional financing, therefore, acts on a system structure that dissipates rather than amplifies inputs. These results suggest that the binding structural constraint is not resource volume but whether the institutional architecture can activate the R1 and R2 loops — a conclusion specific to the modelled configurations rather than a universal ecosystem law.
4.2. Coordination Threshold, Loop Dominance Transition, and Phase-State Analysis
The startup population trajectories across the three scenarios, shown in Figure 3 (panels A and B), produce a structural distinction that resource-volume interpretations of ecosystem policy cannot fully capture. The threshold behaviour shown in Figure 3 (panels A and B) has a precise structural explanation in the loop-dominance analysis in panels (C) and (D). Shaded bands represent the ±8% sensitivity range around the S3 trajectory, confirming that the qualitative scenario ranking is robust to moderate parameter uncertainty. The coordination threshold corresponds to the condition R1/B1 = α·I·F·(1−S/K)/(β·S) = 1. At this point, the full startup creation rate — including the logistic saturation term (1−S/K) — equals the exit rate β·S. Setting dS/dt = 0 in the governing equation for S (Table 2) yields this condition directly. It is a derived diagnostic variable, not an externally imposed parameter. Below this threshold, B1 dominates. The system remains in a self-limiting regime — startup creation cannot sustain positive net growth under the calibrated parameters. Above this threshold, R1 dominates: startup density is sufficient to generate learning spillovers that reinforce both capability accumulation and institutional support, producing compounding growth. The coordination threshold is the model’s derived tipping indicator between two behavioural regimes. The ratio operationalises the coordination threshold as a derived structural variable rather than an externally imposed parameter: it emerges from the interaction of the model’s feedback architecture and the institutional parameters of each context. Its consistency with the governing equation ensures that the threshold condition R1/B1 = 1 is not merely a graphical convention but a mathematically grounded boundary condition that can be derived directly from Table 2.
The shaded band in panels (A) and (B) of Figure 3 identifies the phase transition zone surrounding the inflexion point of the S3 trajectory, defined as the maximum of dS/dt, occurring approximately at year 10 in Mexico and year 6 in the United Kingdom. The simulation horizon is 20 years at Δt = 0.25 years. The loop dominance ratio panels (C and D) make the structural mechanism visible. In both contexts, Scenario 1 keeps the R1/B1 ratio permanently below unity — B1 dominance is never broken. Scenario 2 pushes the ratio upwards but does not sustain it above unity. Financing intensification temporarily increases the rate of creation. Without institutional reinforcement, however, the R2 loop does not activate. The ratio retreats as the additional financing fails to generate durable capability accumulation. Scenario 3 crosses the threshold and sustains R1 dominance, producing the characteristic S-curve trajectory: accelerating growth as R1 and R2 reinforce each other, followed by gradual moderation as the B2 loop activates and capability accumulation approaches the institutional ceiling K6. The amber dashed line at R1/B1 = 1.0 marks the coordination threshold — a derived model variable, not a graphical convention.
In the simulated UK context, the transition occurs at approximately year 6 under the calibrated parameters — earlier than in Mexico, consistent with the UK’s stronger baseline institutional support and a higher policy effectiveness coefficient. In Mexico, the same coordinated scenario does not cross the threshold until approximately years 8–10. This difference is not evidence of a single maturity ladder on which Mexico lags behind the United Kingdom. The model reflects a structural property of each context’s calibrated institutional geometry. Mexico’s lower I0 and higher μ require coordinated intervention to first offset ongoing institutional decay. Only then can net positive institutional growth accumulate and R1-dominant dynamics activate. The United Kingdom’s stronger baseline and lower decay rate mean that coordination effort translates more directly into threshold activation.
A second structural finding follows from this analysis. The pre-threshold period — in Mexico, approximately years 1 through 8 under S3 — is not a period of policy failure. It is the phase in which the structural conditions for R1 loop dominance are being assembled: institutional support is being rebuilt, learning spillovers are beginning to accumulate, and the R2 performance feedback loop is gradually strengthening. Within a conventional short-cycle evaluation window, this assembly phase yields results that are difficult to distinguish from the self-limiting behaviour of Scenarios 1 and 2. The loop dominance analysis provides the structural diagnostic that distinguishes them. A system in structural assembly under S3 shows a rising R1/B1 ratio, even when it remains below unity. A system in permanent B1 dominance shows a flat or declining ratio. The trajectory of the ratio is therefore a more reliable indicator of structural progress than its absolute level at any single evaluation point — a diagnostic logic that would require empirical validation of proxies before being applied in real evaluation contexts. This is precisely the interval during which output-level evaluation is most likely to misclassify progress as policy failure. A policymaker observing only aggregate startup counts within the phase transition zone would see results indistinguishable from the self-limiting S1 baseline. Panels (C) and (D) of Figure 3 show why those counts are structurally misleading: the R1/B1 ratio is rising toward unity even when output signals remain flat — a distinction that output metrics alone cannot make visible.
4.3. Entrepreneurial Capability Accumulation and Learning Delays
The capability stock (C) is a slow stock in the model’s feedback architecture. Its time constant is substantially longer than that of the startup population (S). Learning spillovers, network capital, and institutional memory accumulate through sustained activity over years, not through discrete events. Short-run improvements in S are necessary but not sufficient: structural change requires sustained inflows to C, producing the S-curve trajectory that indicates the R1 loop is compounding over time. Figure 4 makes this distinction precise. Under Scenarios 1 and 2, C increases only marginally, even when S shows temporary improvement.
Figure 4.
Simulated trajectories of the entrepreneurial capabilities stock (C) under three policy scenarios for Mexico and the United Kingdom over a 20-year simulation horizon.
Figure 4.
Simulated trajectories of the entrepreneurial capabilities stock (C) under three policy scenarios for Mexico and the United Kingdom over a 20-year simulation horizon.
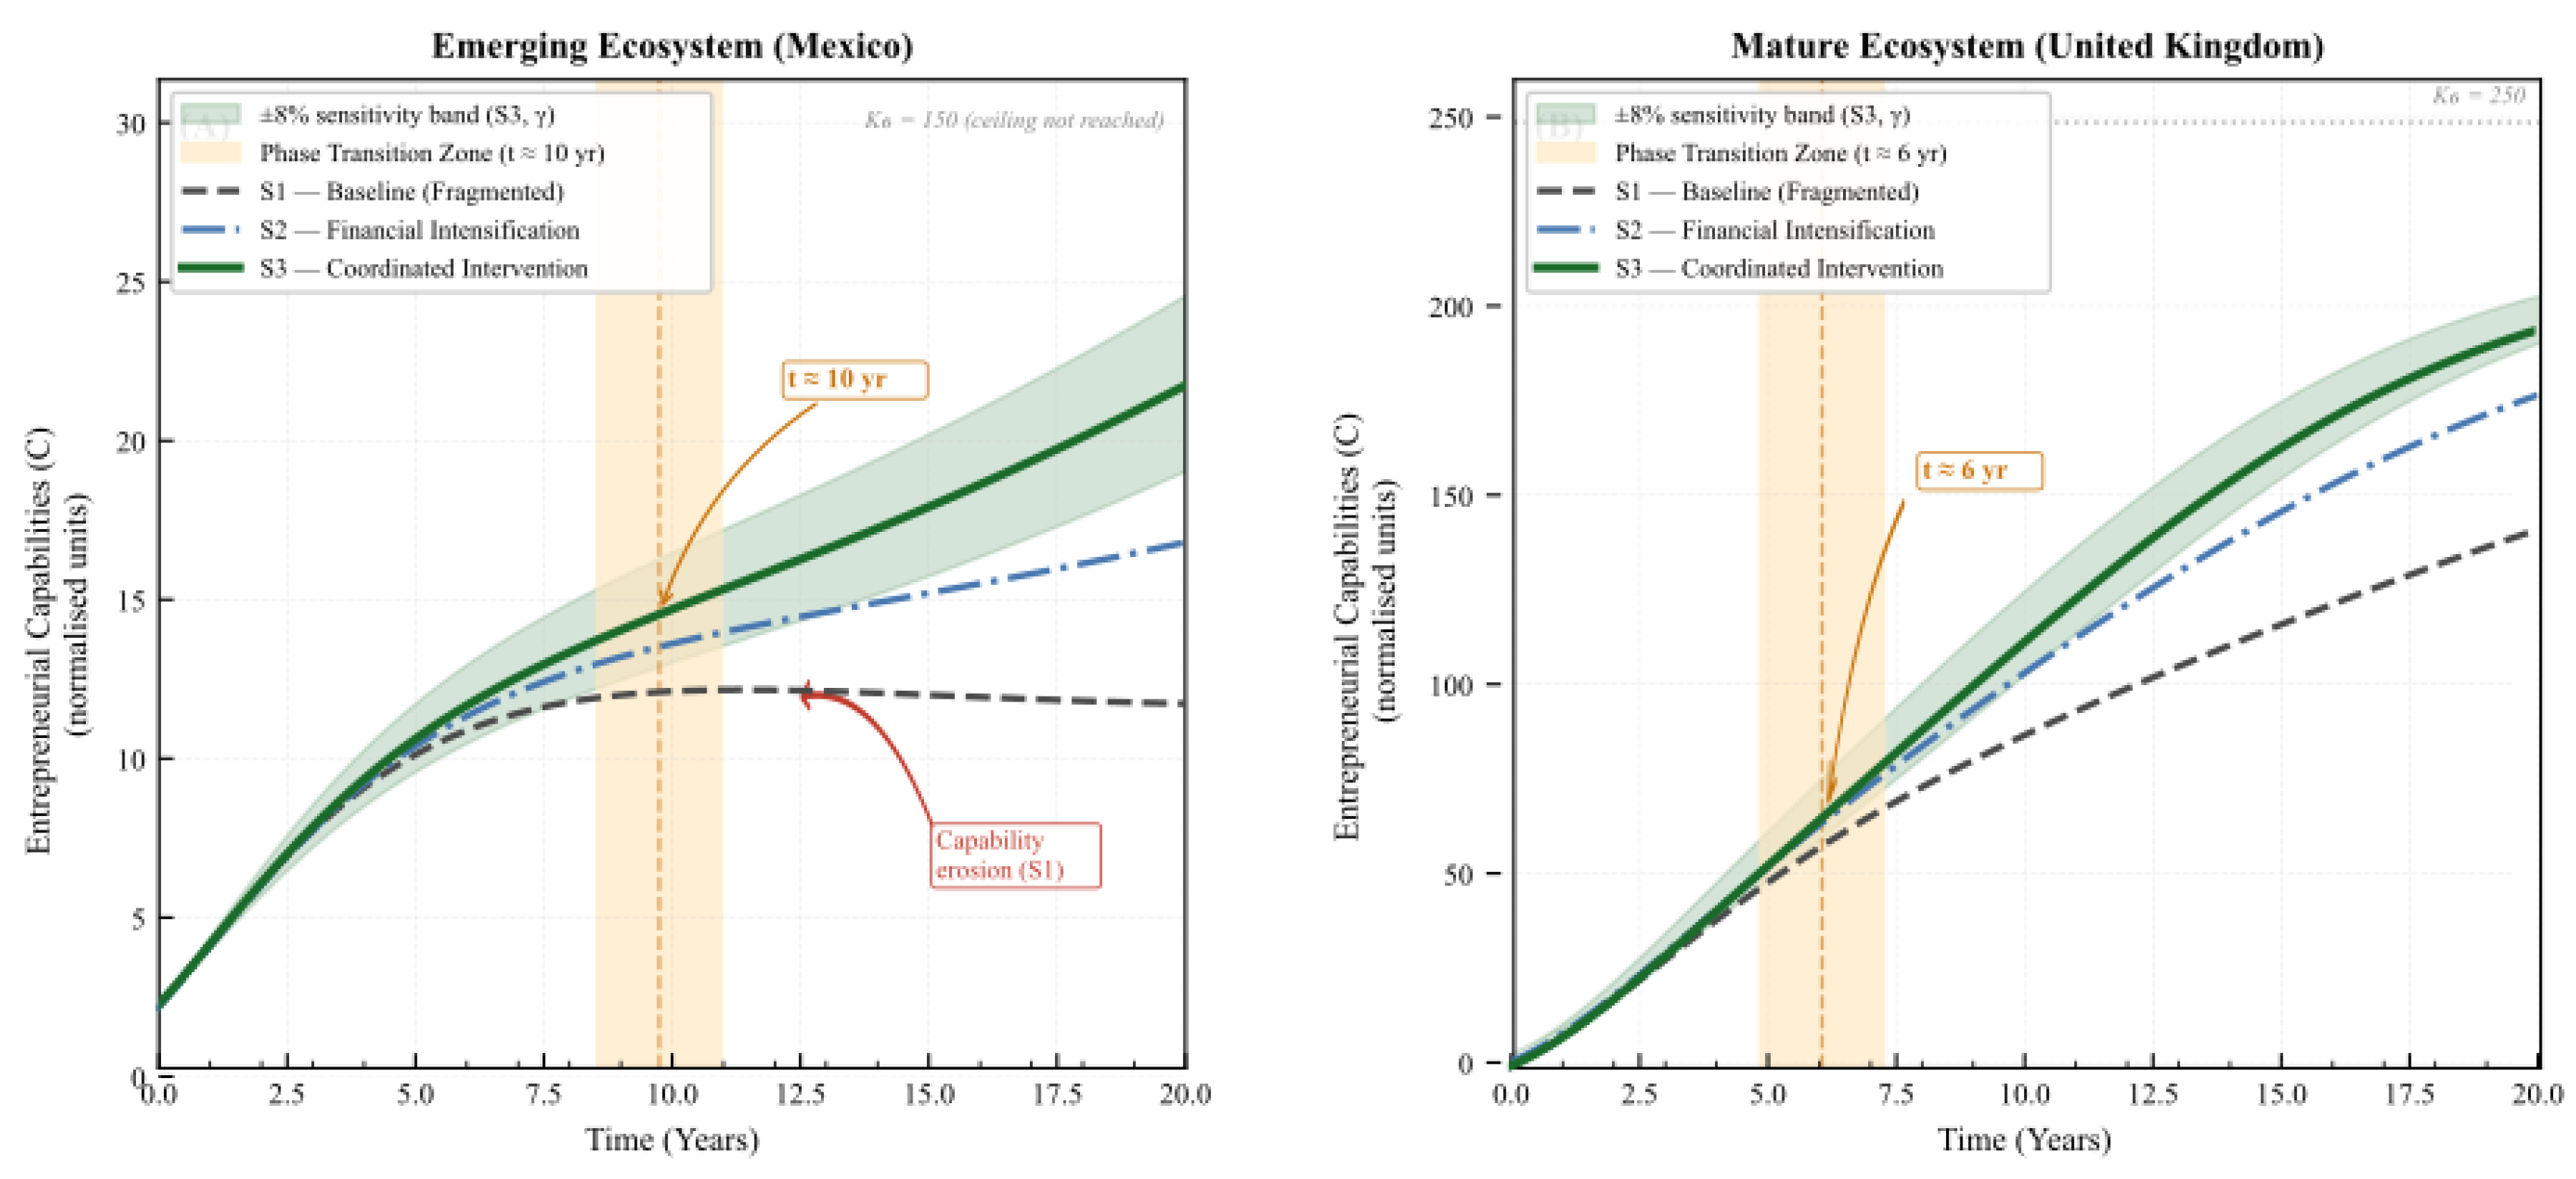
In Mexico, the S1 trajectory reaches its capability peak at approximately year 11 before declining — a structural consequence of B1 loop dominance that erodes the capability stock as institutional support weakens and learning inflows fall below the depreciation outflow (η·C). This capability erosion, visible in panel (A) of Figure 4, is not present in the UK context, where S1 maintains a positive dC/dt throughout the simulation horizon due to the stronger baseline institutional conditions.
Figure 5.
Simulated trajectories of the entrepreneurial capabilities stock (C) for Mexico and the United Kingdom across three policy scenarios. The y-axis represents a composite capability index normalised to an initial value of 1.0 in each context, reflecting the aggregate of experiential knowledge, network capital, and institutional memory as defined in Section 3.2. The index is not directly comparable across contexts in absolute terms; the analytically relevant comparison is the ratio of the S3 trajectory to the S1 baseline within each context, and the timing of the inflexion point relative to the startup population dynamics in Figure 3.
Figure 5.
Simulated trajectories of the entrepreneurial capabilities stock (C) for Mexico and the United Kingdom across three policy scenarios. The y-axis represents a composite capability index normalised to an initial value of 1.0 in each context, reflecting the aggregate of experiential knowledge, network capital, and institutional memory as defined in Section 3.2. The index is not directly comparable across contexts in absolute terms; the analytically relevant comparison is the ratio of the S3 trajectory to the S1 baseline within each context, and the timing of the inflexion point relative to the startup population dynamics in Figure 3.
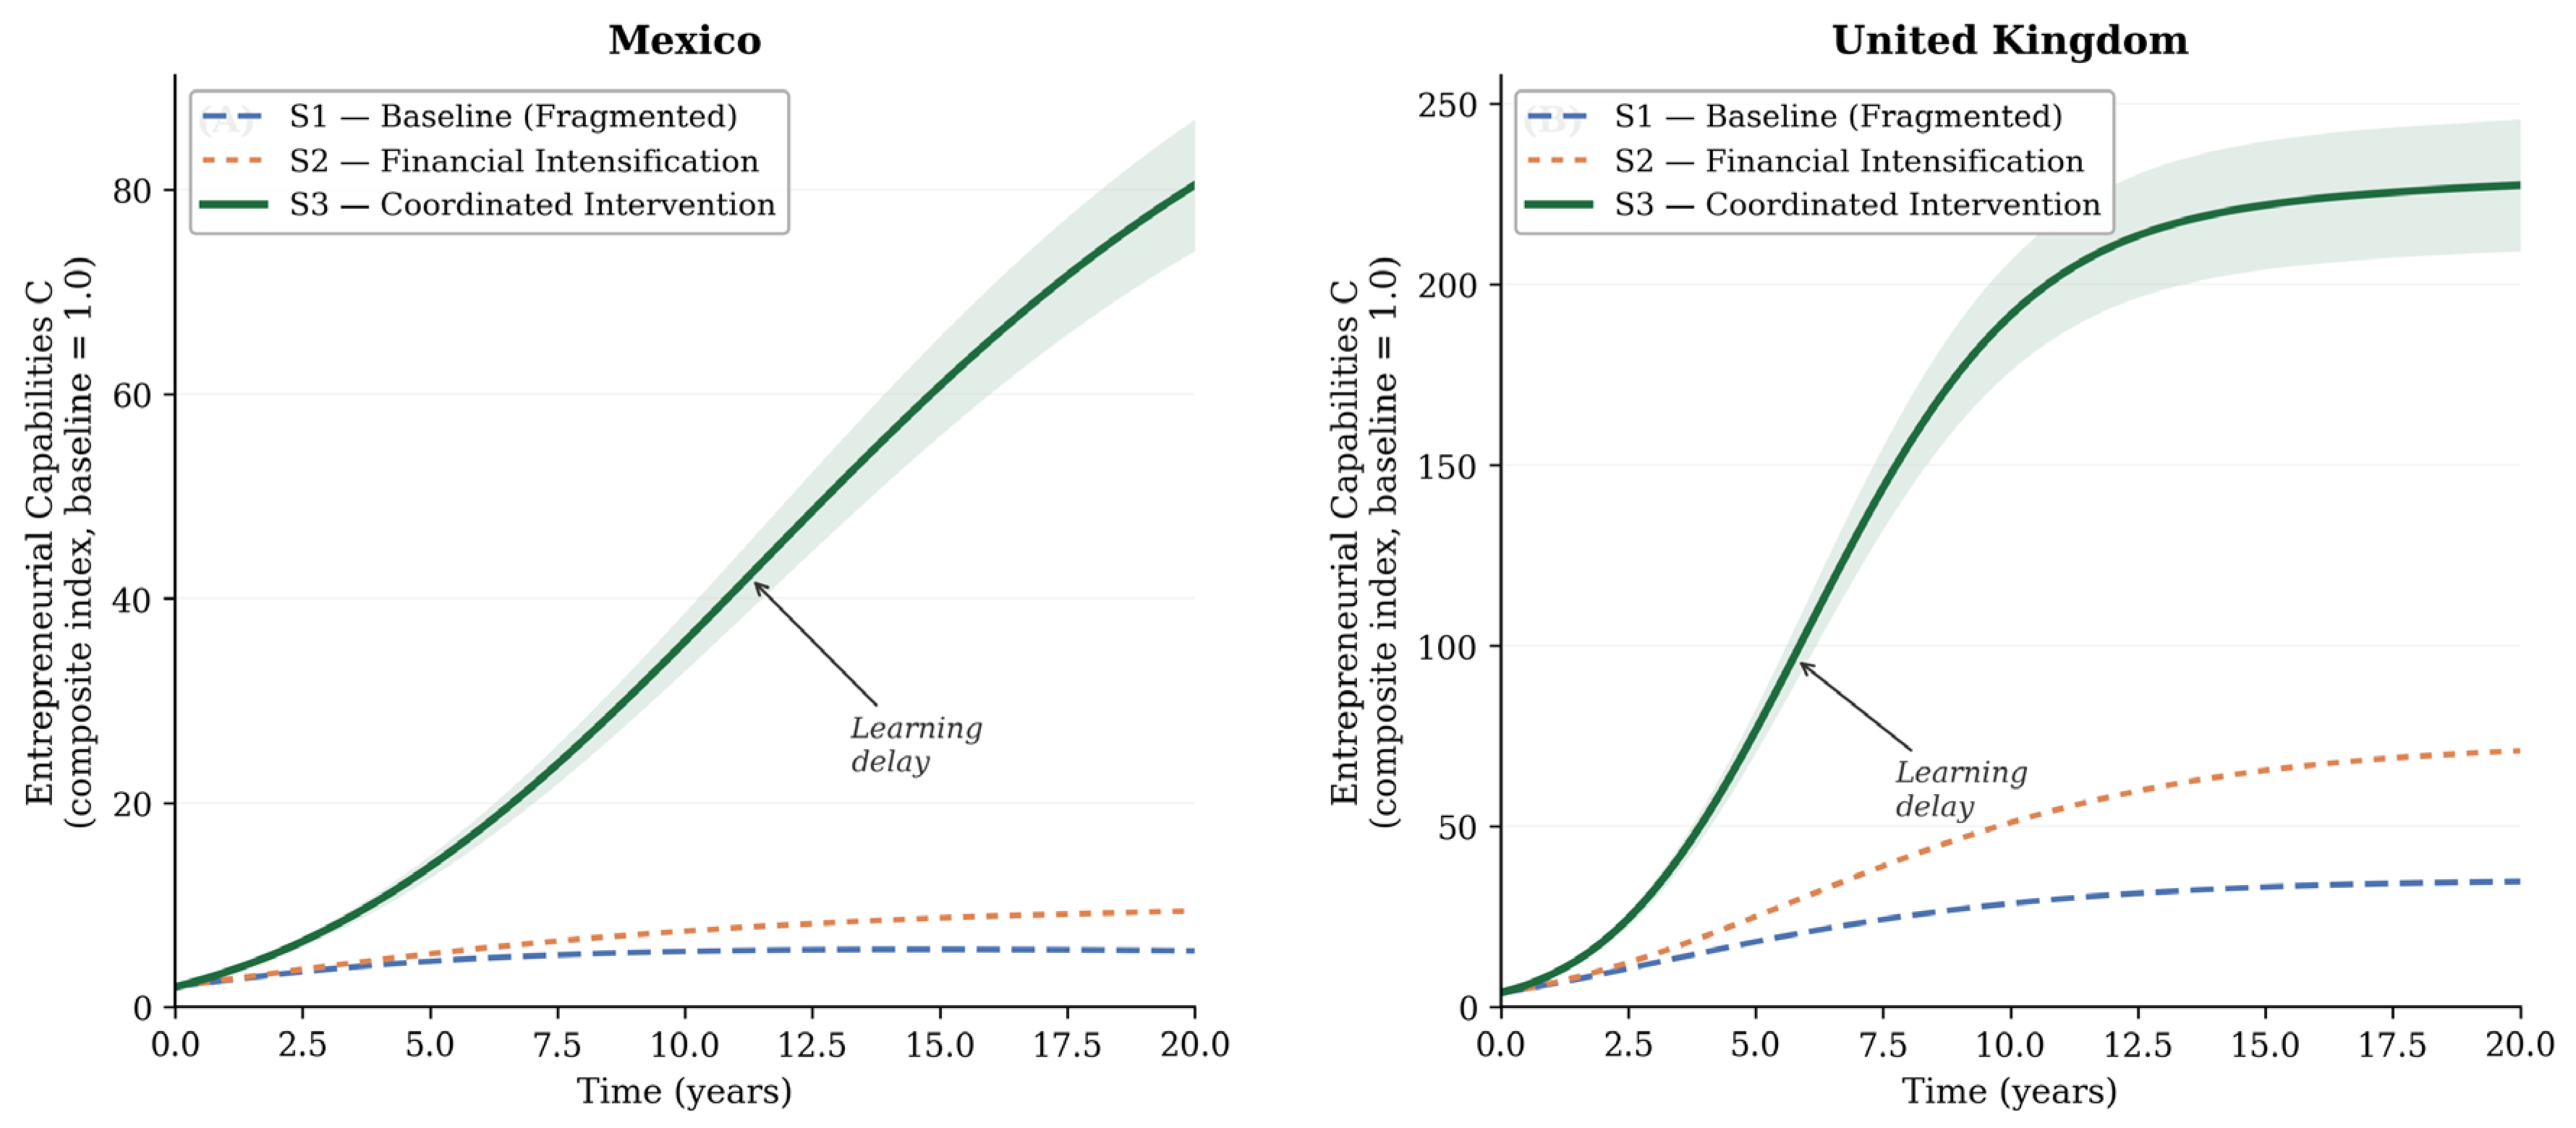
The simulated capability trajectories make this distinction precise. Under Scenarios 1 and 2, C increases only marginally, even when S shows temporary improvement. The structural reason is the same in both cases. The learning inflow (γ·S·Cᵟ·(1−C/K6)) requires sufficient startup density and active institutional coordination to generate meaningful capability spillovers. When the R1 loop is not dominant, the learning inflow is too weak to overcome the capability-depreciation outflow (η·C), and C converges to a low plateau. Under Scenario 3, once the coordination threshold is crossed and R1 becomes dominant, the learning inflow accelerates. Rising S feeds back into rising C through the R1 mechanism. Higher C reduces venture failure rates and improves the quality of new entries. This, in turn, reinforces S. The capability stock follows an S-curve — rising slowly during the pre-threshold assembly phase, accelerating through the threshold crossing, and then moderating as C approaches the institutional ceiling K6 and the B2 balancing loop activates.
The delay between startup population growth and capability accumulation is a structural consequence of the R1 loop’s dependence on sufficient startup density. It is not a lag that additional resources can eliminate. It reflects the time required for learning spillovers to reach a density sufficient to generate ecosystem-level effects. Below that density threshold, knowledge circulates within individual ventures without producing growth in system-level capability. This delay is longer in Mexico than in the United Kingdom, mirroring the threshold timing observed in Figure 3 and consistent with the higher capability depreciation rate (η) and lower learning intensity (γ) calibrated for the Mexican context. Within the model, capability accumulation is a more reliable indicator of structural change than short-run startup counts: it rises only when R1 loop dominance has been established, whereas startup counts can temporarily increase under Scenario 2 without triggering the capability accumulation that signals durable structural change.
4.4. Comparative Structural Sensitivity: Mexico and the United Kingdom
Figure 3, Figure 4 and Figure 5 together show that Mexico and the United Kingdom do not differ primarily in the level of entrepreneurial activity they produce, but in the structural conditions under which reinforcing feedback dynamics operate. The United Kingdom’s pre-existing institutional density — stronger I0, lower μ, and higher λ — places coordinated intervention close to the threshold. R1 and R2 activate from there with less preparatory effort. Mexico’s institutionally fragmented baseline — lower I0, higher μ, lower λ — means that the same coordinated intervention must first repair the structural preconditions for reinforcing dynamics before compounding growth can occur. The two contexts are therefore better characterised as distinct feedback regimes than as successive stages along a common developmental path.
Figure 4.
Comparative panel of Active Startup Population (S) across six scenario-context combinations (rows: Mexico, United Kingdom; columns: S1 Baseline, S2 Financial Intensification, S3 Coordinated Intervention). Thin dashed blue reference lines in S2 and S3 panels reproduce the S1 baseline for visual comparison. Shaded bands represent ±10% sensitivity range. Simulation horizon: 20 years; Δt = 0.25 years.
Figure 4.
Comparative panel of Active Startup Population (S) across six scenario-context combinations (rows: Mexico, United Kingdom; columns: S1 Baseline, S2 Financial Intensification, S3 Coordinated Intervention). Thin dashed blue reference lines in S2 and S3 panels reproduce the S1 baseline for visual comparison. Shaded bands represent ±10% sensitivity range. Simulation horizon: 20 years; Δt = 0.25 years.
The sensitivity analysis in Table 4 elaborates this structural distinction through its most important finding. Mexico’s S3 trajectory does not merely weaken under a 20% negative perturbation in λ — it collapses. The coordinated trajectory loses its threshold character entirely, converging to S2 behaviour and producing a concave growth pattern with no inflexion point. This is not a quantitative loss; it is a qualitative regime change. The system crosses from a coordination-capable configuration into a permanently self-limiting one. The United Kingdom’s S3 trajectory under the same perturbation retains its sigmoidal character with a delayed inflexion — a meaningful setback, but a different category of outcome entirely.
This distinction carries a critical implication for practitioners. In the UK context, modest coordination failure produces a recoverable delay: the threshold is still crossed, capability still accumulates, and the ecosystem still enters R1-dominant dynamics, albeit later. In the Mexican context, the same magnitude of coordination failure produces total system collapse relative to the coordinated scenario: R1 never dominates, the capability stock never compounds, and the pre-threshold assembly phase never resolves into transformation. There is no gradual degradation — the failure is categorical. A small shortfall in cross-agency coherence, a single programme discontinuity, or a reduction in leadership continuity at the wrong moment is structurally sufficient to push the system back across the B1/R1 boundary into permanent B1 dominance. The model cannot identify which specific institutional event would trigger this collapse in real ecosystems. What it does identify is the structural condition that makes it possible: Mexico operates close enough to the coordination threshold that the margin for error is narrow, and the consequences of exceeding it are not proportional to the error itself.
Two additional sensitivity findings reinforce the structural interpretation. First, perturbations to the capability depreciation rate (η) have larger absolute effects in Mexico than in the United Kingdom, consistent with Mexico’s higher calibrated η and the greater leverage of the learning mechanism (γ·S·Cᵟ) when the system starts further from its capability ceiling K6. These results suggest that investments slowing capability erosion may yield disproportionate structural returns in fragile contexts. Examples include measures that reduce talent emigration or increase the organisational continuity of support agencies. These investments reduce the outflow that the R1 learning inflow must overcome to generate net capability growth. Second, joint perturbations to λ and μ (Appendix F) confirm that Mexico’s structural sensitivity spans the full two-dimensional calibration space: across all 48 grid combinations, Mexico’s S at t=20 varies by 35 units (19% of the baseline S3 plateau), while the UK’s varies by only 6 units (3%). The 5.4× sensitivity ratio is not an artefact of any single parameter choice. It reflects the two contexts’ different structural distances from the coordination threshold.
Taken together, these results support three structural conclusions. First, under the simulated conditions, feedback-loop dominance shapes long-run ecosystem trajectories more strongly than resource volume does. Across both contexts, Scenario 2 consistently fails to produce a durable transformation. Financing without coordination cannot activate R1 and R2. Second, the coordination threshold behaves as a context-sensitive structural property rather than a universal constant. Its timing, fragility, and structural significance differ across the two simulated contexts. These differences reflect calibrated values of I0, λ, μ, and η — parameters that represent, rather than directly measure, the institutional geometry of each context. Third, capability accumulation functions as a more structurally reliable indicator of transformation than startup population counts. It rises only when R1 loop dominance has been established and sustained. Whether this diagnostic hierarchy holds in real ecosystems is an open empirical question. It depends on the availability of proxy indicators that can track capability stock trajectories independently of output counts.
5. Discussion
The simulation results show that entrepreneurial ecosystem development is more strongly shaped by feedback-loop dominance than by resource intensity. Below the coordination threshold — the condition R1/B1 = 1 — additional resources generate visible but self-limiting startup activity. The structural conditions for compounding growth are not yet met. Above the threshold, the same inputs are amplified through the R1 and R2 loops, leading to sustained capability accumulation and institutional reinforcement. This structural distinction reframes the Mexico–United Kingdom comparison. The two ecosystems differ not primarily in resource levels, but in the feedback architecture through which those resources are processed. Mexico’s calibrated institutional baseline — lower I0, higher μ, lower λ — configures the simulated feedback loops to dissipate policy inputs rather than compound them. The United Kingdom’s denser institutional infrastructure places coordinated intervention closer to the threshold from the outset. Four implications follow from this structural reading, each addressed in turn.
Before developing those implications, one framing condition must be stated clearly. The four arguments that follow are model-based structural explanations, not direct empirical proofs of the mechanisms they describe. The model identifies the feedback conditions under which coordinated intervention yields qualitatively different developmental trajectories. Resource intensification alone does not produce those trajectories within the calibrated parameter space. Whether the same structural logic operates in real ecosystems depends on empirical conditions that the simulation cannot directly observe. These include the actual density and coherence of coordination networks, the degree to which policy effort translates into institutional practice, and the fidelity of the calibration to each national context. The discussion moves between two registers throughout: the structural argument derived from the model, and the conditional inference that this argument may illuminate real-world governance problems in analogous ways. The coordination threshold is a model-derived analytical construct whose usefulness as a governance concept depends on whether real-world proxy indicators can sufficiently approximate the underlying structural dynamics that the model formalises; the construct itself does not transfer to practice independently of that approximation.
5.1. Why Resource Volume Is Insufficient: Ecosystem Trajectories Are Determined by Feedback Architecture
The first and most direct implication is that resource expansion alone does not reliably shift an ecosystem from a self-limiting to a self-reinforcing developmental regime. Scenario 2 — sustained intensification of financing without coordination — yields visible short-run gains in startup activity. Those gains weaken over time and fail to trigger capability accumulation. The structural mechanism is clear. Financing intensification raises the S inflow rate (α·I·F·(1−S/K)), temporarily increasing S. But R1 and R2 do not activate. The additional startup density generates neither the learning spillovers nor the performance feedback required to sustain growth. A feedback architecture configured to dissipate inputs continues to do so regardless of input volume, with direct implications for the sequencing of resource-volume policies.
This finding challenges a persistent assumption in ecosystem policy: that underperformance stems from insufficient support intensity rather than from structural misalignment. Below the coordination threshold, adding resources does not address the structural source of underperformance. It treats a symptom. The underlying feedback architecture remains intact. The difference between Scenarios 2 and 3 in Table 3 is the clearest demonstration: both deliver equivalent increases in financing, but only Scenario 3 alters the feedback architecture by strengthening institutional coordination, enabling R1 and R2 to activate. Under the simulated conditions, the decisive distinction is not between more and less support, but between fragmented and coordination-capable institutional architectures.
In Meadows’ [17] taxonomy of leverage points, coordination quality is placed at a structurally higher level of intervention than resource volume. Adding financing, programme slots, or mentoring hours changes flow volumes. It does not change the feedback structure. Without that structural change, the intervention is low-leverage. Changing the feedback structure itself — activating the reinforcing loops that convert resource inputs into cumulative capability growth — is the high-leverage intervention. The model provides a structural basis for this distinction. It specifies the feedback conditions under which resource inputs compound rather than dissipate. It also identifies the degree of coordination required to activate those conditions.
5.2. Interpreting the Mexico–United Kingdom Comparison: Coordination Thresholds Are Structurally Contingent
The second implication concerns the interpretation of the comparative design. A superficial reading might treat the United Kingdom as a more advanced ecosystem and Mexico as a less mature one. The model represents the two cases as distinct feedback regimes, each with a different structural distance from the coordination threshold. They are not successive stages along a common developmental path.
The United Kingdom reaches R1-dominant dynamics earlier because its pre-existing institutional density (higher I0, higher λ, lower μ) places it closer to the threshold at the start of the simulation. Mexico responds later but achieves a proportionally larger gain relative to its own baseline once coordination becomes effective. This is analytically important for two reasons. First, coordination thresholds are structurally contingent properties of each context’s institutional geometry, not universal constants. This has direct implications for how practitioners assess policy transferability. Their timing, fragility, and policy significance depend on the pre-existing density, continuity, and effectiveness of institutional support — all represented by the model’s context-specific parameters and, as shown in Table 4, the primary structural sources of the Mexico–UK sensitivity asymmetry. Second, the relevant policy question for a fragmented context is not how to replicate the instruments observed in high-performing ecosystems, but how to build the coordination architecture that enables those instruments to trigger reinforcing feedback. Both contexts use equivalent intervention packages. What differs is the structural distance each must traverse before those tools begin to generate compounding effects.
This has practical implications for how policy learning flows across contexts. The sensitivity analysis in Table 4 shows that the Mexican threshold is qualitatively fragile in ways the UK threshold is not: a 20% deterioration in λ suppresses threshold crossing entirely in Mexico, whereas the UK trajectory retains its sigmoidal character under the same perturbation. This asymmetry has a direct consequence. Fragile institutional contexts demand more sustained coordination effort — and for longer — before threshold crossing becomes possible. The margin for error is narrow. The cost of coordination failure is not a delayed outcome; it is a foreclosed one. Programme continuity, inter-agency coordination, and protection of institutional memory are not peripheral concerns in fragile settings. Within the model’s structure, they are the primary conditions governing whether threshold activation is possible. The proxy indicators in Section 5.3 operationalise this finding for practice [8,34].
A further limitation of the comparative design is worth acknowledging directly: the threshold mechanism may be displaced or reshaped by factors the current specification holds constant. Demand-side conditions — market size, consumer sophistication, and domestic corporate purchasing depth — are not modelled as dynamic variables. They are embedded implicitly in the financing and policy parameters. Significant demand-side constraints could suppress threshold activation independently of coordination quality. Macroeconomic shocks and political cycle discontinuities can alter the effective values of λ and μ in ways that the model represents as stable parametric differences. Sector-specific regulatory conditions can independently constrain startup formation rates in ways that overlap with the coordination mechanism but are not reducible to it. The model’s structural argument asserts that coordination architecture constitutes a necessary condition for feedback-driven growth under the simulated conditions. It does not claim that coordination architecture is the only condition, nor that it operates independently of the broader institutional environment.
5.3. Operationalising the Diagnostic: Leading Structural Proxies
The temporal mismatch between slow structural assembly and short administrative cycles creates a systematic risk of misclassifying pre-threshold progress as policy failure. Table 5 maps the model’s governing feedback dynamics to observable proxy indicators. It provides a structural lens for monitoring threshold proximity without requiring the full model apparatus. The coordination threshold (R1/B1 = 1) is a model-derived analytical construct. These proxies approximate rather than directly measure the underlying structural dynamics. The diagnostic logic is only as transferable as that approximation is defensible. The proxies are particularly consequential in fragile institutional contexts such as Mexico. There, high institutional decay (μ) and qualitative sensitivity to policy effectiveness (λ) narrow the window for successful intervention.
Table 5.
Model-Based Diagnostic: Observable Proxies for Structural Assembly.
| Model Component | Structural Role | Observable Proxy Indicators | Operational Significance for Practice |
|---|---|---|---|
| Institutional Support (I) & Decay (μ) | Counteracting fragmentation to build baseline institutional density. | Proportion of active programmes with an uninterrupted operating history of three or more years. Stability of leadership tenure in key intermediary organisations anchoring the coordination network. |
Resistance to Decay. High μ in Mexico requires sustained effort simply to offset institutional memory loss before net institutional growth can begin. Programmes that preserve continuity across political cycles directly counteract this structural vulnerability. |
| Policy Effectiveness (λ) | Converting policy effort into effective institutional reinforcement. | Number of documented cross-agency coordination agreements with operational accountability mechanisms. Programme budget execution rate — the proportion of allocated coordination funds disbursed within each fiscal year. |
Threshold Sensitivity. Mexico is qualitatively fragile to λ: a 20% deterioration in policy effectiveness is sufficient to suppress threshold crossing entirely. This is the single most structurally consequential parameter in the Mexican context. |
| Capability Stock (C) & Learning (γ) | Accumulating slow-depreciating experiential knowledge and network capital. | Annual rate at which ecosystem alumni transition into mentoring or investor roles within the same ecosystem. Density of active mentoring relationships per cohort of new ventures. Proportion of new ventures founded by individuals with prior startup experience in the same ecosystem (repeat-founder rate). |
The Learning Delay. The capability stock C rises only after the startup population S reaches sufficient density. Early stagnation in output counts does not signal failure if these proxies are rising — they indicate the R1 loop is gaining traction. |
| Loop Dominance Ratio (R1/B1) | Tipping point between self-limiting and self-reinforcing feedback regimes. | Sustained upward trend in two- and three-year cohort survival rates, controlling for financing levels. Ratio of serial entrepreneurs to first-time founders within active cohorts. |
Structural Diagnostic. A rising R1/B1 ratio below unity signals the system is in structural assembly, not stagnation. The trajectory of the ratio — not its absolute level at any single point — is the relevant indicator of pre-threshold progress, supporting the case for continued coordination investment. |
Note. Proxy indicators are leading structural signals, not direct measurements of model variables. All are subject to confounding from factors outside the model boundary. Their value lies in directionality: a favourable trajectory across multiple proxies simultaneously is consistent with pre-threshold structural assembly, even when aggregate output counts remain modest. μ = institutional decay rate; λ = policy effectiveness coefficient; γ = learning intensity; C = capability stock; R1 = reinforcing learning loop; B1 = balancing exit-pressure loop.
These proxies are not generic systems-thinking diagnostics. They map directly to the model variables whose trajectories determine whether threshold activation is approaching or receding. Output-only frameworks are likely to misclassify pre-threshold assembly as policy failure. Structural diagnostics of the kind identified in Table 5 reduce that risk. Policymakers should assess the quality of coordination, institutional continuity, and learning indicator trajectories alongside startup counts. This is particularly important in pre-threshold contexts, where the two signal types are most likely to diverge. Doing so improves the structural interpretability of evaluation data. Universities, incubators, and intermediary organisations should maintain relational infrastructure and institutional memory during periods of low visible output. Doing so preserves the slow-depreciating capability stock the R1 loop requires. When coordination strengthens, that stock enables compounding effects. The model formalises this investment logic. The capability stock (C), documented in Table 2, accumulates through sustained feedback activity rather than discrete inputs. This is why its time constant is substantially longer than that of the startup stock.
5.4. Conceptual Contributions to Systems Thinking and Ecosystem Policy Analysis
The study makes three conceptual contributions that extend existing frameworks in systems thinking and entrepreneurial ecosystem research.
The first is a specification of ecosystem underperformance as a feedback-structural problem rather than a resource-endowment problem. The literature has long acknowledged that ecosystem development depends on institutional conditions rather than resource levels alone. This acknowledgement has remained largely descriptive, however. It offers no structural mechanism to distinguish fragmented from coordinated configurations. The model provides that mechanism. By formalising the conditions under which B1 or R1 loop dominance prevails, it converts a conceptual distinction (coordination matters more than capital) into a structurally specified and diagnostically tractable claim. The conceptual contribution is not the claim itself — it appears in the literature in various forms. The contribution lies in its formalisation within a feedback structure. That formalisation makes the threshold condition explicit and renders the diagnostic implications derivable.
The second is an operationalisation of the systems thinking concept of leverage points in the context of ecosystem governance. Meadows [17] identifies changes in feedback-loop structure as higher-leverage interventions than changes in flow volumes. She presents this, however, as a general heuristic rather than an analytically specified mechanism. The coordination threshold instantiates that heuristic in a specific governance context. In Meadows’ [17] hierarchy, conventional resource-volume policies operate at leverage point 12 — changing the size of flows through parameters such as financing levels, programme budgets, or mentoring hours. These are the weakest interventions because they leave the feedback structure unchanged. The coordination threshold specifies the structural condition at which an intervention moves up the hierarchy: crossing it requires activating the strength of reinforcing feedback loops (leverage point 7) and simultaneously reducing the dominance of the balancing loop governing exit pressure (leverage point 8). This is a qualitatively different category of intervention — not adding more to an existing flow, but changing which loops dominate the system’s behaviour. The model specifies, within its calibrated parameter space, the level of institutional coordination required to make that shift. This is what converts the leverage point concept from a general heuristic into a diagnostically tractable claim: the threshold identifies not just that feedback-structural interventions are more powerful, but when a given institutional configuration is positioned to execute one. This adds analytical specificity to a concept widely cited but rarely formalised in innovation and entrepreneurship systems research [35,36,37].
The third reframes the evaluation misalignment problem as structural rather than political. The observation that short policy cycles are poorly matched to long ecosystem development timescales is not new. What is new is the structural specification of why that mismatch produces misclassification. Policymakers do not lack patience. The problem is structural. The changes that determine whether an ecosystem transforms occur at the level of feedback architecture, where they produce no immediate output signal. This shifts the burden of the problem from political will to evaluative design. It is a more tractable diagnosis — and a more productive direction for future work in systems practice. The proxy indicators in Section 5.3 represent one attempt to bridge that design gap. Future work should test three things: whether those proxies are empirically observable, whether they are sufficiently independent of the output indicators they are intended to supplement, and whether they are robust to the confounding factors the current model holds constant.
6. Implications for Policy and Practice
The model’s structural findings have direct implications for how ecosystem interventions are designed, sequenced, and evaluated. Three results from Section 4 and Section 5 carry the most practical weight. First, resource expansion without activating coordination does not alter feedback loop dominance and therefore does not produce durable ecosystem transformation — a finding with direct implications for how public agencies prioritise coordination quality relative to funding volume. Second, the coordination threshold is context-sensitive: its level, fragility, and policy requirements differ between institutionally dense and fragile settings, as the model’s sensitivity analysis quantifies these differences. Third, the pre-threshold assembly phase produces structural progress that is invisible to output-based evaluation frameworks, creating systematic misclassification that can lead stakeholders to withdraw support at the moment when continued coordination is most necessary. Each of these findings implies specific changes in practice for the stakeholder groups most directly involved in ecosystem governance.
6.1. Practice Implications for Policymakers, Universities, and Intermediary Actors
For public agencies and policymakers, the central implication is that ecosystem strategy should be organised around activating coordination rather than intensifying resources. The model shows that the policy effectiveness parameter λ — which governs the rate at which policy effort translates into effective institutional support — is the single most threshold-sensitive structural variable in the Mexican context: a 20% deterioration in λ suppresses threshold crossing entirely, collapsing the coordinated trajectory into self-limiting behaviour (Table 4). This finding has a precise operational meaning: programme designs that fragment accountability across multiple agencies, shorten intervention cycles, or fail to maintain cross-actor alignment do not merely reduce efficiency — they can structurally prevent the R1 loop from activating. Conversely, policy designs that strengthen institutional continuity, consolidate coordination responsibility, and protect the I stock from decay (by reducing μ) improve the structural conditions for threshold crossing disproportionately relative to their direct cost. For agencies allocating limited resources between additional funding instruments and coordination infrastructure, the model provides a structural basis for prioritising the latter in fragmented institutional settings.
The sensitivity analysis also shows that the window for effective coordination intervention is structurally narrower in fragile contexts. Mexico’s institutional geometry places the ecosystem near the B1/R1 boundary, so modest deterioration in policy coherence — through leadership change, inter-secretariat fragmentation, or programme discontinuity — is sufficient to prevent threshold crossing. Protecting that window requires evaluation frameworks that track the trajectory of the R1/B1 loop dominance ratio, not just current-period startup counts. A rising ratio below unity is structural evidence of assembly progress; a flat or declining ratio signals that the pre-conditions for threshold activation are eroding, regardless of short-run output levels.
For universities, the model identifies a specific structural role that extends beyond service delivery. In the model’s feedback architecture, the capability stock C has a longer time constant than the startup stock S because it accumulates through sustained feedback activity — learning spillovers, network capital, institutional memory — rather than discrete inputs. In the model’s aggregate representation, universities contribute to inflows of C and I — the capability and institutional support stocks — through mechanisms associated in the literature with the preservation of experiential knowledge, the maintenance of relational networks, and institutional memory across policy cycles [10,13]. The model does not disaggregate these contributions; the interpretive rationale for treating universities as structurally significant actors rests on the empirical literature rather than on a sub-model of university behaviour. This structural role is most consequential in fragile institutional settings, where the capability depreciation rate η is higher, and the institutional decay rate μ creates periodic ruptures in the support stock I. In such settings, universities function as a structural buffer against capability erosion: when policy support contracts, the slow-depreciating stock of capability they maintain preserves the R1 loop’s inflow conditions at a level that a purely policy-dependent system could not sustain. The practical implication is that universities should resist pressure to demonstrate impact exclusively through short-cycle output metrics — startup counts, licensing revenue, consultancy volume — because these metrics are insensitive to the structural function they perform. Their contribution to ecosystem resilience is measured more accurately by the continuity and density of the relational and knowledge infrastructure they maintain across policy cycles than by any single-period output indicator.
For incubators, accelerators, and intermediary organisations, the model’s R1 loop activation logic implies a specific density threshold below which their activities yield benefits for individual ventures but do not produce ecosystem-level learning spillovers. The learning inflow to C (γ·S·Cᵟ·(1−C/K6)) requires sufficient startup density and active coordination to generate spillovers: ventures operating in isolation, or in intermediary environments that do not actively facilitate peer learning and network formation, contribute to C at a rate too low to offset depreciation. This has a direct organisational implication: the design of incubation and acceleration programmes should prioritise cross-venture learning and network density over individual-firm service volume. Cohort structures, alumni integration, mentor circulation, and deliberate cross-sector connection-building are not peripheral programme features — they are the mechanisms through which individual firm-level support generates the ecosystem-level learning spillovers that feed the R1 loop. In the model’s terms, increasing γ through denser intermediary design yields proportionally greater leverage in fragmented institutional contexts precisely because the system starts further from its capability ceiling K6, where marginal increases in the learning inflow have the greatest structural impact.
For evaluation designers across all stakeholder groups, the core implication is that evaluation frameworks must be restructured to include feedback-structural diagnostics alongside output indicators. The model identifies three observable proxies for structural progress that are more reliable than short-run startup counts as indicators of threshold proximity: the quality and continuity of cross-actor coordination, the trajectory of institutional support under policy stress, and the accumulation of capability indicators — mentor density, alumni network activity, serial entrepreneur prevalence — that signal whether the R1 learning loop is gaining traction. None of these requires the full model apparatus to assess in practice. They require a shift in evaluation logic: from measuring what the system has produced in the current period to diagnosing whether the system’s feedback architecture is moving towards or away from the structural conditions for self-reinforcing growth. Pre-threshold periods assessed through this structural lens look different from those assessed through output metrics alone, and the misclassification that currently drives premature withdrawal of coordination support can be corrected by incorporating that structural lens into standard evaluation practice.
6.2. Limitations and Future Research
The argument should be read within the study design’s scope conditions. The model operates at an aggregate level and is designed to clarify structural dynamics rather than to forecast precise empirical outcomes. Three-stock representations necessarily simplify the institutional complexity they describe: the model captures the coordination–capability relationship with parsimony, but it does not differentiate across policy domains, institutional hierarchies, or the heterogeneous actors whose interactions constitute the support environment in practice. The comparative analysis of two institutional contexts provides structural leverage — the Mexico–United Kingdom contrast is sufficiently wide to reveal the threshold dynamics of interest — but it does not exhaust the range of ecosystem configurations that exist between highly fragmented and highly coordinated settings. The model also holds policy settings constant across the simulation horizon, which cleanly isolates coordination effects but abstracts away from the political discontinuities, demand-side shocks, and cultural variation that shape real intervention trajectories. These choices define the model’s scope rather than undermining its central findings: the qualitative scenario ranking is robust across the full sensitivity analysis, and the threshold dynamics are preserved across all but one perturbation combination.
Future research should extend this work in four directions. First, richer longitudinal evidence on the quality of institutional coordination—tracking the trajectory of cross-actor alignment, programme continuity, and learning network density over time—would improve the empirical specification of threshold behaviour and allow direct testing of the loop-dominance diagnostic against observed ecosystem trajectories. Second, broader comparative designs incorporating intermediate institutional settings—ecosystems that sit closer to the threshold in ways that neither Mexico nor the United Kingdom represents—could test the generalisability of the coordination threshold mechanism and refine the parameterisation of context-sensitive structural differences. Third, future modelling should incorporate explicit delay structures, policy-discontinuity shocks, and demand-side variation to improve the temporal realism of the simulation and to test whether the pre-threshold assembly logic holds under episodic rather than sustained policy commitment. The formal delay specification documented in Appendix B provides the starting point for this extension. Fourth, participatory system dynamics modelling with policymakers, universities, incubators, and entrepreneurs—using the current model as a shared boundary object—could connect the structural analysis developed here to systems-informed policy design and evaluation practice, moving from model insight to institutional change through the collaborative construction of structural understanding among the actors most able to act on it.
7. Conclusion
This study demonstrates that feedback-loop dominance — not resource volume — is the primary structural determinant of long-run entrepreneurial ecosystem trajectories. This finding holds, at least, within the calibrated configurations examined here. Coordinated institutional intervention activates the reinforcing dynamics that convert policy inputs into cumulative capability growth; resource intensification alone does not. The two national contexts reveal that the coordination threshold — the point at which this transition occurs — is structurally contingent. The United Kingdom’s denser institutional baseline produces earlier activation. Mexico’s fragmented architecture delays the transition but yields proportionally larger gains once coordination takes hold. The sensitivity analysis locates Mexico’s primary structural vulnerability not in resource scarcity but in the institutional conditions governing feedback activation. This represents a qualitative fragility that equivalent perturbations do not produce in the UK context.
These findings carry direct implications for systems practice. Ecosystem governance organised around coordination activation rather than resource intensification is more likely to shift the feedback architecture toward self-reinforcing development. Evaluation frameworks should complement output indicators with structural diagnostics. These diagnostics include tracking the loop-dominance trajectory, coordination continuity, and capability accumulation. By doing so, frameworks can recognise pre-threshold assembly as structural progress rather than misclassifying it as a policy failure. The capability stock’s slow time constant means that the most consequential ecosystem changes are precisely the least visible within standard evaluation cycles. Addressing this requires evaluative redesign, not only political commitment.
The model developed here formalises these structural dynamics. We calibrated it to two specific institutional contexts. We then validated it against established system dynamics practice. Its scope is that of an exploratory structural tool rather than a predictive instrument. Future work should extend the model to include richer temporal specification, broader comparative coverage, and participatory engagement with practitioners. These practitioners are the ones whose decisions shape the feedback architectures that this analysis has sought to make legible. Future research should also test whether the proxy indicators implied by the model can be operationalised in real governance contexts. That empirical condition ultimately determines the practical value of the model’s diagnostic logic. More broadly, this study argues that dynamic modelling is not an optional methodological refinement in ecosystem research. Rather, it is a prerequisite for any policy evaluation that takes the temporal structure of the systems it seeks to govern seriously. Static indicators will continue to mislead as long as the feedback architecture that determines whether interventions compound or dissipate remains invisible to the frameworks used to assess them. Making that architecture visible is the core contribution that systems thinking and system dynamics are positioned to deliver.
Supplementary Materials
The following supporting information can be downloaded at the website of this paper posted on Preprints.org. The simulation code, parameter configuration files, and numerical output data supporting the results reported in this article are available upon request from the corresponding author. The Python implementation follows the governing equations documented in Table 2 and includes all routines required to replicate Figure 3, Figure 4 and Figure 5, as well as the sensitivity analyses reported in Table 4 and Appendix F.
Author Contributions
Conceptualisation, E.D.L. and R.P.R.; methodology, E.D.L. and R.P.R.; software, E.D.L.; validation, E.D.L. and R.P.R.; formal analysis, E.D.L. and R.P.R.; investigation, E.D.L.; data curation, E.D.L.; writing — original draft preparation, E.D.L. and R.P.R.; writing — review and editing, E.D.L. and R.P.R.; visualisation, E.D.L. All authors have read and agreed to the published version of the manuscript.
Funding
This research received no external funding.
Data Availability Statement
The simulation code and parameter files required to reproduce all reported results are available from the corresponding author upon request. No empirical datasets were collected or generated during the study. Expert elicitation responses obtained via the Repertory Grid Technique were anonymised at the point of collection and cannot be shared publicly; aggregate statistics are reported in Table 1 and Table A1.
Acknowledgments
Enrique Díaz de León López conducted part of this research during a sabbatical research stay at the Centre for Systems Studies, University of Hull. The authors gratefully acknowledge the Centre for its institutional support, workspace, and intellectual community during that period. The authors also acknowledge the ten expert panel members who participated in the Repertory Grid Technique elicitation sessions; their institutional knowledge was essential to the comparative calibration of the model.
Conflicts of Interest
Roberto Palacios Rodríguez is a Guest Editor of the Special Issue Systems Thinking and Systems Practice in Systems (MDPI), to which this manuscript is submitted. In accordance with MDPI editorial policy, he has taken no part in the peer review process or acceptance decision for this manuscript; all editorial handling has been managed exclusively by the co-Guest Editor. Enrique Díaz de León López declares no conflicts of interest. The research was conducted in accordance with the ethical standards and research integrity policies of the University of Hull. No funder had any role in the design of the study; in the collection, analyses, or interpretation of data; in the writing of the manuscript; or in the decision to publish the results.
Abbreviations
The following abbreviations are used in this manuscript:
| SD: System Dynamics |
| RGT: Repertory Grid Technique |
| S: Active startup population stock |
| C: Entrepreneurial capabilities stock |
| I: Institutional support stock |
| R1: Reinforcing loop — Learning and capability formation |
| R2: Reinforcing loop — Ecosystem attractiveness |
| B1: Balancing loop — Exit pressure |
| B2: Balancing loop — Institutional capacity ceiling |
| K: Startup carrying capacity |
| K6: Institutional capacity ceiling |
| OECD: Organisation for Economic Co-operation and Development |
| GEM: Global Entrepreneurship Monitor |
| LAVCA: Latin American Private Capital Association |
| INADEM: Instituto Nacional del Emprendedor (Mexico) |
| TIS: Technological Innovation System |
| IQR: Interquartile range |
| RK4: Fourth-order Runge–Kutta integration |
Appendix A. Extended Calibration Logic, Initial Conditions, and Parameter Ranges
This appendix documents how the team established, cross-checked, and bounded each context-sensitive value — not to claim exact empirical measurements, but to make the calibration reasoning transparent. The reported values are theoretically grounded estimates, not direct empirical observations.
The calibration strategy drew on three sources of evidence. First, a structured expert elicitation process using the Repertory Grid Technique informed context-sensitive parameters, with median values serving as central estimates and interquartile ranges defining plausible intervals. Second, documentary and statistical sources assessed whether the direction and relative scale of the Mexico–United Kingdom differences were institutionally plausible. Third, the team evaluated calibration decisions behaviourally by checking whether the resulting trajectories reproduced credible ecosystem responses across baseline and intervention scenarios.
The most sensitive comparative parameters are baseline institutional support (I0), policy effectiveness (λ), learning intensity (γ), capability depreciation (η), and institutional decay (μ). These parameters matter structurally because they govern whether reinforcing coordination loops remain dormant, activate gradually, or fail to cross the coordination threshold. Scenario-design parameters, such as financing intensity, are fixed by design and were not subject to expert panel calibration.
Initial conditions for the two key stocks provide a comparable analytical starting point rather than an exact historical baseline. S0 represents a normalised starting population for early-stage ventures. C0 captures the pre-existing level of accumulated know-how, mentorship density, and institutional memory. This choice keeps the analysis focused on structural differences in response dynamics rather than on historical asymmetries in raw scale.
The institutional capacity ceiling (K6) operationalises the upper bound on capability accumulation. It reflects each ecosystem’s absorptive and intermediary infrastructure capacity. The assigned values preserve the qualitative Mexico–United Kingdom difference in institutional depth without claiming precise empirical equivalence. K6 functions as a synthetic boundary condition: it indicates each ecosystem’s capacity to convert coordination into durable capability accumulation.
The parameter ranges meet two requirements: sufficient grounding to preserve institutional plausibility, and sufficient bounding to support meaningful robustness testing. The evidentiary basis of the article’s argument lies not in the precision of any single estimate, but in the persistence of qualitative behavioural patterns across these plausible intervals.
Table A1.
Extended calibration logic for context-sensitive parameters.
| Parameter | Substantive meaning | Central value logic | Mexico central [IQR] | UK central [IQR] | Interval logic | Comparative rationale |
|---|---|---|---|---|---|---|
| Institutional geometry parameters — calibrated via expert elicitation (RGT panel) with secondary validation | ||||||
| I0 | Baseline institutional support level at simulation start. Operationalises the pre-existing density and coordination quality of the support infrastructure. | Panel median of expert RGT ratings on a normalised scale. Cross-validated against GEM [23] ecosystem readiness indicators and [21,28] institutional quality scores. | 0.35 [0.30–0.42] | 0.60 [0.55–0.68] | Expert interquartile range. Reflects disagreement across panel members on the effective strength of baseline support, not measurement error. | Captures the structural difference in pre-existing coordination infrastructure between a context with historically fragmented multi-agency support (Mexico) and one with a consolidated national delivery architecture (UK — Innovate UK, British Business Bank). The 0.25-unit gap (0.60/0.35 ≈ 1.71) represents a lower bound, given the documented visibility gap in informal Mexican support structures. |
| λ | Policy effectiveness coefficient. The rate at which public policy effort P is converted into effective institutional support I, modulating the inflow in the I stock equation. | Panel median, supplemented by a plausibility check verifying that the implied equilibrium I = λP/μ is consistent with observed I0 values and expert-elicited coordination quality ratings. | 0.14 [0.11–0.17] | 0.20 [0.17–0.23] | Expert interquartile range. The interval spans the range within which the qualitative threshold character of S3 is preserved (verified in sensitivity analysis). | Captures the institutional ability to convert policy intent into effective reinforcement. The UK’s higher λ (×1.43) reflects a more coherent programme delivery chain (consolidated calls, single-agency coordination) versus Mexico’s historically fragmented multi-secretariat structure. The single most threshold-sensitive parameter in the Mexican context: a −20% perturbation produces qualitative regime change in S3 (Table 4). |
| Capability accumulation parameters — behaviourally calibrated with expert-informed plausibility bounds | ||||||
| γ | Learning intensity parameter. Controls the rate at which active startup activity generates new ecosystem-level capabilities via the reinforcing R1 loop (dC/dt inflow). | Panel members assessed the speed of capability accumulation relative to observed ecosystem maturation timelines, cross-validated against Spigel and Harrison [39] empirical estimates of capability accumulation lags. | 0.20 [0.16–0.24] | 0.26 [0.22–0.30] | Expert interquartile range. Reflects genuine uncertainty in the speed of cumulative learning, not model instability; S3 threshold character is preserved across the full interval in both contexts. | Captures ecosystem learning speed and the efficiency with which active ventures generate spillover knowledge. The UK’s higher γ (×1.30) reflects a denser, more interconnected intermediary layer (accelerators, TTOs, alumni networks) that amplifies knowledge circulation. In the Mexican context, γ has proportionally larger leverage on the threshold crossing time because the system starts farther from K6. In the disaggregated sensitivity analysis, η_exp (experiential knowledge, ×1.50η) is the most rapidly eroding sub-dimension; η_inst (institutional memory, ×0.38η) is the most persistent. |
| η | Capability depreciation rate. Controls the rate at which accumulated capabilities C erode through talent emigration, programme discontinuity, and institutional memory loss (dC/dt outflow). | Expert judgement combined with contextual retention logic: panel members assessed the speed of ecosystem knowledge erosion in each context, anchored by observable proxies (researcher emigration rates, average programme tenure, organisational age of intermediaries). | 0.08 [0.06–0.10] | 0.06 [0.05–0.08] | Expert interquartile range. The interval is asymmetric by design. The lower bound represents the minimum depreciation consistent with observed ecosystem fragility; the upper bound represents the maximum consistent with sustained S2 capability growth. | Captures erosion of accumulated capability under institutional discontinuity. Mexico’s higher η (×1.33 relative to UK) reflects faster talent emigration (brain drain to the US), shorter average institutional tenure in support agencies, and the acute depreciation shock produced by the INADEM [27] dissolution. In the disaggregated sensitivity analysis, η_exp (experiential knowledge, ×1.50η) is the most rapidly eroding sub-dimension; η_inst (institutional memory, ×0.38η) is the most persistent. |
| μ | Institutional decay rate. The rate at which effective institutional support I erodes in the absence of sustained policy effort, capturing the structural fragility of the support infrastructure. | Expert judgement combined with policy continuity evidence: panel members assessed the speed of institutional support erosion between active policy cycles. Cross-validated against documented programme discontinuity rates in each context (INADEM records; Innovate UK programme tenure data). | 0.06 [0.05–0.08] | 0.05 [0.04–0.06] | Expert interquartile range. The interval reflects uncertainty in the average decay rate across policy cycles, not individual political events; episodic shocks (e.g., INADEM dissolution [27]) are captured in the central value rather than the interval bounds. | Captures vulnerability of support structures to deterioration. Mexico’s higher μ partly reflects political cycle exposure: inter-administration discontinuities compress years of accumulated institutional capacity into single rupture events (see Section 5 for the limitation of the continuous-decay formulation). The multivariate sensitivity analysis suggests that μ is the primary co-determinant of the Mexico–UK sensitivity asymmetry (5.4× ratio). |
| Structural ceiling parameter — synthetic calibration from expert elicitation and secondary intermediary density data | ||||||
| K6 | Institutional capacity ceiling. The structural upper bound on capability accumulation C imposed by the absorptive capacity of the existing intermediary infrastructure. Operationalises the B2 balancing loop. | Two-stage synthetic calibration: (1) expert panel positioned each context on a normalised saturation scale; (2) cross-validated against INADEM RNEI census (Mexico peak: ~120–140 active portfolio organisations) and UKBI / British Business Bank surveys (UK: 280–310 active incubators/accelerators, 2018–2020). Ratio K6_UK / K6_MX = 1.67 consistent with I0 ratio (1.71). | 150 [125–175] | 250 [210–290] | Plausible bounded interval derived from IQR of expert saturation estimates, bounded below by observed minimum active portfolio size and above by documented peak capacity. Sensitivity analysis indicates that threshold character is maintained across the full interval in both contexts. | Captures the absorptive limit of ecosystem capability accumulation under each institutional architecture. The 1.67× UK–Mexico ratio reflects a combination of greater intermediary density, higher average organisational age (implying greater absorbed learning capacity), and a more comprehensive formal data infrastructure. Because K6 is the ceiling of the R1–B2 interaction, it determines the long-run S3 plateau height: a 10% increase in K6 for Mexico raises the plateau by approximately 6–8%. |
Note. All central values are expressed in normalised model units. Central values represent the panel median of expert elicitation responses obtained via the Repertory Grid Technique (RGT; Kelly [31]; Díaz De León and Guild [32]; Diaz de León and Guild [33]). Calibration intervals represent the interquartile range of the panel distribution. IQR = interquartile range. RGT = Repertory Grid Technique. MX = Mexico; UK = United Kingdom.
Table A2.
Initial conditions and boundary assumptions.
| Element | Meaning in the model | Mexico value | UK value | Interpretation and boundary rationale |
|---|---|---|---|---|
| Initial stock values — normalised units; values represent starting conditions at t = 0 | ||||
| S0 | Initial startup stock. The normalised population of active early-stage technology-based ventures at simulation start. | 5.0 | 8.0 | Reflects the observable difference in active early-stage startup density at the start of the simulation window. The Mexico value corresponds to the GEM [23] early-stage entrepreneurial activity rate adjusted for technology-orientation (approximately 2.1% of adult population in knowledge-intensive sectors). The UK value corresponds to the Innovate UK portfolio baseline and ONS business demography high-growth startup rate (approximately 3.4%). |
| C0 | Initial capability stock. The accumulated ecosystem-level entrepreneurial capability at simulation start, representing the existing stock of experiential knowledge, network capital, and institutional memory. | 2.0 | 4.0 | The team calibrated C0 proportionally to S0 and I0, setting it so that the initial C/K6 ratio reflects the expert panel’s assessment of ecosystem maturity relative to the structural ceiling. For Mexico, C0/K6 ≈ 0.013 (nascent accumulation phase); for the UK, C0/K6 ≈ 0.016 (modestly more advanced but still far from ceiling). The ratio C0_UK / C0_MX = 2.0 is consistent with the S0 ratio (1.6) and the I0 ratio (1.71), reflecting a coherent initial institutional geometry across all three stocks. |
| I0 | Initial institutional support stock. The starting level of effective institutional support infrastructure active at t = 0. | 0.35 [0.30–0.42] | 0.60 [0.55–0.68] | Same value as the calibrated I0 parameter (Table A1). Because I evolves dynamically from this starting condition under the governing equation dI/dt = λ·P − μ·I + φ·(S/S_ref), the initial condition also determines the speed of institutional adjustment in the early periods of the simulation. The [0.30–0.42] interval for Mexico partially reflects the documented visibility gap in informal support structures (Section 3.6). Treat the lower bound as a conservative floor. |
| Structural boundaries — parameters that define the ceilings and scope of the simulation | ||||
| K | Startup carrying capacity. The structural upper bound on the active startup population S, representing the maximum number of ventures the ecosystem can sustain given its market, talent, and institutional constraints. | 200 | 240 | Expert-calibrated upper bound on the sustainable startup population under each institutional configuration. The Mexico value reflects the panel’s assessment of the maximum ecosystem absorption capacity at current structural size; the UK value reflects a higher market depth and talent pool. Sensitivity analysis (Table 4) shows that the qualitative threshold character of S3 is maintained across ±20% perturbations to K in both contexts, suggesting that the central findings are not sensitive to moderate uncertainty in this parameter. K is not a hard ceiling in the model; the logistic saturation term (1 − S/K) approaches zero smoothly as S approaches K. |
| K6 | Capability ceiling. Maximum sustainable capability accumulation under each institutional architecture. Operationalises the B2 (Institutional Capacity Ceiling) balancing loop. | 150 [125–175] | 250 [210–290] | Same as calibrated parameter in Table A1. Reproduced here as a boundary assumption because K6 jointly determines both the long-run plateau of the S3 capability trajectory and the activation point of the B2 balancing loop. A K6 value at the lower end of the Mexico interval (125) delays the B2 loop activation by approximately 1.5–2 years relative to the central value; a value at the upper end (175) accelerates it by a similar margin. Neither perturbation alters the qualitative S3 > S2 > S1 ranking. |
| Simulation parameters — numerical and temporal specifications | ||||
| T (horizon) | Simulation horizon. Total simulated time in years. | 20 years | 20 years | Selected to capture at least one full threshold cycle: the pre-threshold accumulation phase (approximately 5–10 years in Mexico S3), the threshold crossing, and the post-threshold growth plateau. The horizon is consistent with established practice in long-horizon SD ecosystem models [16]. It is long enough to observe the R1–B2 handover dynamic while remaining within a planning horizon that policymakers can treat as strategically relevant.. |
| Δt | Numerical time step. The integration step size used in the Euler method. | 0.25 yr | 0.25 yr | Chosen to balance numerical stability and interpretive resolution. A step of 0.25 years (one quarter) provides four data points per year, sufficient to resolve the inflection dynamics of the S3 trajectory without excessive computational overhead. Numerical convergence analysis (Appendix D) compared Euler Δt = 0.25 against Euler Δt = 0.05 and fourth-order Runge–Kutta at Δt = 0.25. Maximum trajectory deviation: 0.18%; maximum inflection-point timing difference: 0.50 years (one step). RK4 reports inflection points 0.0–0.5 years earlier, confirming that the production Euler estimates are marginally conservative. |
Note. All stock values are expressed in normalised model units and are not directly comparable in absolute terms across contexts; the analytically relevant comparison is the ratio of values within and across scenarios. Calibration intervals (where shown) represent the interquartile range of the expert elicitation panel distribution. MX = Mexico; UK = United Kingdom; IQR = interquartile range.
Appendix B. Formal Delay Structure Considered but Not Implemented
The production model captures administrative delay implicitly through institutional support dynamics. Because policy implementation delays are structurally significant, the team considered an explicit formulation of delay during model development. This appendix documents that decision and its analytical consequences.
The motivation was straightforward. In entrepreneurial ecosystems, support does not become effective the moment a policy decision is announced. Budget release, programme design, inter-organisational coordination, legal clearance, and administrative processing may all introduce a lag between nominal commitment and effective deployment. In a threshold-sensitive model, such delays are not trivial: they can postpone feedback activation and make an ecosystem appear unresponsive within conventional policy evaluation windows.
A parsimonious formalisation introduces an intermediate stock D — pending institutional activation — between policy commitment and effective institutional support:
dD/dt = Policy commitment inflow − effective activation outflow
Activation outflow = D / τₐᵈᵐ
dI/dt = Activation outflow − institutional decay
τₐᵈᵐ represents the average administrative delay before committed support becomes operationally effective. The delay does not change the direction of the policy impulse — it alters its temporal transmission into the system’s reinforcing loops.
The team excluded this extension for one reason: reliable and comparable estimates of administrative processing time were unavailable for both contexts. Including the delay stock without defensible comparative grounds would have created an illusion of formal sophistication without improving explanatory credibility.
Omitting the delay stock is a parsimonious modelling choice, not a dismissal of delay’s substantive importance. Indeed, the omission makes the reported threshold timings conservative in a useful sense: if substantial administrative delay were introduced explicitly, threshold crossing in fragile institutional contexts would likely occur later, not earlier.
This matters analytically. Explicit delay would reinforce the argument that short-cycle evaluation frameworks misclassify pre-threshold periods as policy failure. Delay is not a secondary technical nuisance — it is part of the temporal architecture that determines when threshold crossing becomes structurally possible.
Table A3.
Symbols used in the formal delay extension.
| Symbol | Meaning |
|---|---|
| D | Pending institutional activation stock |
| τₐᵈᵐ | Administrative delay parameter |
| I | Effective institutional support stock |
Appendix C. Disaggregated Capability Robustness Extension
The main model represents entrepreneurial capability as a single aggregate stock. This is a deliberate modelling trade-off. The aggregate formulation sacrifices temporal differentiation across sub-dimensions in favour of parsimony, tractability, and a tighter focus on the article’s main question: how coordination shapes threshold-sensitive entrepreneurial futures at the ecosystem level. This appendix reports the robustness extension used to test whether that aggregation materially alters the article’s central conclusions.
In the disaggregated extension, the capability stock is decomposed into three analytically distinct dimensions: experiential capability, network capability, and institutional memory. Experiential capability captures learning-by-doing and venture-formation know-how. Network capability captures the density and usefulness of relational ties that enable entrepreneurs to access information, mentoring, and opportunities. Institutional memory captures the accumulated routines, mentoring structures, and durable organisational knowledge preserved by long-lived ecosystem actors, especially universities and intermediary organisations.
A stylised version of the disaggregated formulation can be represented as follows:
C = Cₑˣₚ + Cₙₑₜ + Cᵢₙₛₜ
dCₑˣₚ/dt = learning inflow− experiential depreciation
dCₙₑₜ/dt = relational accumulation− network erosion
dCᵢₙₛₜ/dt = institutional retention− institutional forgetting
The extension was not intended to replace the production model but to test whether the aggregate stock obscures a qualitatively different ranking of scenarios. It does not. The robustness exercise preserves the central ordering of scenarios in both contexts: fragmented support remains self-limiting, financing intensification without coordination remains insufficient for durable transformation, and coordinated intervention remains the only configuration capable of triggering threshold-driven ecosystem change.
The main difference is quantitative rather than qualitative. Under disaggregation, the coordinated Mexican trajectory becomes more sensitive than the UK trajectory to changes in the institutional-memory and network-capability dimensions. This reinforces the interpretation already suggested in the main text: the aggregate capability specification is parsimonious but conservative in threshold-proximate contexts.
This finding supports the editorial strategy adopted in the body of the article. The aggregate capability stock is sufficient for the main analytical argument, while the disaggregated extension remains available here for reviewers interested in the robustness of the simplifying choice.
Table A4.
Capability dimensions in the disaggregated robustness extension.
| Capability dimension | Substantive meaning | Structural role in the extension |
|---|---|---|
| Experiential capability | Learning-by-doing and startup know-how | Strengthens venture survival and iterative learning |
| Network capability | Access to mentors, investors, and bridging ties | Improves opportunity circulation and coordination quality |
| Institutional memory | Durable routines and preserved knowledge | Stabilises ecosystem capability across policy discontinuity |
Table A5.
Summary of disaggregated robustness results.
| Comparison | Result |
|---|---|
| Scenario ranking | Preserved in both contexts |
| Mexico under coordinated intervention | More quantitatively sensitive under disaggregation |
| United Kingdom under coordinated intervention | Less sensitive, structurally more buffered |
| Implication | Aggregate capability stock is parsimonious but conservative |
Appendix D. Numerical Convergence Analysis
This appendix reports the numerical convergence checks used to verify that the simulation results are not artefacts of the integration method. The production model was implemented using the chosen baseline numerical scheme and cross-checked against an alternative implementation to assess whether threshold timing, final values, or comparative patterns changed materially under a different numerical approximation.
The convergence results indicate that the production specification yields negligible deviation in final stock values and only slightly conservative threshold timings compared with the alternative implementation. Most importantly, the qualitative behavioural findings remain unchanged: the self-limiting character of fragmented support, the temporary effect of financing intensification without coordination, and the threshold-driven acceleration of coordinated intervention are preserved.
Table A6.
Numerical convergence comparison between baseline and alternative integration schemes.
| Scenario | S@t=20 Euler Δt=0.25 | S@t=20 Euler Δt=0.05 | S@t=20 RK4 Δt=0.25 | Δ from RK4 (S@t=20) | Inflexion Euler Δt=0.25 | Inflexion RK4 Δt=0.25 | Δ inflection |
|---|---|---|---|---|---|---|---|
| MX — S1 (Baseline) | 2.96 | 2.96 | 2.96 | 0.08% | (no inflection) | (no inflection) | |
| MX — S3 (Coordinated) | 181.0 | 181.3 | 181.3 | 0.18% | 10.25 yr | 9.75 yr | 0.50 yr |
| UK — S3 (Coordinated) | 231.3 | 231.3 | 231.4 | 0.02% | 3.50 yr | 3.00 yr | 0.50 yr |
Note. RK4 inflexion points are 0.00–0.50 years earlier than Euler Δt = 0.25, confirming that production estimates are conservative (threshold activation is reported later than the higher-order method indicates). All three methods produce identical qualitative conclusions: S3 dominates S2 dominates S1, and the threshold character of S3 is preserved in both contexts. The purpose of this comparison is to assess whether the model’s qualitative behavioural conclusions are robust to the numerical integration scheme. Small differences in threshold timing do not alter the scenario ranking or the comparative interpretation of the trajectories of Mexico and the United Kingdom.
Appendix E. Expert Elicitation Protocol, Panel Composition, and Reliability Checks
This appendix documents the structured expert elicitation process used to support the comparative parameterisation of the entrepreneurial ecosystems of Mexico and the United Kingdom. It consolidates material that appeared separately in earlier appendix versions and presents it in a single, cleaner format.
The elicitation protocol followed a Repertory Grid Technique approach because several context-sensitive parameters required comparative judgement on institutional qualities for which harmonised time-series data were unavailable. The protocol was therefore designed to translate tacit ecosystem knowledge into structured comparative parameter assessments while preserving traceability, intersubjective discussion, and reliability checking.
Ten experts participated in the process: five with direct knowledge of the Mexican ecosystem and five with equivalent knowledge of the UK context. Expertise covered technological entrepreneurship, university incubation, innovation policy, venture capital, entrepreneurial ecosystems, and system dynamics. To protect blind review, institutional names remain omitted from the appendix.
A total of 65 constructs were elicited across the interviews, with 27 generated by the Mexican panel and 38 by the UK panel. The higher construct yield in the UK panel is consistent with the denser institutional documentation available in that context and does not undermine comparability because aggregation was performed separately within each national panel before cross-context comparison.
Construct coding followed the two-stage procedure associated with Honey’s classification approach. In the first stage, the research team grouped constructs thematically until a stable category structure was achieved. In the second stage, the construct set was randomised and submitted to independent researchers for blind reclassification. The initial reassignment rates were 84% and 73%. After relabelling two category headings to improve semantic fit, the procedure was repeated with two further independent researchers, who achieved reassignment rates of 89% and 86%. The blind reclassification procedure indicates that the revised classification scheme has sufficient interpretive stability for comparative parameter estimation.
This process served two purposes. First, it produced central calibration values and plausible intervals for context-sensitive parameters. Second, it provided independent qualitative support for the study’s main theoretical claim, because experts in both contexts consistently prioritised the sequencing and coherence of institutional coordination over the mere volume of individual resource inputs.
Table A7.
Composition of the expert elicitation panel by subgroup, country, primary expertise, system dynamics familiarity, and session format. Institutional names are omitted in accordance with double-blind review requirements.
Table A7.
Composition of the expert elicitation panel by subgroup, country, primary expertise, system dynamics familiarity, and session format. Institutional names are omitted in accordance with double-blind review requirements.
| Group | n | Country | Primary expertise | SD familiarity | Session format |
|---|---|---|---|---|---|
| MX-1 | 3 | Mexico | Technological entrepreneurship; university-based incubation; innovation management | Introduced via Centre for Systems Studies examples | Presential (Campus Monterrey); ~4 sessions per expert |
| MX-2 | 2 | Mexico | Technology management; startup ecosystem development; regional innovation policy | Introduced via Centre for Systems Studies examples | Presential (Campus Guadalajara); ~4 sessions per expert |
| UK-1 | 2 | United Kingdom | System dynamics; innovation systems; policy modelling | Specialist SD researchers | Presential (Hull); ~4 sessions per expert |
| UK-2 | 2 | United Kingdom | Entrepreneurial ecosystems; university–industry knowledge transfer; venture capital | Familiarised via pre-session materials | Presential (Cambridge); ~4 sessions per expert |
| UK-3 | 1 | United Kingdom | Technology entrepreneurship; regional innovation ecosystems; SME policy | Familiarised via pre-session materials | Presential (Northumbria); ~4 sessions per expert |
| Joint | All 10 | UK + Mexico | Cross-panel synthesis and final parameter convergence | — | Two virtual rounds (full panel); anonymous vote per parameter range |
Table A8.
Structure of the four-phase expert validation protocol, including focus of each phase, materials distributed to panel members prior to sessions, and key outputs. Phase 4 was conducted as two virtual plenary sessions involving all ten panel members.
Table A8.
Structure of the four-phase expert validation protocol, including focus of each phase, materials distributed to panel members prior to sessions, and key outputs. Phase 4 was conducted as two virtual plenary sessions involving all ten panel members.
| Phase | Focus | Materials distributed | Output |
|---|---|---|---|
| 1 | Causal loop diagram review | Full CLD with node descriptions; glossary of SD constructs; two reference CLD examples from the Centre for Systems Studies literature | Expert annotations on loop structure, polarity plausibility, and boundary adequacy; agreed revisions to the CLD before parameter work began |
| 2 | Parameter elicitation and range assignment | Literature summary table with initial parameter estimates per context; Repertory Grid elicitation guide for intangible parameters (γ, I0, λ); blank range-assignment sheet | Individually completed range sheets; RGT constructs for intangible parameters; flagged items of disagreement for Phase 3 discussion |
| 3 | Integrated model review | Revised CLD incorporating Phase 1 feedback; draft Table 1 with provisional parameter ranges; simulation output graphs for baseline scenario | Validated model structure and consolidated parameter ranges; anonymously voted final ranges; signed-off Scenario 1 baseline trajectory plausibility |
| 4 | Virtual joint synthesis (×2 rounds, full panel) | All Phase 3 outputs; cross-context parameter comparison table; preliminary Scenario 2 and 3 simulation outputs | Final parameter ranges for Table 1; consensus on cross-context differential structure; approval of all three scenario configurations |
Table A9.
Summary of construct coding and reliability checks.
| Item | Value | Interpretation |
|---|---|---|
| Total constructs elicited | 65 | Full construct pool across both national panels |
| Constructs from Mexico panel | 27 | Reflects the Mexican ecosystem interviews |
| Constructs from UK panel | 38 | Reflects the UK ecosystem interviews |
| Initial blind reclassification rates | 84% / 73% | Acceptable but imperfect first-round stability |
| Revised blind reclassification rates | 89% / 86% | Supports the revised category scheme |
Appendix F. Multivariate Sensitivity Analysis of Policy Effectiveness and Institutional Decay
The univariate sensitivity analysis reported in the main text tests each parameter separately. This appendix extends that exercise by examining the joint variation of policy effectiveness (λ) and institutional decay (μ), the two parameters whose interaction most directly determines whether reinforcing institutional support can accumulate quickly enough to sustain threshold activation.
This extension is substantively important because the Mexico–United Kingdom difference is not only a matter of parameter levels but also of joint institutional geometry. In the Mexican case, even modest deterioration in policy effectiveness or institutional continuity can move the ecosystem closer to the boundary below which the reinforcing coordination effect weakens substantially. In the UK case, stronger baseline support provides greater buffering against the same joint perturbations.
The multivariate exercise produces two findings relevant to the article’s central claims. First, the coordinated scenario consistently reproduces its qualitative threshold character across the explored calibration space, suggesting robustness to simultaneous parameter uncertainty. Second, Mexico shows substantially greater sensitivity than the UK to joint variation in λ and μ — a result consistent with, though not sufficient to confirm, the proposition that threshold proximity is shaped by the institutional geometry of each ecosystem as represented in the model.
The univariate sensitivity analysis in the main text perturbs each parameter independently. However, the Mexico–UK regime difference is structurally embedded in the joint parameter space of λ (policy effectiveness) and μ (institutional decay rate): both parameters jointly determine the equilibrium level of institutional support, and their interaction determines whether the R1 reinforcing loop can activate from a given starting point. To characterise this joint dependency, a multivariate sensitivity grid was computed over eight values of λ (0.06–0.20) and six values of μ (0.04–0.09), covering the full range of the expert-elicited calibration intervals for both parameters in both contexts. For each (λ, μ) combination, the S3 scenario was simulated, and the active startup population at t = 20 years was recorded.
Table F1 presents a representative subset of the grid (five λ values × four μ values) for each context. Two findings characterise the Mexico–UK regime difference in this joint space. First, the threshold character (the qualitative S-curve signature of R1 loop dominance) is preserved across the entire grid in both contexts: no (λ, μ) combination within the calibration range suppresses the coordination threshold for S3. The study’s qualitative conclusion is therefore robust to simultaneous variation in the two most institutionally sensitive parameters. Second, the magnitude of S3 performance is substantially more sensitive to (λ, μ) variation in Mexico than in the UK. Across the full grid, Mexico’s S at t = 20 varies by 35 units (19% of baseline), while the UK’s varies by only 6 units (3% of baseline)—a 5.4× sensitivity ratio. This asymmetry is structurally explicable: Mexico operates near the coordination threshold, where each marginal improvement in λ or reduction in μ translates into compounding gains through the R1 reinforcing loop. The UK operates well above threshold, where additional improvements in institutional geometry yield diminishing marginal returns. The Mexico–UK regime difference thus lies not in the presence or absence of threshold crossing but in the structural sensitivity of how far above the threshold the ecosystem travels—a distinction invisible to univariate perturbation analysis.
Table A10.
Multivariate sensitivity: S at t = 20 years under S3 as a function of simultaneous variation in λ (policy effectiveness, columns) and μ (institutional decay rate, rows), for Mexico and the United Kingdom. ★ = baseline calibration value. All entries show threshold character (sigmoidal S3 trajectory)—no regime loss is observed across the calibration range.
Table A10.
Multivariate sensitivity: S at t = 20 years under S3 as a function of simultaneous variation in λ (policy effectiveness, columns) and μ (institutional decay rate, rows), for Mexico and the United Kingdom. ★ = baseline calibration value. All entries show threshold character (sigmoidal S3 trajectory)—no regime loss is observed across the calibration range.
| Mexico — S at t = 20 years (S3 scenario) | |||||
| μ \ λ | λ = 0.06 | λ = 0.10 | λ = 0.14 | λ = 0.18 | λ = 0.20 |
| μ = 0.04 | 180 | 183 | 184 | 186 | 186 |
| μ = 0.06 | 174 | 178 | 181 ★ | 183 | 184 |
| μ = 0.07 | 169 | 176 | 179 | 181 | 182 |
| μ = 0.09 | 152 | 168 | 174 | 177 | 179 |
| United Kingdom — S at t = 20 years (S3 scenario) | |||||
| μ \ λ | λ = 0.06 | λ = 0.10 | λ = 0.14 | λ = 0.18 | λ = 0.20 |
| μ = 0.04 | 231 | 231 | 232 | 232 | 232 |
| μ = 0.06 | 229 | 229 | 230 | 230 | 230 |
| μ = 0.07 | 228 | 228 | 229 | 229 | 230 |
| μ = 0.09 | 226 | 226 | 227 | 228 | 228 ★ |
Note. UK baseline is λ = 0.20, μ = 0.05 (between rows μ = 0.04 and μ = 0.06; shown at nearest grid point). Mexico range across grid: 152–186 (spread 35, 19% of baseline). UK range: 226–232 (spread 6, 3% of baseline). Sensitivity ratio: 5.4×. All 48 combinations preserve the S3 threshold character. The table reports the active startup stock at the end of the simulation horizon under the coordinated scenario for alternative combinations of policy effectiveness and institutional decay. The analytical purpose is to assess structural sensitivity, not to empirically identify exact parameter pairs.
The sensitivity analysis identifies an asymmetry between quantitative and qualitative effects within the explored parameter space. For most perturbations, the core behavioural patterns — coordination threshold in S3, self-limiting character of S1 and S2, and directional Mexico–UK contrast — are consistently reproduced across the full width of the calibration intervals, with perturbation effects confined in the model to timing and plateau height rather than qualitative trajectory shape. The critical exception is the policy effectiveness coefficient λ: a 20% negative perturbation in the Mexican context causes S3 to lose its threshold character entirely, converging towards the S2 trajectory and producing a concave growth pattern without an inflexion point. This is a qualitative change in system behaviour, not merely a quantitative shift—it means that the coordination threshold in Mexico is fragile to λ variation in a way that the UK threshold is not. Under an equivalent perturbation, the UK S3 trajectory preserves its threshold character, though with delayed timing. This asymmetry directly supports the study’s central theoretical argument: the coordination threshold in Mexico is structurally precarious in a way the UK threshold is not, because the Mexican context begins closer to the boundary between regime dominance. A small reduction in policy effectiveness—readily produced by programme discontinuity, inter-agency coordination failure, or leadership change—is sufficient to push the Mexican ecosystem back below threshold, while the UK’s stronger baseline institutional capacity provides structural resilience against equivalent perturbations.
Across the explored calibration space, the coordinated scenario retains its threshold character in both contexts, but the spread of final outcomes is substantially larger in Mexico than in the United Kingdom. This supports the interpretation that the Mexican ecosystem operates closer to the coordination threshold and is therefore more structurally sensitive to joint deterioration in policy effectiveness and institutional continuity.
The full model structure, equations, and parameter values are documented in the supplementary material to enable transparency and replication.
References
- Autio, E.; Kenney, M.; Mustar, P.; Siegel, D.; Wright, M. Entrepreneurial Innovation: The Importance of Context. Res. Policy 2014, 43, 1097–1108. [CrossRef]
- Bailetti, T. Technology Entrepreneurship: Overview, Definition, and Distinctive Aspects. Technology Innovation Management Review 2012, 2, 5–12. [CrossRef]
- Björklund, T.A.; Krueger, N.F. Generating Resources through Co-Evolution of Entrepreneurs and Ecosystems. Journal of Enterprising Communities: People and Places in the Global Economy 2016, 10, 477–498. [CrossRef]
- Isenberg, D.J. How to Start an Entrepreneurial Revolution. Harv. Bus. Rev. 2010, 88, 40–50.
- Spigel, B. The Relational Organization of Entrepreneurial Ecosystems. Entrepreneurship Theory and Practice 2017, 41, 49–72. [CrossRef]
- Stam, E. Entrepreneurial Ecosystems and Regional Policy: A Sympathetic Critique. European Planning Studies 2015, 23, 1759–1769. [CrossRef]
- Wurth, Bernd; Stam, Erik; Spigel, Ben Toward an Entrepreneurial Ecosystem Research Program. Entrepreneurship Theory and Practice 2022, 46, 729–778. [CrossRef]
- Brown, R.; Mason, C. Looking inside the Spiky Bits: A Critical Review and Conceptualisation of Entrepreneurial Ecosystems. Small Business Economics 2017, 49, 11–30. [CrossRef]
- Mason, C.; Brown, R. Entrepreneurial Ecosystems and Growth Oriented Entrepreneurship. Final report to OECD, Paris 2014, 30, 77–102.
- Audretsch, D.B.; Fiedler, A. Power and Entrepreneurship. Small Business Economics 2023, 60, 1573–1592. [CrossRef]
- Guerrero, M.; Urbano, D. The Development of an Entrepreneurial University. J. Technol. Transf. 2012, 37, 43–74. [CrossRef]
- Etzkowitz, H.; Leydesdorff, L. The Dynamics of Innovation: From National Systems and “Mode 2” to a Triple Helix of University–Industry–Government Relations. Res. Policy 2000, 29, 109–123.
- Scott, S.; Hughes, M.; Ribeiro-Soriano, D. Towards a Network-Based View of Effective Entrepreneurial Ecosystems. Review of Managerial Science 2022, 16, 157–187. [CrossRef]
- Terstriep, J.; David, A.; Zaghow, L.; Vershinina, N.; Freiling, J. Power Plays: Surfacing the Hidden Currents in Entrepreneurial Ecosystems. Journal of Business Venturing Insights 2025, 24, e00584. [CrossRef]
- Forrester, J.W. System Dynamics, Systems Thinking, and Soft OR. Syst. Dyn. Rev. 1994, 10, 245–256.
- Sterman, J.D. Business Dynamics: Systems Thinking and Modeling for a Complex World. MacGraw-Hill Company 2000.
- Meadows, D. Thinking in Systems: International Bestseller; chelsea green publishing, 2008; ISBN 1603580557.
- Barlas, Y. Formal Aspects of Model Validity and Validation in System Dynamics. Syst. Dyn. Rev. 1996, 12, 183–210. [CrossRef]
- Arrow, K.J. The Economic Implications of Learning by Doing. Rev. Econ. Stud. 1962, 29, 155–173.
- Sterman, J. System Dynamics: Systems Thinking and Modeling for a Complex World. 2002.
- OECD OECD SME and Entrepreneurship Outlook 2019; OECD Publishing: Paris, 2019; ISBN 9789264307919.
- LAVCA 2022 LAVCA Year in Review: Latin America Tech Investment; Latin American Private Capital Association: New York, 2022;
- GEM Global Entrepreneurship Monitor 2021/2022 Global Report: Opportunity Amid Disruption; Hill, S., Ionescu-Somers, A., Coduras, A., Guerrero, M., Rosca, A., Eds.; Global Entrepreneurship Research Association: London, 2022;
- World Bank Doing Business 2020: Comparing Business Regulation in 190 Economies; World Bank Group: Washington, DC, 2020; ISBN 9781464814402.
- OECD International Migration Outlook 2021; OECD Publishing: Paris, 2021; ISBN 9789264459700.
- Wilson, T. A Review of Business-University Collaboration. Department for Business, Innovation and Skills, London 2012.
- Diario Oficial de la Federación Decreto Por El Que Se Reforman, Adicionan y Derogan Diversas Disposiciones Del Reglamento Interior de La Secretaría de Economía [Dissolution of INADEM — Instituto Nacional Del Emprendedor] 2019.
- OECD Entrepreneurship at a Glance 2013; OECD Publishing: Paris, 2013; ISBN 9789264196018.
- Kantis, H.; Gonzalo, M.; Federico, J.; Garcia, S.I. Entrepreneurial Ecosystems Meet Innovation Systems: Building Bridges from Latin America to the Global South. In Entrepreneurial ecosystems meet innovation systems; Edward Elgar Publishing, 2020; pp. 41–60 ISBN 1789901189.
- Tõnurist, P.; Hanson, A. OECD Working Papers on Public Governance No. 44. OECD Working Papers on Public Governance 2020, 1–146.
- Kelly, G.A. The Psychology of Personal Constructs [Originally Published 1955, New York; Norton]. London: Routledge, 1991;
- Diaz de León, E.; Guild, P. Using Repertory Grid to Assess Intangibles: Uncertainty Reduction for Lean Start-Ups in Entrepreneurship; 2015; ISBN 9781849809870.
- Díaz de León, E.; Guild, P.D.P.D. Using Repertory Grid to Identify Intangibles in Business Plans. Venture Capital 2003, 5, 135–160. [CrossRef]
- Stam, E.; van de Ven, A. Entrepreneurial Ecosystem Elements. Small Business Economics 2021, 56, 809–832. [CrossRef]
- Kieft, A.; Harmsen, R.; Hekkert, M.P. Toward Ranking Interventions for Technological Innovation Systems via the Concept of Leverage Points. Technol. Forecast. Soc. Change 2020, 153, 119466.
- Riechers, M.; Fischer, J.; Manlosa, A.O.; Ortiz-Przychodzka, S.; Sala, J.E. Operationalising the Leverage Points Perspective for Empirical Research. Curr. Opin. Environ. Sustain. 2022, 57, 101206.
- Abson, D.J.; Fischer, J.; Leventon, J.; Newig, J.; Schomerus, T.; Vilsmaier, U.; von Wehrden, H.; Abernethy, P.; Ives, C.D.; Jager, N.W.; et al. Leverage Points for Sustainability Transformation. Ambio 2017, 46, 30–39. [CrossRef]
- Díaz De León, E.; Guild, P. Using Expert Knowledge to Envision Future Converging Technologies. In Proceedings of the Portland International Conference on Management of Engineering and Technology; 2007.
- Spigel, B.; Harrison, R. Toward a Process Theory of Entrepreneurial Ecosystems. Strategic entrepreneurship journal 2018, 12, 151–168.
Disclaimer/Publisher’s Note: The statements, opinions and data contained in all publications are solely those of the individual author(s) and contributor(s) and not of MDPI and/or the editor(s). MDPI and/or the editor(s) disclaim responsibility for any injury to people or property resulting from any ideas, methods, instructions or products referred to in the content. |
© 2026 by the authors. Licensee MDPI, Basel, Switzerland. This article is an open access article distributed under the terms and conditions of the Creative Commons Attribution (CC BY) license (http://creativecommons.org/licenses/by/4.0/).
Copyright: This open access article is published under a Creative Commons CC BY 4.0 license, which permit the free download, distribution, and reuse, provided that the author and preprint are cited in any reuse.