Preprint
Article

This version is not peer-reviewed.

Reverse Agroclimatology: Growing Degree Days at Actual Olive Grove and Vineyard Locations Across Europe

A peer-reviewed version of this preprint was published in:
Agronomy 2026, 16(12), 1162. https://doi.org/10.3390/agronomy16121162

Submitted:

03 May 2026

Posted:

05 May 2026

You are already at the latest version

Abstract

Climate change is progressively altering the thermal environment of European agriculture, with direct consequences for high-value perennial crops such as olive (Olea europaea L.) and grapevine (Vitis vinifera L.). Although the Growing Degree Days (GDD) index is widely applied to characterise crop thermal requirements, no systematic evidence exists on the actual GDD values accumulated at the locations where these crops are currently grown across Europe. This study introduces a “reverse agroclimatology” approach that anchors GDD calculations exclusively to olive grove and vineyard areas identified in the Corine Land Cover (CLC) dataset for five reference years (1990, 2000, 2006, 2012, and 2018), using ERA5-Land reanalysis daily temperature data as the climatological input. For each CLC reference year, GDD was computed for olive cultivation (Tbase= 7 °C, January–May) and viticulture (Tbase = 10 °C, April– October) exclusively over registered cultivation pixels, and per-country means were subjected to linear regression trend analysis (p < 0.05). For olive cultivation across 11 Mediterranean countries, statistically significant positive GDD trends were detected in 7 countries, with long-term country means ranging from 476.2 in France to 1214.3 in Cyprus — values that consistently and substantially exceed the canonical 700 GDD suitability threshold, indicating that heat availability is no longer the primary thermal constraint for Mediterranean olive growers. The first appearance of olive cultivation in Slovenia’s 2012 CLC dataset, with a median of 546.5, provides land-use-mapped evidence of a poleward displacement of cultivation boundaries. For vineyard cultivation across 22 European countries, significant positive trends were identified in 18 countries, with warming rates reaching 19.25 GDD yr−1 in Turkey, 15.83 GDD yr−1 in Albania, and 14.89 GDD yr−1 in Bosnia and Herzegovina. Mediterranean and Balkan vineyards already exceed the classical 2,000 GDD viticultural suitability threshold across all reference years, while central and northern European registered vineyards operate below it - though their warmest sites are increasingly approaching or crossing it in the most recent periods. The cultivation-anchored GDD framework, built on openly available data and a fully reproducible R-based pipeline, provides a practical and updatable tool for monitoring the evolving thermal conditions of European olive and wine production under ongoing climate change.

Keywords: 
;  ;  ;  ;  ;  ;  

1. Introduction

Local and regional climate change exerts measurable, growing pressure on the quality and quantity of agricultural production worldwide [1,2,3,4,5]. Simultaneously, the global population faces rising food requirements while the potential to expand farmland remains severely limited, a combination that can only aggravate existing food security challenges. Atmospheric conditions, particularly temperature, relative humidity, and precipitation - are crucial factors influencing crop growth and development, and variations in these parameters are projected to further limit productivity in the coming decades [6,7,8,9]. Latest-generation crop and climate models project markedly more pessimistic yield responses for major crops before 2040 [10], underscoring the urgent need for regionally focused and crop-specific research.
The European continent encompasses a wide variety of agroecological zones, from boreal in the north to semi-arid in the south [11,12,13,14], reflecting the diversity of its natural and agricultural ecosystems. In the Mediterranean Basin, in particular, climate change is expected to drive increases in mean air temperatures and intensification of extreme weather events [4,15,16], accelerating crop development, shortening growing periods, and advancing phenological stages. These thermal shifts have direct consequences for high-value traditional cultivations such as olive (Olea europaea L.) and grapevine (Vitis vinifera L.), both of which are deeply embedded in the region’s cultural heritage and agricultural economy [4,17,18].
Temperature is the predominant driver of development and growth for both cultivations, controlling the evolution of fundamental phenophases — including bud break, flowering, fruit set, and maturity - and ultimately determining production in terms of quantity and quality [14,18,19,20]. Among the available tools for quantifying and monitoring the thermal environment of crops, the Growing Degree Days (GDD) index is among the most effective, straightforward, and widely used agroclimatic indicators [20,21,22,23,24]. First introduced by Réaumur in 1730, who recognized the significance of accumulated heat as a critical ecophysiological factor for plants [25,26], the GDD index operates on the principle that plant development proceeds when air temperature exceeds a crop-specific base temperature (Tbase) for a given number of days [27]. For over 30 years, numerous agroclimatic studies have applied GDD requirements to a wide variety of crops, considering physiological characteristics, phenological observations, and growth stages [19,28,29,30,31], while variations in GDD values have been extensively exploited as indicators of climate change effects on plant communities [32,33,34,35].
The sensitivity of the GDD index to shifting temperature patterns has been demonstrated across diverse climatic contexts. Increases in accumulated GDD have been documented in semi-arid and alpine zones of North America [36,37] in China over a 50- year period [38], and in continental regions with extreme temperature amplitudes [39], consistently revealing a trend of expanding growing seasons and rising heat accumulation. In agricultural applications, the GDD approach has proven particularly valuable for grape harvest timing, vineyard site suitability assessment, and the characterization of winegrape yield and quality under contrasting climatic regimes [40,41,42,43]. The climatological suitability of trans-boundary European regions for winegrape cultivation has been assessed through GDD and surface air temperature indices [43], and historical and projected changes in temperature-based indices for Hungarian wine regions have highlighted the accelerating pace of thermal change in central European viticulture [5,44]. At the cultivation management scale, GDD frameworks have been applied to evaluate the effect of viticultural practices on yield and wine parameters, and to model seasonal climate effects on grapevine yield across non-conventional temporal scales [45,46]. For olive cultivation specifically, the GDD model has been applied to capture the interplay between climatic conditions and key phenological stages of Olea europaea. In contrast, the flowering and heat requirements of distinct olive cultivars across contrasting Mediterranean environments have been characterized, further establishing the thermal sensitivity of this crop to ongoing climatic shifts [47,48].
Olive cultivation and viticulture represent integral pillars of the Mediterranean agricultural sector, both in direct economic terms and as cultural assets [30,49]. Globally, vineyards are distributed across 34 countries, with Europe accounting for 53% of the total viticultural area, concentrated primarily in Spain, France, Italy, and Portugal [50]. Although both crops display a degree of resilience to climate variability, ongoing warming is expected to create increasingly xerothermic conditions in specific areas of the northern Mediterranean Basin (NMB), including southeastern and central Europe, the Adriatic coastal countries, and the Balkans [16,44,51]. Such conditions threaten to shift or contract the geographic distribution of suitable cultivation zones, with projections suggesting significant redistribution of both olive and viticultural areas by the end of the 21st century [52,53].
Despite the importance of these crops and the recognized vulnerability of the broader European agricultural sector to climate change, comparative spatiotemporal analyses of GDD dynamics for both olive and vineyard cultivations across an extended European domain — encompassing Mediterranean and central/northern European countries simultaneously — remain limited. Prior work by the authors has examined GDD trends for olive and vine in the Balkans [54], analyzed the spatiotemporal evolution of GDD for viticulture across the NMB [51], and investigated agrometeorological conditions and trends for wheat and maize in the Balkan Peninsula [55]. The present study builds upon and extends this research line by providing a comprehensive, multi-decadal spatiotemporal analysis of the GDD agroclimatic index for both olive and vineyard cultivations across a broader European domain, covering five reference years (1990, 2000, 2006, 2012, and 2018). The findings aim to contribute to the strategic planning of the agricultural sector and to the formulation of evidence-based adaptation policies in response to ongoing climate change.
Despite the importance and widespread use of Growing Degree Days (GDD) as a classic and reliable agroclimatic index for both oliviculture and viticulture, there is no evidence of the actual values that correspond to the thermal requirements of cultivation. This study will present the temporal variation of GDD as measured above recognized crop sites in Europe.

2. Data and Methods

2.1. Datasets

2.1.1. ERA5-Land Reanalysis Dataset

The primary climatological input for this study is the ERA5-Land reanalysis dataset, produced by the European Center for Medium-Range Weather Forecasts (ECMWF) within the Copernicus Climate Change Service (C3S) [56]. ERA5-Land is a replay of the land component of the ERA5 global reanalysis, applying the H-TESSEL land surface model (Tiled ECMWF Scheme for Surface Exchanges over Land incorporating land surface hydrology) forced by atmospheric fields from the parent ERA5 run. The native spatial resolution is approximately 9 km latitude-longitude grid for distribution through the Copernicus Climate Data Store (CDS). The dataset provides hourly output from January 1950 to near-present, covering land points globally in NetCDF-4 format. From ERA5-Land, the daily maximum (Tmax) and minimum (Tmin) 2 m air temperature fields were extracted for the entire European domain for each of the five CLC reference years (1990, 2000, 2006, 2012, and 2018). Hourly temperature data were processed to obtain daily extremes for the calendar day (00:00–23:00 UTC), and these daily fields served as the sole climatological input for GDD calculations.

2.1.2. Corine Land Cover Dataset

The spatial location of olive grove and vineyard areas was performed using the Corine Land Cover (CLC) dataset [57], a pan-European land-use and land-cover inventory produced by the European Environment Agency (EEA) Copernicus Land Monitoring Service. The CLC dataset provides a hierarchical nomenclature at a minimum mapping unit of 25 ha and a spatial resolution of 100 m. Crucially for the present study, CLC has been produced for five reference years - 1990, 2000, 2006, 2012, and 2018 - providing a temporally consistent framework for tracking changes in the registered extent and geographic distribution of the two cultivations over the study period. The two CLC nomenclature classes used to identify the target cultivations are: CLC code 221 (Vineyards) for grapevine areas, and CLC code 223 (Olive groves) for olive areas.
Grid cells classified as CLC 221 (vineyards) or CLC 223 (olive groves) were retained as the spatial mask for each respective cultivation and reference year. This ensures that the GDD analyses reflect the actual, registered crop locations across Europe for each reference period. This spatial intersection between the high-resolution reanalysis grid and the temporally varying land cover map constitutes the methodological core of the “reverse agroclimatology” approach: GDD is not computed over undifferentiated climate grids but directly over the pixels where cultivation is documented. We note that the CLC dataset underestimates the extent of land cover classes because it identifies linear objects larger than 100m, given its 10m spatial resolution. On the other hand, this characteristic ensures that we have identified only wide, uniform specific cultivation areas.

2.2. Study Area

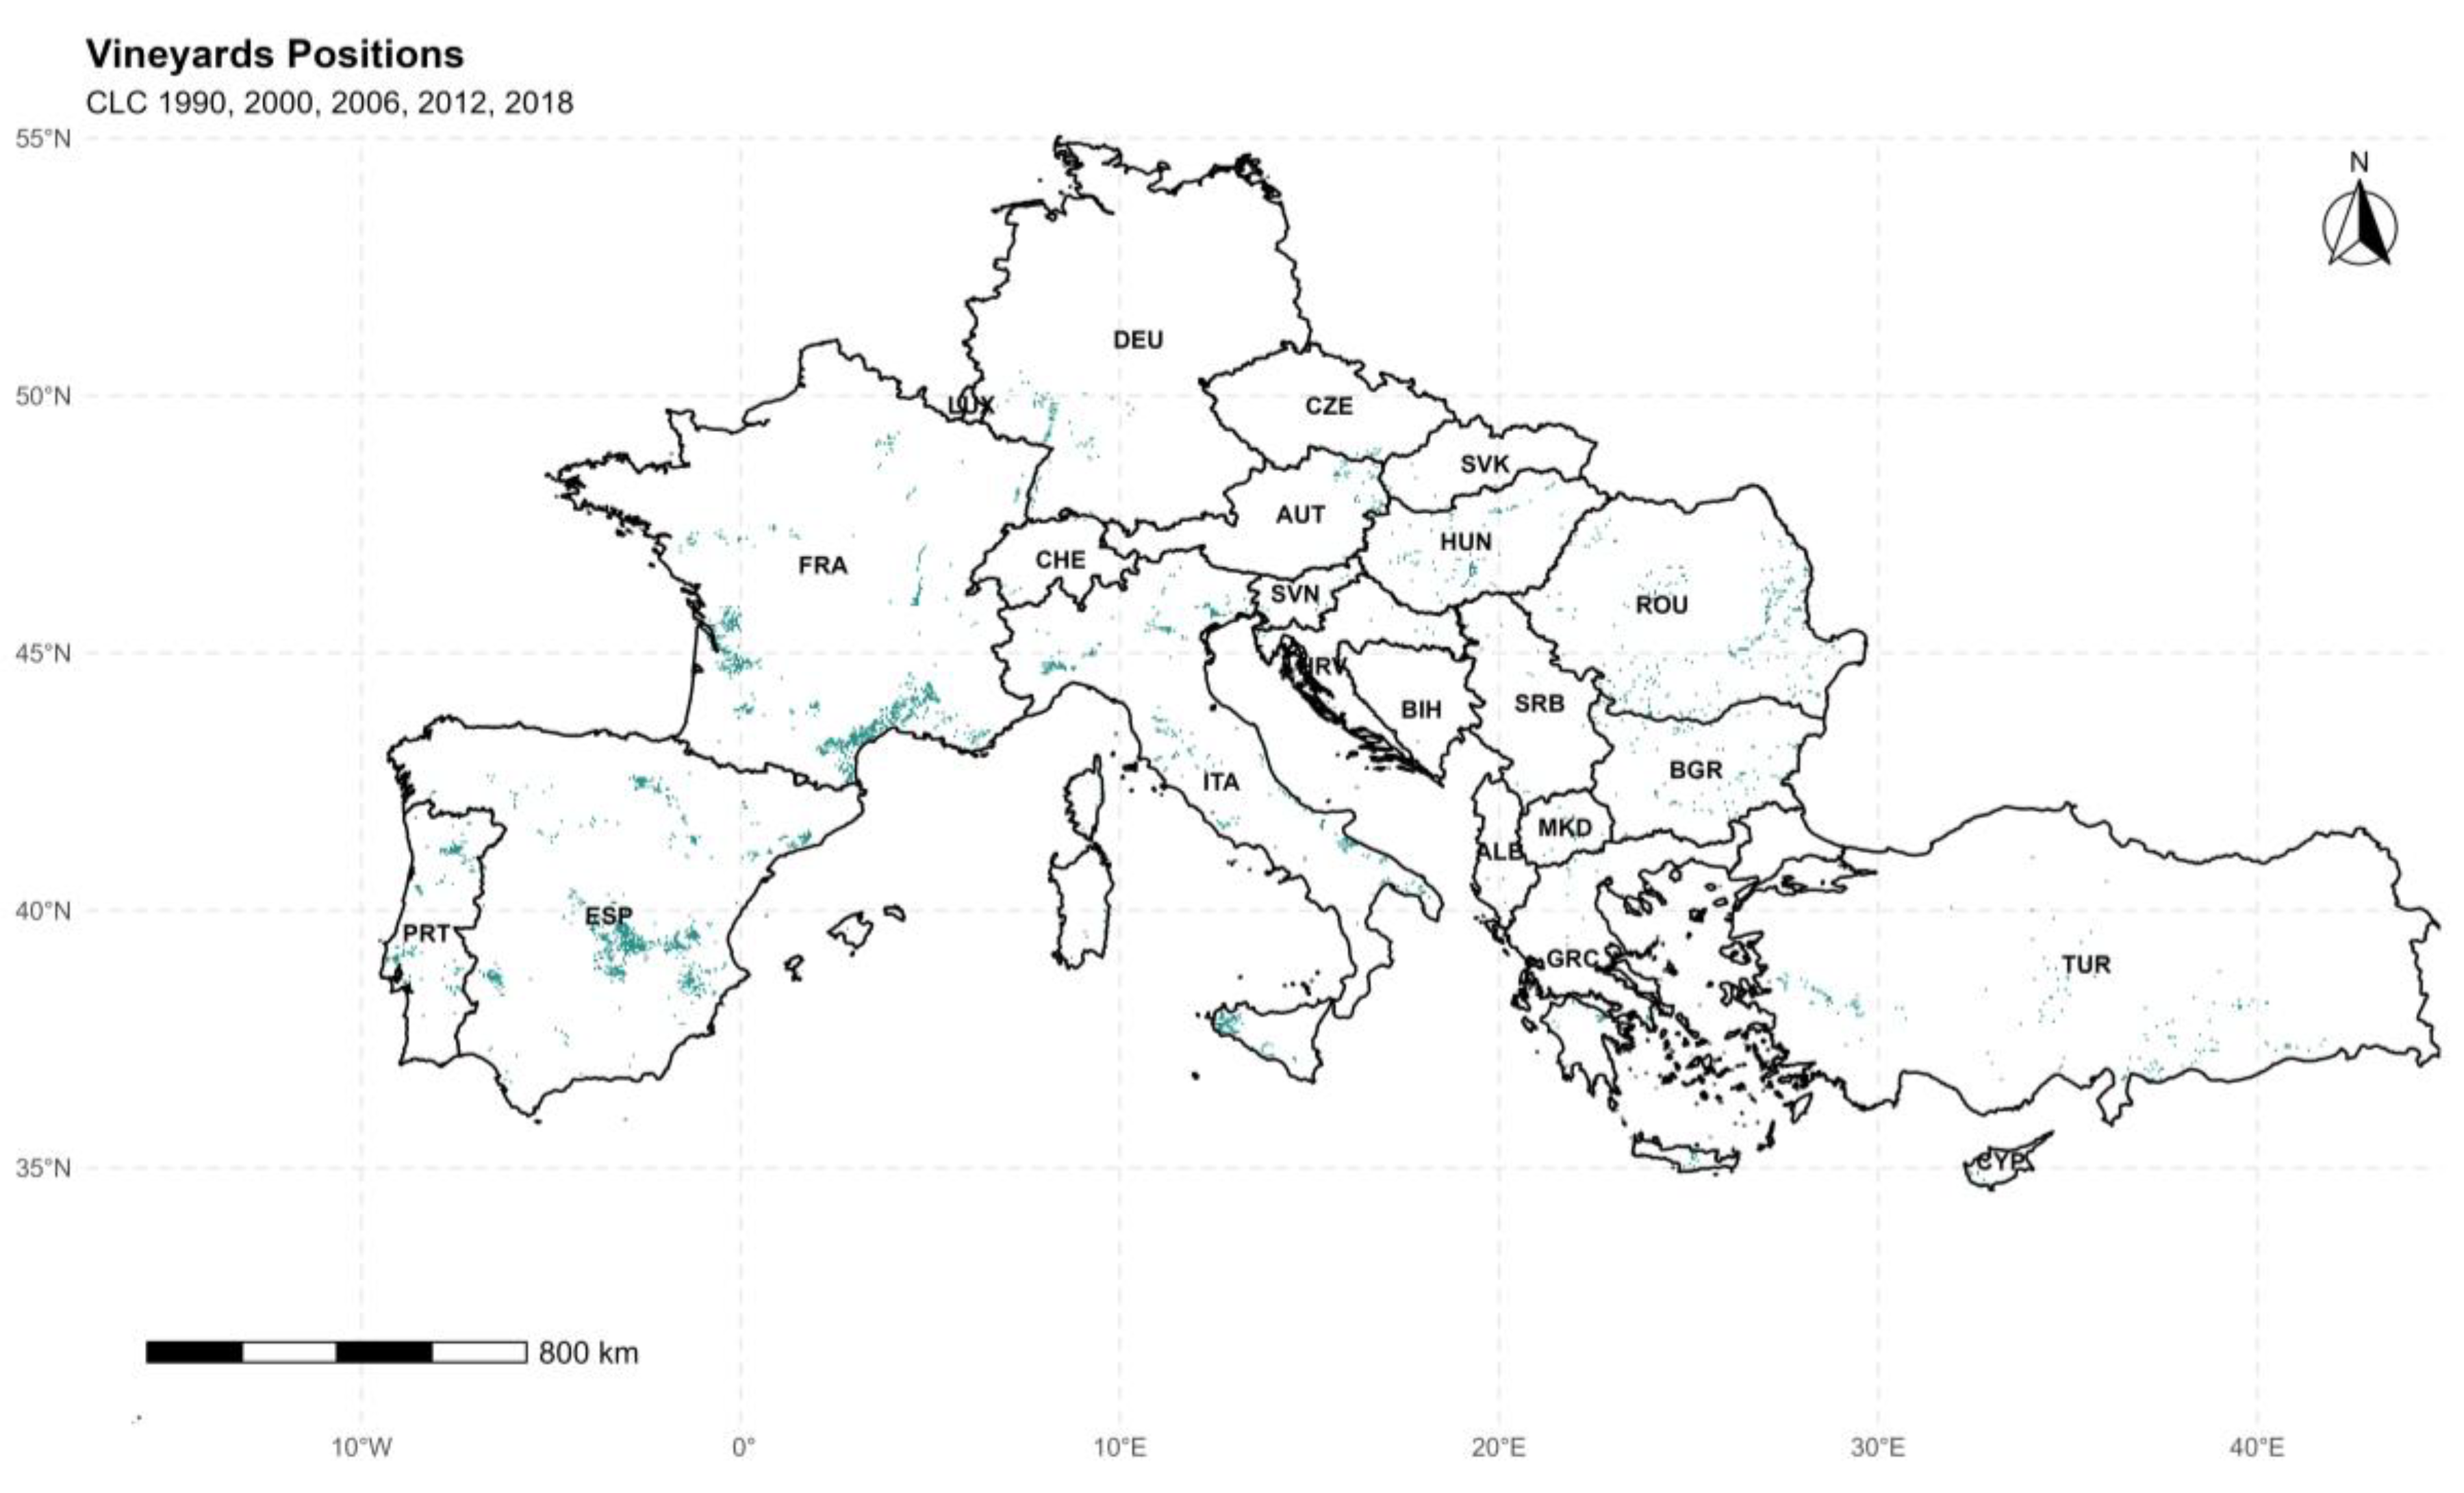
The study area encompasses the European continent, covering the land area between approximately 34° N to 72° N latitude and 25° W to 45° E longitude. Europe hosts some of the world’s most significant olive grove and vineyard regions, concentrated primarily in the Mediterranean Basin but extending northward into Central and Western Europe. The selection of Europe as the study domain is motivated by two converging rationales. First, it encompasses the full gradient of agroclimatic conditions relevant to olive (Olea europaea L.) and grapevine (Vitis vinifera L.) cultivation, from the hot semi-arid conditions of the southern Mediterranean to the cool continental margins where these crops approach their thermal limits. Second, the availability of both a high-resolution reanalysis dataset (ERA5-Land) and a continent-wide land use classification (Corine Land Cover) at comparable spatial scales makes a pan-European analysis methodologically coherent and fully reproducible. The spatial distribution of the two cultivation types across the study domain, as derived from the five CLC reference years, is illustrated in Figure 1 and Figure 2.
Both images show the aggregation of vineyards and olive groves as identified in the Corine Land Cover Dataset across all inspection time periods.

2.3. Method

2.3.1. Growing Degree Days Calculation

The Growing Degree Days (GDD) index quantifies the accumulation of thermal energy above a crop-specific base temperature threshold. It is directly related to the rate of crop development and phenological progression [20,21,24,54]. The canonical formulation applied here is:
GDD = T max - T min 2 - T base
Where Tmax is the daily maximum air temperature (°C), Tmin is the daily minimum air temperature (°C), and Tbase is the crop-specific base temperature below which plant growth is considered negligible. When the mean daily temperature [(Tmax + Tmin) / 2] falls below Tbase, the GDD value for that day is set equal to zero, preventing negative accumulation. The index is accumulated daily over the crop-specific growing season window defined below.

2.3.2. Olive Grove (Olea europaea L.)

For Olea europaea L., the base temperature for GDD accumulation set to Tbase = 7 °C, corresponding to the lower thermal threshold for metabolic activity and flower bud development. The growing period for GDD accumulation was defined from 1 January to 31 May, capturing the critical pre-flowering and flowering phenological window. The thermal threshold considered indicative of climatic suitability for olive flower structure development is 700 GDD units [54]. GDD was computed exclusively over grid cells identified as CLC 223 (olive groves) for each reference year, yielding GDD values that represent the actual thermal environment experienced by registered olive cultivation areas.

2.3.3. Vineyards (Vitis vinifera L.)

For Vitis vinifera L., the GDD calculation follows the widely adopted Winkler Index framework [42,43,59,60]. The base temperature was set to Tbase = 10 °C, and the growing season window spans from 1 April to 31 October, encompassing the entire vegetative cycle from budburst to harvest. A cumulative threshold of 2000 GDD units is widely recognized as the minimum thermal requirement for a climatic region to be considered suitable for grapevine cultivation [51,54]. As with the olive analysis, GDD calculations were restricted to ERA5-Land grid cells classified as CLC 221 (vineyards) for each respective reference year.

2.4. Analysis Approach

We have five CLC datasets according to the years 1990, 2000, 2006, 2012, and 2018. So we count the mean annual GDD for the periods 1985-1995, 1995-2005, 2001-2011, 2007-2017, and 2013-2023. So, every CLC timeframe falls into one of the mean annual GDD periods. For each ERA5-Land grid cell classified as a vineyard (CLC 221) or olive grove (CLC 223) in a given reference year, annual GDD totals were computed using the above equation with the crop-specific parameter. The per-grid-cell GDD values were subsequently aggregated by country to produce the distributional summaries (boxplots, medians, means) presented in the results section, using ISO 3166-1 alpha-3 country codes throughout.
All data processing, GDD calculations, and statistical analyses were performed using the R programming language [58], which has been demonstrated as a highly effective tool for biometeorological and agroclimatic research. The ERA5-Land files were handled with the terra [59] and fst [60] packages. For handling tabular data and making all visualizations, we used the Tidyverse package [61]. The complete data processing pipeline was implemented as a fully automated, reproducible R script. Since the initial data (CLC and ERA5-Land) are openly available, the analytical process is described above, and we provide the “dry code” in the Zenodo repository, the research is fully reproducible.
To assess temporal trends in per-country mean GDD across the five reference years, a linear regression analysis was performed. The coefficient of determination (R2) describes the proportion of GDD variance explained by the temporal trend, and statistical significance was assessed at the p < 0.05 level. The magnitude of the trend was quantified using the slope coefficient (GDD yr−1), which provides an estimate of the rate of change per unit time [34,35]. Results for both cultivations are presented in the results section.
The observed GDD values per cultivation and country are interpreted directly against the canonical thermal thresholds reported in the classical agroclimatic literature (700 GDD for olive, 2,000 GDD for vine). This comparison between the GDD actually experienced by indicated by CLC crop areas and the thresholds derived from earlier agronomic studies constitutes the “reverse agroclimatology” approach of the present manuscript.

3. Results

3.1. Olive Cultivation GDD

The spatial distribution of olive grove (Olea europaea L.) cultivation areas across the study domain, as derived from the Corine Land Cover (CLC) datasets for the five reference years, is illustrated in Figure 1. Olive cultivation is predominantly concentrated in the Iberian Peninsula (Spain and Portugal), the Italian Peninsula, the Dalmatian coast of Croatia, mainland Greece and its island complexes, and the western coasts of Turkey. The northernmost expansion of CLC-mapped olive areas is observed in Slovenia (SVN), which first appears in the 2012 dataset, reflecting a gradual poleward shift in cultivation boundaries consistent with rising temperatures.
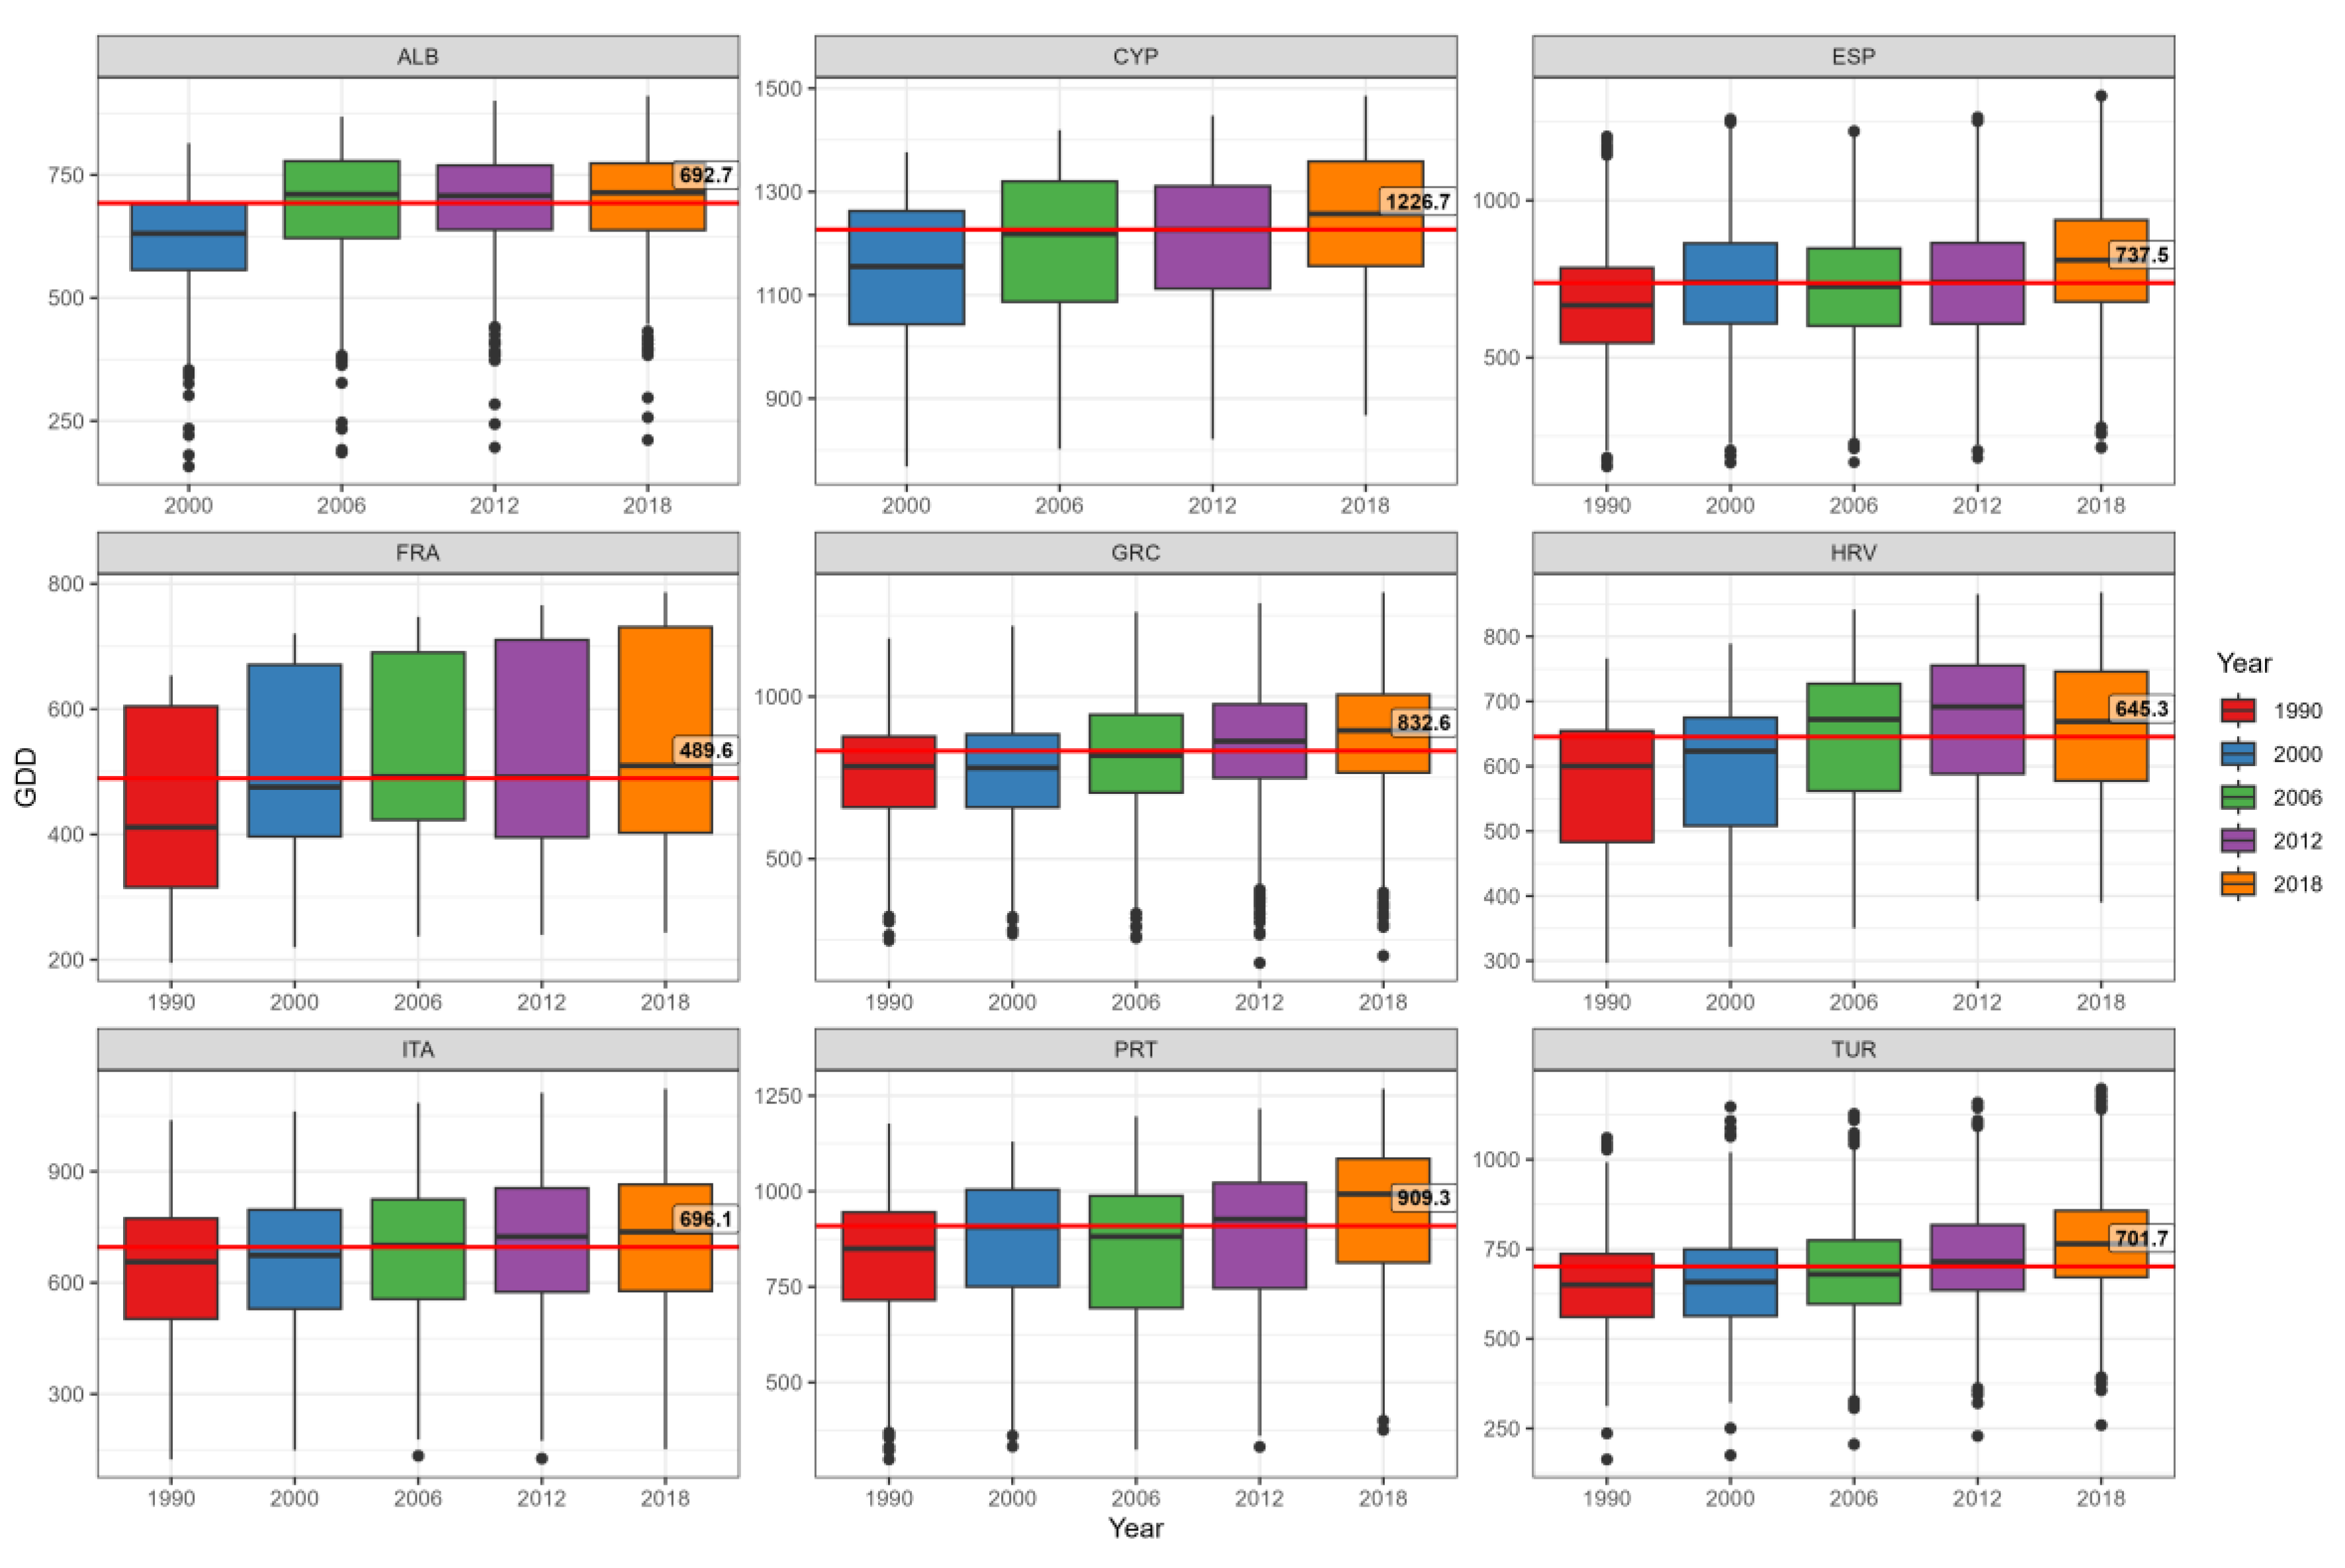
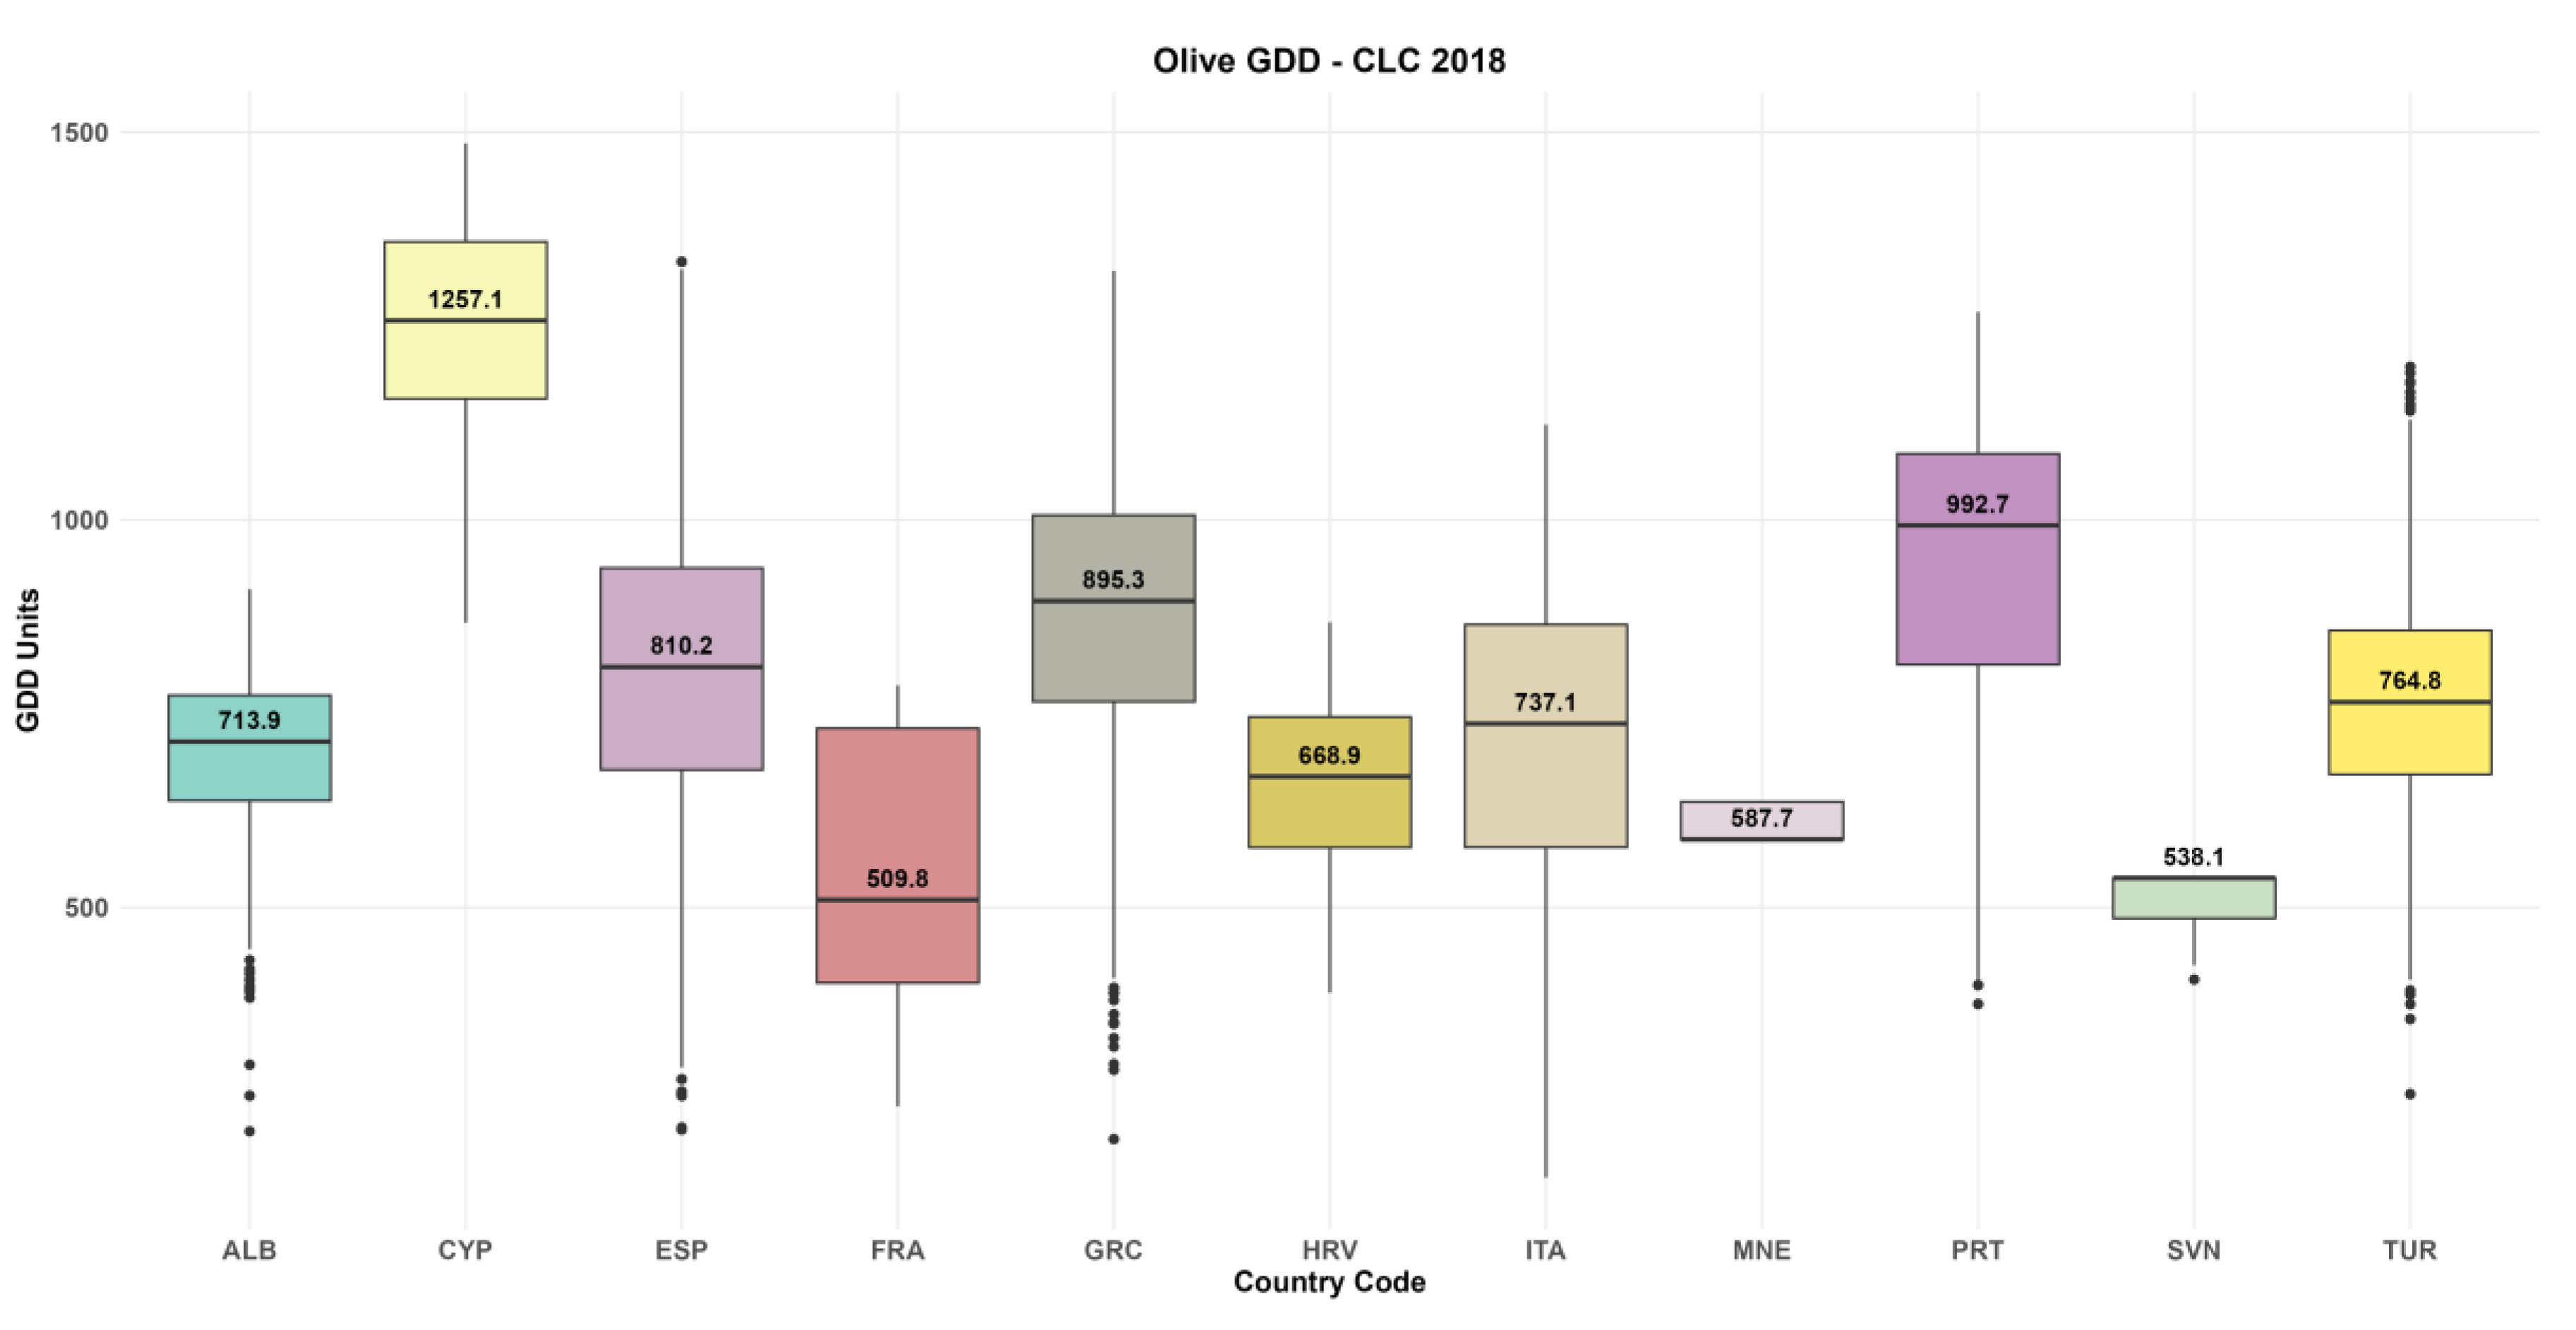
Figure 3 presents the multi-period boxplot overview of GDD for olive cultivation across all nine studied Mediterranean countries for the reference years 1990 to 2018 (all figures are available in larger size in the Zenodo repository). A clear and consistent positive trend in GDD accumulation is evident across all countries throughout the study period, with the most recent reference year (2018) recording the median values in every country. Cyprus (CYP) stands as the dominant country in terms of thermal accumulation in all periods, reaching a median of 1,257.1 GDD units, followed by Portugal (PRT: 992.7) and Greece (GRC: 895.3). France (FRA) and Slovenia (SVN) consistently record the lowest median GDD values (509.8 and 538.1 GDD units, respectively, reflecting the marginal thermal conditions for olive cultivation at the northern edge of its geographic range.
Beyond the medians, the multi-period overview reveals important contrasts in within-country thermal variability. Greece exhibits the widest overall spread across all periods, a consequence of the exceptional geographic diversity of its registered olive areas, which encompass both mainland continental sites and thermally distinct island environments across the Aegean and Ionian seas. Spain displays a similarly wide interquartile range, driven by the latitudinal and altitudinal heterogeneity of its olive-growing regions. In contrast, Cyprus and Montenegro show the narrowest distributions, reflecting the geographic compactness and topographic uniformity of their registered olive grove areas. Across all countries, the progressive upward displacement of the entire box — including both the lower and upper quartiles — between 1990 and 2018 confirms that the observed warming trend affects the full distributional range of registered olive cultivation sites, rather than being driven solely by thermal extremes at individual grid cells.
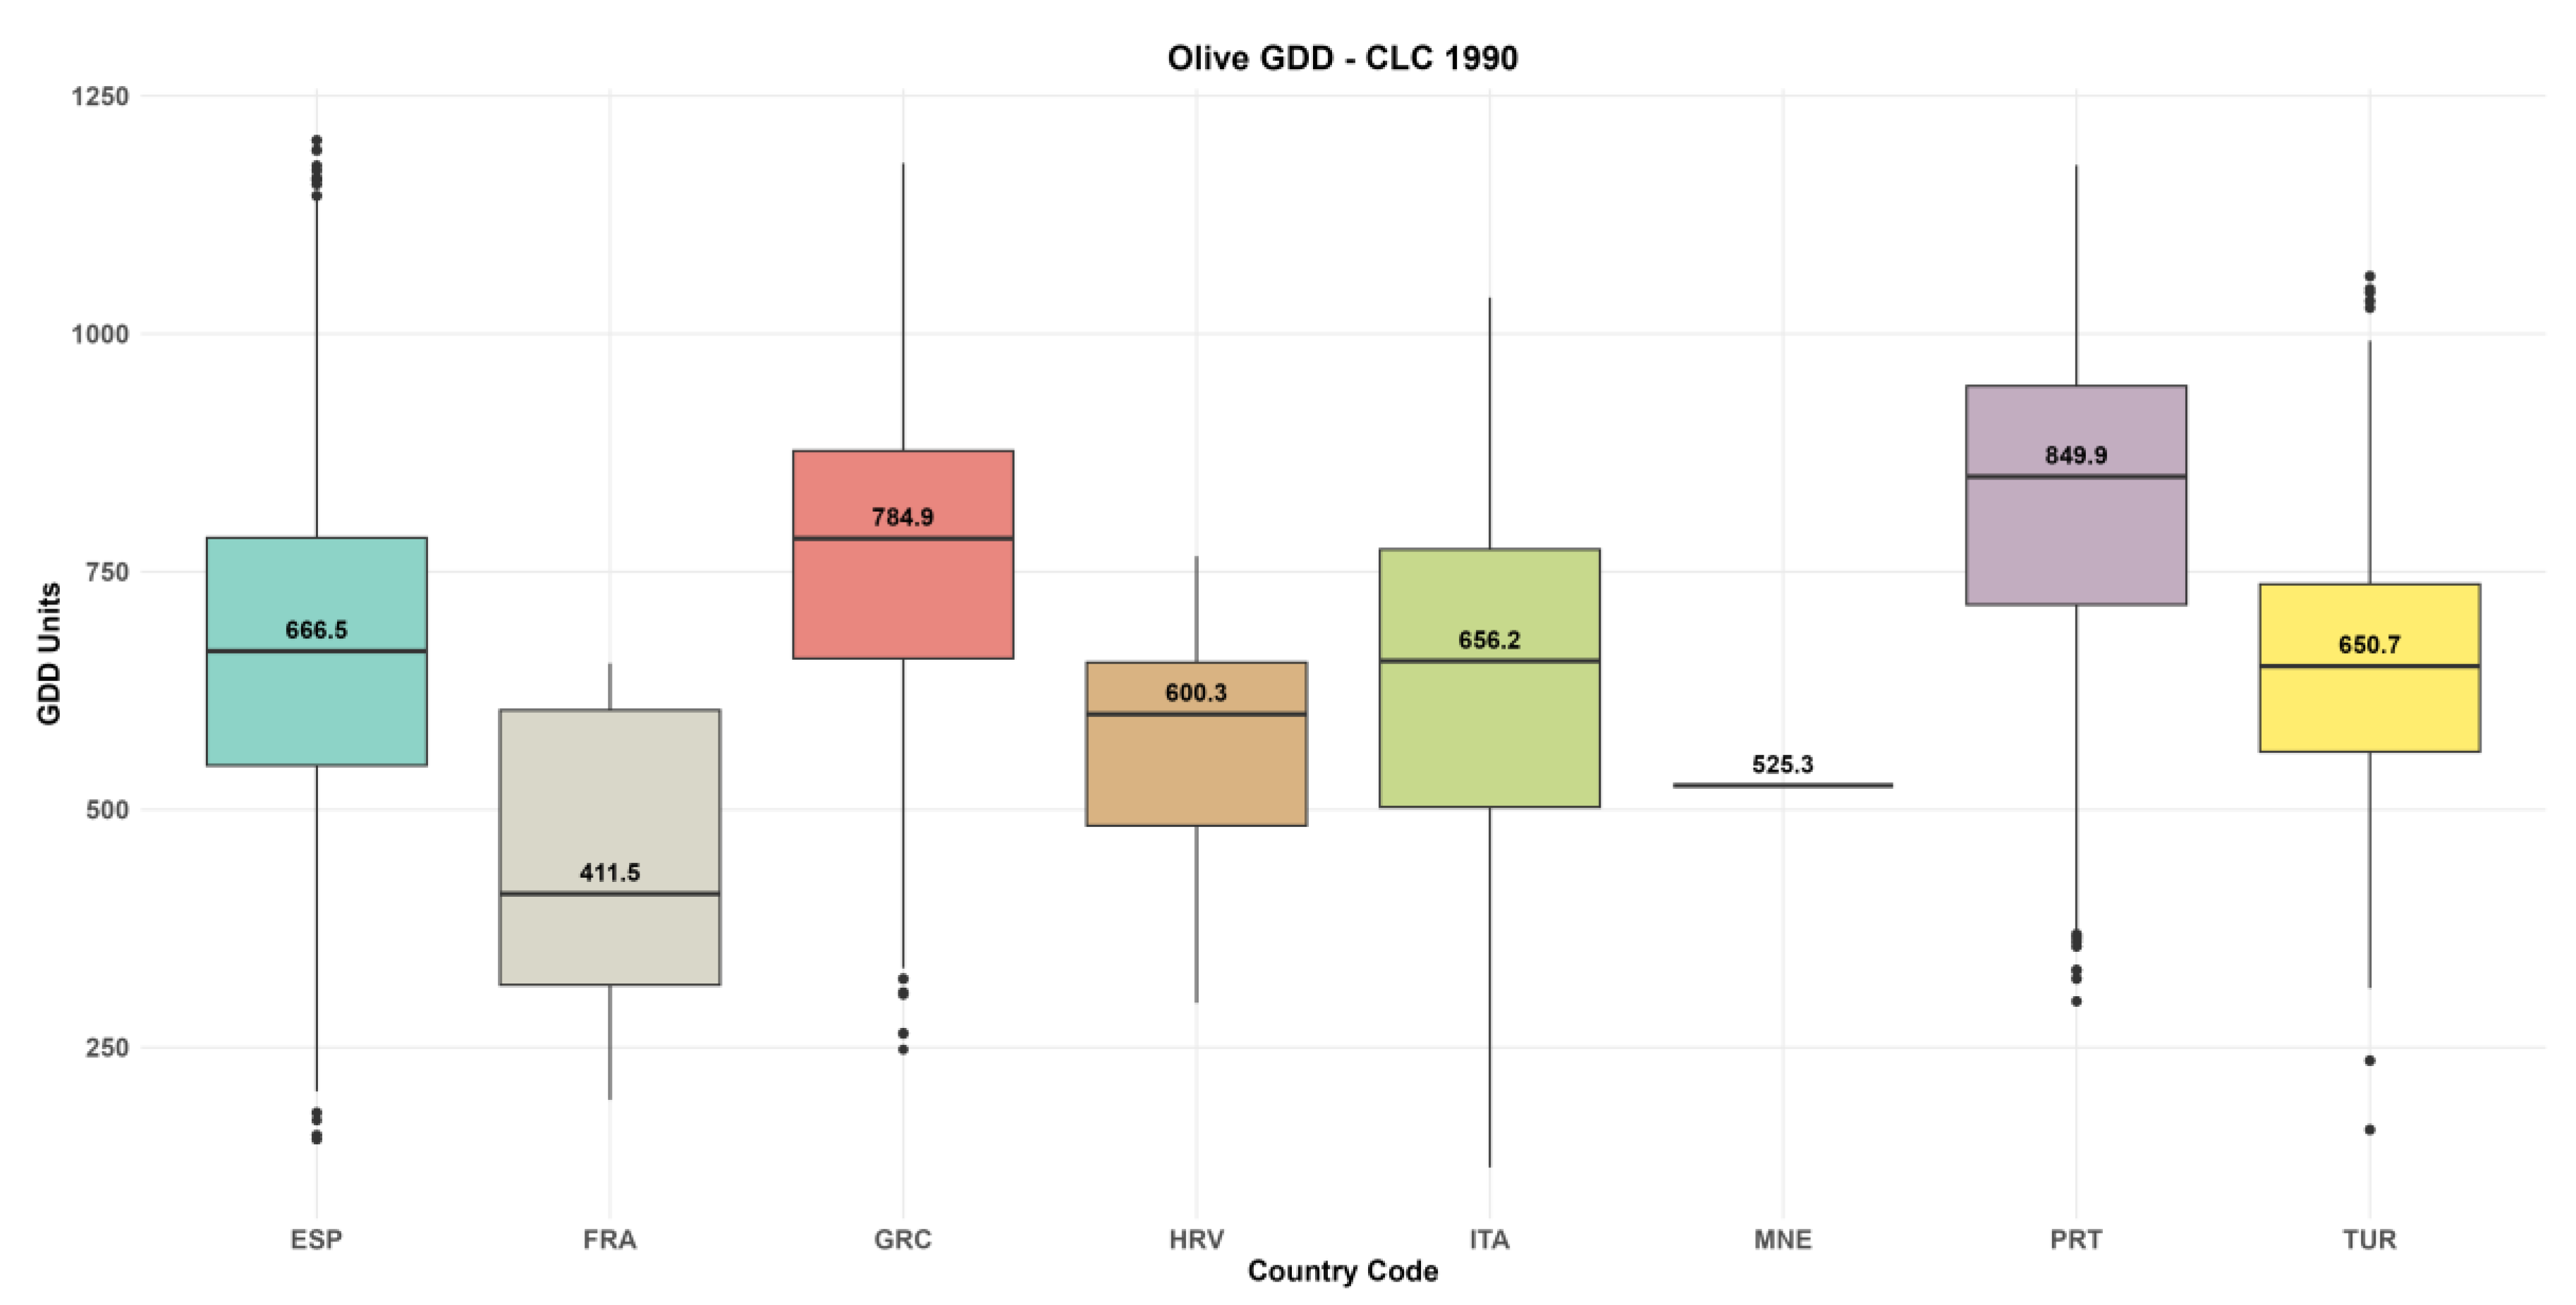
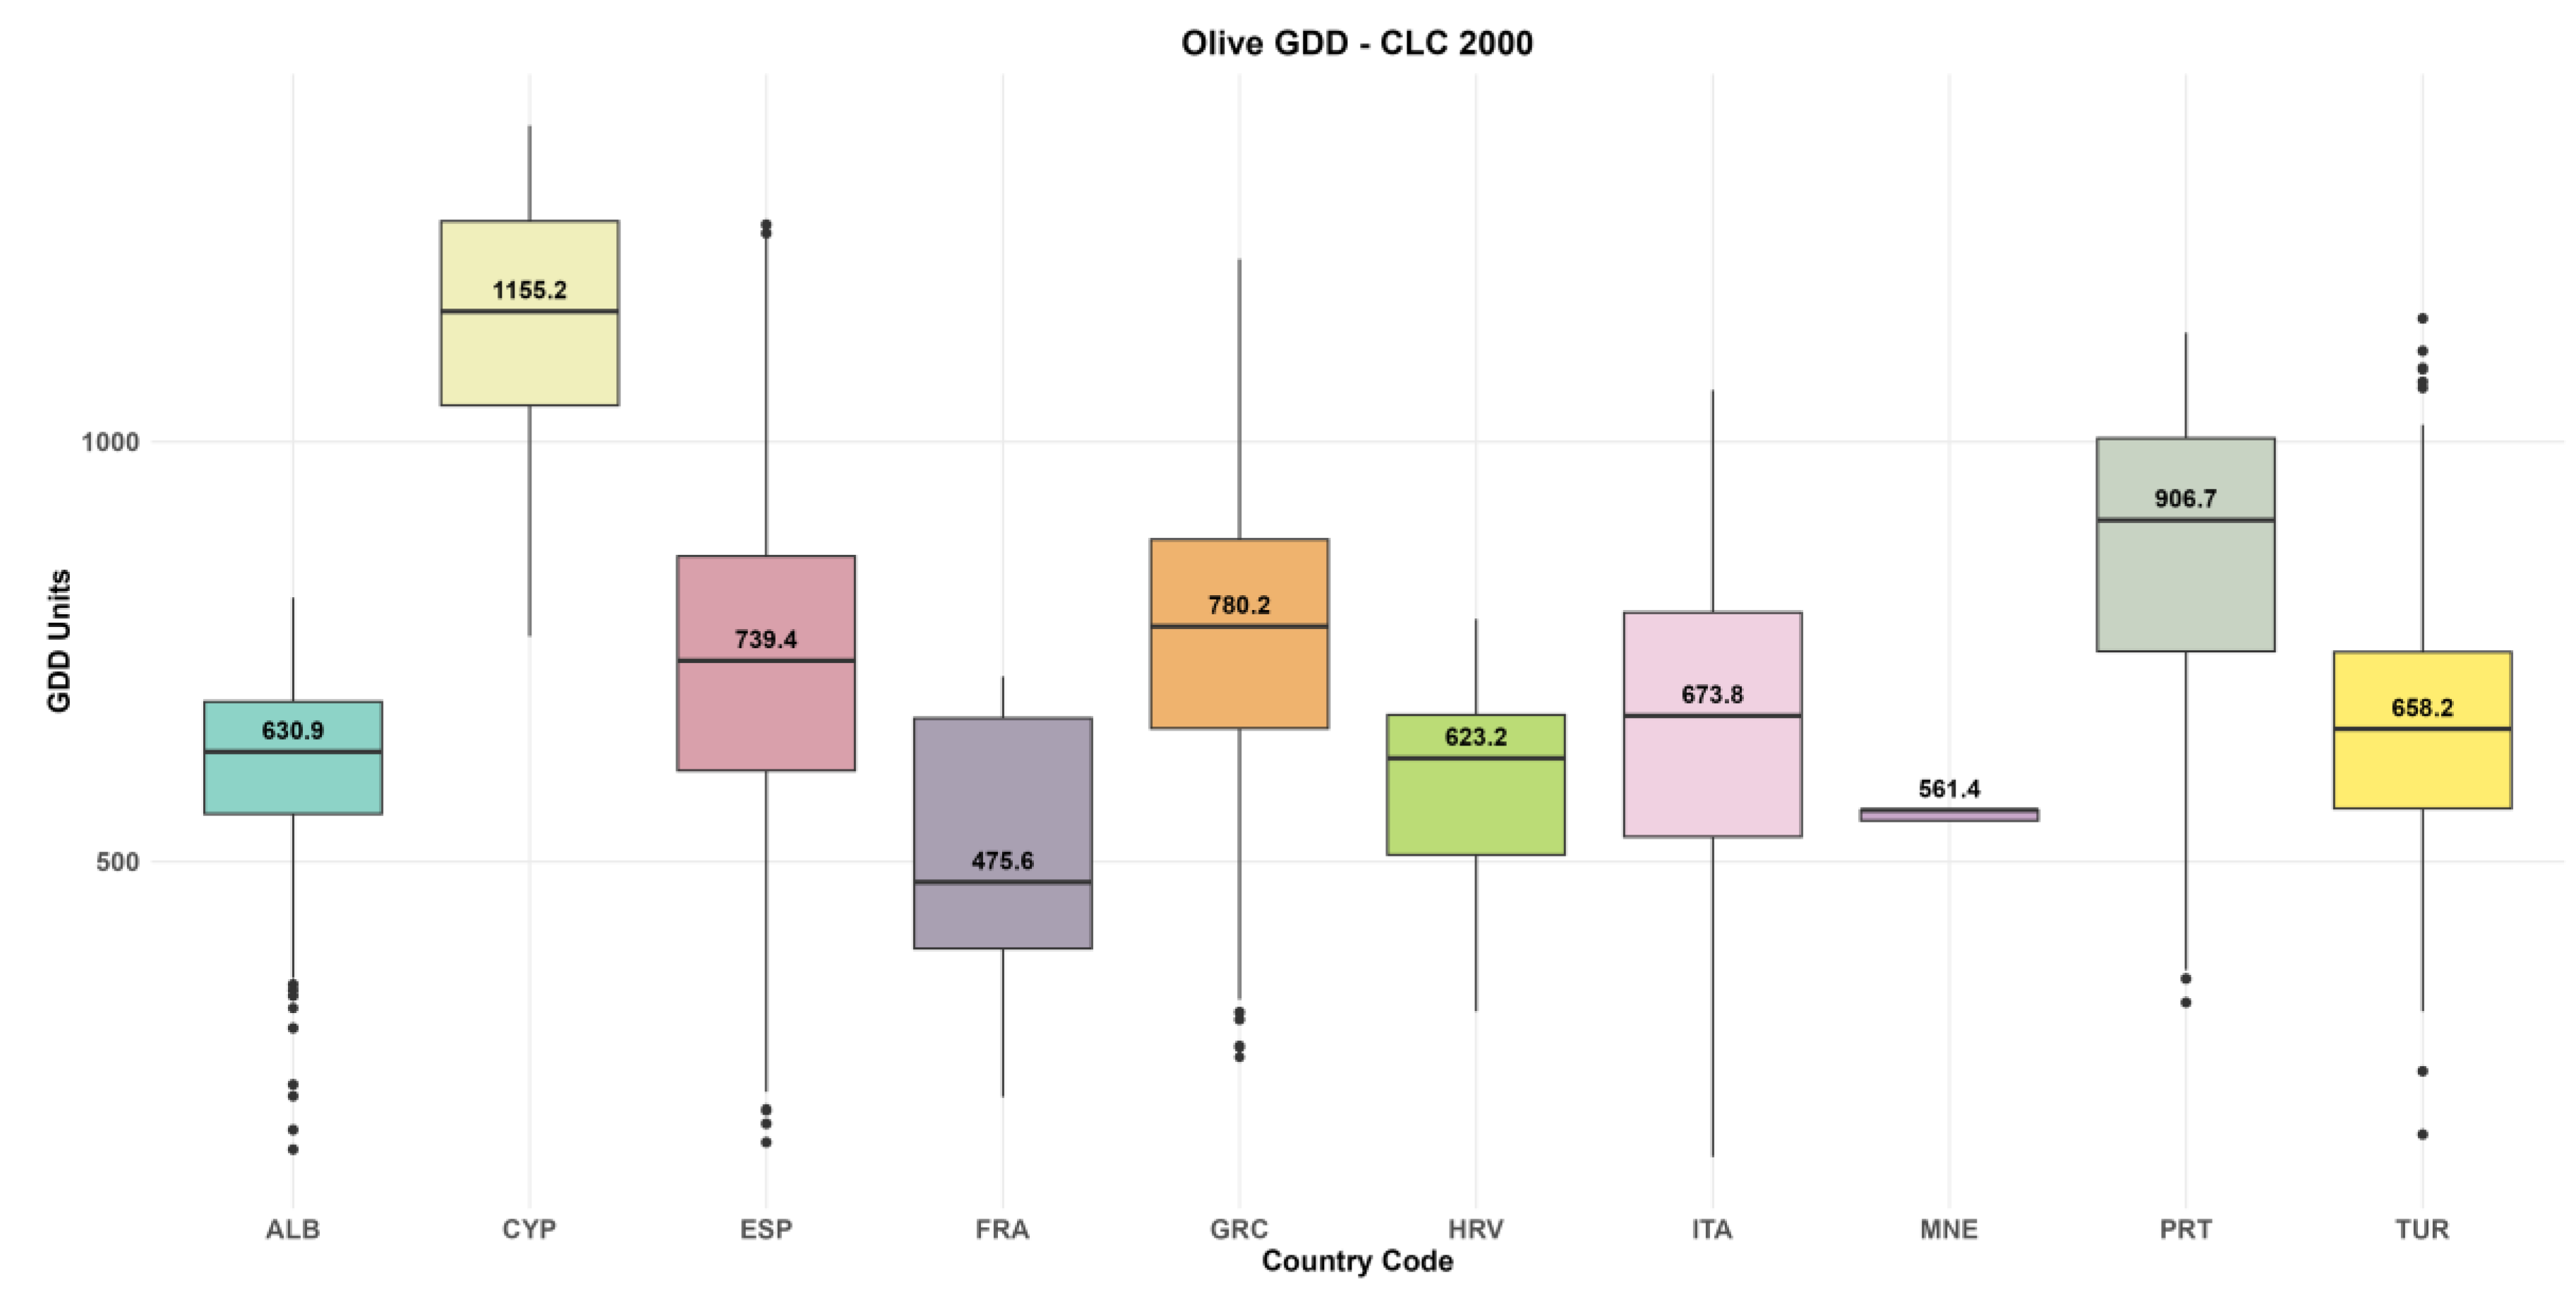
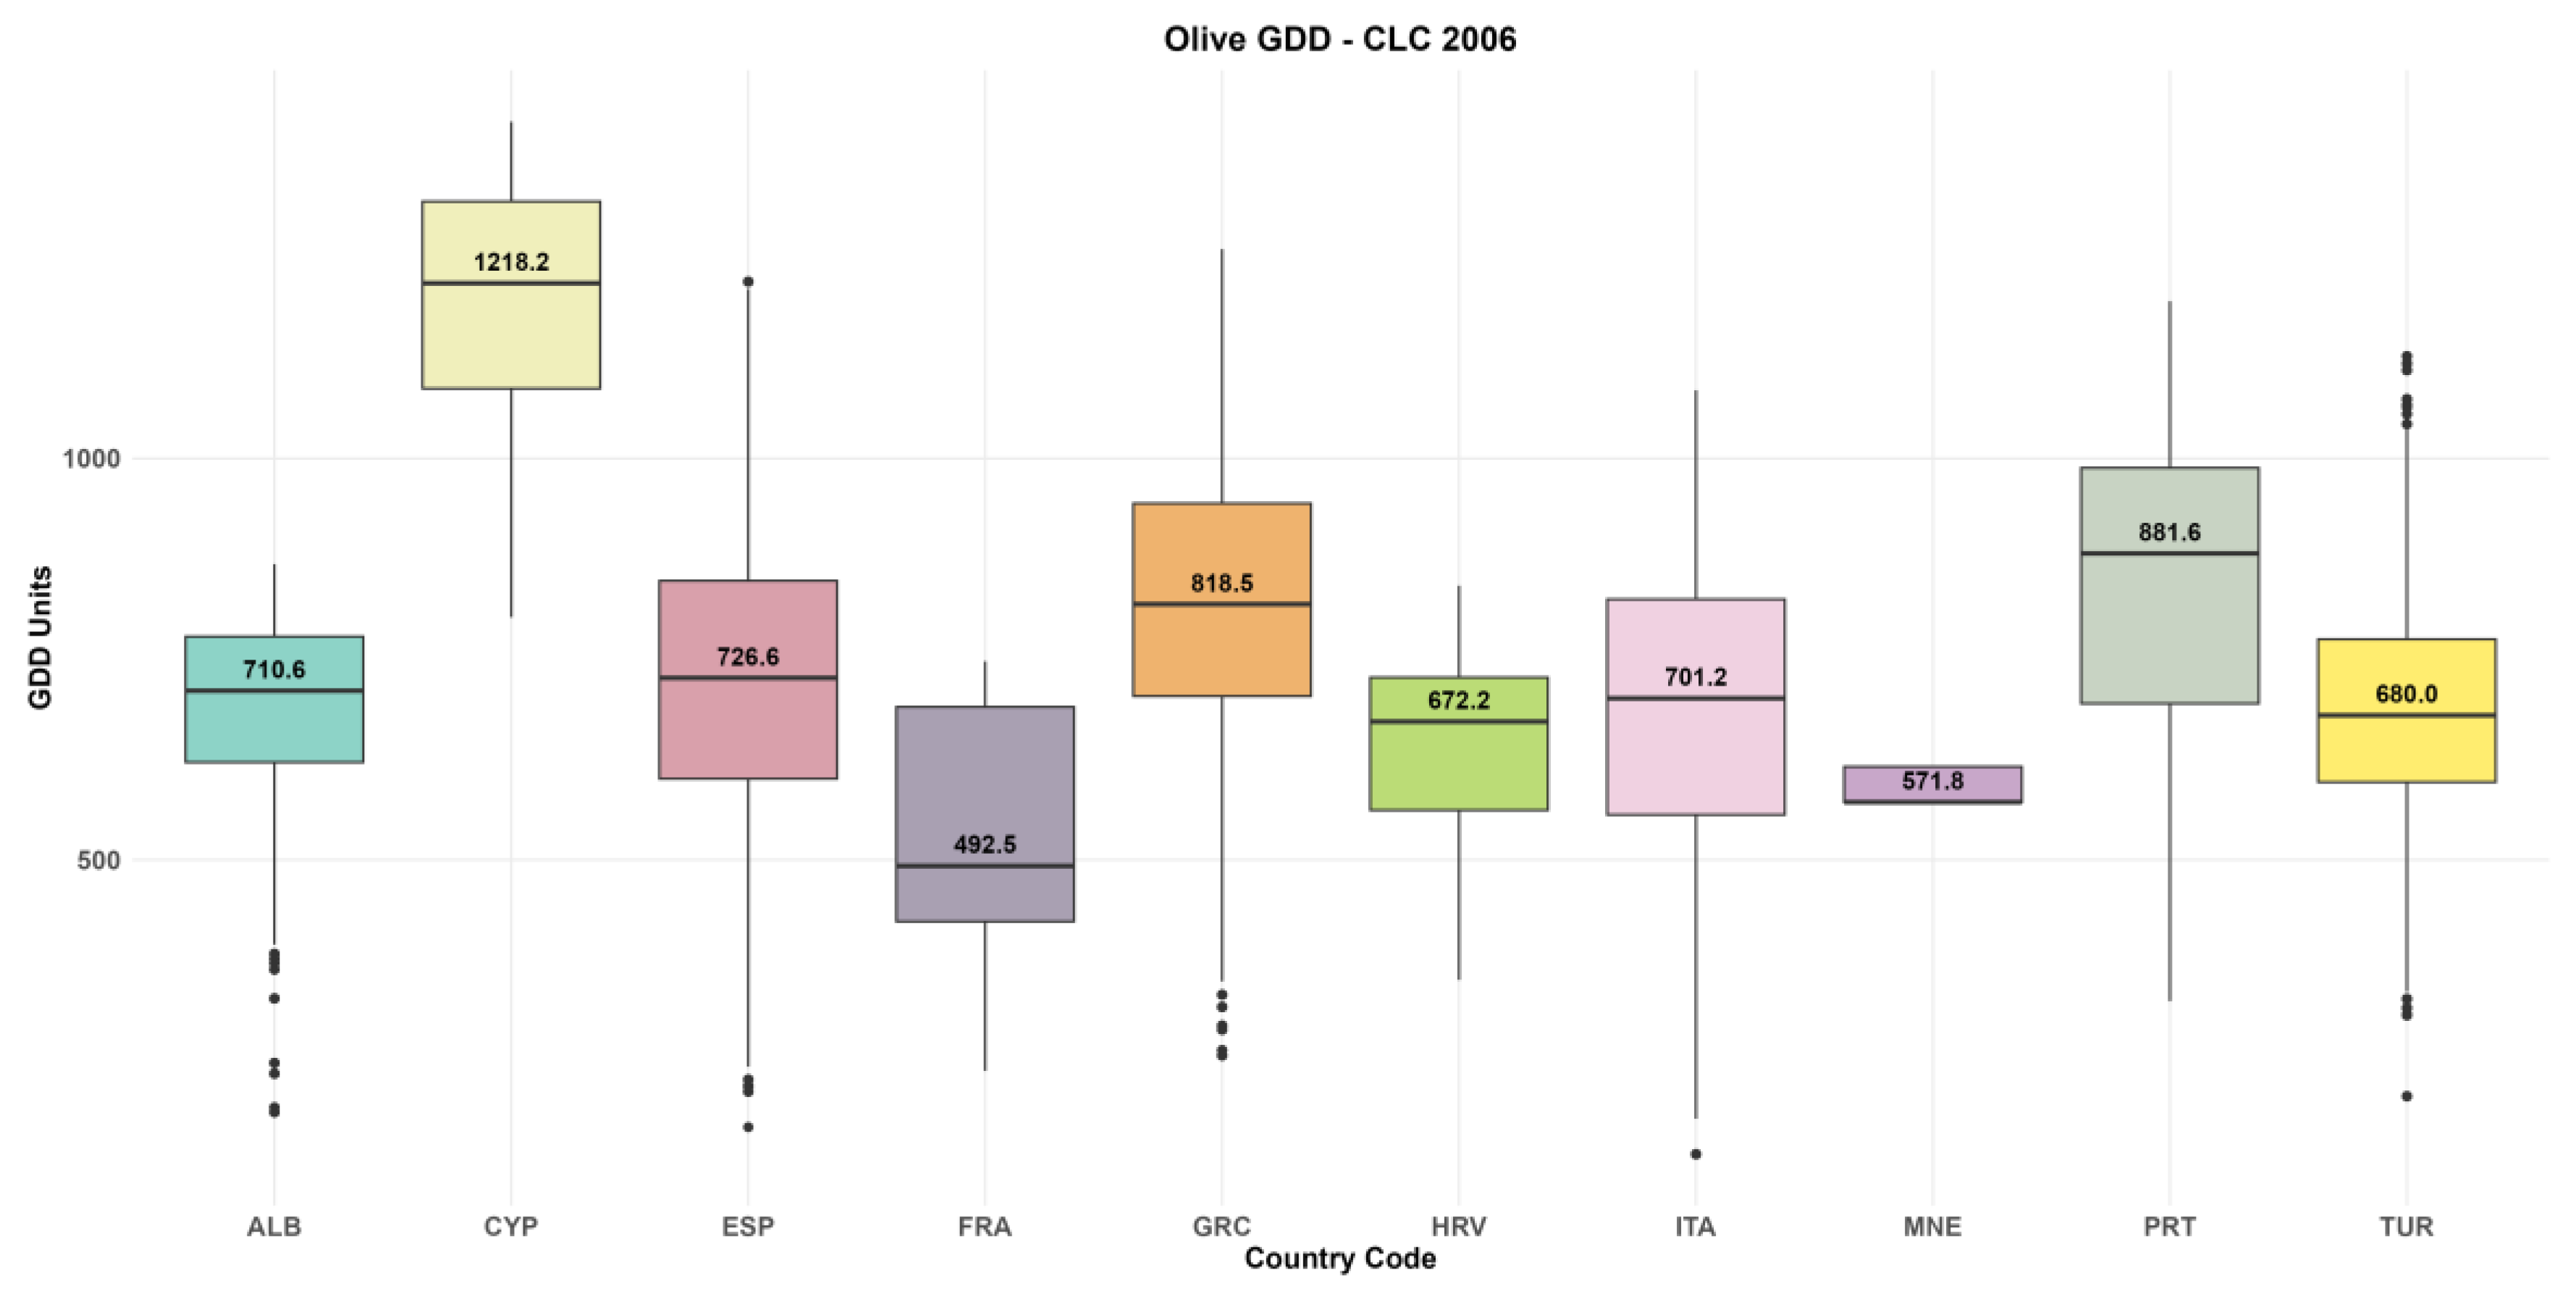
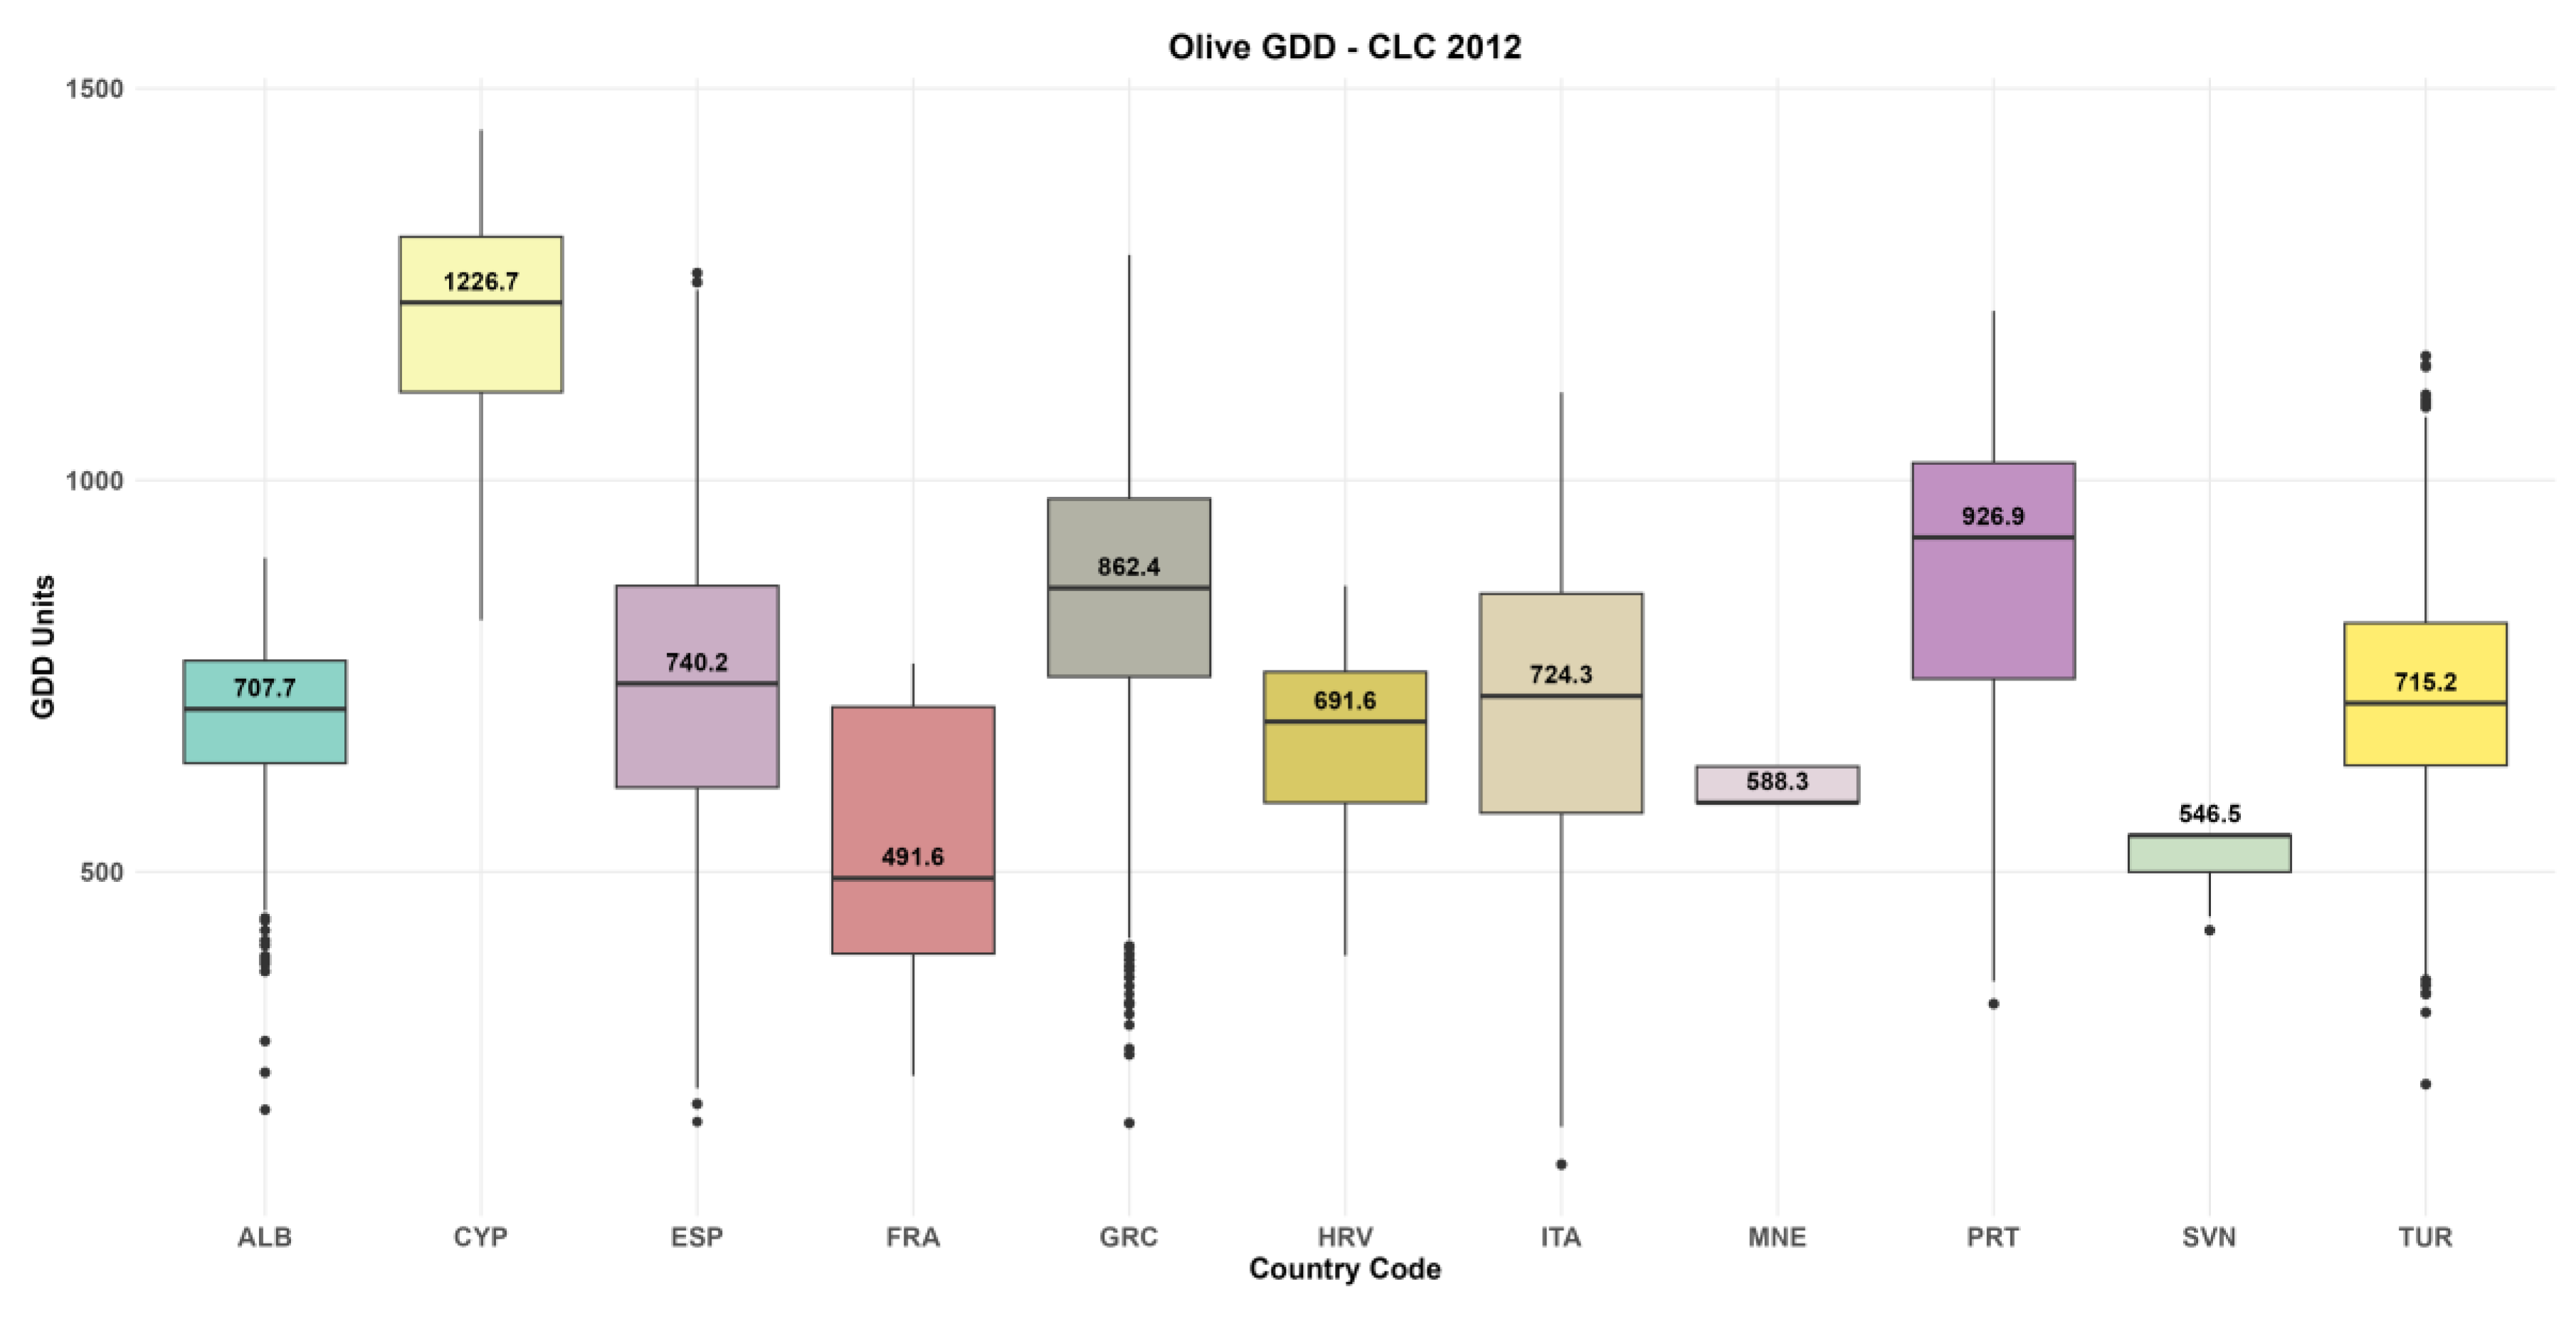
The annual boxplots (Figure 4, Figure 5, Figure 6, Figure 7 and Figure 8) provide a more detailed view of the progressive evolution of olive GDD across the study period. In 1990 (Figure 4), the dataset covered eight countries, with Portugal (PRT: 849.9) and Greece (GRC: 784.9) recording the highest median GDD values, while France (FRA: 411.5) and Montenegro (MNE: 525.3) registered the lowest. By 2000 (Figure 5), the study area expanded to ten countries with the addition of Albania (ALB: 630.9) and Cyprus (CYP: 1155.2), the latter recording values nearly double those of the next highest country (Portugal: 906.7), emphasizing the extreme thermal environment of Mediterranean island conditions. The 2006 reference year (Figure 6) shows a general upward shift in GDD medians across all countries relative to 2000, with Cyprus maintaining its leading position (1218.2 GDD units). The 2012 boxplot (Figure 7) is notable for the first appearance of Slovenia (SVN: 546.5), marking the northward expansion of CLC-mapped olive cultivation. The most recent period, 2018 (Figure 8), consolidates this positive trend, with all eleven countries recording their highest GDD medians of the entire study period. Upper whiskers and outlier points visible in the 2018 distributions of Greece, Spain, and Turkey indicate individual ERA5-Land grid cells experiencing exceptionally high GDD accumulation, corresponding to thermally extreme micro-regions within each country’s olive cultivation area. The overall upward displacement of the entire boxplot — including lower whiskers — relative to 1990 confirms that the observed warming trend is not confined to the thermal extremes of the distribution but represents a broad-based shift in the thermal environment experienced by registered olive cultivation sites across the study area.
Figure 4 presents the baseline thermal conditions for olive cultivation across the eight countries where oliviculture was located by CLC in 1990. Portugal (PRT: 849.9) and Greece (GRC: 784.9) record the highest medians, both exceeding the threshold of 700 GDD units, while France (FRA: 411.5) and Montenegro (MNE: 525.3) remain below it. Greece displays a markedly wide interquartile range, followed by Spain, which shows a similarly broad distribution.
In contrast, Portugal presents a comparatively compact box around its high median, suggesting more homogeneous thermal conditions. Italy and Croatia exhibit intermediate GDD spread, while Montenegro and Turkey have the narrowest interquartile ranges in this period, reflecting the geographically limited and thermally uniform character of their 1990 CLC-mapped olive extent.
Figure 5 marks the entry of two new countries into the dataset: Albania (ALB: 630.9) and Cyprus (CYP: 1155.2). Cyprus immediately dominates the figure with a median nearly double that of the next highest country (Portugal: 906.7 GDD units), underlining the extreme thermal loading of this island environment. Albania enters with a compact box centered around 630.9 GDD units, consistent with the coastal lowland concentration of its olive cultivation along the Adriatic.
Greece’s widespread persistence from 1990 widens further in this period, while Portugal maintains its relatively tight distribution around a high median, confirming that Portuguese olive sites experience consistently favorable and spatially homogeneous thermal conditions. Spain’s box widens relative to 1990, a trend that will continue in subsequent periods as CLC mapping captures an increasingly diverse set of cultivation zones. All countries now exceed the 700 GDD threshold at their median level, with Cyprus far surpassing it and France approaching it from below.
Figure 6 shows a general upward shift in GDD medians across all 10 countries relative to 2000. Cyprus retains its leading position with a median of 1218.2 GDD units. Spain emerges in this period. This characteristic probably reflects the expansion of its CLC-mapped olive areas into more thermally heterogeneous areas across the country’s territory. Italy similarly maintains a broad distribution, driven by the peninsular north-to-south gradient.
Albania’s box narrows slightly relative to 2000, suggesting that its coastal olive cultivation cluster has stabilized as a thermally coherent unit within this period. France’s median advances toward 492.5 GDD units, approaching but not yet reaching the 700-unit threshold. It is a noteworthy finding because we have observed olive groves with a median of more than 200 GDD units below the required threshold.
Figure 7 is the most structurally distinct of the boxplots due to the first appearance of Slovenia (SVN: 546.5 GDD units), introducing an eleventh country and marking a geographically significant northward extension of CLC-mapped olive cultivation. Slovenia’s box is the narrowest in the panel, with a very tight interquartile range reflecting the geographically confined character of its olive areas in the thermally ameliorated zone. Medians continue their upward trajectory across all other countries compared to 2006, with Cyprus (1226.7), Portugal (926.9), and Greece (862.4) leading the ranking. Greece’s interquartile range remains among the widest, sustained by the persistent contrast between its island and mainland olive environments.
Turkey’s boxplot widens noticeably in this period compared to previous years, indicating that CLC-mapped olive areas are expanding into more thermally diverse regions in Turkish territory. Croatia’s median advances to 691.6 GDD units, approaching the 700 GDD threshold, while its relatively compact box confirms that Dalmatian coastal conditions dominate the thermal signature of its registered olive sites.
Figure 8 represents the thermal state of European olive cultivation at the most recent reference year and consolidates the positive trends observed across the full study period. All eleven countries record their highest median GDD values of the extracted data, with Cyprus (1257.1), Portugal (992.7), and Greece (895.3) maintaining their positions at the top of the ranking. The 2018 boxplot is particularly notable for the emergence of high outlier values and extended upper whiskers in Greece, Spain, and Turkey, pointing to individual ERA5-Land grid cells in thermally extreme micro-regions — probably likely low-elevation island sites in Greece and southern Andalusia in Spain — that are accumulating GDD well above the country median. The width of Spain’s boxplot interquartile range reaches its maximum across the study period in 2018, reflecting continued geographic diversification of its olive cultivation footprint.
Slovenia’s second appearance, with a median of 538.1 GDD units, confirms the permanence of its northernmost olive cultivation zone and a slight decrease relative to 2012, likely reflecting inter-annual climate variability rather than a structural cooling signal, given the very limited areal extent of its olive areas. The overall comparison of the 2018 panel with Figure 4 (1990) shows that every country’s entire box structure — including the lower whisker — has shifted upward, confirming that the warming signal documented in Table 1 is not driven by the upper tail alone but represents a broad-based increase in the thermal conditions experienced by all registered olive cultivation sites.
The trend analysis presented in Table 1 confirms the statistical significance of these observations. Among the countries with sufficient temporal coverage, linear regression analysis identifies statistically significant positive trends (p < 0.05) in Spain (ESP), France (FRA), Greece (GRC), Italy (ITA), Montenegro (MNE), Portugal (PRT), and Turkey (TUR). The slope estimator reveals that the highest rates of GDD increase are recorded in Portugal (4.44 GDD yr−1) and Spain (4.29 GDD yr−1), while Montenegro (2.30 GDD yr−1) exhibits the most moderate rate of change. Croatia (HRV) and Albania (ALB) show positive but non-significant trends. At the same time, Cyprus (CYP) also does not reach the significance threshold (p < 0.05), likely reflecting a high-thermal baseline with already elevated GDD accumulation across all periods. The mean GDD across all periods ranges from 476.2 in France to 1214.3 in Cyprus, highlighting the strong latitudinal and maritime gradient in olive thermal conditions across the Mediterranean.

3.2. Viticulture GDD

The spatial distribution of vineyard (Vitis vinifera L.) cultivation areas is presented in Figure 2. Compared to the olive cultivation map, the vineyard distribution covers a substantially broader geographic domain, extending from the Mediterranean basin northward into central Europe, including Germany (DEU), the Czech Republic (CZE), Slovakia (SVK), Austria (AUT), Hungary (HUN), Romania (ROU), and Switzerland (CHE). The highest densities of vineyard polygons are concentrated in Spain, France, Italy, and the Balkans. At the same time, the central European countries show scattered but identifiable vineyard clusters, particularly along river valleys where thermal conditions are more favorable.
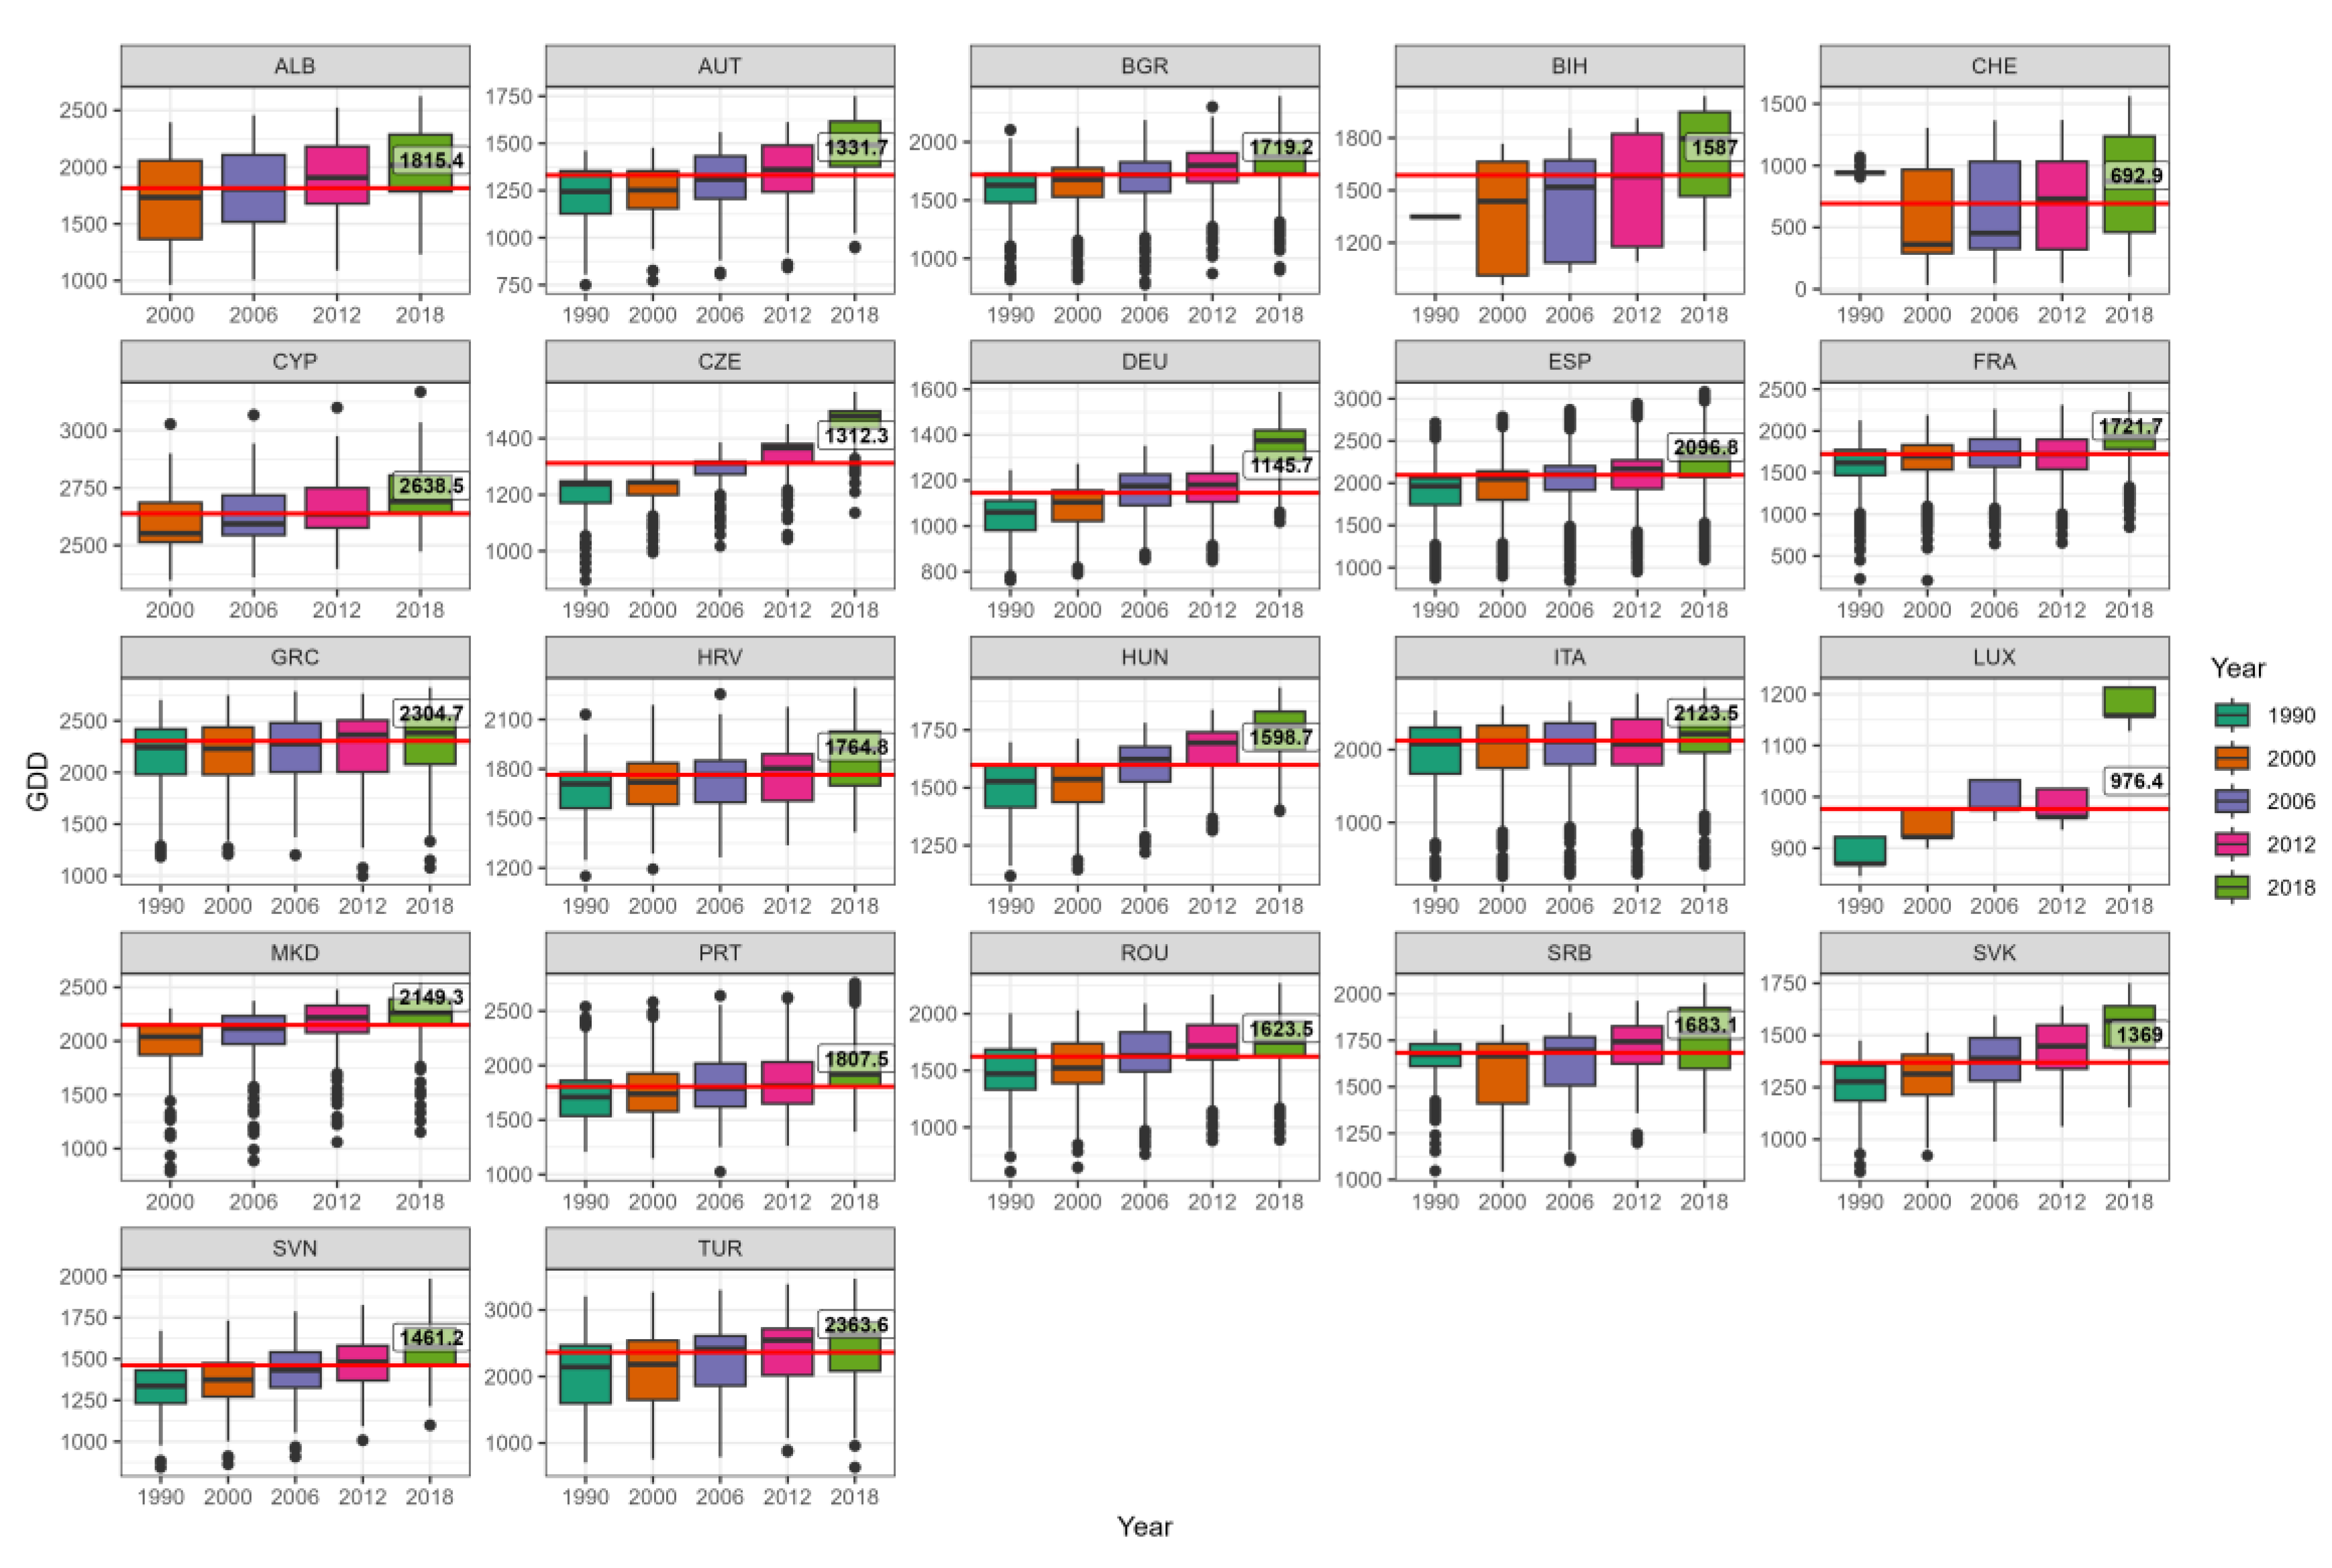
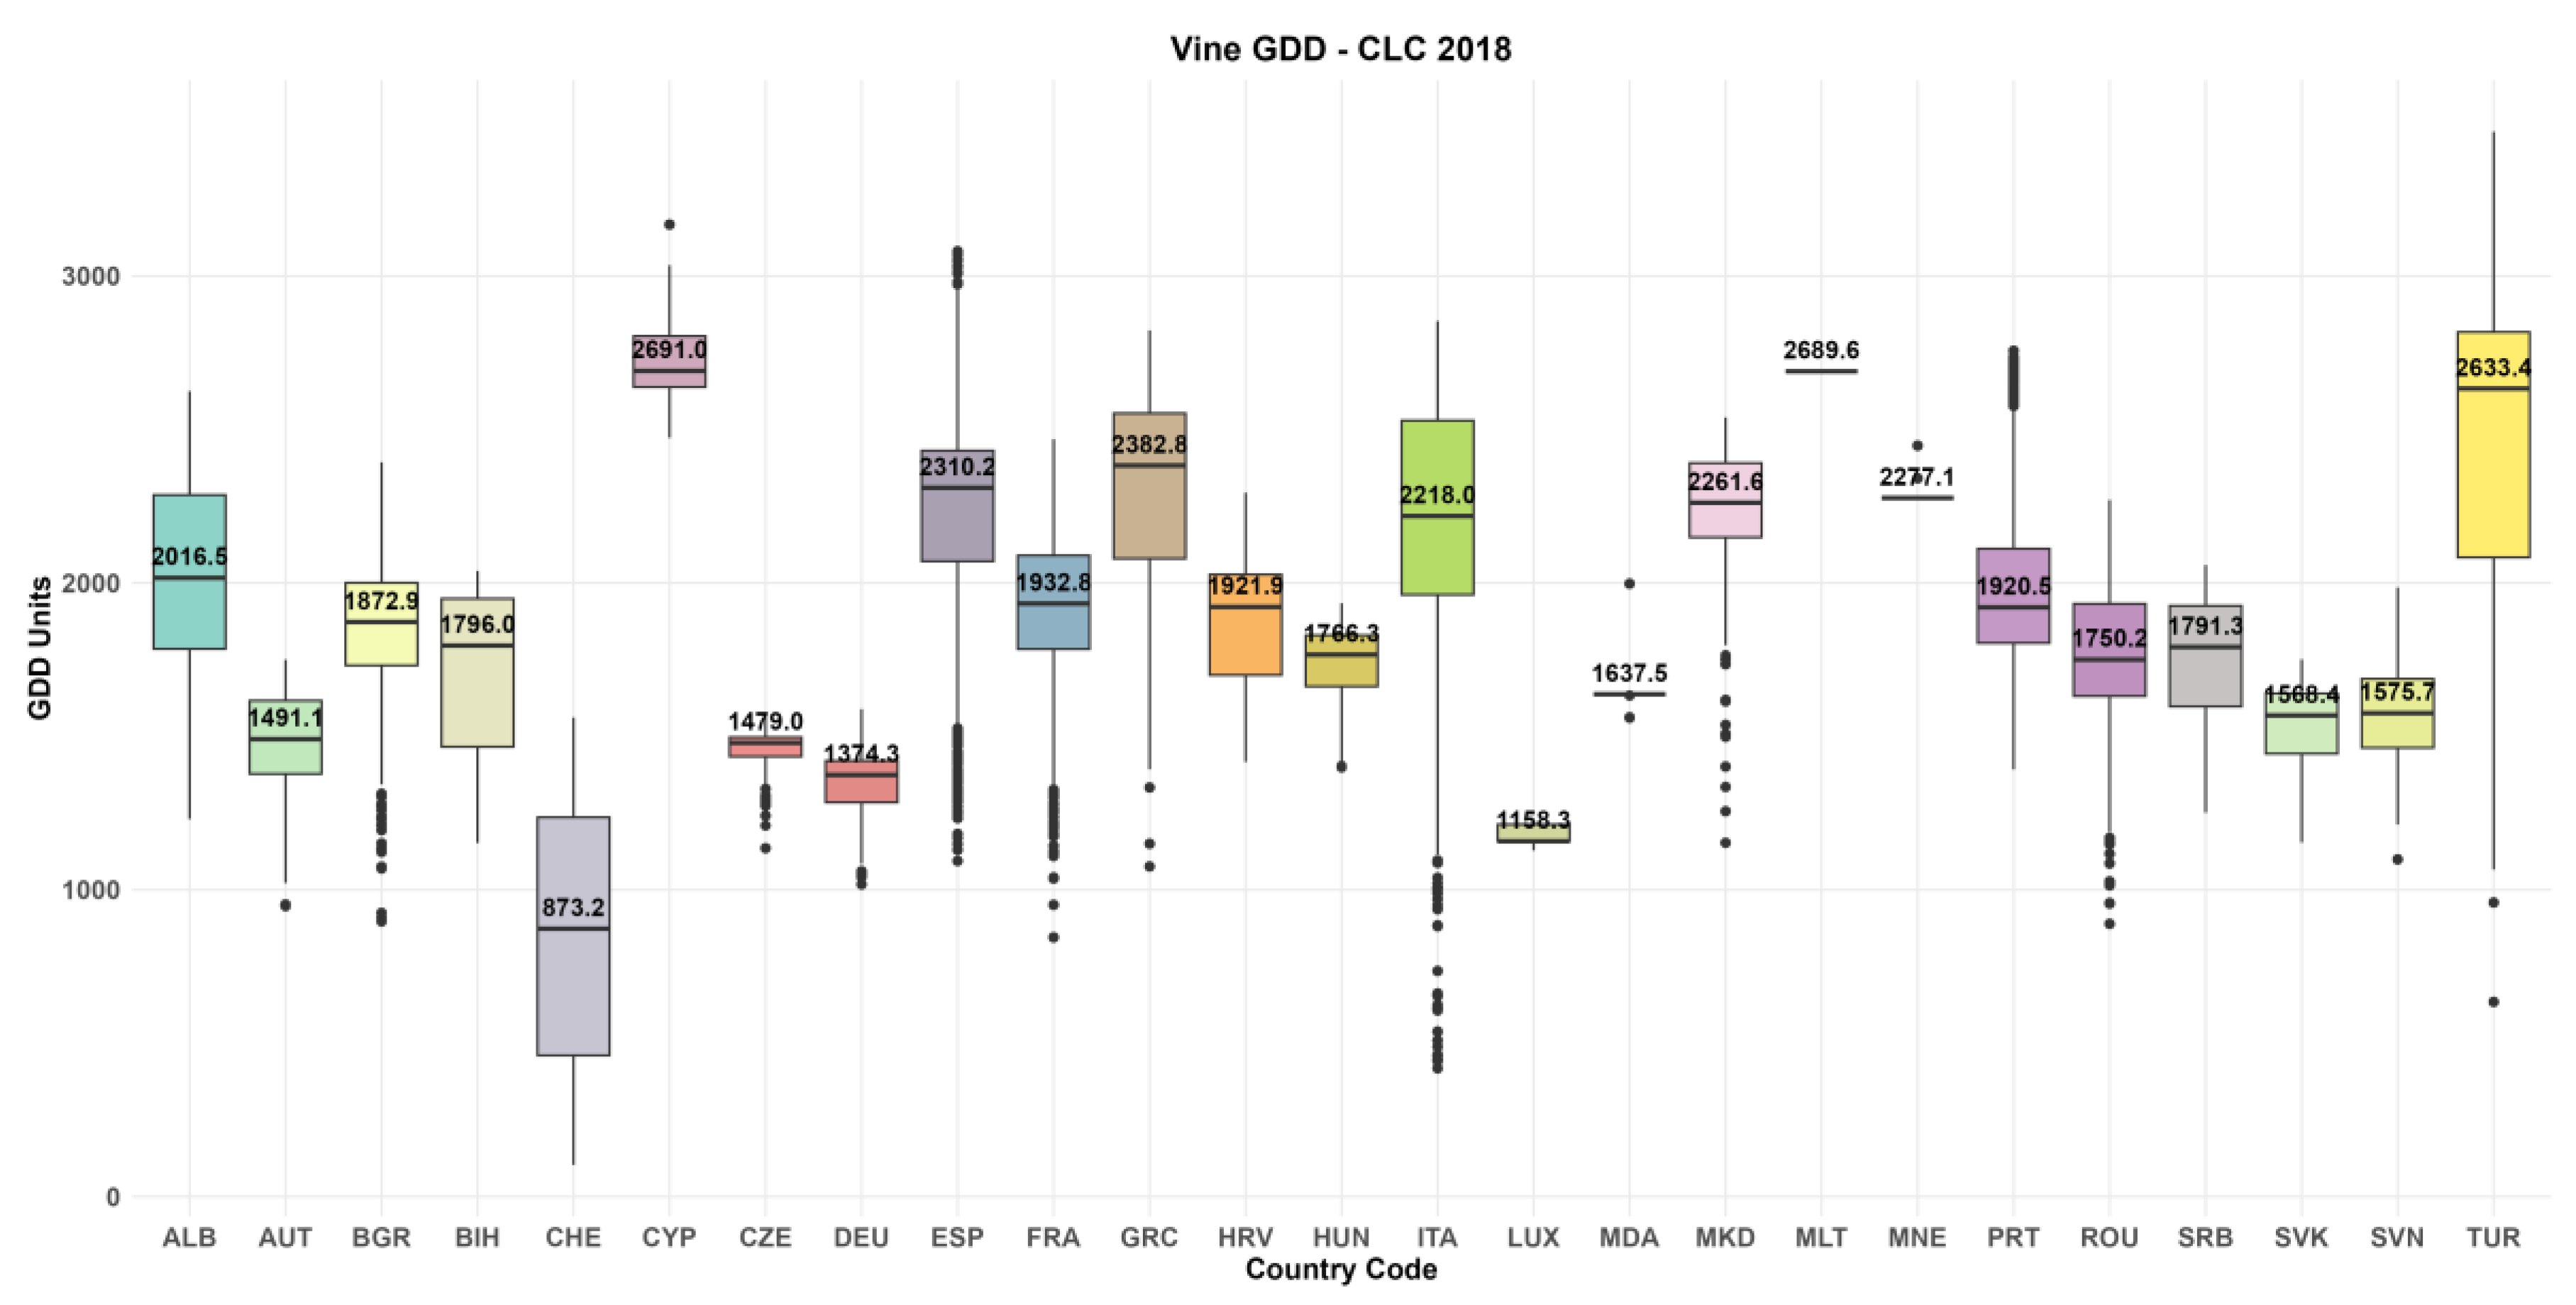
Figure 9 presents (all figures are available in larger size in the Zenodo repository) the combined boxplot overview of vineyard GDD across 22 European countries for the reference years 1990 to 2018. The interannual and interterritorial contrasts are considerably larger than those observed for olive cultivation, reflecting the wider climatic range of the countries included. Cyprus (CYP) consistently records the highest median GDD values across all periods, reaching 2691.0 GDD units in 2018, closely followed by Montenegro (MNE: 2689.6) and Turkey (TUR: 2633.4). At the opposite end of the spectrum, Luxembourg (LUX: 1158.3) and Switzerland (CHE: 873.2) record the lowest 2018 medians, the latter showing an exceptionally wide interquartile range due to the high altitudinal variability of Swiss vineyard locations.
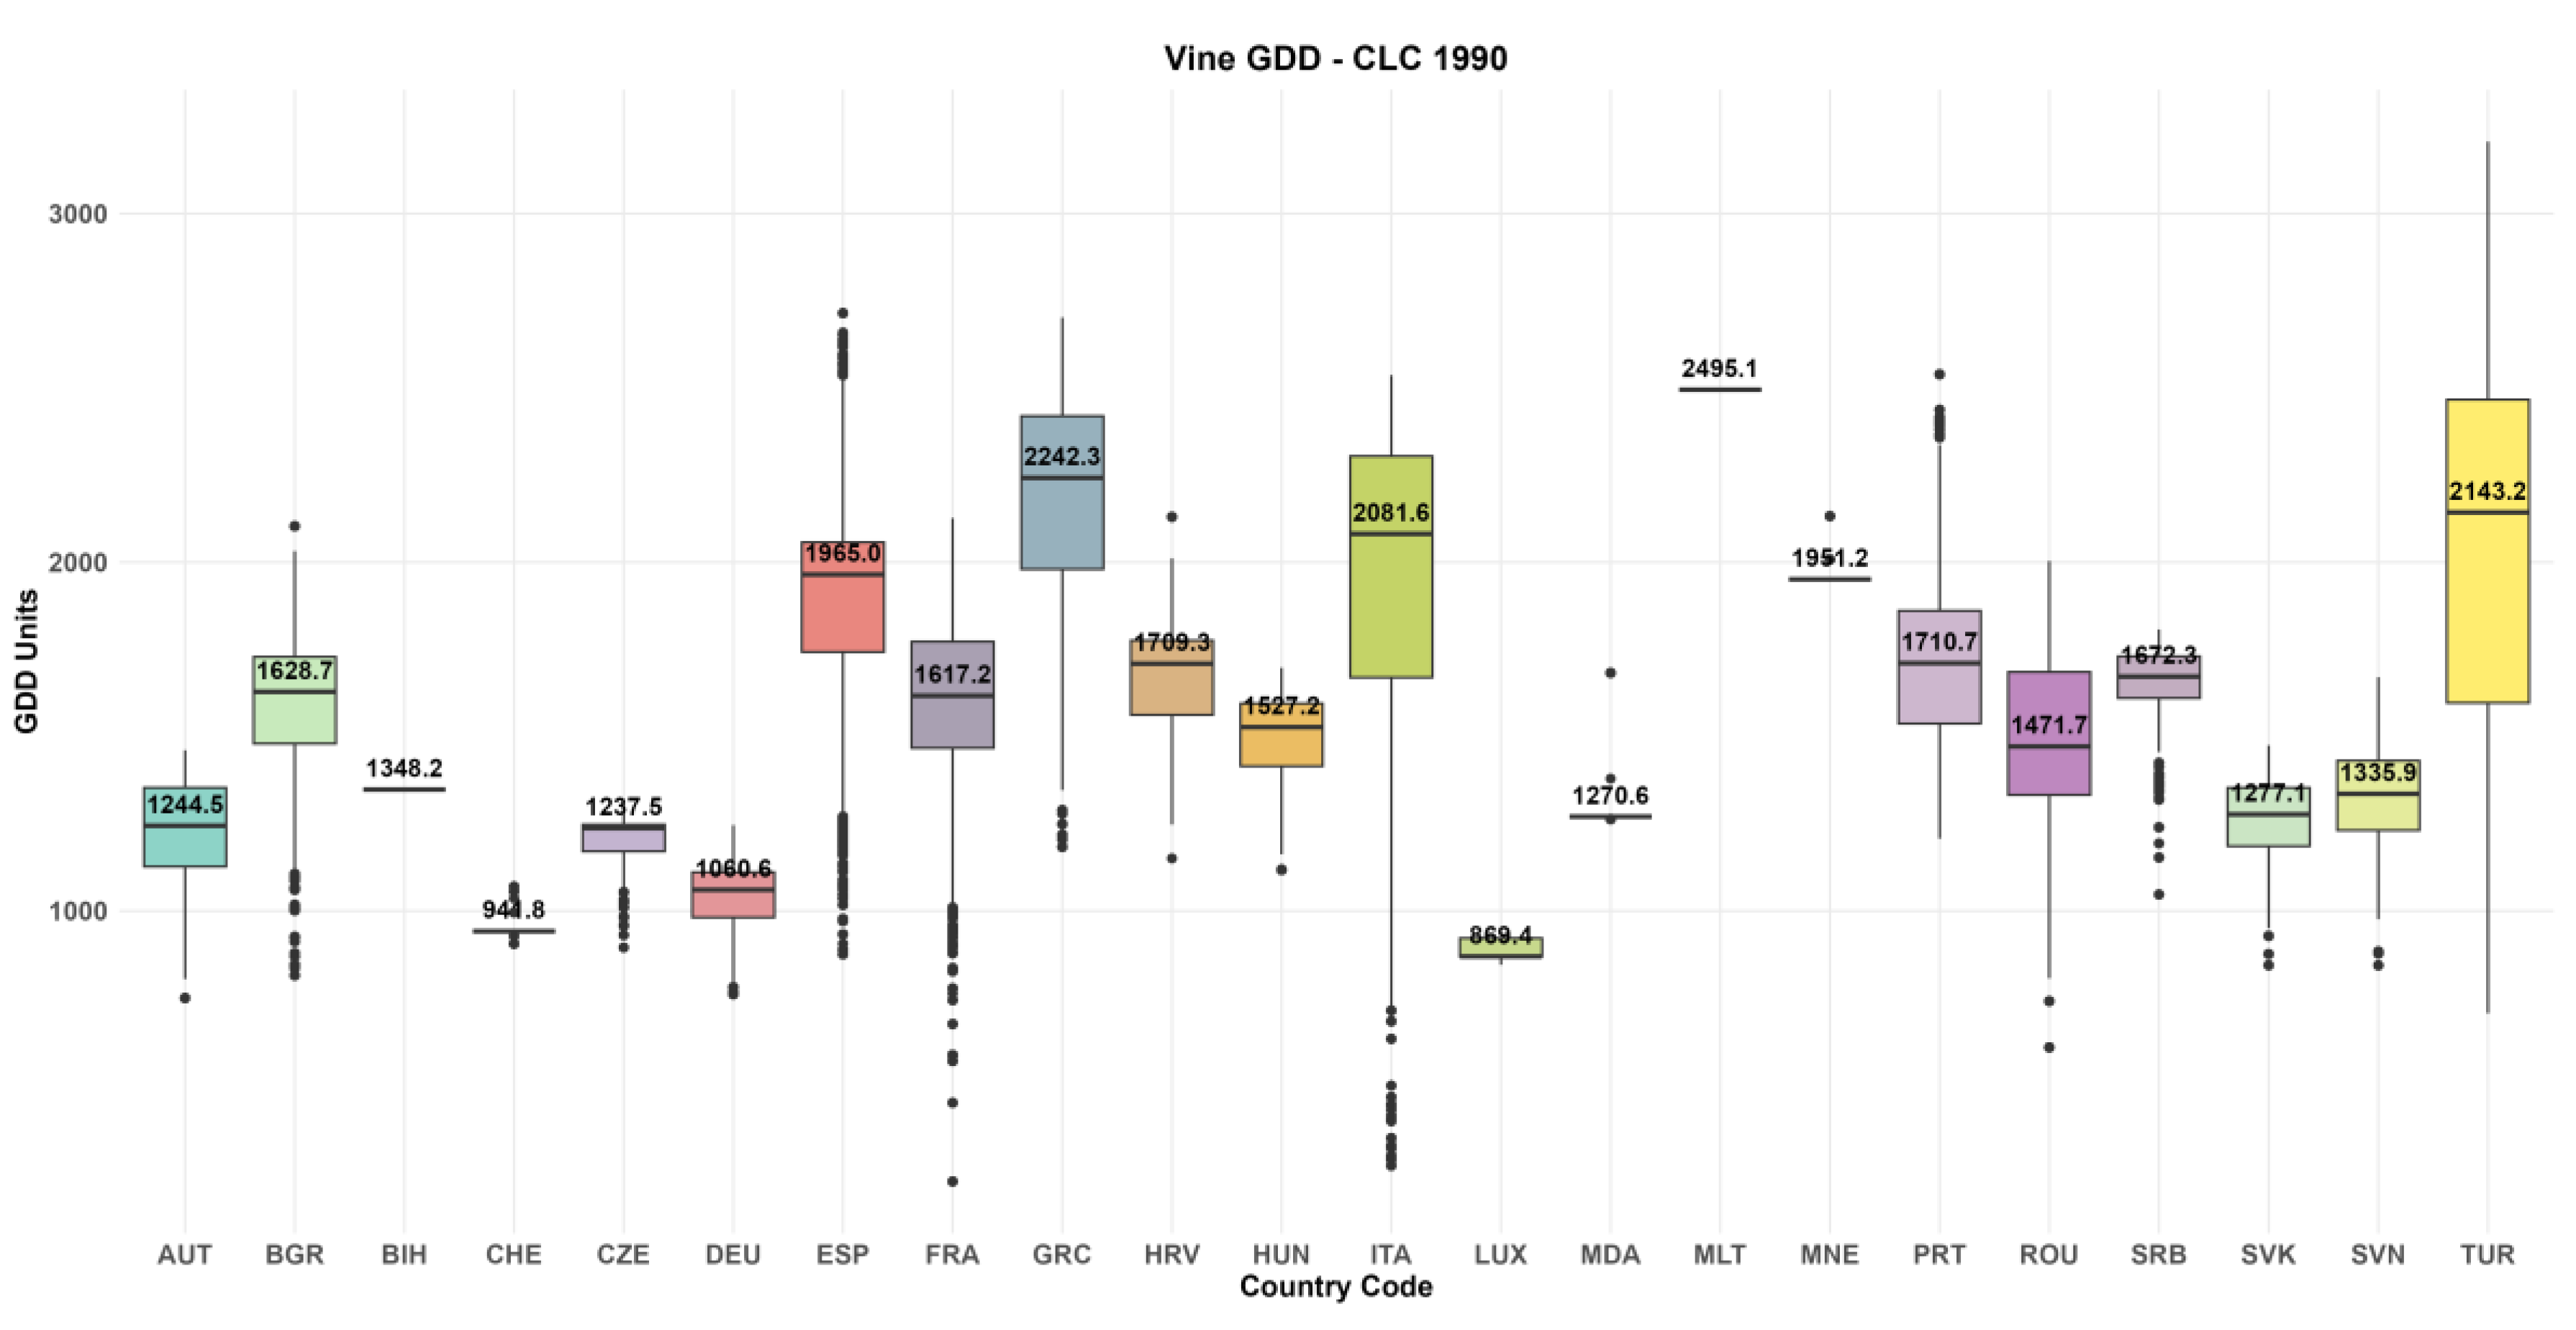
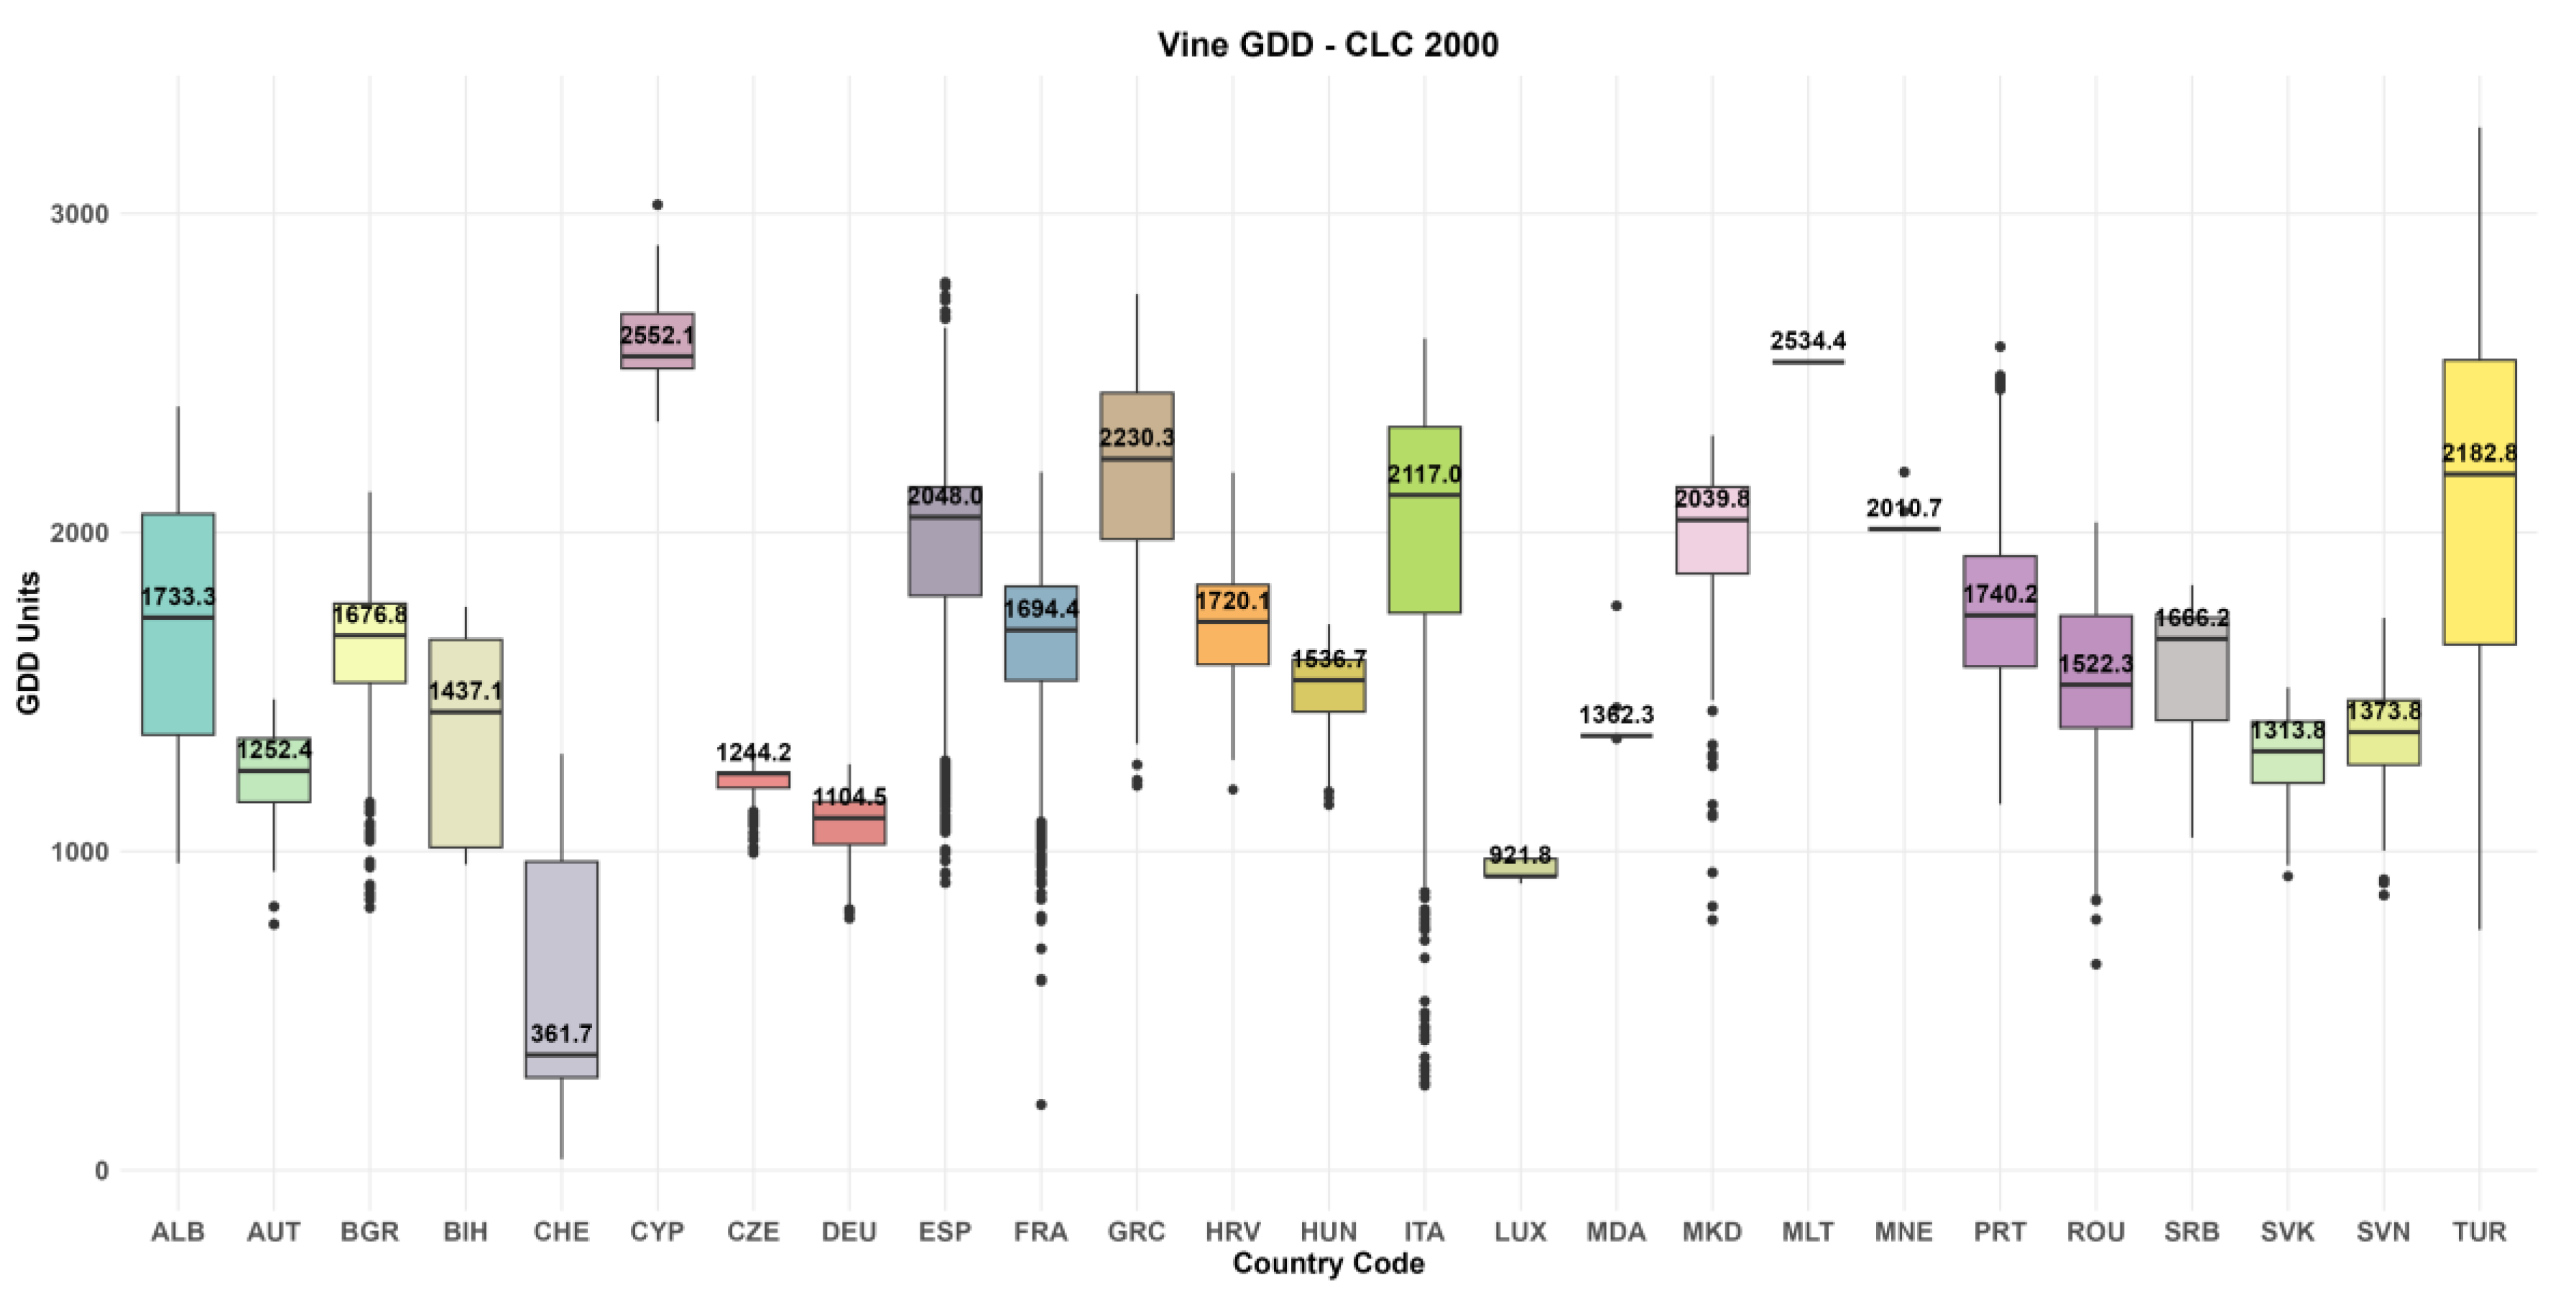
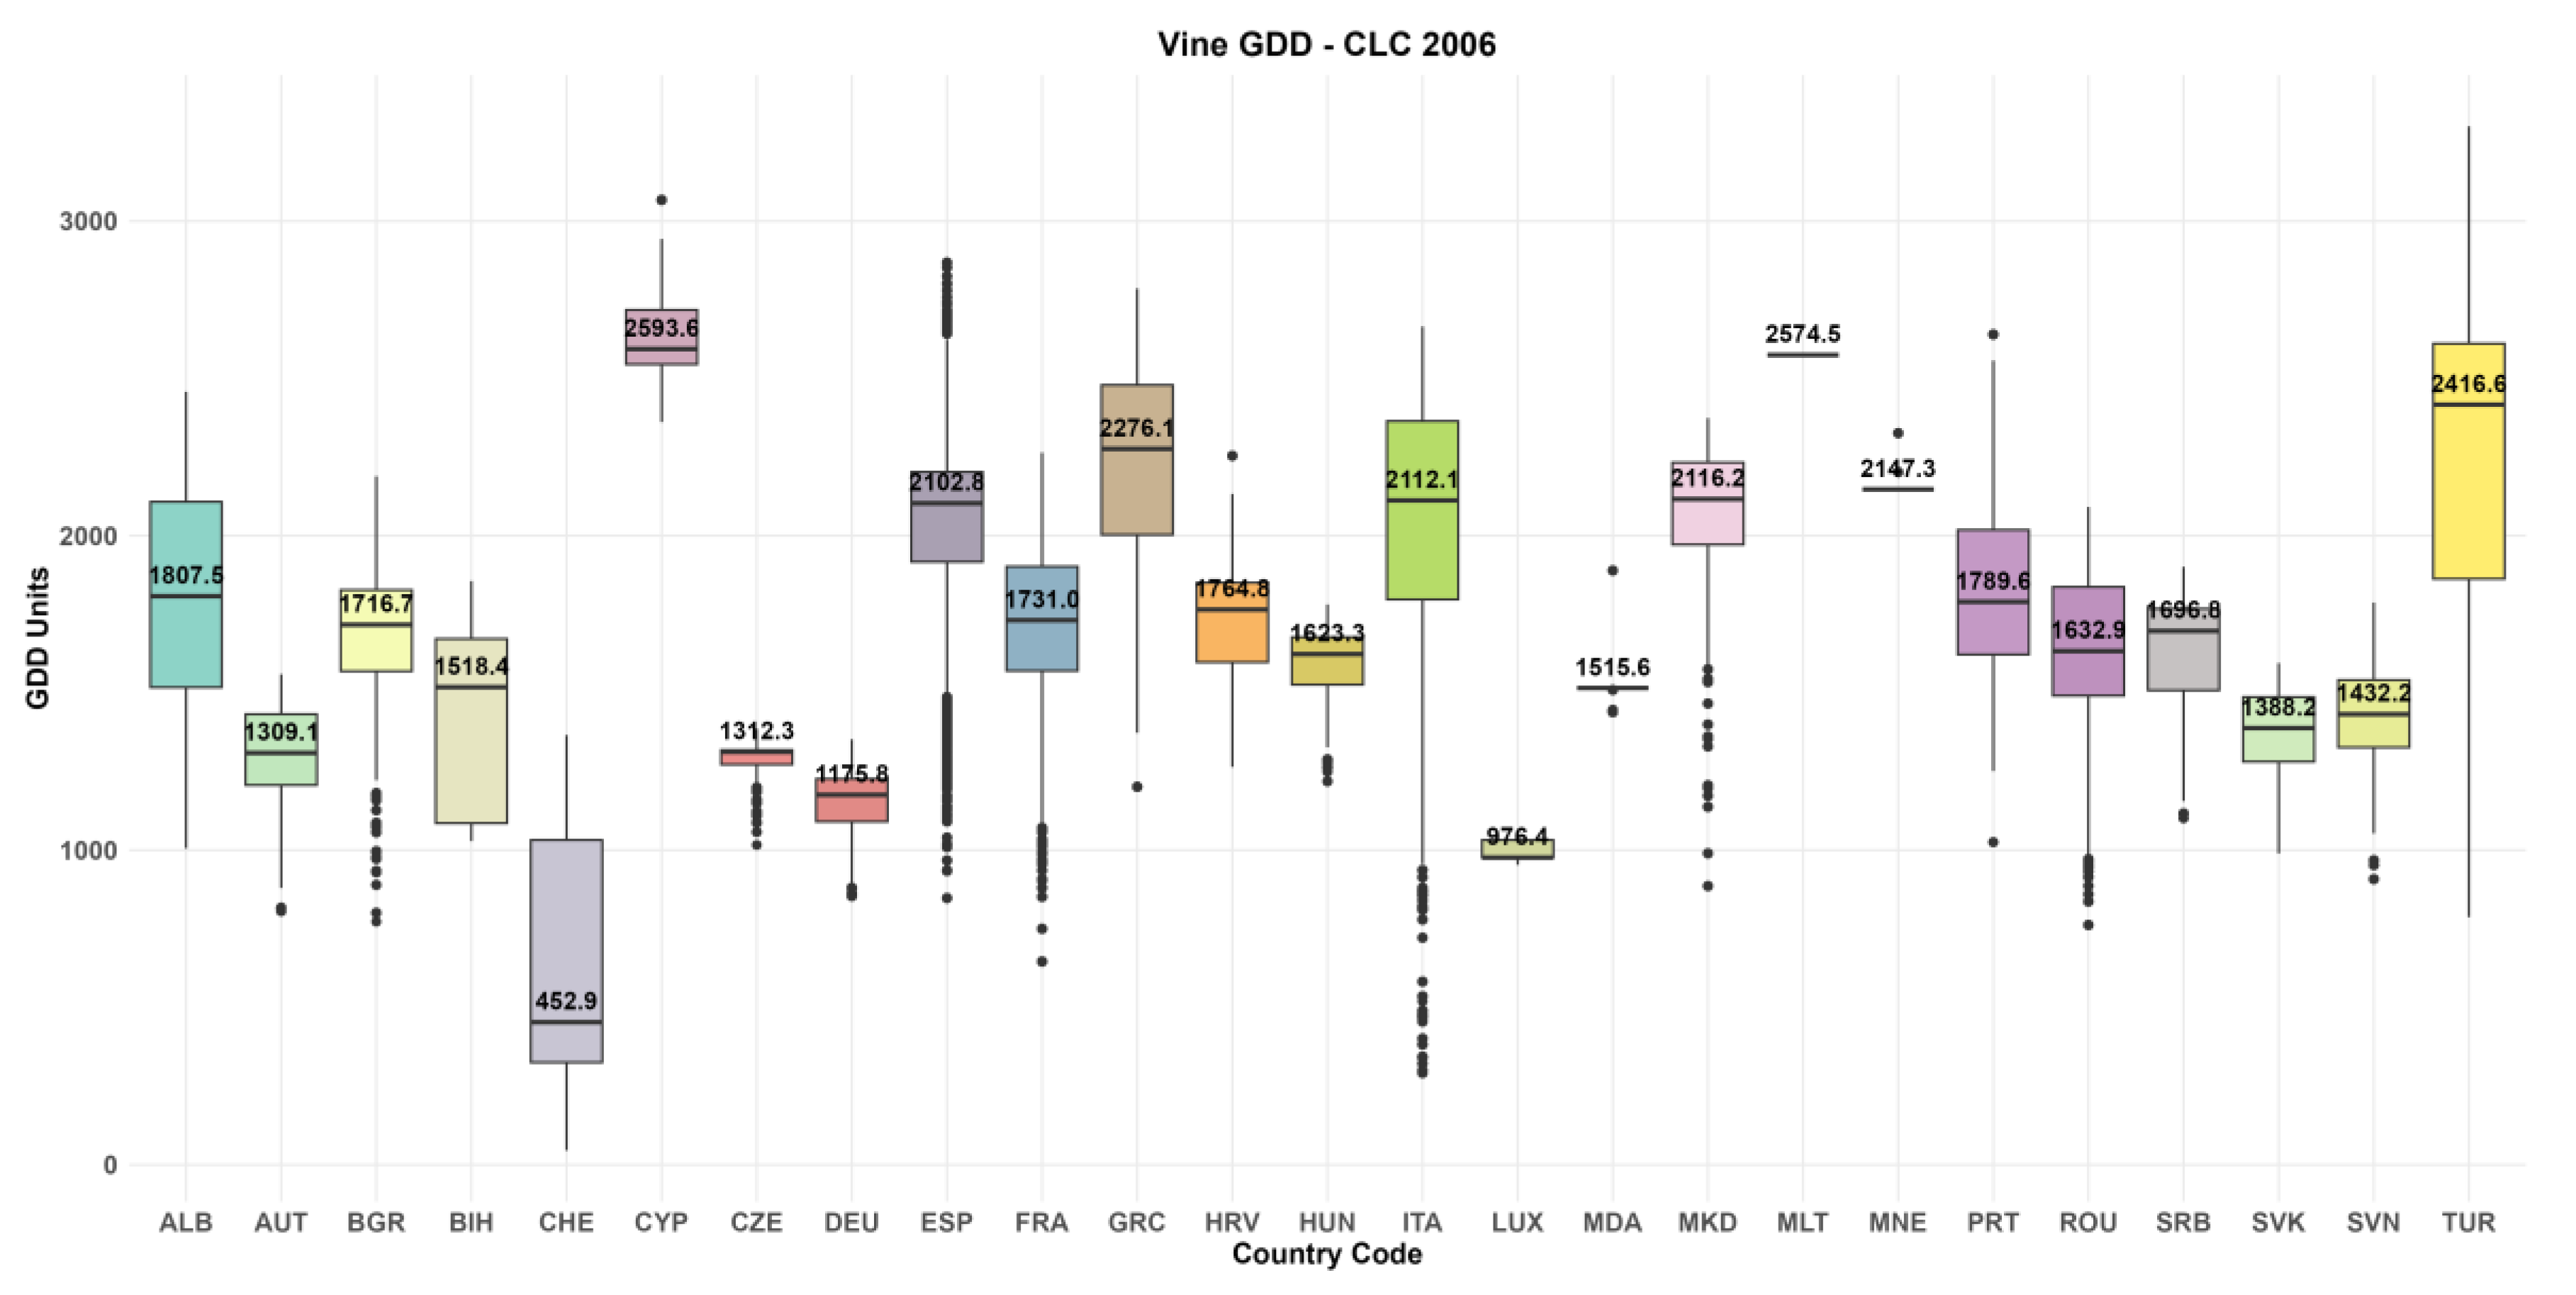
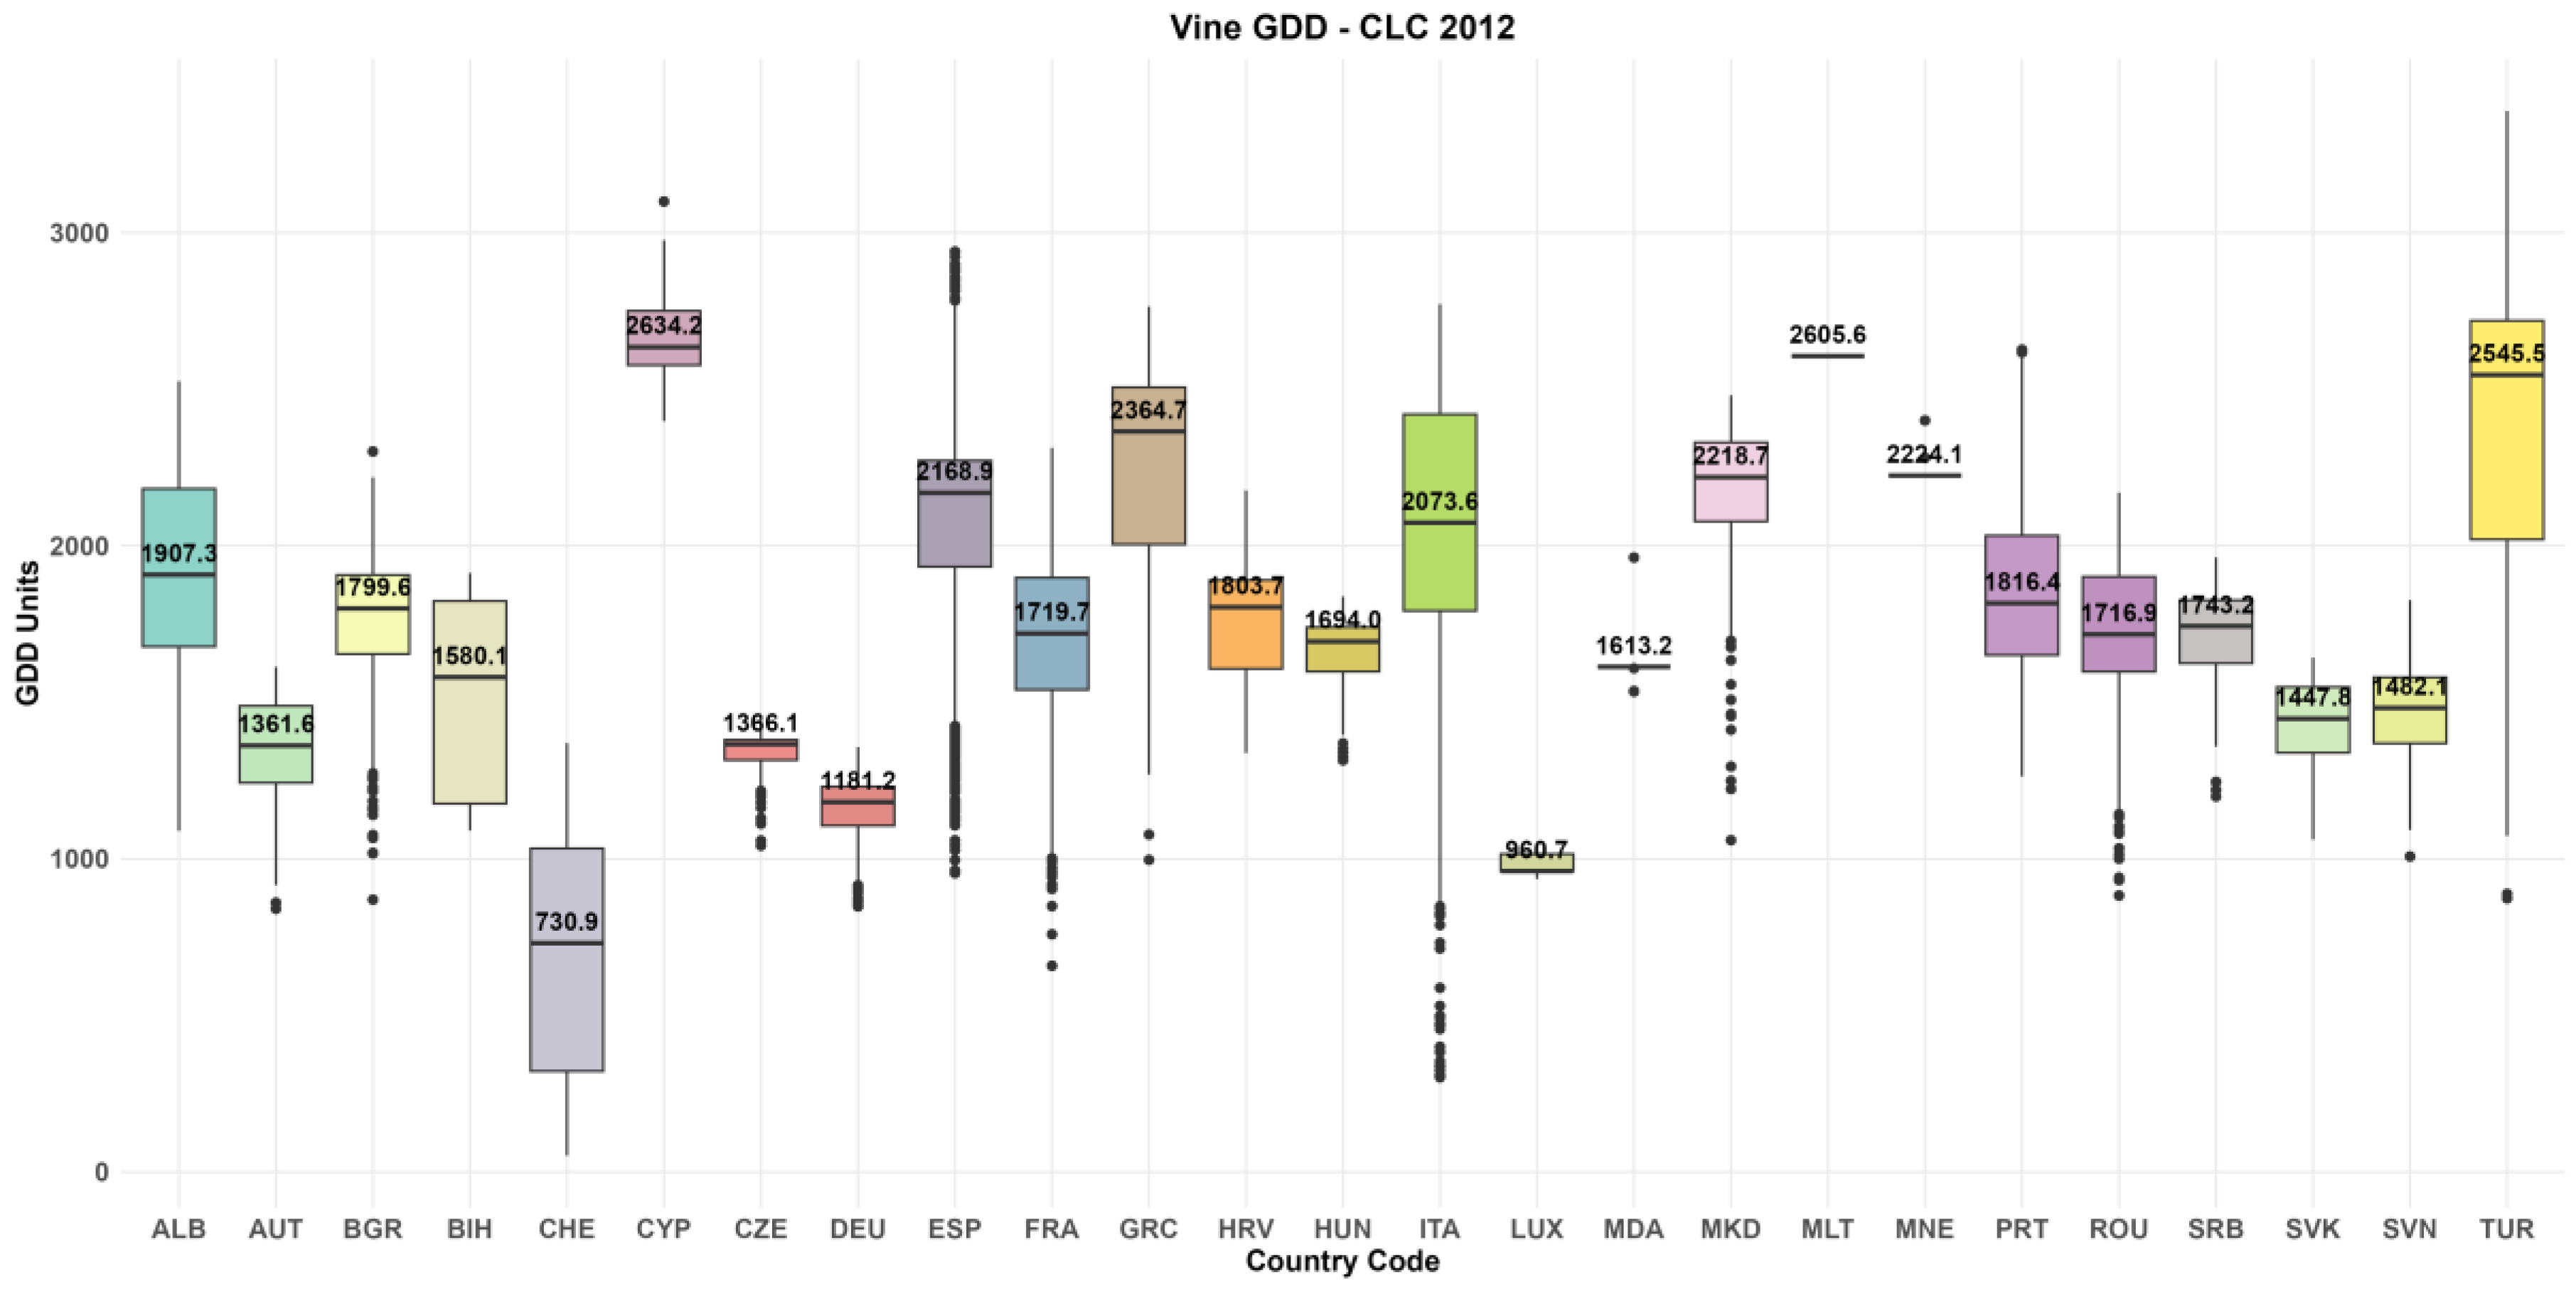
The annual snapshots (Figure 10, Figure 11, Figure 12, Figure 13 and Figure 14) illustrate the progressive evolution of vineyard GDD over the study period. In 1990 (Figure 10), the highest thermal accumulation was recorded in Montenegro (MNE: 2495.1), Greece (GRC: 2242.3), and Turkey (TUR: 2,143.2), while the lowest values were found in Switzerland (CHE: 944.8) and Luxembourg (LUX: 869.4). By 2000 (Figure 11), Albania (ALB: 1,733.3) appeared in the dataset for the first time, and Cyprus (CYP: 2552.1) surpassed all other countries to take the leading position it retains throughout the remaining periods. The 2006 reference year (Figure 12) is also notable for the first inclusion of Malta (MLT: 976.4 GDD units). Figure 13 and Figure 14 document the continued positive trajectory in GDD accumulation across 2012 and 2018, respectively, with Cyprus recording its highest median (2691.0) in the most recent year.
Figure 10 establishes the baseline vineyard thermal landscape for the 1990 reference year across 19 countries. Montenegro (MNE: 2495.1), Greece (GRC: 2242.3), and Turkey (TUR: 2143.2) record the highest medians, all well above the 2000 GDD threshold for viticultural suitability. Switzerland (CHE: 944.8) and Luxembourg (LUX: 869.4) anchor the lower end of the ranking, both far below the threshold. Montenegro and North Macedonia exhibit notably compact box structures, consistent with the geographically limited and topographically uniform character of their vineyard areas.
France’s wide box, with an extended lower whisker, already captures the contrast between its southern and northern viticultural zones. Italy’s distribution is broad, centered at 2081.6 GDD units, just above the threshold, with the spread driven by its full north-to-south extent.
Figure 11 introduces two new countries into the vineyard dataset: Albania (ALB: 1733.3) and Cyprus (CYP: 2552.1). Cyprus immediately takes the top position with the highest median in the entire panel, surpassing Montenegro, and retains it through all subsequent reference years. Its narrow interquartile range confirms the thermal uniformity of its low-elevation vineyard sites. Albania’s box is moderately compact and positioned well below the 2000 GDD threshold, reflecting the concentration of its vineyard areas in the coastal lowlands and lower Adriatic hinterland. Medians advance across almost all countries relative to 1990, with Spain (2048.0) crossing the 2000 GDD threshold at the median level for the first time, and several Balkan countries — Bosnia and Herzegovina (1437.1) and Serbia (1666.2) — showing visible upward movement. Switzerland’s interquartile range remains the widest by a significant margin. However, its median has dropped dramatically to 361.7 GDD units relative to 1990 (941.8), a notable anomaly that likely reflects a change in the composition of its CLC-mapped vineyard set in this reference year rather than a genuine cooling signal. Luxembourg’s box remains the second lowest, though its median advances to 921.8 GDD units, and its compact distribution confirms that all its registered vineyard sites share a similarly cool thermal environment.
Figure 12 introduces Malta (MLT: 976.4 GDD units) to the dataset for the first time, adding a twenty-first country to the panel. Malta enters with a very compact box, reflecting the extremely limited geographic and altitudinal variability of its island vineyard extent. Medians continue their upward trajectory across most countries, with Turkey (2416.6) showing a particularly strong jump relative to 2000, the largest inter-period increase for any country at this stage. Spain (2102.8), Greece (2276.1), and Cyprus (2593.6) extend their leads above the 2000 GDD threshold, while Portugal (1789.6) approaches it. North Macedonia enters with its first median well above 2,000 GDD units (2,116.2), placing it among the higher-ranked Balkan countries. Switzerland’s median recovers to 452.9 GDD units from the anomalously low 2000 value, and its interquartile range remains the widest.
However, the box structure is now more symmetrically distributed around its median than in earlier periods. Romania (1632.9) and Hungary (1623.3) show clear upward advancement in this period relative to 2000, while Germany (1175.8) and the Czech Republic (1312.3) also advance, with their upper whiskers beginning to move toward, and in some cases above, the 1500 GDD mark.
Figure 13 shows a broadly continued warming across all 22 countries, with the most striking features being the strong advances in the southeastern Balkan and Eastern Mediterranean group. Turkey (2545.5) and Cyprus (2634.2) reach new maxima in this period, and Albania (1907.3) and Bosnia and Herzegovina (1580.1) show some of the largest absolute increases relative to 2006. Among the central European countries, Austria (1,361.6) and Slovakia (1447.8) both advance noticeably, with their upper whiskers extending well above 1500 GDD units, indicating that the warmest registered vineyard sites in these countries are approaching the conditions historically associated with southern Central European viticulture. Switzerland continues to display its characteristically wide interquartile range, now with a median of 730.9 GDD units, recovering further from the 2000 anomaly toward values more consistent with the altitudinal gradient of its vineyards. Romania’s interquartile range narrows relative to 2006, suggesting that warming is homogenizing conditions across its diverse vineyard landscape. A notable feature of the 2012 panel is the relatively compact clustering of several Balkan countries — Serbia (1743.2), Bulgaria (1799.6), Croatia (1803.7), and Bosnia and Herzegovina (1580.1) — in the 1500–1800 GDD range, forming a thermally coherent block that is progressing steadily toward the threshold.
Figure 14 presents the most thermally advanced snapshot of European viticulture in the study period and serves as the clearest illustration of the warming gradient documented across all 22 countries. Cyprus (2691.0) and Montenegro (2689.6) share the top position virtually, with Turkey (2633.4) closely behind — all three recording their highest medians of the entire time series. At the country level, several key distributional features deserve attention. Spain’s box reaches its widest extent of the study period in 2018, with a particularly pronounced upper whisker reflecting the extreme heat accumulation at the warmest sites of its viticultural domain, while its lower quartile continues to advance, confirming that even marginal Spanish vineyard areas are experiencing increased thermal loading. France’s 2018 distribution shows a marked upward shift of its median (1932.8) and a notable compression of the lower whisker relative to earlier periods, suggesting that thermally marginal northern French vineyard areas have warmed sufficiently to reduce the previously strong downward asymmetry of the distribution. For the central European countries, Austria (1491.1), Czech Republic (1479.0), and Slovakia (1568.4) all record their highest medians, with Austria’s upper whisker and outlier points clearly crossing the 2000 GDD threshold, a direct illustration of the “reverse agroclimatology” finding that actual thermal conditions at registered vineyard sites are evolving rapidly toward and in some cases beyond the classical suitability benchmark. Germany (1374.3) advances its median most strongly in this period compared to 2012, recording an increase of approximately 193 GDD units, while maintaining a relatively broad distribution that captures both the warmer Rhine valley floor sites and the cooler hillside terraced vineyards. Luxembourg (1,158.3) records its highest median during the study period, though it remains the furthest from the 2000 GDD threshold among all countries. Switzerland’s median (873.2) advances further, and its interquartile range, while still the widest, shows some narrowing of its lower extent, consistent with warming of the cooler high -elevation vineyard sites in the Swiss Alps.
According to Table 2, statistically significant positive trends are detected for the majority of the 22 countries studied. The highest slope values are recorded for Turkey (19.25 GDD yr−1), Albania (15.83 GDD yr−1), and Bosnia and Herzegovina (14.89 GDD yr−1), indicating particularly rapid rates of thermal accumulation in the southeastern and Adriatic regions. Austria (8.46 GDD yr−1), Bulgaria (8.76 GDD yr−1), and Slovakia (10.21 GDD yr−1) also show strong significant trends. Non-significant trends are detected for France (FRA), Italy (ITA), Luxembourg (LUX), and Switzerland (CHE), the latter being influenced by the high spatial heterogeneity of its vineyard sites. The R2 values of the linear fits are generally high, particularly for Albania (0.993), Cyprus (0.993), North Macedonia (0.978), and Romania (0.955), indicating a strong linear component to the warming signal in these countries. The mean GDD across all periods ranges from 672.1 in Switzerland to 2617.7 in Cyprus.
The comparison of these observed GDD values with the canonical threshold of 2,000 GDD (Tbase = 10 °C, April–October) — widely recognized as the minimum thermal requirement for a region to be considered climatically suitable for grapevine cultivation reveals a differentiated but consistent picture across the European domain. Among the Mediterranean and Balkan countries, all recorded mean GDD values comfortably exceed the 2000 threshold, even in the earliest reference year (1990): Cyprus (2552.1), Montenegro (2495.1), Turkey (2143.2), Italy (2081.6), and Greece (2242.3) all surpass it by a wide margin. Spain (1965.0 in 1990) crosses the threshold by 2000 and consistently exceeds it thereafter, reaching 2310.2 by 2018. By contrast, the central and northern European countries — Germany (DEU), the Czech Republic (CZE), Austria (AUT), Slovakia (SVK), Slovenia (SVN), Romania (ROU), and Hungary (HUN) — record mean GDD values that remain below or only marginally above the 2000 GDD threshold throughout the study period, though all exhibit statistically significant positive trends. Notably, their 2018 GDD medians (e.g., AUT: 1491.1; DEU: 1374.3; CZE: 1479.0) confirm that these regions, while hosting registered vineyard areas, currently operate below the classical climatic suitability threshold. Switzerland (CHE: long-term mean 672.1 GDD) and Luxembourg (LUX: long-term mean 977.3 GDD) are the most thermally constrained, underscoring the role of site selection and local topography in sustaining viticulture at the northern and altitudinal extremes. This cross-threshold differentiation constitutes the core output of the “reverse agroclimatology” approach applied to viticulture: by anchoring GDD computation exclusively to CLC-registered vineyard cells, the analysis reveals that European vineyards span a remarkable thermal gradient — from regions where the classical suitability threshold is far exceeded to regions where cultivation persists in spite of sub-threshold mean GDD, reflecting the role of local conditions, variety adaptation, and cultural heritage. The strongly positive and predominantly significant trends observed across 18 of the 22 countries indicate that this thermal landscape is rapidly evolving, with the gap between observed GDD and the 2000-unit threshold narrowing consistently over the study period in the cooler northern countries and widening in the already warm southern ones, reflecting heat accumulation conditions.

4. Discussion

One of the core motivations behind this work was a straightforward observation. While GDD thresholds for olive and grapevine are well established in the agroclimatic literature, no one has yet asked what GDD values actually look like at the locations where these crops are grown. By masking ERA5-Land temperature fields with CLC cultivation polygons, we were able to answer that question directly — and the answer turns out to be both reassuring and, in some respects, surprising. The thermal environments of European olive groves and vineyards are not marginal; in most cases, they are considerably warmer than the canonical thresholds suggest, and they are warming further. What follows is our interpretation of these results in light of existing literature, along with some honest reflection on the limitations of the approach.
Starting with olive cultivation, the 700 GDD threshold (Tbase = 7 °C, January–May) that Oteros et al. (2013) [47] and Orlandi et al. (2010) [48] identified as broadly indicative of adequate heat accumulation for flower structure development is exceeded at the median level by every country in our dataset, across every reference year. The only country that falls short of it — France, with a long-term mean of 476.2 GDD — still shows individual sites comfortably above 700 GDD in the upper tail of its distribution. This is not a trivial finding. Charalampopoulos et al. (2021) [54], working with the AGRI4CAST dataset but limited to the Balkan region, already hinted at this pattern, showing that registered olive areas in Greece, Croatia, and neighboring countries accumulate GDD well above the threshold. Our study takes that regional result and scales it to the entire Mediterranean, showing that the same pattern holds from Portugal and Spain in the west to Turkey in the east. What this tells us, practically speaking, is that the thermal environment of European olive cultivation is not constrained by heat shortage — it is, in fact, generously warm. The factors limiting olive cultivation in any given location are more likely to be frost risk, water availability, and land suitability than insufficient thermal accumulation.
The picture for viticulture is more interesting because of the geographic spread involved unlike olive cultivation, which is concentrated in a relatively compact Mediterranean arc, vineyards in our dataset stretch from Cyprus (long-term mean 2617.7 GDD) all the way to Luxembourg (977.3 GDD) and Switzerland (672.1 GDD), spanning a thermal range that straddles the 2000 GDD threshold in ways that are climatically and agronomically meaningful. Santos et al. (2012) [43] established the Winkler framework as a reference for European viticultural zoning, and our cultivation-anchored GDD values slot neatly into that framework while adding the temporal dimension it lacked. Charalampopoulos et al. (2024) [51], in their analysis of viticulture GDD trends across the Northern Mediterranean Basin, identified significant positive trends in most countries and flagged the Balkans as particularly fast-warming — findings we fully reproduce here and extend to central and northern Europe. What we add is the observation that even in countries like Austria, the Czech Republic, and Slovakia, where median GDD values remain below 2,000 units, the upper tails of the 2018 distributions already cross that threshold. In other words, the warmest registered vineyard sites in these countries are thermally equivalent to what, a generation ago, would have been considered the southern European viticultural zone. Fraga et al. (2013) [41] and Santos et al. (2020) [53] have both projected that this kind of northward shift in viticultural suitability will accelerate under continued warming; our results suggest it is already happening, not just in projections but in the actual observed thermal environment of existing vineyards.
The trend analysis is, in many ways, the part of this study that connects most directly to the broader climate change literature. Significant positive GDD trends in 7 of 11 olive countries and 18 of 22 vineyard countries, with slopes reaching 4.44 GDD yr−1 in Portugal for olive and 19.25 GDD yr−1 in Turkey for vine, are consistent with the temper-ature trends documented across Europe by Giorgi and Lionello (2008) [4] and Trnka et al. (2011) [5], and with the GDD-specific analyses of Walther and Linderholm (2006) [32], Feng and Hu (2004) [36], and Zhang et al. (2013) [38] in other regions. The particularly high rates in the Eastern Mediterranean — Turkey, Albania, and Bosnia and Herzegovina — are not surprising given the well-documented thermal amplification in this region under ongoing climate change, as highlighted by Giorgi and Lionello (2008) [4] and more recently by Charalampopoulos et al. (2023) [16]. The non-significant trends in Cyprus (olive) and in France, Italy, Luxembourg, and Switzerland (vine) warrant comment, as they could easily be misread as indicating stability. In Cyprus, the extremely high thermal baseline — already at 1155 GDD in 2000 and rising to 1257 by 2018 — combined with only four data points after its CLC entry, makes it nearly impossible for a linear regression to reach significance. The trend is real; the statistical test lacks the power to confirm it. Switzerland is the opposite problem: its interquartile ranges are so wide, reflecting the altitudinal scatter of its vineyard sites, that the signal-to-noise ratio is poor. Neither case should be interpreted as an absence of warming at these locations.
One result we found particularly striking was Slovenia’s entry into the CLC olive dataset in 2012, with registered sites recording a median of 546.5. This is a country most people would not immediately associate with olive cultivation. Yet there it is, documented in a continental land-cover inventory, in a coastal strip where the Adriatic microclimate is just warm enough to sustain it. Charalampopoulos and Droulia (2022) [15] and Charalampopoulos et al. (2023) [16] have both documented poleward shifts in bioclimatic conditions across southeastern Europe, and Slovenia’s olive entry is a tangible, land-use-mapped expression of that process. We should be clear, though, about one interpretive limitation that applies throughout the study: we cannot always disentangle genuine cultivation expansion from improved CLC mapping resolution across successive reference years. The 2000 dataset, for instance, added Albania and Cyprus for both crops, and the 2006 dataset added Malta for viticulture. Some of that expansion likely reflects better field-mapping coverage as much as actual land use change. This is a known constraint of the CLC framework noted by Büttner (2014) [57], and we flag it as a priority for future work using finer-resolution land cover products.
A few methodological caveats are worth raising. ERA5-Land performs well as an atmospheric dataset — its validation against station observations across multiple climatic regions has been thoroughly established [56,62,63] — but its ~9 km spatial resolution cannot capture the fine-scale thermal heterogeneity that vineyard managers and olive farmers actually navigate day to day. South-facing slopes, valley-floor cold-air pooling, and coastal proximity effects: none of these are resolved at this grid spacing. The CLC dataset has a complementary limitation: its 25 ha minimum mapping unit means that small, fragmented parcels — common in the terraced mountain vineyards of Switzerland, Austria, and the Adriatic coast — are likely absent from the cultivation mask. This does not bias the trend direction, but it does mean that our within-country distributional spreads are probably underestimates of reality. Looking ahead, higher-resolution land cover inputs, such as the Sentinel-2-derived 10 m maps now produced by Copernicus, combined with Eurostat Farm Structure Survey data, could substantially improve the spatial fidelity of this kind of analysis. The analytical pipeline itself — built entirely in R (Charalampopoulos, 2020) [58] around open-access inputs — is designed to be updated whenever a new CLC reference year becomes available, which we regard as one of its more practically useful features.
Stepping back, what does “reverse agroclimatology” actually add to how we think about crop–climate relationships? The classical approach, as formalized by McMaster and Wilhelm (1997) [20] and applied in regional zoning studies like Santos et al. (2012) [43] and Paparrizos and Matzarakis (2017) [24], starts from a biophysical threshold and maps the geography of climatic suitability. That is a powerful tool for prospective questions: where could we grow this crop? But it says nothing about the thermal reality at the places where the crop is already grown. Our approach asks the complementary question: given where cultivation currently exists, what thermal environment is it actually experiencing, and how is that changing? For Mediterranean olive cultivation, the answer is that existing groves are sitting comfortably in a thermal surplus — well above what Oteros et al. (2013) [47] and Orlandi et al. (2010) [48] define as the minimum requirement — and that surplus is growing. What this means for growers is that heat is increasingly not the limiting factor; water, frost, and variety adaptation deserve more attention. For viticulture, the picture is split: the southern and eastern Mediterranean vineyards of Jones et al. (2005) [29] and Fraga et al. (2020) [52] are moving into conditions of thermal excess, while the central European vineyards are climbing toward suitability thresholds they have not historically reached. Both trajectories create management challenges that will need to be addressed in the coming decades, and we hope the cultivation-anchored GDD framework developed here provides a useful empirical baseline for those conversations. Extending this approach to other perennial crops — almond, citrus, stone fruits — linking it to phenological networks such as PEP725, and projecting it forward with EURO-CORDEX temperature scenarios are all natural next steps that we intend to pursue.

5. Conclusions

This study set out to answer a simple yet previously unaddressed question: What are the actual GDD values experienced by European olive groves and vineyards? By computing GDD exclusively over CLC-registered cultivation pixels using ERA5-Land temperature data, across five reference years spanning nearly three decades (1990–2018), we produced what we believe is the first systematic, cultivation-anchored thermal characterization of European olive and wine production areas. The main takeaways are summarized below.
For olive cultivation, the thermal environment at registered sites is, in most countries, substantially warmer than the 700 GDD minimum benchmark widely cited in the literature. Country-level long-term means range from 476.2 GDD units in France to 1214.3 in Cyprus - a nearly threefold range across a crop that supposedly operates around a single threshold. Seven of the eleven countries show statistically significant positive GDD trends, with Portugal and Spain warming at the fastest rates (4.44 and 4.29 GDD yr−1, respectively). The first appearance of olive cultivation in Slovenia’s 2012 CLC dataset, recorded at 546.5, provides a concrete, land-use-grounded signal of the northward displacement of cultivation boundaries that has been anticipated by bioclimatic modeling for years.
For viticulture, the diversity of outcomes across 22 countries is striking. The Mediterranean and Balkan countries are already well above the 2000 GDD threshold, in some cases by a considerable margin. The central and northern European countries — Germany, Austria, the Czech Republic, Slovakia, and Switzerland among them — host registered vineyards that operate below the median threshold, yet their warmest sites are approaching or exceeding it, particularly in the 2012 and 2018 reference years. Turkey, Albania, and Bosnia and Herzegovina stand out for the steepest warming rates — 19.25, 15.83, and 14.89 GDD yr−1, respectively — underlining how rapidly the Eastern Mediterranean and Adriatic viticultural zones are being thermally transformed.
Taken together, these results make a case that knowing where crops grow is, in itself, useful climatic information. The reverse agroclimatology framework is not a replacement for classical agroclimatic zoning but a complement to it: it grounds the thermal characterization of agriculture in observable land use, rather than in idealized suitability maps. In Mediterranean olive cultivation, the implication is that heat is no longer the main climatic concern — water stress, frost risk, and heat-induced phenological disruption deserve greater research and policy attention. For European viticulture, the framework reveals a continent splitting into two distinct thermal trajectories: a Mediterranean south where conditions are increasingly hot beyond the classical suitability threshold, and a central-northern arc where the same threshold is being approached from below. Both trajectories have practical consequences for variety selection, irrigation planning, geographic designation, and harvest timing, all of which will need to adapt as warming continues. The fully open and reproducible analytical pipeline ensures that these analyses can be updated as new CLC reference years become available, making this framework a practical tool for ongoing agricultural climate monitoring in Europe.

Author Contributions

Conceptualization, I.C.; methodology, I.C.; software, I.C. and N.K.; validation, I.C.; formal analysis, I.C.; investigation, I.C.,F.D. and N.K.; resources, N.K.; data curation, I.C.; writing—original draft preparation, I.C.; writing—review and editing, N.K and F.D.; visualization, I.C.; supervision, I.C. All authors have read and agreed to the published version of the manuscript.

Funding

This research received no external funding.

Data Availability Statement

Data, grpahs and script can be found in Zenodo: Link https://doi.org/10.5281/zenodo.20000333.

Conflicts of Interest

The authors declare no conflicts of interest.

Abbreviations

The following abbreviations are used in this manuscript:
ALB Albania
AUT Austria
BGR Bulgaria
BIH Bosnia and Herzegovina
C3S Copernicus Climate Change Service
CC Climate Change
CDS Copernicus Climate Data Store
CHE Switzerland
CLC Corine Land Cover
CYP Cyprus
CZE Czech Republic
DEU Germany
ECMWF European Centre for Medium-Range Weather Forecasts
EEA European Environment Agency
ESP Spain
FRA France
GDD Growing Degree Days
GRC Greece
H-TESSEL Tiled ECMWF Scheme for Surface Exchanges over Land incorporating land surface hydrology
HRV Croatia
HUN Hungary
ISO International Organization for Standardization
ITA Italy
LUX Luxembourg
MKD North Macedonia
MLT Malta
MNE Montenegro
NetCDF Network Common Data Form
NMB Northern Mediterranean Basin
PRT Portugal
R2 Coefficient of Determination
ROU Romania
SRB Serbia
SVK Slovakia
SVN Slovenia
Tbase Base Temperature
Tmax Daily Maximum Air Temperature
Tmin Daily Minimum Air Temperature
TUR Turkey
UTC Coordinated Universal Time

References

  1. Rosenberg, N.J. Adaptation of Agriculture to Climate Change. Clim. Change 1992, 21, 385–405. [Google Scholar] [CrossRef]
  2. Howden, S.M.; Soussana, J.-F.; Tubiello, F.N.; Chhetri, N.; Dunlop, M.; Meinke, H. Adapting Agriculture to Climate Change. PNAS 2007, 104, 19691–19696. [Google Scholar] [CrossRef]
  3. Rickards, L.; Howden, S.M. Transformational Adaptation: Agriculture and Climate Change. Crop Pasture Sci. 2012, 63, 240–250. [Google Scholar] [CrossRef]
  4. Giorgi, F.; Lionello, P. Climate Change Projections for the Mediterranean Region. Glob. Planet. Change 2008, 63, 90–104. [Google Scholar] [CrossRef]
  5. Trnka, M.; Olesen, J.E.; Kersebaum, K.C.; Skjelvåg, A.O.; Eitzinger, J.; Seguin, B.; Peltonen-Sainio, P.; Rötter, R.; Iglesias, A.; Orlandini, S.; et al. Agroclimatic Conditions in Europe under Climate Change. Glob. Change Biol. 2011, 17, 2298–2318. [Google Scholar] [CrossRef]
  6. Nastos, P.T.; Politi, N.; Kapsomenakis, J. Spatial and Temporal Variability of the Aridity Index in Greece. Atmos. Res. 2013, 119, 140–152. [Google Scholar] [CrossRef]
  7. Tsiros, I.X.; Nastos, P.; Proutsos, N.D.; Tsaousidis, A. Variability of the Aridity Index and Related Drought Parameters in Greece Using Climatological Data over the Last Century (1900–1997). Atmos. Res. 2020, 240, 104914. [Google Scholar] [CrossRef]
  8. Driesen, E.; Van den Ende, W.; De Proft, M.; Saeys, W. Influence of Environmental Factors Light, CO2, Temperature, and Relative Humidity on Stomatal Opening and Development: A Review. Agronomy 2020, 10, 1975. [Google Scholar] [CrossRef]
  9. Verma, S.; Kumar, N.; Verma, A.; Singh, H.; Siddique, K.H.M.; Singh, N.P. Novel Approaches to Mitigate Heat Stress Impacts on Crop Growth and Development. Plant Physiol. Rep. 2020, 25, 627–644. [Google Scholar] [CrossRef]
  10. Jägermeyr, J.; Müller, C.; Ruane, A.C.; Elliott, J.; Balkovic, J.; Castillo, O.; Faye, B.; Foster, I.; Folberth, C.; Franke, J.A.; et al. Climate Impacts on Global Agriculture Emerge Earlier in New Generation of Climate and Crop Models. Nat. Food 2021, 2, 873–885. [Google Scholar] [CrossRef]
  11. Trnka, M.; Hlavinka, P.; Semenov, M.A. Adaptation Options for Wheat in Europe Will Be Limited by Increased Adverse Weather Events under Climate Change. J. R. Soc. Interface 2015, 12, 20150721. [Google Scholar] [CrossRef] [PubMed]
  12. Hatfield, J.L.; Prueger, J.H. Temperature Extremes: Effect on Plant Growth and Development. Weather Clim. Extrem. 2015, 10, 4–10. [Google Scholar] [CrossRef]
  13. Sánchez, B.; Rasmussen, A.; Porter, J.R. Temperatures and the Growth and Development of Maize and Rice: A Review. Glob. Chang Biol. 2014, 20, 408–417. [Google Scholar] [CrossRef]
  14. Hwang, H.; An, S.; Pham, M.D.; Cui, M.; Chun, C. The Combined Conditions of Photoperiod, Light Intensity, and Air Temperature Control the Growth and Development of Tomato and Red Pepper Seedlings in a Closed Transplant Production System. Sustainability 2020, 12, 9939. [Google Scholar] [CrossRef]
  15. Charalampopoulos, I.; Droulia, F. Frost Conditions Due to Climate Change in South-Eastern Europe via a High-Spatiotemporal-Resolution Dataset. Atmosphere 2022, 13, 1407. [Google Scholar] [CrossRef]
  16. Charalampopoulos, I.; Droulia, F.; Evans, J. The Bioclimatic Change of the Agricultural and Natural Areas of the Adriatic Coastal Countries. Sustainability 2023, 15, 4867. [Google Scholar] [CrossRef]
  17. Fraga, H.; Malheiro, A.C.; Moutinho-Pereira, J.; Santos, J.A. An Overview of Climate Change Impacts on European Viticulture. Food Energy Secur. 2012, 1, 94–110. [Google Scholar] [CrossRef]
  18. Venios, X.; Korkas, E.; Nisiotou, A.; Banilas, G. Grapevine Responses to Heat Stress and Global Warming. Plants 2020, 9, 1754. [Google Scholar] [CrossRef]
  19. Tomasi, D.; Jones, G.V.; Giust, M.; Lovat, L.; Gaiotti, F. Grapevine Phenology and Climate Change: Relationships and Trends in the Veneto Region of Italy for 1964–2009. Am. J. Enol. Vitic. 2011, 62, 329–339. [Google Scholar] [CrossRef]
  20. McMaster, G.S.; Wilhelm, W.W. Growing Degree-Days: One Equation, Two Interpretations. Agric. For. Meteorol. 1997, 87, 291–300. [Google Scholar] [CrossRef]
  21. Wang, J.Y. A Critique of the Heat Unit Approach to Plant Response Studies. Ecology 1960, 41, 785–790. [Google Scholar] [CrossRef]
  22. Grigorieva, E.A.; Matzarakis, A.; Freitas, C.R. de Analysis of Growing Degree-Days as a Climate Impact Indicator in a Region with Extreme Annual Air Temperature Amplitude. Clim. Res. 2010, 42, 143–154. [Google Scholar] [CrossRef]
  23. Matzarakis, A.; Ivanova, D.; Balafoutis, C.; Makrogiannis, T. Climatology of Growing Degree Days in Greece. Clim. Res. 2007, 34, 233–240. [Google Scholar] [CrossRef]
  24. Paparrizos, S.; Matzarakis, A. Present and Future Assessment of Growing Degree Days over Selected Greek Areas with Different Climate Conditions. Meteorol. Atmos. Phys. 2017, 129, 453–467. [Google Scholar] [CrossRef]
  25. Réaumur, R.A.F. Observations du thermomètre, faites à Paris pendant l’année 1735. Mém. Acad. R. Sci. 1735, 545–576. [Google Scholar]
  26. Arnold, C.Y. Maximum-Minimum Temperatures as a Basis for Computing Heat Units. Proc. Am. Soc. Hortic. Sci. 1960, 76, 682–692. [Google Scholar]
  27. Baskerville, G.L.; Emin, P. Rapid Estimation of Heat Accumulation from Maximum and Minimum Temperatures. Ecology 1969, 50, 514–517. [Google Scholar] [CrossRef]
  28. Gilmore, E.C.; Rogers, J.S. Heat Units as a Method of Measuring Maturity in Corn. Agron. J. 1958, 50, 611–615. [Google Scholar] [CrossRef]
  29. Jones, G.V.; Davis, R.E. Climate Influences on Grapevine Phenology, Grape Composition, and Wine Production and Quality for Bordeaux, France. Am. J. Enol. Vitic. 2000, 51, 249–261. [Google Scholar] [CrossRef]
  30. Koufos, G.; Mavromatis, T.; Koundouras, S.; Fyllas, N.M.; Jones, G.V. Viticulture–Climate Relationships in Greece: The Impacts of Recent Climate Trends on Harvest Date Variation. Int. J. Climatol. 2014, 34, 1445–1459. [Google Scholar] [CrossRef]
  31. Meier, N.; Rutishauser, T.; Pfister, C.; Wanner, H.; Luterbacher, J. Grape Harvest Dates as a Proxy for Swiss April to August Temperature Reconstructions Back to AD 1480. Geophys. Res. Lett. 2007, 34, 20705. [Google Scholar] [CrossRef]
  32. Walther, A.; Linderholm, H.W. A Comparison of Growing Season Indices for the Greater Baltic Area. Int. J. Biometeorol. 2006, 51, 107–118. [Google Scholar] [CrossRef]
  33. Graczyk, D.; Kundzewicz, Z.W. Changes of Temperature-Related Agroclimatic Indices in Poland. Theor. Appl. Climatol. 2016, 124, 401–410. [Google Scholar] [CrossRef]
  34. Vitasse, Y.; Rebetez, M. Unprecedented Risk of Spring Frost Damage in Switzerland and Germany in 2017. Clim. Change 2018, 149, 233–246. [Google Scholar] [CrossRef]
  35. Wolfe, D.W.; Schwartz, M.D.; Lakso, A.N.; Otsuki, Y.; Pool, R.M.; Shaulis, N.J. Climate Change and Shifts in Spring Phenology of Three Horticultural Woody Perennials in Northeastern USA. Int. J. Biometeorol. 2005, 49, 303–309. [Google Scholar] [CrossRef]
  36. Feng, S.; Hu, Q. Changes in Agro-Meteorological Indicators in the Contiguous United States: 1951–2000. Theor. Appl. Climatol. 2004, 78, 247–264. [Google Scholar] [CrossRef]
  37. Terando, A.; Easterling, W.E.; Keller, K.; Easterling, D.R. Observed and Modelled Twentieth-Century Spatial and Temporal Patterns of Selected Agro-Climate Indices in North America. J. Clim. 2012, 25, 473–490. [Google Scholar] [CrossRef]
  38. Zhang, X.; Wang, L.; Fang, J.; Piao, S.; Zhu, B. Spatiotemporal Changes of Agroclimatic Resources in China under Global Warming during 1951–2010. Chin. Sci. Bull. 2013, 58, 1642–1650. [Google Scholar]
  39. Webb, L.B.; Whetton, P.H.; Bhend, J.; Darbyshire, R.; Briggs, P.R.; Barlow, E.W.R. Earlier Wine-Grape Ripening Driven by Climatic Warming and Drying and Management Practices. Nat. Clim. Change 2012, 2, 259–264. [Google Scholar] [CrossRef]
  40. Jones, G.V.; White, M.A.; Cooper, O.R.; Storchmann, K. Climate Change and Global Wine Quality. Clim. Change 2005, 73, 319–343. [Google Scholar] [CrossRef]
  41. Fraga, H.; Malheiro, A.C.; Moutinho-Pereira, J.; Santos, J.A. Future Scenarios for Viticultural Zoning in Europe: Ensemble Projections and Uncertainties. Int. J. Biometeorol. 2013, 57, 909–925. [Google Scholar] [CrossRef]
  42. van Leeuwen, C.; Destrac-Irvine, A. Modified Grape Composition under Climate Change Conditions Requires Adaptations in the Vineyard. OENO One 2017, 51, 147–154. [Google Scholar] [CrossRef]
  43. Santos, J.A.; Malheiro, A.C.; Pinto, J.G.; Jones, G.V. Macroclimate and Viticultural Zoning in Europe: Observed Trends and Atmospheric Forcing. Clim. Res. 2012, 51, 89–103. [Google Scholar] [CrossRef]
  44. Charalampopoulos, I.; Droulia, F.; Kokkoris, I.P.; Dimopoulos, P. Future Bioclimatic Change of Agricultural and Natural Areas in Central Europe: An Ultra-High Resolution Analysis of the De Martonne Index. Water 2023, 15, 2563. [Google Scholar] [CrossRef]
  45. Fraga, H.; Santos, J.A.; Moutinho-Pereira, J.; Carlos, C.; Silvestre, J.; Eiras-Dias, J.; Mota, T.; Malheiro, A.C. Statistical Modelling of Grapevine Phenology in Portuguese Wine Regions: Observed Trends and Climate Change Projections. J. Agric. Sci. 2016, 154, 795–811. [Google Scholar] [CrossRef]
  46. Fuentes, S.; Sullivan, W.; Tilbrook, J.; Tyerman, S. A Novel Analysis of Grapevine Berry Tissue Demonstrates a Variety-Dependent Correlation between Tissue Vitality and Berry Shrivel. Aust. J. Grape Wine Res. 2010, 16, 327–336. [Google Scholar] [CrossRef]
  47. Oteros, J.; García-Mozo, H.; Vázquez, L.; Mestre, A.; Domínguez-Vilches, E.; Galán, C. Modelling Olive Phenological Response to Weather and Topography. Agric. Ecosyst. Environ. 2013, 179, 62–68. [Google Scholar] [CrossRef]
  48. Orlandi, F.; Msallem, M.; Bonofiglio, T.; Ben Dhiab, A.; Sgromo, C.; Romano, B.; Fornaciari, M. Relationship between Olive Flowering and Latitude in Two Mediterranean Countries (Italy and Tunisia). Theor. Appl. Climatol. 2010, 102, 265–273. [Google Scholar] [CrossRef]
  49. Charalampopoulos, I.; Droulia, F. The Agro-Meteorological Caused Famines as an Evolutionary Factor in the Formation of Civilisation and History: Representative Cases in Europe. Climate 2021, 9, 5. [Google Scholar] [CrossRef]
  50. International Organization of Vine and WIne Distribution of the World’s Grapevine Varieties; Paris, France, 2017; ISBN 979-10-91799-89-8.
  51. Charalampopoulos, I.; Polychroni, I.; Droulia, F.; Nastos, P.T. The Spatiotemporal Evolution of the Growing Degree Days Agroclimatic Index for Viticulture over the Northern Mediterranean Basin. Atmosphere 2024, 15, 485. [Google Scholar] [CrossRef]
  52. Fraga, H.; Pinto, J.G.; Viola, F.; Santos, J.A. Climate Change Projections for Olive Yields in the Mediterranean Basin. Int. J. Climatol. 2020, 40, 769–781. [Google Scholar] [CrossRef]
  53. Santos, J.A.; Fraga, H.; Malheiro, A.C.; Moutinho-Pereira, J.; Dinis, L.-T.; Correia, C.; Moriondo, M.; Leolini, L.; Dibari, C.; Costafreda-Aumedes, S.; et al. A Review of the Potential Climate Change Impacts and Adaptation Options for European Viticulture. Appl. Sci. 2020, 10, 3092. [Google Scholar] [CrossRef]
  54. Charalampopoulos, I.; Polychroni, I.; Psomiadis, E.; Nastos, P. Spatiotemporal Estimation of the Olive and Vine Cultivations’ Growing Degree Days in the Balkans Region. Atmosphere 2021, 12, 148. [Google Scholar] [CrossRef]
  55. Charalampopoulos, I. Agrometeorological Conditions and Agroclimatic Trends for the Maize and Wheat Crops in the Balkan Region. Atmosphere 2021, 12, 671. [Google Scholar] [CrossRef]
  56. Muñoz-Sabater, J.; Dutra, E.; Agustí-Panareda, A.; Albergel, C.; Arduini, G.; Balsamo, G.; Boussetta, S.; Choulga, M.; Harrigan, S.; Hersbach, H.; et al. ERA5-Land: A State-of-the-Art Global Reanalysis Dataset for Land Applications. Earth Syst. Sci. Data 2021, 13, 4349–4383. [Google Scholar] [CrossRef]
  57. Büttner, G. CORINE Land Cover and Land Cover Change Products. In Land Use and Land Cover Mapping in Europe; Manakos, I., Braun, M., Eds.; Remote Sensing and Digital Image Processing; Springer Netherlands, 2014; pp. 55–74. Manakos, I., Braun, M., Eds.; ISBN 978-94-007-7968-6.
  58. Charalampopoulos, I. The R Language as a Tool for Biometeorological Research. Atmosphere 2020, 11, 682. [Google Scholar] [CrossRef]
  59. Hijmans, R.J.; Bivand, R.; Forner, K.; Ooms, J.; Pebesma, E.; Sumner, M.D. Terra: Spatial Data Analysis. Available online: https://CRAN.R-project.org/package=terra (accessed on 7 July 2022).
  60. Klik, M. Fst: Lightning Fast Serialization of Data Frames. Available online: https://cran.r-project.org/web/packages/fst/index.html (accessed on 29 April 2026).
  61. Wickham, H. The Tidyverse. Available online: https://www.tidyverse.org/ (accessed on 15 April 2023).
  62. Yilmaz, M. Accuracy Assessment of Temperature Trends from ERA5 and ERA5-Land. Sci. Total Environ. 2023, 856, 159182. [Google Scholar] [CrossRef] [PubMed]
  63. Xu, C.; Wang, W.; Hu, Y.; Liu, Y. Evaluation of ERA5, ERA5-Land, GLDAS-2.1, and GLEAM Potential Evapotranspiration Data over Mainland China. J. Hydrol. Reg. Stud. 2024, 51, 101651. [Google Scholar] [CrossRef]
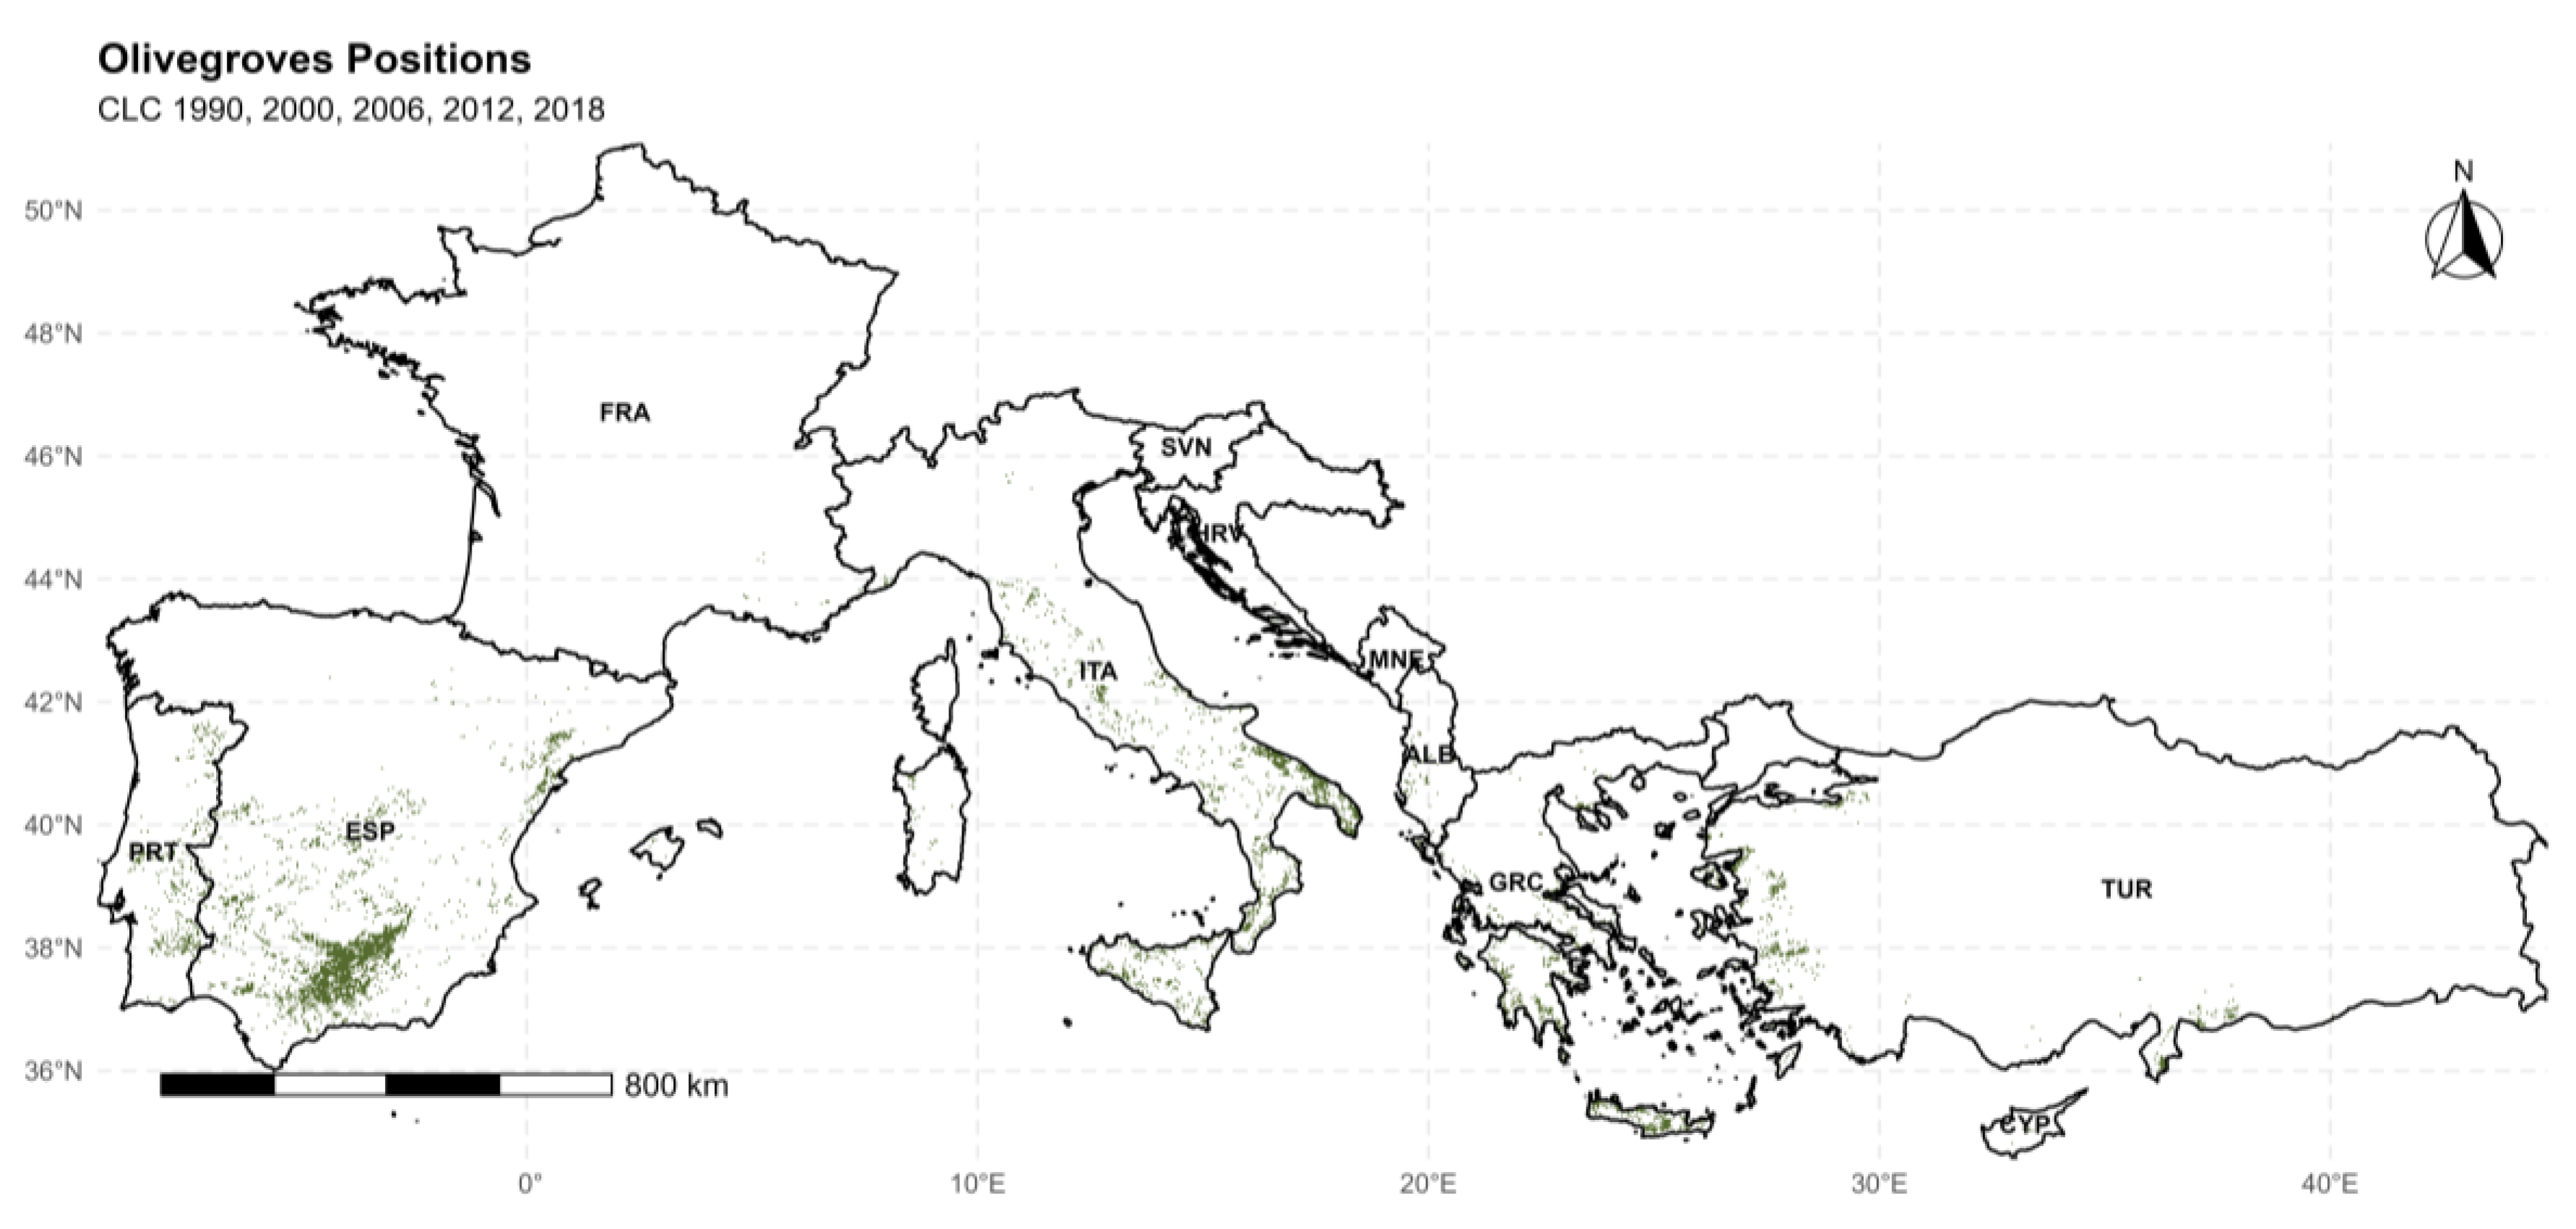
Figure 1. Spatial distribution of olive grove (Olea europaea L.) cultivation areas across the study domain, as delineated by the Corine Land Cover (CLC) datasets for the reference years 1990, 2000, 2006, 2012, and 2018. The colored areas indicates the positions of the cultivation. Country codes follow ISO 3166-1 alpha-3 standard.
Preprints 211635 g001
Figure 2. Spatial distribution of vineyard (Vitis vinifera L.) cultivation areas across the study domain, as delineated by the Corine Land Cover (CLC) datasets for the reference years 1990, 2000, 2006, 2012, and 2018. The colored areas indicates the positions of the cultivation. Country codes follow ISO 3166-1 alpha-3 standard.
Preprints 211635 g002
Figure 3. Boxplot distributions of Growing Degree Days (GDD) for olive (Olea europaea L.) cultivation across nine Mediterranean countries (ALB: Albania, CYP: Cyprus, ESP: Spain, FRA: France, GRC: Greece, HRV: Croatia, ITA: Italy, PRT: Portugal, TUR: Turkey) for the reference years 1990, 2000, 2006, 2012, and 2018. The red horizontal line denotes the long-term median. Annotated values represent long-term median GDD per country.
Preprints 211635 g003
Figure 4. Boxplot of GDD values (GDD Units) for olive (Olea europaea L.) cultivation per country for the reference year 1990 (Olive GDD – CLC 1990). Median GDD values are annotated on each box.
Preprints 211635 g004
Figure 5. Boxplot of GDD values (GDD Units) for olive cultivation per country for the reference year 2000 (Olive GDD – CLC 2000). Median GDD values are annotated on each box.
Preprints 211635 g005
Figure 6. Boxplot of GDD values (GDD Units) for olive cultivation per country for the reference year 2006 (Olive GDD – CLC 2006). Median GDD values are annotated on each box.
Preprints 211635 g006
Figure 7. Boxplot of GDD values (GDD Units) for olive cultivation per country for the reference year 2012 (Olive GDD – CLC 2012). Median GDD values are annotated on each box.
Preprints 211635 g007
Figure 8. Boxplot of GDD values (GDD Units) for olive cultivation per country for the reference year 2018 (Olive GDD – CLC 2018). Median GDD values are annotated on each box.
Preprints 211635 g008
Figure 9. Boxplot distributions of Growing Degree Days (GDD) for vineyard (Vitis vinifera L.) cultivation across 22 European countries for the reference years. Country codes: ALB: Albania, AUT: Austria, BGR: Bulgaria, BIH: Bosnia and Herzegovina, CHE: Switzerland, CYP: Cyprus, CZE: Czech Republic, DEU: Germany, ESP: Spain, FRA: France, GRC: Greece, HRV: Croatia, HUN: Hungary, ITA: Italy, LUX: Luxembourg, MKD: North Macedonia, PRT: Portugal, ROU: Romania, SRB: Serbia, SVK: Slovakia, SVN: Slovenia, TUR: Turkey. The red horizontal line denotes the long-term median. Annotated values represent long-term median GDD per country.
Preprints 211635 g009
Figure 10. Boxplot of GDD values (GDD Units) for vineyard (Vitis vinifera L.) cultivation per country for the reference year 1990 (Vine GDD – CLC 1990). Median GDD values are annotated on each box.
Preprints 211635 g010
Figure 11. Boxplot of GDD values (GDD Units) for vineyard cultivation per country for the reference year 2000 (Vine GDD – CLC 2000). Median GDD values are annotated on each box.
Preprints 211635 g011
Figure 12. Boxplot of GDD values (GDD Units) for vineyard cultivation per country for the reference year 2006 (Vine GDD – CLC 2006). Median GDD values are annotated on each box.
Preprints 211635 g012
Figure 13. Boxplot of GDD values (GDD Units) for vineyard cultivation per country for the reference year 2012 (Vine GDD – CLC 2012). Median GDD values are annotated on each box.
Preprints 211635 g013
Figure 14. Boxplot of GDD values (GDD Units) for vineyard cultivation per country for the reference year 2018 (Vine GDD – CLC 2018). Median GDD values are annotated on each box.
Preprints 211635 g014
Table 1. Mean Growing Degree Days (GDD, °C·d, base temperature 10 °C) for olive (Olea europaea L.) cultivation per country and Corine Land Cover (CLC) reference year (1990–2018). Trend significance assessed by linear regression (p < 0.05). R2: coefficient of determination of linear fit. Slope: trend estimator (GDD yr−1). Sig.: statistically significant (p < 0.05); Not Sig.: not significant; Inconclusive: insufficient data points for reliable trend estimation. —: no CLC olive grove data available.
Country Mean GDD per Reference Year Mean Trend Significance R2 Slope (GDD yr−1)
1990 2000 2006 2012 2018
ESP 666.5 739.4 726.6 740.2 810.2 736.6 Sig. 0.824 4.29
FRA 411.5 475.6 492.5 491.6 509.8 476.2 Sig. 0.863 3.27
GRC 784.9 780.2 818.5 862.4 895.3 828.3 Sig. 0.850 4.25
HRV 600.3 623.2 672.2 691.6 668.9 651.2 Not Sig. 0.765 3.07
ITA 656.2 673.8 701.2 724.3 737.1 698.5 Sig. 0.974 3.08
MNE 525.3 561.4 571.8 588.3 587.7 566.9 Sig. 0.924 2.30
PRT 849.9 906.7 881.6 926.9 992.7 911.6 Sig. 0.801 4.44
TUR 650.7 658.2 680.0 715.2 764.8 693.8 Sig. 0.859 4.02
ALB 630.9 710.6 707.7 713.9 690.8 Not Sig. 0.631 4.10
CYP 1155.2 1218.2 1226.7 1257.1 1214.3 Not Sig. 0.898 5.23
SVN 546.5 538.1 542.3 Inconclusive 1.000 −1.41
Table 2. Mean Growing Degree Days (GDD, °C·d, base temperature 10 °C) for vineyard (Vitis vinifera L.) cultivation per country and Corine Land Cover (CLC) reference year (1990–2018). Trend significance assessed by linear regression (p < 0.05). R2: coefficient of determination of linear fit. Slope: trend estimator (GDD yr−1). Sig.: statistically significant (p < 0.05); Not Sig.: not significant. —: no CLC vineyard data available.
Country Mean GDD per Reference Year Mean Trend Significance R2 Slope (GDD yr−1)
1990 2000 2006 2012 2018
AUT 1244.5 1252.4 1309.1 1361.6 1491.1 1331.7 Sig. 0.823 8.46
BGR 1628.7 1676.8 1716.7 1799.6 1872.9 1738.9 Sig. 0.944 8.76
BIH 1348.2 1437.1 1518.4 1580.1 1796.0 1536.0 Sig. 0.905 14.89
CHE 941.8 361.7 452.9 730.9 873.2 672.1 Not Sig. 0.001 0.67
CZE 1237.5 1244.2 1312.3 1366.1 1479.0 1327.8 Sig. 0.855 8.51
DEU 1060.6 1104.5 1175.8 1181.2 1374.3 1179.3 Sig. 0.816 10.03
ESP 1965.0 2048.0 2102.8 2168.9 2310.2 2119.0 Sig. 0.942 11.70
FRA 1617.2 1694.4 1731.0 1719.7 1932.8 1739.0 Not Sig. 0.762 9.44
GRC 2242.3 2230.3 2276.1 2364.7 2382.8 2299.2 Sig. 0.797 5.80
HRV 1709.3 1720.1 1764.8 1803.7 1921.9 1784.0 Sig. 0.814 7.15
HUN 1527.2 1536.7 1623.3 1694.0 1766.3 1629.5 Sig. 0.906 9.01
ITA 2081.6 2117.0 2112.1 2073.6 2218.0 2120.5 Not Sig. 0.376 3.27
LUX 869.4 921.8 976.4 960.7 1158.3 977.3 Not Sig. 0.763 8.81
PRT 1710.7 1740.2 1789.6 1816.4 1920.5 1795.5 Sig. 0.889 7.07
ROU 1471.7 1522.3 1632.9 1716.9 1750.2 1618.8 Sig. 0.955 10.88
SRB 1672.3 1666.2 1696.8 1743.2 1791.3 1714.0 Sig. 0.810 4.39
SVK 1277.1 1313.8 1388.2 1447.8 1568.4 1399.1 Sig. 0.917 10.21
SVN 1335.9 1373.8 1432.2 1482.1 1575.7 1439.9 Sig. 0.935 8.41
TUR 2143.2 2182.8 2416.6 2545.5 2633.4 2384.3 Sig. 0.925 19.25
ALB 1733.3 1807.5 1907.3 2016.5 1866.2 Sig. 0.993 15.83
CYP 2552.1 2593.6 2634.2 2691.0 2617.7 Sig. 0.993 7.62
MKD 2039.8 2116.2 2218.7 2261.6 2159.1 Sig. 0.978 12.80
Disclaimer/Publisher’s Note: The statements, opinions and data contained in all publications are solely those of the individual author(s) and contributor(s) and not of MDPI and/or the editor(s). MDPI and/or the editor(s) disclaim responsibility for any injury to people or property resulting from any ideas, methods, instructions or products referred to in the content.
Copyright: This open access article is published under a Creative Commons CC BY 4.0 license, which permit the free download, distribution, and reuse, provided that the author and preprint are cited in any reuse.
Prerpints.org logo

Preprints.org is a free preprint server supported by MDPI in Basel, Switzerland.

Subscribe

© 2026 MDPI (Basel, Switzerland) unless otherwise stated

Accessibility

Disclaimer

Terms of Use

Privacy Policy

Privacy Settings