Submitted:
30 April 2026
Posted:
02 May 2026
You are already at the latest version
Abstract
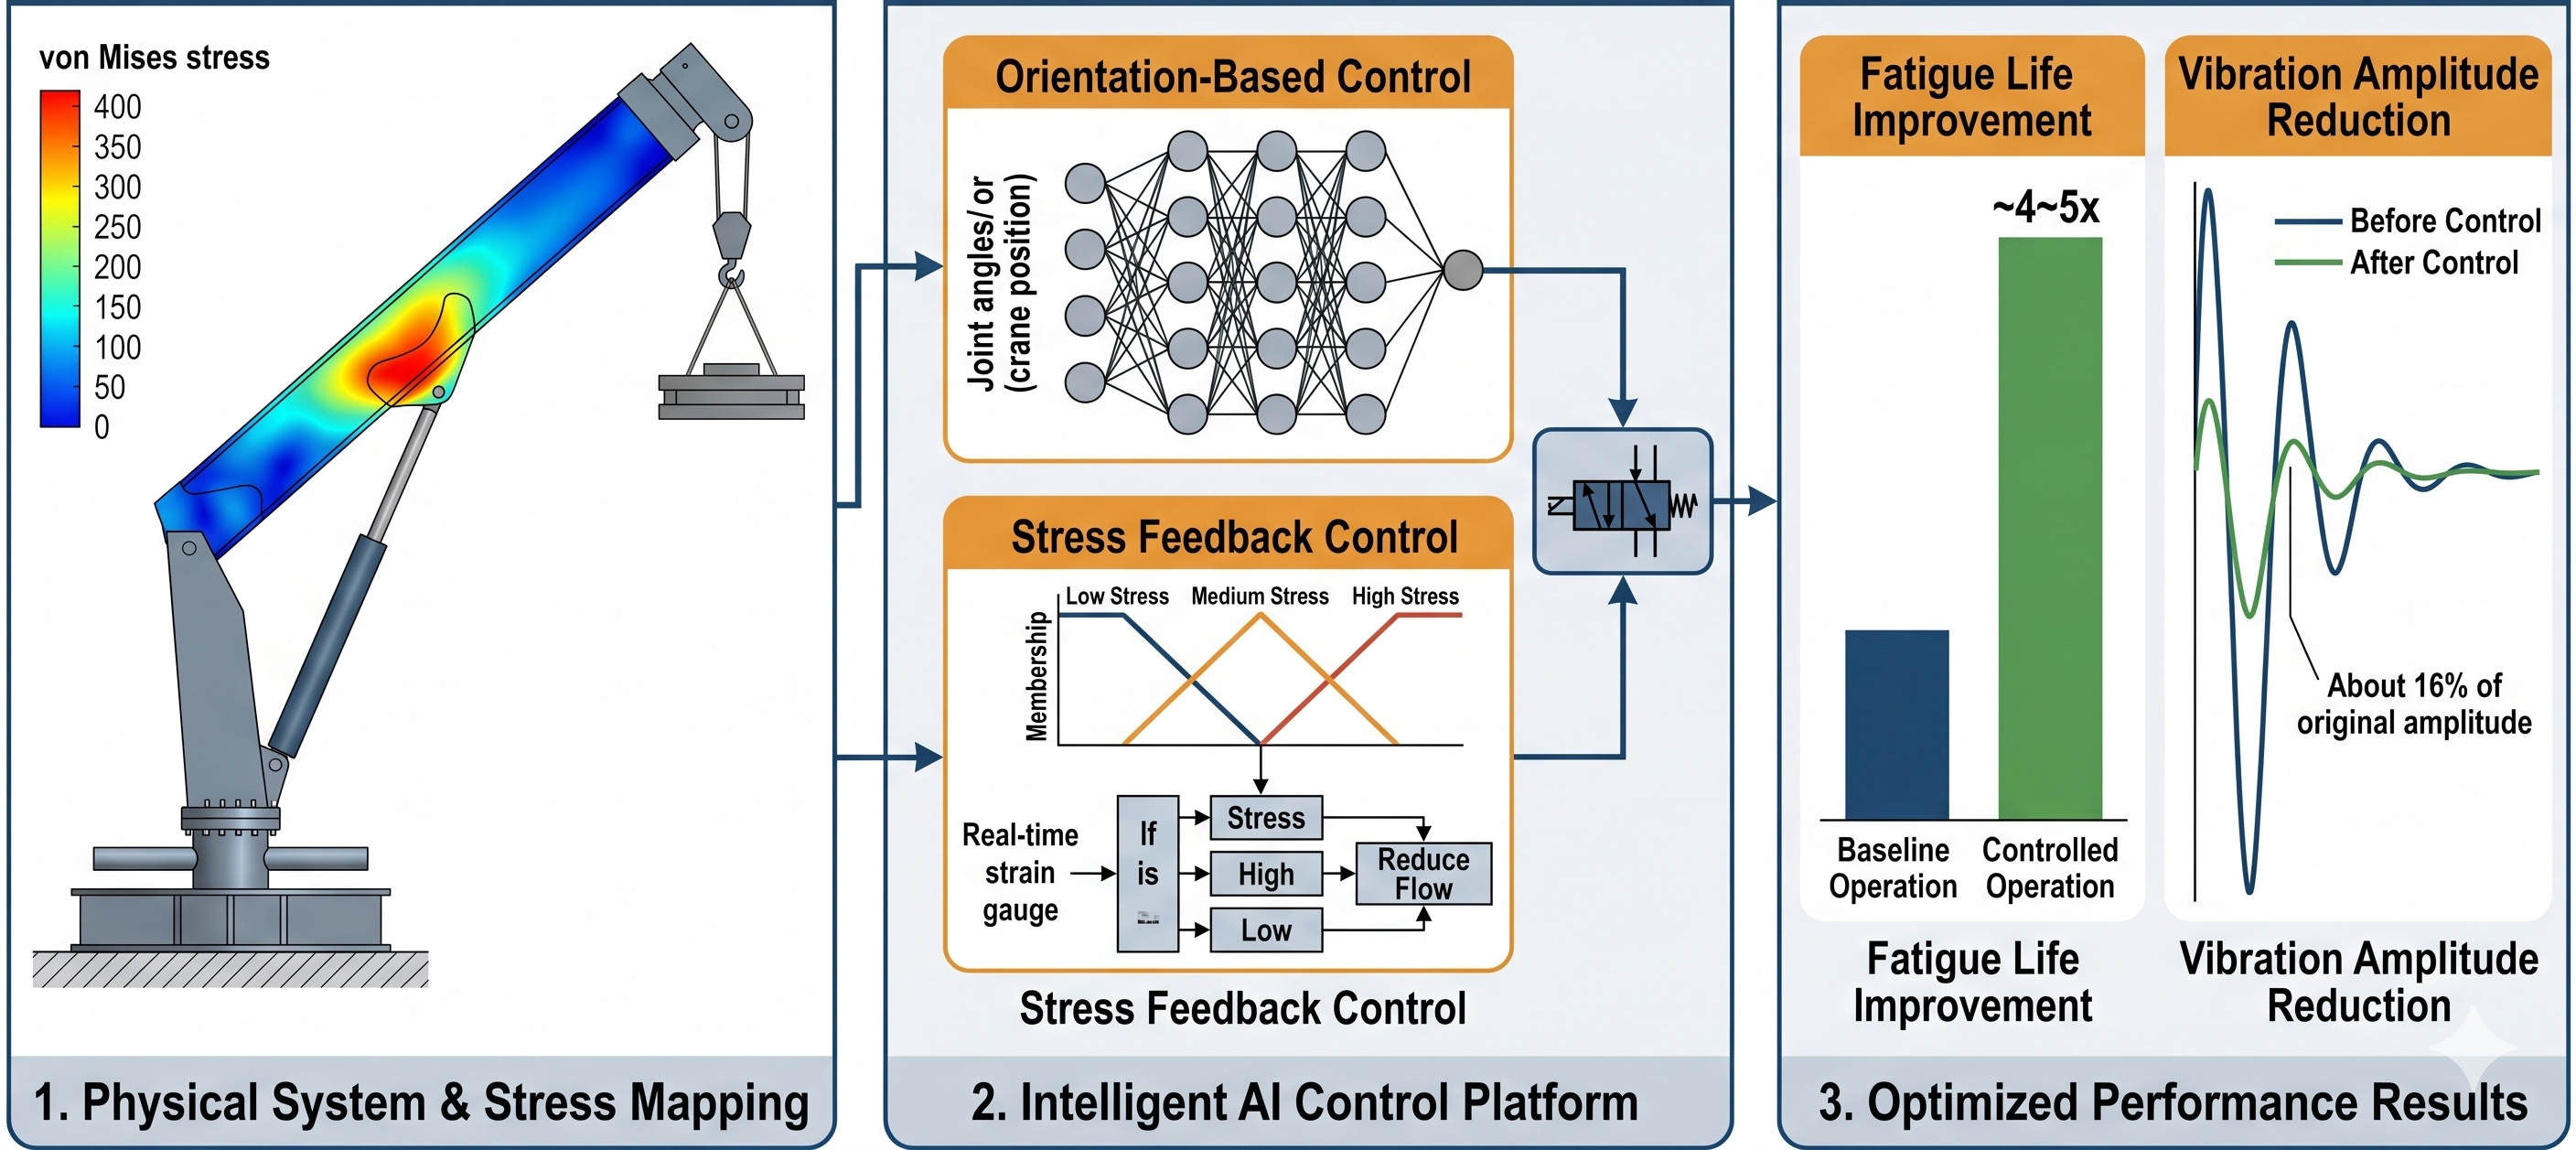
The objective of this research was to develop an intelligent stress mapping and a smart control platform, utilizing Artificial Intelligence (AI), to increase the fatigue life of a hydraulic crane. The crane's boom was modeled and co-simulated using ANSYS, ADAMS, and MATLAB. A flexible model of the boom was created in ANSYS and then exported to ADAMS. Stress analysis was performed using the maximum principal hotspot method and the von Mises yield criterion. Stress optimization was conducted using a Neural Network (NN) algorithm, which is a key implementation of AI in this study. Two control platforms, one based on Neural Networks and another on Fuzzy Logic, were designed to apply AI in controlling the crane's movements. The Neural Network algorithm optimized the crane's movement by adjusting velocity at critical positions where structural stress was high, while the fuzzy logic-based control algorithm utilized stress feedback from the crane's structure. Both AI-driven control algorithms were integrated into the physical crane in the lab, and extensive testing demonstrated a significant increase in the crane's fatigue life, along with effective damping of crane vibrations. This paper introduces a novel AI-driven approach combining Neural Networks and Fuzzy Logic for intelligent stress mapping and control, specifically tailored for hydraulic cranes. Unlike previous works, this research integrates real-time stress feedback into the control process and validates the algorithms through experimental implementation on a prototype crane, significantly improving its fatigue life.
Keywords:
intelligent control
; stress mapping
; fatigue life
; neural network algorithm
; fuzzy logic
; artificial intelligence in hydraulic crane
1. Introduction
Hydraulic cranes, also known as hydraulic booms, utilize hydraulic power to lift and move heavy loads. Consisted of a series of interconnected links and components, they enable precise control over the load’s movements, effectively dictating the position and/or speed of the loads. These cranes have become indispensable in diverse industries such as construction, manufacturing, shipping, forestry, and mining. Their appeal lies in their robustness, adaptability, and capacity to manage heavy loads with minimal inertia, shocks, and vibrations (Do et al., 2021); (Dong et al., 2016); (Shevchuk et al., 2021). However, given their rigorous operational conditions, the cranes’ structural elements are vulnerable to fatigue and stress over time. Such wear and tear can impact the crane’s functionality, structural integrity, stability and potentially leading to material decay, cracks or even catastrophic failures (Dong et al., 2016); (Buczkowski and Żyliński, 2021). While design of the components of a metal structure for a static loading application is a standardized process, optimizing the fatigue in a metal structure under dynamic loads, where stress levels fluctuate over time, presents significant challenges (Potakhov, 2022); (A. Lagerev and I. Lagerev, 2020). Consequently, study of the stresses in the components of a hydraulic crane and design and development of control strategies capable of reducing fatigue’s impacts becomes paramount. Recent innovations in crane controller design, utilizing advanced control methods such as model-based algorithms, adaptive control methods, and intelligent control strategies equipped with powerful optimization algorithms, have significantly enhanced crane precision, efficiency, and reliability. Notable examples include the use of Artificial Intelligence (AI) techniques like Neural Networks (NN), Fuzzy Logic (FL), and Genetic Algorithms (GA) (Mattila et al., 2017); (Roozbahani et al., 2021); (Komarov et al., 2023); (Chu et al., 2015). These AI-driven methodologies have enabled more sophisticated control mechanisms that respond intelligently to operational conditions, improving overall performance.
The key research question addressed in this study is: Can intelligent control strategies, utilizing AI techniques, effectively optimize stress patterns in hydraulic cranes to extend their fatigue life without compromising performance? This study particularly emphasizes the positive effects of applying AI, specifically Neural Networks and Fuzzy Logic, to the crane’s behavior and fatigue life. Neural Networks, with their ability to detect patterns in large datasets, have proven useful in optimizing crane behavior and predicting potential structural failure of the crane’s components. However, the performance of the Neural Network algorithm depends heavily on the robustness of the dataset, the training algorithm used, the quality of data, the architecture of the neural network, the training technique, and the available computational resources (Tuan et al., 2018); (Jensen et al., 2022). On the other hand, Fuzzy Logic provides a flexible framework for handling complex and uncertain scenarios, making it ideal for crane control system design. It enables effective pattern recognition of the data extracted from the crane’s structure, based on monitoring and analysis using trained algorithms developed from historical data. Fuzzy Logic also plays a crucial role in creating an intelligent optimal controller for the crane, with ease of deployment and transparency in its working process (Wonohadidjojo et al., 2013); (Hao and Kan, 2016); (Seo et al., 2020).
While many studies have focused on stress analysis in hydraulic cranes and have proposed intelligent control systems, the approach taken in this research remains relatively unexplored. Our aim is to investigate the fatigue patterns in a hydraulic crane and assess the feasibility of using AI-powered intelligent controls to improve its fatigue life. This article also discusses the co-simulation between ADAMS and MATLAB/Simulink, where the crane was modeled in ADAMS, and its parameters were integrated into MATLAB for co-simulation purposes, enhancing the overall system dynamics. A stress mapping algorithm, driven by a Neural Network, was developed, utilizing the Hot-Spot approximation method and Neural Network-based predictions to forecast stress distribution. Additionally, an intelligent control system was designed to prevent stress-induced fatigue without significantly impacting the crane’s operational speed and functionality.
Two AI-based control strategies were developed and implemented: one using a Neural Network algorithm and the other using Fuzzy Logic. These strategies were employed to optimize crane orientation and reduce vibration-induced stress in its structure. The developed control platform optimized the crane’s operation by preventing high-frequency vibrations that contribute to fatigue. Moreover, a real-time controller was employed to monitor and minimize stress during crane operation by utilizing data from multiple strain gauges. Movements of the crane’s hydraulic cylinders were optimized to the most stress-reducing positions and speeds, minimizing the impact of loads that lead to fatigue. To ensure optimal fatigue life, the crane was tested under various load scenarios. Several operational cycles with different control configurations and parameters were applied to evaluate the effectiveness of the AI-based control algorithms.
The primary contribution of this research lies in the development of a dual AI-based control strategy, applying Neural Networks for stress optimization and Fuzzy Logic for stress feedback control. These contributions represent a notable advancement in intelligent crane control, particularly by integrating real-time experimental validation and demonstrating substantial improvements in fatigue life.
1.1. Literature Review
So far, several studies have investigated structural fatigue of cranes due to stresses happen during operation and their control performance. In their study, Mikkola et al. investigated utilizing the ADAMS software for analysis of dynamic system simulation to achieve stress history in the ANSYS software. Rainflow analysis and fuzzy logics were used to perform the estimation of fatigue life with a comparison of results against strain gauge measurements on the physical crane. The authors reached the conclusion that the co-simulation methodology involving ANSYS and ADAMS software demonstrated high efficiency and accuracy in stress analysis (Mikkola, 2001).
Pedersen focused on enhancing the performance of loader cranes beyond current capabilities. The study encompassed fatigue of welded joints and control of mobile hydraulics, which are critical in a fatigue-prone welded structure subjected to significant dynamic loading due to hydraulic actuation control. To improve the fatigue performance of welded joints, the study established methods involving post-weld treatment and design optimization, particularly using the notch stress approach tailored to the specific conditions of loader cranes. The study investigated and developed a control scheme to limit dynamic peak loading during crane operation (Pedersen, 2011).
Zhidchenko et al. investigated the application of Internet of Things (IoT) and Digital Twin concepts for estimating the fatigue life of hydraulically actuated mobile working machines. The pressure and position data were solely used, which were provided during the operation of machine and processed in the Cloud. By combining IoT, Digital Twin models, and finite-element analysis the authors proposed an approach to calculate stress history and fatigue life estimation (Zhidchenko et al., 2020).
Zhao et al. studied the establishment of fatigue models to accurately predict the residual fatigue cycles and estimate the service life of a remanufactured excavator using a S-N curve, rainflow counting algorithm, and FEA model. The total stress cycles were calculated using Miner’s linear fatigue cumulative criterion, and the results enhanced the accuracy of estimating the remanufactured excavator beam’s residual service life, improving reliability and safety (Zhao et al., 2021).
The study conducted by Buczkowski and Zylinski focused on conducting a finite element fatigue analysis of an unsupported crane and evaluate the structural integrity and fatigue life of the crane under various loading conditions. By employing finite element analysis software ABAQUS, the authors simulate and analyze the stress distribution and fatigue damage accumulation in the crane’s components, highlighting critical areas prone to fatigue failure (Buczkowski and Żyliński, 2021).
Hectors et al. explored the application of fracture mechanics and hot spot stress-based approaches to estimate the fatigue life of a crane runway girder and identify critical areas prone to fatigue failure. The study focused on assessing the structural integrity and durability of the girder under cyclic loading conditions and provided a basis for optimizing their design and maintenance strategies (Hectors et al., 2022).
Li et al. investigated the dynamic impact of cranes during the lifting process and developed a dynamic model to explore load variations in crane structures due to the limitations of conventional quasi-static load methods in accurately predicting the fatigue life of cranes. A fatigue life prediction method that considers the lifting impact effect was proposed to analyze structural fatigue life and the lifting impact process (Li et al., 2023).
1.2. Hydraulic Crane Under Study
The hydraulic crane under study is illustrated in Figure 1 (Kotta, 2021). The crane is securely mounted on a stand, which is itself firmly fixed to the concrete floor of the laboratory hall. This construction ensures a friction-locked connection, preventing any swerving or deviation from the crane’s original position, thereby maintaining its precise and stable placement. The crane is constructed from steel FE-510, specifically S355 grade, and has 1080 kg maximum load capacity with 7.2 meters range. The crane consists of mechanical links, joints, tank, pump, filters, individual types of valves, and a double-acting cylinder with diameter of 100mm and piston diameter of 15mm and a hydraulic boom with dimensions of 4125-100-150mm.
2. System Modeling
In order to model the factors that determine the behavior of the crane, the crane has been simulated. The crane model was initially created in SolidWorks and subsequently imported into ADAMS, a widely used Multibody Dynamics (MBD) software, to incorporate various joints and consider hydraulic components within the ADAMS model. Schematic diagrams of full and simplified models of the crane, pillar, beam, hydraulic cylinder, and piston modeled in SolidWorks are shown in Figure 2.
Mathematical Model
Figure 3 illustrates the diagram of a double acting hydraulic actuator.
The force generated by the actuator is formulated by Eq. 1:
where p1 and p2 are the pressures on the piston and piston-rod, A1 and A2 are the areas of piston and piston-rod, and Fμ is the total friction force caused by sealing.
The attenuation of cylinder oscillations is predominantly governed by the frictional force arising from the interaction between the seal material and the cylinder wall. The hydraulic friction force can be described as the resultant of the pressure differential across the piston chambers and the piston’s velocity, formulated by Eq. 2. This factor significantly contributes to the suppression of vibrations within the cylinder.
where, ξ (ẋ) is the coulomb friction function and ƞ is the efficiency factor.
Volume flows are generated by the motion of the cylinder, which can be formulated as Eq. 3:
where and are the incoming and outgoing volume flow rates of the cylinder, and is the piston velocity.
The pressure (P) within a hydraulic volume can be mathematically described as a function of the effective bulk modulus (Be), the volume (V) of the hydraulic system, and the incoming and outgoing flows. This relationship can be expressed through the utilization of a differential equation, which is represented as Eq. 4:
where and is the sum of incoming and outgoing flows related to volume V1 and V2, respectively, H is the length of cylinder, and x is the piston position.
3. Co-Simulation
Co-simulation involves combining multiple simulation tools to simulate different aspects of the system simultaneously (Sosa-Méndez et al., 2017); (Ángel et al., 2012). Co-simulation between ADAMS and MATLAB/Simulink was performed in this study, the schematic of which is shown in Figure 4 (Agyemang, 2014).
The integration of the ADAMS block into the MATLAB/Simulink platform is accomplished automatically as part of the control system. The control system incorporates a proportional-integral-derivative (PID) controller, and the specific initial parameter values employed for the control system were determined as Kp=20, Ki=0.2, and Kd=0 to exhibit excellent performance. The positions, velocity, pressures, and hydraulic force results are illustrated in Figure 5, Figure 6, Figure 7, Figure 8, Figure 9 and Figure 10.
4. Stress Analysis
The stress analysis of the crane is highly influenced by the flexibility of the boom. Various methods can be used to obtain the flexibility of the boom (Li et al., 2015); (Trąbka, 2016). The most accurate model for stress analysis can be achieved through the finite element method (FEM). However, FEM imposes significant computational demands (Zhang et al., 2010); (Krukowski and Maczyński, 2013). In this study, two different approaches were employed to address the flexibility of the boom.
In the first method, the SolidWorks model was transferred to ANSYS software to evaluate the boom’s flexibility prior to incorporating it into the ADAMS model. Strain gauges were applied to marked points on the real boom, and these points were measured and modeled as nodes in ANSYS. Due to computational limitations, only a subset of nodes (approximately 100) was utilized in the Ansys Software, although the complete set of nodes was not feasible to employ. ANSYS generated a finite element model of the boom using ADAMS macros, which required a modal neutral file (MNF file) containing information about the flexibility of the body. A fine meshing technique was employed to ensure accurate results. Key points along the central axis were established to generate corresponding nodes with six degrees of freedom. Specifically, two nodes were created to accommodate the dual joints or hinges of the boom. Subsequently, all the nodes were selected to generate the output neutral file of the boom. The modal neutral file (MNF) was then exported directly to ADAMS software. In the second method, the flexibility of the boom was directly assessed within ADAMS. Flexible bodies in ADAMS were created by transforming rigid bodies based on MNF- based flexible bodies. The flexible body can be directly created using discrete links in the model, which contains essential information such as material type, number of segments, damping ratio, and cross-section details. The created flexible beam in ANSYS and ADAMS are illustrated in Figure 11 (Agyemang, 2014).
The structural stress and its fatigue resistance is influenced by material properties, geometric characteristics, and loading parameters. The hot spot stress method is recognized for its efficiency and its ability to provide a straightforward distribution of structural stress (Seo et al., 2010); (Wang et al., 2010). In this approach, the critical location with the highest stress concentration is identified in the crane. This method is primarily used when the weld of interest is subjected to nearly perpendicular varying stresses, and the crack can be assumed to originate from defects within the weld. The method is highly valuable when the crane does not correspond to any known cases based on the nominal stress method. The approach has been incorporated into the European standard SFS-ENV 1993-1-1 and the latest IIW recommendations. The method determines the hot spot stress, which includes the effects of both macro geometric and structural discontinuities. The hot spot stress can be measured from a prototype, calculated from a Finite Element (FEM) model, or estimated from nominal stress variations. In this study, the stresses were achieved through co-simulation in Adams and the real crane in the lab. The data collected from the lab experiments were used to train the model as well as to validate the co-simulation model. Table 1 presents the top ten hot spots calculated based on maximum principal stress. The highest hot spot for maximum principal stress occurred at node 480, with a corresponding value of 113.133 MPa. Figure 12 shows the simulated maximum principal stresses (Agyemang, 2014).
The von Mises yield criterion was also utilized for stress analysis and the ten hot spots for von Mises stresses were analyzed (Machado et al., 2022); (Yu et al., 2020). The maximum hot spot von Mises stress was estimated as 112.546 MPa. Table 2 presents the calculated values for the ten hot spots for von Mises stresses and Figure 13 illustrates the simulated results for the hot spot Von Mises Stresses. Notably, the maximum hot spot for von Mises stress was lower than the maximum principal stress, with values of 112.546 MPa and 113.133 MPa, respectively. The maximum von Mises stress was selected for further analysis in the neural network due to the material composition of the boom, which was made of steel. Principal stresses were deemed unsuitable for the analysis, as they are not well-suited for ductile materials.
Based on these stress analyses, the critical location with regard to potential fatigue was identified as the area depicted in Figure 14. This particular location experiences the highest principal stresses during different operation cycles. Additionally, the selected region of the lifting boom, which is often under scrutiny, contains welded hydraulic pipe fixtures, leading to stress concentrations and significant fatigue-prone initial cracks. The stress histories obtained from simulations depict the nominal normal stresses along the longitudinal axis of the boom at the analysis point.
Based on the performed stress analysis, stress optimization process was also carried out. Neural network (NN) was used for this purpose. Following the successful training of the neural network using the hot spot approximation demonstrated in Figure 15, the results presented in Figure 17 and Figure 18 were obtained. Figure 16 displays the Neural Network training error and its convergence. In Figure 18, a comparison is made between the von Mises stress generated by an ADAMS model and the estimated approximation of hot spot stress using a Neural Network. The efficacy of the network’s training is evident from the obtained results. The forecast for the network’s future development is depicted in Figure 19.
Figure 16.
The best validation performance in Matlab using the feedforward backpropagation algorithm with 10,000 training epochs.
Figure 16.
The best validation performance in Matlab using the feedforward backpropagation algorithm with 10,000 training epochs.

Figure 17.
Neural Network (NN) training error.

Figure 18.
Von Mises Stress simulated from ADAMS and Neural Network (NN).

Figure 19.
Regression to predict the future of the network.

5. Control Algorithms
Another aim of this study was to explore the applicability of intelligent control systems in verifying the fatigue endurance of the crane. Intelligent control should protect the boom from vibrations-based stresses leading to fatigue while causing minimal impact on the crane’s typical performance. The influence of the control system on work efficiency was one of the important aspects that was considered in the development of the control system. Therefore, the control algorithm was programmed to engage selectively within a specific operational range, where the resultant loads exert a substantial impact on fatigue endurance. This design approach aimed to minimize the incidence of elevated stress peaks in the stress history. Neural network (NN) and fuzzy logic were applied as intelligent control systems in this study, which have been implemented through two principled approaches. In one method, the instruction to the valve is restricted based on the orientation of the crane, while in the other method, the instruction to the valve is restricted or modified based on the prevailing stress state in the lifting boom. These algorithms can also be integrated and utilized to benefit from the characteristics of both approaches.
5.1. Orientation Feedback Control
The operation of the first developed orientation feedback control method is based on restricting the control signal to the valves according to the crane’s position, which decreases the volumetric flow through the valve in sensitive places leading to lower velocities of the crane’s cylinders and the force obtained from them, and thereby limiting the stresses on the crane due to inertial effects.
Neural network was employed to restrict the control signal because of its capability to handle large existing datasets effectively. The training data for the neural network was generated using the simulation model by dividing the motion range of the lifting and folding cylinder into 20 segments. The corresponding static solutions for each combination of the cylinder lengths were calculated, the results of which included the cylinder stroke lengths and the stress values at the selected point of interest. Thus, the influence of the crane’s position on the resulting stress states was determined. The obtained stress values were scaled to coefficients ranging from 0 to 1, representing the cruciality of each crane’s position, which were used as training data for a feedforward perceptron network with three layers. The magnitude of the coefficient corresponding to the crane’s position is shown in Figure 20, where surface values are produced by the neural network from independent inputs and circles demonstrate measured points from the training data. By amplifying or reducing the coefficient generated by the neural network, relative to the maximum attainable value of the control signal, the upper limit of the control signal is determined. The simulation model of the controller was implemented using MATLAB/Simulink.
The valve opening restriction based on the crane’s orientation was tested during an operation cycle, where the crane followed the work sequence depicted in Figure 21. In the first movement of the operation cycle, the lifting cylinder is used to raise the lifting boom to an upright position. Next, the folding cylinder is engaged to rotate the folding boom to approximately a 90-degree angle relative to the lifting boom. After that, the lifting cylinder is used to lower the lifting boom. Finally, the folding cylinder is activated to unfold the folding boom outward.
The functionality of the controller was verified by considering the restriction of the valve opening in the increased rise time of the cylinder stroke length and decreased crane vibrations in the stopping phase, as shown in Figure 22.
The extent of the opening limitation, the maximum value of the valve’s control signal, and the period required for the valve to achieve the desired position are evident in the control signal fed to the valve, as presented in Figure 23.
Throughout the operation cycle, the stress history at the selected point follows the pattern shown in Figure 24, which demonstrates that the controller has a reducing effect on vibrations based stresses leading to fatigue. To evaluate the magnitude of this effect, constant amplitude equivalent stress variations were calculated from the stress histories, resulting in the values presented in Table 3.
The influence of the controller on the fatigue life was compared using the characteristic fatigue life, which is attained by comparing the equivalent stress fluctuation to the FAT 103 Wöhler curve using Ks value of 10 (Mäkinen, 2001). In Table 4, the fatigue life refers to the number of repetitions of the previously presented operation cycle.
It is worth mentioning that these results are specific to this particular operation cycle. However, in practical operating conditions, the distribution of the crane’s motion trajectories is such that a significant portion of load lifting and lowering operations takes place in the nearby region.
5.2. Stress Feedback Control
In the second approach, the controller responds in real-time to the stress state generated in the lifting boom using a strain gauge. The difference between the measured stress value from the strain gauge and the reference stress is fed into a fuzzy logic system to specify the maximum control signal value to be given to the valve. Fixed-value membership functions were used to determine the output, which yield the control surface shown in Figure 25. The controller was then simulated during the previously presented operation cycle, during which the stroke length of the lifting cylinder follows the pattern in Figure 26. It is evident from the lifting cylinder’s stroke length that the control algorithm has a damping effect on crane vibrations.
The impact of the developed algorithm on the control signal fed to the valve is illustrated in Figure 27. The aim was to return the stress state to a satisfactory level Nonetheless, the performance of the stress feedback control was hampered by the use of a valve that could not respond rapidly enough to rapid stress spikes. During the simulated operation cycle, the stress history at the selected point follows the pattern depicted in Figure 28, which demonstrates the effect of the developed algorithm on the occurrence of loads that lead to fatigue.
The constant amplitude stress ranges calculated from the stress history using the rainflow algorithm have been collected in Table 5.
By calculating the fatigue life according to FAT 103 with Ks of 1.0 and comparing them, the effect of the controller on the fatigue endurance can be estimated, as shown in Table 6 (Mäkinen, 2001).
6. Experimental Results
Multiple test cycles were performed in laboratory conditions with varying controller parameters to evaluate the performance of the control algorithms. Since the crane’s operation cycles are predominantly focused on short reaches, while the most fatiguing loads occur at longer reaches, the impact of the controller across the entire operating range and the entire fatigue life was investigated by dividing the crane’s operating range into four segments, as illustrated in Figure 29, and the actual impact of the control algorithm was assessed by weighting these dimensions during fatigue life calculations.
The stroke of lifting cylinder was according to Figure 30 with the reference signal fed to the valve of lifting cylinder shown in Figure 31 for each position.
The stress history measured from the strain gauge on the lifting boom is shown in Figure 32. The influence of post-movement vibration on the resulting stress fluctuations can be observed in the figure.
To evaluate the performance of the controller, the previously presented test operation cycle was executed with the controller’s parameters as listed in Table 7 (Mäkinen, 2001). Constant-amplitude equivalent stress ranges were calculated from the measured stress histories and are presented in Table 8.
The decrease of the fatigue endurance due to the welded hydraulic pipe attachments onto the top of the lifting boom was also considered using the nominal stress method and according to the SFS 2378 standard with VL of 80, which results in the values shown in Table 9.
However, reducing the fatigue loads causes alters in the dynamic characteristics of the crane and constraining the valve reference reduces the flow rate passing through the valve, which results in decelerating the movement speed in in the areas that are more exposed to loads that lead to fatigue. This phenomenon can reduce the performance of the crane in completely horizontal position. However, since this position seldom occurs in actual circumstances, decreasing the velocity of motion may not have a significant impact when considering the crane’s operation across the entire operational range. Figure 33 illustrates the effect of test run 3 on the crane’s motion in the most critical position, which indicates that the motion of the lifting cylinder decelerates. The maximum speed of lifting cylinder was recorded from the previously presented test operation cycles in order to assess the decrease in the movement speed. The highest lifting cylinder velocities during lifting motions are presented in Table 10. As shown by the results, compared to normal control, the maximum velocities of the lifting cylinder in the most crucial position decreased. However, it should be noted that this decrease in velocity does not significantly impact the overall operational efficiency.
In stress-feedback control, the driver’s instruction to the valve remains unchanged until the stresses approach the critical range set by the system, which also ensures that the velocities are preserved, as seen in Table 10. Usually, the highest stress peaks occur when the crane’s movement is being halted. In such instances, the controller opens the valve to decrease stress peaks, which leads to damping the crane’s vibrations as well, as illustrated in Figure 34. Stroke of the lifting cylinder when operated with the traditional controller and with the developed controller is indicated by red and blue lines, respectively.
One notable limitation of stress feedback control is its tendency to result in slight load creep during stopping situations, which is a bit more compared to traditional controllers. This behavior is illustrated in Figure 34, where a small positional error can be observed in the cylinder length after the movement has ceased.
To evaluate the dampening of vibrations, the crane’s bucket y-position was calculated using the measured cylinder lengths from Figure 34. The vibration sample taken in the time interval of 6.2 - 8.2 seconds was analyzed using FFT (Fast Fourier Transform) to calculate the vibration frequency and amplitude. The results in Table 11 show that the control algorithms do not have an impact on vibration frequency, while significantly decrease the vibration amplitudes.
According to the obtained results, both developed algorithms notably improved the fatigue life of the boom in laboratory experiments. The orientation feedback control achieved an increase in fatigue life from tens to around a hundred percent. Superior results were attained with the stress feedback control that led to multiple hundred percent increase in fatigue life. The substantial increase in fatigue life is attributed to the control algorithms’ ability to dampen vibrations, leading to a reduction in significant vibrations-based stresses leading to fatigue.
The most significant difference observed in the laboratory tests concerning the crane’s behavior compared to the simulation model was the damping of vibrations. This observation was also evident through a comparison between the simulated and measured stress histories.
7. Conclusions
The aim of this study was to improve the fatigue life of a hydraulic crane from significant loads that lead to fatigue through intelligent stress mapping and control while minimizing undesirable changes in the machine’s dynamic behavior. The crane was modelled and co-simulation between ADAMS and MATLAB was performed. The flexibility model of the boom was created in ANSYS in one method while directly assessed within ADAMS in another method. Maximum principal and von Mises hotspot stresses analysis methods have been pursued to determine the highest stress in the simulation process. Due to the steel material of the boom, the maximum von Mises stress was chosen for stress optimization process using neural network (NN). The comparative analysis demonstrated that the neural network model yielded notably satisfactory accuracy for predicting the stresses on the boom than the co-simulation. Moreover, two control algorithms were developed, and the system performance was examined during a short operation cycle with routine crane movements through simulation models. The first algorithm was designed based on a neural network, which optimized the crane’s movement based on its orientation and reduced the movement speeds at critical positions, leading to a decrease in high stress and thereby increasing the fatigue life, however, statistical effects have not been considered at this stage. The other control algorithm was developed based on fuzzy logic, which measured the stress state of the lifting boom using strain gauges, and when the stress values approached the set threshold, fuzzy logic method was employed to restore the stress state to a satisfactory limit. The stress feedback control algorithm also achieved promising results through simulation, displaying a damping effect on crane vibrations. Also, the control algorithms simulation models were integrated into the prototype crane’s control system in the laboratory and operation cycles were performed on the prototype considering statistical factors such as the distribution of work movements within the operational range. In laboratory experiments, the fatigue life of the boom was significantly improved with the developed control algorithms, ranging from a few percent to several hundred percent.
This study presents a unique contribution by integrating stress mapping with AI-driven control strategies in hydraulic cranes, combining Neural Networks and Fuzzy Logic to optimize stress distribution and reduce fatigue. The experimental validation on a prototype crane demonstrates the practical applicability of the approach and marks a step forward in the use of intelligent control systems for structural durability and efficiency.. Future research direction is to incorporate the other movements of the crane, such as rotation and telescoping in addition to regular movements.
Acknowledgments
This work was supported in part by the Strategic Research Council of Finland (‘‘Manufacturing 4.0, Technological, Economic and Societal Effects’’) under Grant 335991 and Grant 313349; in part by the Academy of Finland under Grant 325910; and in part by the Analytics-based Management for Business and Manufacturing Industry (AMBI) Research Platform of Lappeenranta–Lahti University of Technology LUT.
Competing Interests
The authors have no relevant financial or non-financial interests to disclose.
References
- Agyemang, A. O. (2014). Intelligent mapping of stresses in a hydraulic crane (Master’s thesis). Department of Mechanical Engineering, Lappeenranta-Lahti University of Technology.
- Ángel, L., Pérez, M. P., Díaz-Quintero, C., & Mendoza, C. (2012). ADAMS/MATLAB co-simulation: Dynamic systems analysis and control tool. Applied Mechanics and Materials, 232, 527–531. [CrossRef]
- Buczkowski, R., & Żyliński, B. (2021). Finite element fatigue analysis of unsupported crane. Polish Maritime Research, 28, 127–135. [CrossRef]
- Chu, Y., Æsøy, V., Ehlers, S., & Zhang, H. (2015). Integrated multi-domain system modelling and simulation for offshore crane operations. Ship Technology Research, 62, 36–46. [CrossRef]
- Do, T. C., Dang, T. D., Dinh, T. Q., & Ahn, K. K. (2021). Developments in energy regeneration technologies for hydraulic excavators: A review. Renewable and Sustainable Energy Reviews, 145, Article 111076.
- Dong, Q., Xu, G. N., Ren, H. L., & Wang, A. H. (2016). Fatigue remaining life estimation for remanufacturing truck crane jib structure based on random load spectrum. Fatigue & Fracture of Engineering Materials & Structures, 40, 706–731. [CrossRef]
- Hao, W., & Kan, J. (2016). Application of self-tuning fuzzy proportional-integral-derivative control in hydraulic crane control systems. Advances in Mechanical Engineering, 8, Article 1687814016655258. [CrossRef]
- Hectors, K., Chaudhuri, S., & De Waele, W. (2022). Fracture mechanics and hot spot stress-based fatigue life calculation: Case study for a crane runway girder. Fatigue & Fracture of Engineering Materials & Structures, 45, 2662–2675. [CrossRef]
- Jensen, K. J., Ebbesen, M. K., & Hansen, M. R. (2022). Online deflection compensation of a flexible hydraulic loader crane using neural networks and pressure feedback. Robotics, 11, Article 34. [CrossRef]
- Komarov, T., Zhidchenko, V., Alizadeh, M., & Handroos, H. (2023). Open-loop coordinated tip control of a log crane with and without counterbalance valves. 18th Scandinavian International Conference on Fluid Power (SICFP’23), May 30–June 1, 2023.
- Kotta, J. (2021). Modeling of PATU-655 loader with a combination of Mevea and Simulink using functional mock-up interface (Master’s thesis). Department of Mechanical Engineering, Lappeenranta-Lahti University of Technology.
- Krukowski, J., & Maczyński, A. (2013). Application of the rigid finite element method for modelling an offshore pedestal crane. Archives of Mechanical Engineering, LX, 3. [CrossRef]
- Lagerev, A. V., & Lagerev, I. A. (2020). Dynamic processes of loader cranes manipulators with excessive backlashes and elastic damping in their hinges. Periodica Polytechnica Mechanical Engineering, 64, 7–14. [CrossRef]
- Li, C., Qi, Q., Dong, Q., Yu, Y., & Fan, Y. (2023). Research on fatigue remaining life of structures for a dynamic lifting process of a bridge crane. Journal of Mechanical Science and Technology, 37, 1789–1801. [CrossRef]
- Li, W., Zhao, J., Jiang, Z., Chen, W., & Zhou, Q. (2015). A numerical study of the overall stability of flexible giant crane booms. Journal of Constructional Steel Research, 105, 12–27. [CrossRef]
- Machado, I. C. V., Viana, H. F., da Silva, R. G. L., Costa, R. S., & Lavall, A. C. C. (2022). Finite element model for advanced analysis of plane steel frames with hinged end conditions including von Mises criterion. Structures, 46, 1918–1937. [CrossRef]
- Mattila, J., Koivumäki, J., Caldwell, D. G., & Semini, C. (2017). A survey on control of hydraulic robotic manipulators with projection to future trends. IEEE/ASME Transactions on Mechatronics, 22, 669–680. [CrossRef]
- Mikkola, A. (2001). Using the simulation model for identification of the fatigue parameters of hydraulically driven log crane. ASME Journal of Mechanical Design, 123, 125–131. [CrossRef]
- Mäkinen, S. (2001). Älykkäiden ohjausjärjestelmien käyttö puutavarakuormaimen väsymiskestoiän parantamisessa (Master’s thesis). Department of Mechanical Engineering, Lappeenranta-Lahti University of Technology.
- Pedersen, M. M. (2011). Improving the fatigue and control performance of loader cranes (Special Report No. 71). Department of Mechanical Engineering, Aalborg University.
- Potakhov, E. A. (2022). Dynamic loads on a hydraulic cylinder adjusting a crane jib. Russian Engineering Research, 42, 23–29. [CrossRef]
- Roozbahani, H., Alizadeh, M., Ahomäki, A., & Handroos, H. (2021). Coordinate-based control for materials handling equipment utilizing real-time simulation. Automation in Construction, 122, Article 103483. [CrossRef]
- Seo, J. K., Kim, M. H., Shin, S. B., Han, M. S., Park, J. S., Mahendr, M., & Lee, J. M. (2010). Comparison of hot spot stress evaluation methods for welded structures. International Journal of Naval Architecture and Ocean Engineering, 2, 200–214. [CrossRef]
- Seo, J., Cha, M., Oh, K., & Park, Y. J. (2020). Development of steering control algorithms with self-tuning fuzzy PID for all-terrain cranes. 20th International Conference on Control, Automation and Systems (ICCAS), 727–730. [CrossRef]
- Shevchuk, D., Malysheva, I., Alizadeh, M., & Handroos, H. (2021). Simulated and experimental analysis of a log crane with conventional and direct-driven hydraulics. Proceedings of the ASME/BATH 2021 Symposium on Fluid Power and Motion Control, V001T01A044. [CrossRef]
- Sosa-Méndez, D., Lugo-González, E., Arias-Montiel, M., & García-García, R. A. (2017). ADAMS-MATLAB co-simulation for kinematics, dynamics, and control of the Stewart–Gough platform. International Journal of Advanced Robotic Systems, 14. [CrossRef]
- Trąbka, A. (2016). Influence of flexibilities of cranes structural components on load trajectory. Journal of Mechanical Science and Technology, 30, 1–14. [CrossRef]
- Tuan, L. A., Cuong, H., Pham, V. T., Cong, N. L., Duc, V., & Le, V.-A. (2018). Adaptive neural network sliding mode control of shipboard container cranes considering actuator backlash. Mechanical Systems and Signal Processing, 112, 233–250. [CrossRef]
- Wang, B. J., Li, Q., & Liu, Z. M. (2010). Study of typical welded joint hot spot stress concentration factor. Advanced Materials Research, 160–162, 1482–1487. [CrossRef]
- Wonohadidjojo, D. M., Kothapalli, G., & Hassan, M. Y. (2013). Position control of electro-hydraulic actuator system using fuzzy logic controller optimized by particle swarm optimization. International Journal of Automation and Computing, 10, 181–193. [CrossRef]
- Yu, J., Fei, Q., Zhang, P., Li, Y., Zhang, D., & Guo, F. (2020). An innovative yield criterion considering strain rates based on von Mises stress. ASME Journal of Pressure Vessel Technology, 142, Article 014501. [CrossRef]
- Zhang, X. X., Sun, C. S., Zhu, J. H., & Yang, X. F. (2010). Finite element analysis on flexible attachments of luffing jib tower crane. Advanced Materials Research, 118–120, 512–516. [CrossRef]
- Zhao, G., Xiao, J., & Zhou, Q. (2021). Fatigue models based on real load spectra and corrected S-N curve for estimating the residual service life of the remanufactured excavator beam. Metals, 11, Article 365. [CrossRef]
- Zhidchenko, V., Handroos, H., & Kovartsev, A. (2020). Application of digital twin and IoT concepts for solving the tasks of hydraulically actuated heavy equipment lifecycle management. International Journal of Engineering Systems Modelling and Simulation, 11, 194–206. [CrossRef]
Figure 1.
The hydraulic crane under study.

Figure 2.
Full and simplified models of the crane, pillar, beam, cylinder, and piston modeled in SolidWorks.
Figure 2.
Full and simplified models of the crane, pillar, beam, cylinder, and piston modeled in SolidWorks.

Figure 3.
Double acting hydraulic actuator.

Figure 4.
Co-simulation model.

Figure 5.
Position from Co-Simulation.

Figure 6.
Velocity from co-simulation.

Figure 7.
Pressure P1.

Figure 8.
Pressure P2.

Figure 9.
Piston Position.

Figure 10.
Hydraulic Force.

Figure 11.
Flexible beam created in: ANSYS (up) and ADAMS using discrete link (down).

Figure 12.
Simulated maximum principal stress.

Figure 13.
Simulated Results for the hot spot Von Mises Stresses.

Figure 14.
Analysis point for stress in the lifting boom.

Figure 15.
Operation of hot spot stress approximation.

Figure 20.
Stress coefficient as a function of orientation.

Figure 21.
Simulated operation cycle.

Figure 22.
Stroke length of the lifting cylinder.

Figure 23.
Control signal for the lifting cylinder’s valve.

Figure 24.
Stress history at the selected point during the operation cycle.

Figure 25.
Surface depicting the operation of the fuzzy logic.

Figure 26.
Stroke length of the lifting cylinder.

Figure 27.
Reference signal fed to the valve of the lifting cylinder.

Figure 28.
Normal stress generated at the observation point.

Figure 29.
Movement range division based on dimension.

Figure 30.
Stroke of the lifting cylinder.

Figure 31.
Reference signal fed to the valve of lifting cylinder.

Figure 32.
Stress history.

Figure 33.
The controller’s influence on the stroke length of the lifting cylinder in the most crucial location.
Figure 33.
The controller’s influence on the stroke length of the lifting cylinder in the most crucial location.

Figure 34.
The influence of the controller on crane vibrations.


Table 1.
Ten Hot Spot based on the maximum principal stresses.
| MAXIMUM PRINCIPAL Hot Spots for Boom_flex | ||||||
| Model= model_1 | Analysis= Last_Run |
Location wrt LPRF (mm) |
||||
| Stress (N/mm2) | Node id | Time (sec) | Y | z | ||
| 1 | 113.133 | 480 | 0.0058651 | 427.98 | 75 | 12.5 |
| 2 | 109.168 | 483 | 0.0058651 | 543.45 | 75 | 12.5 |
| 3 | 104.674 | 481 | 0.0058651 | 466.47 | 75 | 12.5 |
| 4 | 103.494 | 488 | 0.0058651 | 735.9 | 75 | 12.5 |
| 5 | 101.899 | 482 | 0.0058651 | 504.96 | 75 | 12.5 |
| 6 | 100.532 | 587 | 0.0058651 | 735.9 | 75 | 25 |
| 7 | 100.339 | 485 | 0.0058651 | 620.43 | 75 | 12.5 |
| 8 | 99.3179 | 486 | 0.0058651 | 658.92 | 75 | 12.5 |
| 9 | 97.7697 | 582 | 0.0058651 | 543.45 | 75 | 25 |
| 10 | 97.2961 | 585 | 0.0058651 | 658.92 | 75 | 25 |
Table 2.
Ten Hot Spot for the Von Mises stresses.
| VON MISES Hot Spots for Boom_flex | ||||||
| Model= model_ 1 | Analysis Last_Run |
Location wrt LPRF (mm) |
||||
| Stress (N/mm2) | Node id | Time (sec) | Z | |||
| 1 | 112.546 | 2296 | 0.0058651 | 2044.56 | 75 | -12.5 |
| 2 | 105.031 | 480 | 0.00670297 | 427.98 | 75 | 12.5 |
| 3 | 104.164 | 483 | 0.0058651 | 543.45 | 75 | 12.5 |
| 4 | 98.7443 | 482 | 0.0058651 | 504.96 | 75 | 12.5 |
| 5 | 98.6352 | 481 | 0.0058651 | 466.47 | 75 | 12.5 |
| 6 | 95.5754 | 2395 | 0.0058651 | 2044.56 | 75 | -25 |
| 7 | 91.9115 | 488 | 0.0058651 | 735.9 | 75 | 12.5 |
| 8 | 91.8243 | 485 | 0.0058651 | 620.43 | 75 | 12.5 |
| 9 | 89.8302 | 486 | 0.0058651 | 658.92 | 75 | 12.5 |
| 10 | 89.5118 | 582 | 0.0058651 | 543.45 | 75 | 25 |
Table 3.
Equivalent stress fluctuations.
| Max Valve Control Signal Restriction | Equivalent Stress Fluctuation [MPa] |
| No restriction | 89,6 |
| 2.3 V | 72,9 |
| 2.5 V | 56,5 |
Table 4.
Impact on Fatigue Life.
| Max Valve Control Signal Restriction |
Fatigue Life (repetitions) |
Fatigue Life Amendment |
| No restriction | 3100000 | |
| 2.3 V | 5900000 | % 90 |
| 2.5 V | 12200000 | % 290 |
Table 5.
Equivalent constant amplitude stress fluctuations.
| Controller | Equivalent Stress Fluctuations |
| No restriction | 89,6 MP |
| 130 MPa stress restriction | 71,0 MP |
| 110 MPa stress restriction | 66,3 MP |
Table 6.
Fatigue life estimates.
| Controller | Cycles of fatigue life | Amendment |
| No restriction | 3060000 | |
| 130 MPa stress restriction | 6130000 | %100 |
| 110 MPa stress restriction | 7520000 | %146 |
Table 7.
Test parameters.
| Test run | Reference limitation | Stress limit |
| 1 | 0 | - |
| 2 | Max.2.0 | - |
| 3 | Max. 2.5 | - |
| 4 | 0 | 130 MP |
| 5 | 0 | 110 MP |
| 6 | Max. 1.5 | 120 MP |
| 7 | Max. 1.5 | 110 MP |
Table 8.
Equivalent stress range calculated from operation cycles.
| Trial | Posture 1 | Posture 2 | Posture 3 | Posture 4 |
| # 1 | 62.01 | 59.39 | 50.34 | 30.49 |
| # 2 | 51.52 | 47.04 | 46.01 | 30.03 |
| # 3 | 44.83 | 37.44 | 39.94 | 33.68 |
| # 4 | 51.32 | 38.4 | 38.7 | 31.29 |
| # 5 | 38.54 | 33.16 | 30.58 | 24.54 |
| # 6 | 41.16 | 34.6 | 31.69 | 24.59 |
| # 7 | 35.64 | 32.47 | 27.21 | 22.58 |
Table 9.
The effect of the controller on fatigue life.
| Trial | Reference limit | Stress limit | Cycles of work life | Fatigue life variation compared to trial 1. |
| # 1 | 0 V | - | 8270000 | |
| # 2 | Max. 2.0 V | - | 12809000 | %55 |
| # 3 | Max. 2.5 V | - | 18764000 | %127 |
| # 4 | 0 V | 130 MP | 19216000 | %132 |
| # 5 | 0 V | 110 MP | 36769000 | %345 |
| # 6 | Max. 1.5 V | 120 MP | 32998000 | %299 |
| # 7 | Max. 1.5 V | 110 MP | 45850000 | %454 |
Table 10.
Maximum lifting cylinder velocities in the course of lifting movements.
| Trial | Reference limit | Stress limit | Lifting velocity | Lifting velocity |
| # 1 | 0 | - | Max. 0.0837 m/s | Max.100.0% |
| # 2 | Max. 2.0 | - | Max. 0.0645 m/s | Max. 77.1% |
| # 3 | Max. 2.5 | - | Max. 0.0556 m/s | Max. 66.4% |
| # 4 | 0 | 130 MP | Max. 0.0836 m/s | Max. 99.9% |
| # 5 | 0 | 110 MP | Max. 0.0823 m/s | Max. 98.3% |
| # 6 | Max. 1.5 | 120 MP | Max. 0.0735 m/s | Max. 87.8% |
| # 7 | Max. 1.5 | 110 MP | Max. 0.0739 m/s | Max. 88.3% |
Table 11.
Vibrations during crane’s motion stoppage.
| Trial | Reference limit | Stress limit | Frequency | Amplitude | Amplitude |
| # 1 | 0 | - | 1.95 Hz | 18.8 mm | 100.0% |
| # 2 | Max. 2.0 | - | 1.95 Hz | 13.3 mm | 70.7% |
| # 3 | Max.2.5 | - | 1.95 Hz | 9.2 mm | 48.9% |
| # 4 | 0 | 130 MP | 1.95 Hz | 13.3 mm | 70.7% |
| # 5 | 0 | 110 MP | 1.95 Hz | 2.5 mm | 13.3% |
| # 6 | Max.1.5 | 120 MP | 1.95 Hz | 6.2 mm | 33.0% |
| # 7 | Max.1.5 | 110 MP | 1.95 Hz | 3.1 mm | 16.5% |
Disclaimer/Publisher’s Note: The statements, opinions and data contained in all publications are solely those of the individual author(s) and contributor(s) and not of MDPI and/or the editor(s). MDPI and/or the editor(s) disclaim responsibility for any injury to people or property resulting from any ideas, methods, instructions or products referred to in the content. |
© 2026 by the authors. Licensee MDPI, Basel, Switzerland. This article is an open access article distributed under the terms and conditions of the Creative Commons Attribution (CC BY) license (http://creativecommons.org/licenses/by/4.0/).
Copyright: This open access article is published under a Creative Commons CC BY 4.0 license, which permit the free download, distribution, and reuse, provided that the author and preprint are cited in any reuse.


