

Submitted:
28 April 2026
Posted:
29 April 2026
You are already at the latest version
Abstract
The production of sugar from sugarcane cultivation was one of the most significant industrial activities in eastern Andalusia during the late nineteenth and early twentieth centuries. Along the Málaga coastline, remnants of these sugar mills can still be found, many of them currently in a state of abandonment or poor conservation. This study presents the 3D digital reconstruction of the San Joaquín sugar mill (Maro, Málaga, Spain) using UAV-based photogrammetry. A point cloud was generated from aerial images processed with specialized software. A comparative analysis was conducted using between 12.5% and 100% of the captured images to evaluate model accuracy and computational cost. The full dataset (100%) produced the most complete and accurate model, although at a higher computational cost. Reduced datasets (25–50%) achieved high-resolution representations of the main structures but failed to fully reconstruct certain elements, particularly the chimney. The point cloud was subsequently used to develop a HBIM-based model, enabling the reconstruction of structural components, including a hypothetical interpretation of the workers’ housing, currently in a near-ruined condition. These results demonstrate the effectiveness of UAV photogrammetry and HBIM as complementary tools for the documentation and reconstruction of industrial heritage, providing a solid basis for future restoration and adaptive reuse strategies.
Keywords:
UAV photogrammetry
; 3D reconstruction
; industrial heritage documentation
; Heritage Building Information Modeling (HBIM)
; point cloud processing
; sugar mill
1. Introduction
Sugarcane, a plant native to Southeast Asia, was introduced into the Iberian Peninsula by Arab civilization around the 10th century. Its cultivation was first established along the Mediterranean coast between Vélez-Málaga and Almería. Initially considered an exotic product, sugar production remained limited until the establishment of the Nasrid Kingdom of Granada (1230–1492), which encompassed the present-day provinces of Almería, Granada, and Málaga. During this period, sugarcane cultivation expanded to additional areas along the Málaga coastline [1]. Eastern Andalusia became one of the main centers for the development of this crop due to its favorable climatic conditions and soil composition. The mountainous terrain near the coast facilitated rainwater collection for irrigation, while maritime proximity enabled efficient distribution of sugar by sea [2]. Indeed, the historical development of these regions cannot be fully understood without considering their strong sugar-producing tradition [3].
The sugar industry involves three main processes: cultivation of sugarcane, milling to extract juice, and processing the juice into crystallized sugar [4]. In the 15th century, the first pre-industrial production facilities, known as trapiches or sugar mills, emerged. In these facilities, sugarcane was crushed to extract juice, which was subsequently boiled to produce sugar [5]. The industry experienced significant growth in the mid-19th century with the introduction of steam engines, marking the transition to industrial-scale production and the replacement of traditional mills with modern factories. In 1845, the Sociedad Azucarera Peninsular, led by Ramón de la Sagra, established the first mechanized factory in Almuñécar [6]. With the importation of advanced machinery from England and France, the Andalusian coast experienced its peak production period in the early 20th century, becoming a national and international reference. The province of Málaga alone hosted 45 sugar mills and approximately 5000 hectares of cultivated land, profoundly transforming the agricultural landscape, local culture, and social practices. However, by the mid-20th century, industry entered a severe decline, leading to the gradual closure of factories. The last facility, Azucarera Hispania, ceased operations in 1994. Currently, sugar production has almost entirely disappeared from Europe, with only one remaining facility, the Nuestra Señora del Carmen sugar mill in Frigiliana (Málaga), which still produces sugarcane syrup using traditional methods [7].
This intense industrial activity has generated a significant number of elements of high value within the framework of industrial heritage, defined as the remains of industrial culture possessing historical, technological, social, architectural, or scientific value [8,9]. These elements reflect the relationship between industrial production systems, capitalist development, and mechanization processes [10]. Industrial heritage encompasses both movable and immovable assets, including archaeological, architectural, and technological elements that require protection, conservation, and valorization [11]. However, many of these assets are currently in a degraded state due to obsolescence and lack of maintenance, highlighting the need for urgent conservation measures [12]. Despite the presence of numerous remains of former sugar mills, many are in poor condition. This is the case of the San Joaquín sugar mill, located in Maro (Nerja, Málaga), which began operations in 1879 and ceased activity in the mid-20th century. Initially dedicated to sugar production, it was later converted into an alcohol distillery. At the same time, the Águila Aqueduct was constructed to supply water to the mill and was restored in 2012. Nevertheless, the mill itself is currently in a state of ruin [13].
The study of heritage buildings requires a multidisciplinary approach aimed at achieving a comprehensive understanding of their historical, architectural, structural, and energetic characteristics. Among the available diagnostic techniques, non-destructive methods such as photogrammetry, laser scanning, and infrared thermography are widely used, as they do not compromise the integrity of the asset [14]. In particular, photogrammetry combined with unmanned aerial vehicles (UAVs) has gained significant attention due to its operational flexibility and relatively low cost [15]. This approach enables the acquisition of aerial imagery, including in areas with limited accessibility, and the generation of accurate 3D digital models over large areas in relatively short timeframes compared to other technologies such as laser scanning [16]. These models are generated by overlapping images captured from different perspectives, producing stereoscopic views that provide three-dimensional information [17]. Such data can support various applications, including reconstruction, rehabilitation, reuse, and relocation [18].
Among the technologies used for the modelling, management, and conservation of heritage assets, Building Information Modeling (BIM) plays a prominent role in the construction sector [19,20]. In the context of heritage, this methodology has evolved into Heritage Building Information Modeling (HBIM), specifically adapted to address the unique requirements of heritage assets [21]. Recent studies have highlighted the growing relevance of HBIM for heritage conservation, emphasizing its capacity to integrate reality-capture techniques such as laser scanning and photogrammetry into comprehensive digital workflows for documentation, analysis, and management [22]. Recent reviews have also pointed out that the combination of terrestrial laser scanning, Structure from Motion, and photogrammetric data remains one of the most promising approaches for improving the completeness and reliability of heritage digital models, while also revealing the need for clearer protocols for data acquisition and long-term monitoring [23]. In addition, the integration of HBIM with multi-source datasets, including point clouds, historical documents, photographs, and technical records, has proven especially valuable for reconstructing deteriorated or partially lost architectural heritage, as it facilitates the interpretation of geometric transformations over time and supports more accurate digital reconstructions [24,25].
Furthermore, the adaptive reuse of industrial heritage is increasingly recognized as one of the most effective strategies for ensuring long-term sustainability, while preserving the historical and cultural significance of obsolete industrial sites [26]. Recent bibliometric analyses confirm that adaptive reuse has become a central topic in contemporary industrial heritage research, reflecting growing interest in its architectural, urban, and socio-economic implications [27]. In parallel, the study and conservation of industrial heritage represent a significant opportunity within the cultural tourism sector [28]. Since its emergence in the mid-20th century, cultural tourism has contributed to the economic development of regions lacking alternative economic activities [29]. In this context, industrial heritage can serve as a valuable resource for attracting visitors, fostering local identity, and promoting regional economic growth [30].
Additionally, the digitalization of industrial heritage enables the preservation and dissemination of cultural, scientific, and technical information for future generations [31]. These digital assets can be integrated into virtual and augmented reality applications, offering immersive educational and entertainment experiences. This combination of interactivity and engagement represents an effective means of attracting audiences to cultural content [32]. Moreover, it facilitates broader access to industrial heritage, promoting the exchange of knowledge and ideas [33].
Despite the growing application of UAV-based photogrammetry and BIM/HBIM technologies in heritage documentation, limited attention has been paid to highly deteriorated industrial heritage sites associated with the historic sugar industry of southern Spain. More specifically, limited research has focused on the digital reconstruction of ruined sugar mills through an integrated workflow that combines UAV photogrammetry, point-cloud generation, and HBIM-based modelling. Moreover, the influence of image dataset size on the completeness, accuracy, and computational cost of the resulting models remains insufficiently explored in this type of heritage asset.
In this context, the present study develops a methodology for the digital reconstruction of the San Joaquín sugar mill (Maro, Málaga) using UAV-based photogrammetry. The influence of the number of images and associated computational time on model accuracy is analyzed. Furthermore, a HBIM-based model is generated to support potential architectural interventions aimed at the restoration of this industrial heritage asset. The resulting models may also serve as educational tools and contribute to the promotion of cultural tourism through their integration into virtual environments or web-based platforms.
2. Methodology
The case study selected for the experimental methodology is the San Joaquín sugar mill, located in Maro (Málaga, Spain), on a trapezoidal plot with an area of 36,964 m². The complex was built in 1884 under the initiative of Joaquín Pérez del Pulgar, after whom it was named. Originally, the site comprised a sugar production facility and an alcohol distillery, together with warehouses, a still, workshops, terraced housing for workers and master craftsmen, extensive sugarcane cultivation areas, and the characteristic chimney associated with this type of industrial architecture. Water supply was ensured by the nearby Águila Aqueduct, with storage in an elliptical reservoir, while the entire site was enclosed by a masonry wall. The main building, constructed in rendered brick masonry, was originally covered by a gable roof supported by a timber framework and organized into three main volumes, with a south-facing principal facade. Although the mill ceased operation in the mid-twentieth century, several of its main structural elements remain standing today, albeit in an advanced state of deterioration, with most roof structures having disappeared over time [7,13].
Owing to its architectural complexity, large spatial extent, and degraded conservation state, this industrial heritage site constitutes a suitable case study for evaluating the application of UAV-based photogrammetry and HBIM-based digital reconstruction [34]. Figure 1 illustrates the current condition of the San Joaquín sugar mill and the Águila Aqueduct.
In the first stage, a site visit was conducted in order to identify the most relevant construction features of the industrial asset, as well as any tall elements located in its surroundings that could affect flight safety, such as power lines or communication antennas. Subsequently, the flight path for image acquisition using the UAV was defined. In addition, direct measurements of several singular elements of the site were taken using a measuring tape with a 1 cm scale division, with the aim of evaluating the degree of agreement between the digital model and the real structure.
The sugar mill is composed of seven clearly differentiated elements (Figure 2). The complex included a walled enclosure with two possible access points: one located on the eastern side, considered the main entrance for vehicle access and exit, and another on the southern side, used by workers to access the sugarcane cultivation area located south of the mill.
Adjacent to the main access, there is a building (1) intended for workers’ accommodation and access control to the enclosure. Near the entrance, there is a small building (2), used as a storage facility for agricultural tools, and an office building (3), where commercial and administrative activities were carried out. The main element of the complex is the factory building (4). This structure includes a chimney distinguished by the decorative helical brick pattern formed by spiral brick courses, a unique feature among the sugar mills of Málaga. Behind the factory, on the southern side, there is an oval reservoir (5), designed to collect and store water from the irrigation channel supplied by the aqueduct for subsequent use in sugarcane irrigation. On the western side of the enclosure, there is an additional building (6), which served as the residence of the mill owners. Finally, in the northern area, some remains of the housing complex (7) still survive; these were originally intended to accommodate both factory workers and sugarcane harvesters.
For the digital reconstruction of the sugar mill, photogrammetric techniques based on UAV imagery were combined with HBIM methodologies. The use of unmanned aerial vehicles in Spanish territory requires compliance with a set of regulations derived from air safety requirements. First, an assessment of the airspace in which the UAV operation is planned must be conducted to determine whether any flight restrictions apply. In this study, the airspace corresponding to the area of interest was analyzed through the ENAIRE website [35], confirming that the site was located in a zone without flight restrictions. In addition, since the site is privately owned, authorization from the property owner was required prior to image acquisition.
Figure 3 shows the UAV employed to capture the photographic dataset in this study. Its main technical specifications are summarized in Table 1. The UAV flight was controlled by means of a remote control connected to a mobile device. Through a dedicated mobile application, all flight parameters of the aircraft could be monitored and adjusted, while also allowing the design of the image acquisition strategy (Figure 4a). Once the area to be photographed had been selected, a set of equidistant waypoints was defined from which the photographs were automatically captured.
The take-off and landing point of the aircraft was in an intermediate area so that, in the event of premature landing, the return route would be as short as possible. The flight path followed for image acquisition was arranged from east to west and from north to south (Figure 4b). Throughout the operation, the aircraft maintained a constant flight altitude of 60 m. The UAV survey was completed in an operation time of 31 min 30 s, covering an area of 303 × 305 m. However, due to the limited battery capacity of the aircraft, an intermediate stop was required to replace the battery. Consequently, the total fieldwork time amounted to 41 min 28 s.
Once all the images had been acquired, they were processed using photogrammetric techniques. For this purpose, dedicated software (Pix4Dmapper) was employed to generate a three-dimensional model from a point cloud based on the image dataset. A total of 696 images were captured during the UAV flight, and four different models were subsequently generated using 12.5%, 25%, 50% and 100% of the images captured during the UAV flight. This approach was intended to optimize the process by analyzing the computational time and the accuracy achieved for each model. To this end, the dimensions obtained from the virtual models were compared with those measured directly on site using a measuring tape. It should be noted that not all the images effectively captured are necessarily used in the reconstruction process, since the software discards those that cannot be successfully matched with the rest of the dataset.
Finally, the point cloud model was exported from Pix4D to Autodesk ReCap, used as an intermediate platform to enable its subsequent use in Autodesk Revit. A three-dimensional model of the sugar mill was generated using Autodesk Revit software, which enables the generation of a 3D model of the entire complex and all the buildings composing it, while allowing the incorporation of construction-related information for each element. To achieve a closer representation of reality, the software also allows the textures of the model to be modified, thereby improving its visualization. This model enabled the digital reconstruction of the sugar mill through the application of HBIM techniques.
3. Results and Discussion
As discussed in the methodology section, four models were generated from the image dataset using different percentages of the total number of images. In the analysis of the results obtained for each model, the following parameters were considered: the number of input images, the number of effective images used, the computational time, the covered area, and the average point-cloud density (Table 2).
An increase in the number of images used for model generation led to a higher number of images being accepted by the software. Since photogrammetric techniques establish relationships between images through the detection of common points, the use of a smaller number of images meant that some of them could not be matched with one another, making it impossible to determine their position within the overall dataset. In the 50% and 100% models, all the provided images were successfully used, resulting in a more complete model.
With regard to computational time, increasing the number of processed images led to a higher computational cost. However, this increase was not excessively large. Compared with laser scanning systems, although the computational cost of photogrammetric techniques may be higher, the fieldwork time is considerably shorter, remaining below 1 h and thereby allowing greater flexibility for the technician to carry out other tasks.
The area covered by the generated model also increased with the number of captured images. Particularly noteworthy is the low coverage obtained in the model generated from the smallest image subset (12.5%). In the models generated using 25% or more of the images, a clear increase in covered area was observed.
The point-cloud density also increased as the number of images considered in the model grew. However, the improvement in density was not proportional to the increase in the number of images used. Model generation is based on image overlaps, in which matching points are identified across the dataset.
Figure 5 shows the reconstruction process for each of the four models. Figure 5a presents the flight path followed by the UAV and the image capture positions. From a top view, the location of the images (blue points) and the route followed (green line) can be observed, with the starting point of the flight path indicated by the larger blue point. Figure 5b plots the image overlap per pixel. The yellow and red areas correspond to low overlap, whereas the green areas indicate an overlap of five images or more. The greater the overlap, the better the reconstruction result obtained from the generated point cloud. Figure 5c shows the model generated from the point cloud obtained through triangulation and image overlap. The red triangles and points indicate positions whose images were discarded because they could not match with the rest of the dataset.
It can be observed that increasing the number of images used for model generation results in greater overlap in the central area of the surface to be modeled. By contrast, at the boundary regions of the site, the number of images contributing to the model is reduced. In the 12.5% model, this number is particularly low, thereby compromising the resolution in these areas and producing dark or undefined zones in the resulting model. As the number of images used increases, the number of overlapping images also rises, improving the definition of the surface boundaries. In the 100% model, it can be observed that, over almost the entire surface, the number of images per pixel is equal to or greater than five.
The digital models generated in each case are shown in Figure 6.
As can be observed in Figure 6a (12.5%), the resulting model contains many incomplete areas. The lack of images at the boundary of the selected survey area leads to an incomplete representation of that portion of the site. From 25% of the captured images onward, the resulting models are clearly identifiable with the real structure, and the level of detail improves as the number of images used increases. Although the 50% model (Figure 6c) provides a very high-resolution representation of the building, the chimney is not properly reconstructed, with only its base being captured.
Only the 100% model (Figure 6d) provides a complete representation of the chimney. However, its upper part does not exhibit a high level of detail, since tall elements are more difficult to reconstruct accurately due to the greater difficulty in identifying matching points in the overlapping images. Because the chimney contour forms a greater angle with the vertical line of the UAV position, the points near its upper boundary show larger differences with respect to the surrounding environment than those located closer to ground level.
Another aspect to be considered in the model is the lateral facades of the two adjoining buildings connected to the main structure. In the 12.5% and 25% models, both constructive elements are represented rather diffusely, and the openings in the facade cannot be clearly identified. In the 50% and 100% models, these openings are properly represented, although their level of resolution is lower than that obtained for the other facades of the building. The proximity between both structural elements results in a smaller number of photographs in which these lateral facades are visible, thereby reducing their resolution. Nevertheless, the facade remains clearly recognizable. In this respect, the selected UAV flight altitude of 60 m may be considered appropriate. If the flight had been conducted at a lower altitude, although the level of detail in the acquired images would have increased, the number of images capturing these elements would have been reduced, thus negatively affecting the resolution of the final model. Conversely, an increase in altitude could also have had a negative effect, since the level of detail in the images would decrease as the distance between the facade and the UAV increased.
Table 3 presents the mean values of the camera position and orientation uncertainties in the point-cloud model for each of the generated models.
It can be observed that the highest uncertainty was obtained for the 12.5% model, whereas the remaining models show very similar values in terms of both position and orientation uncertainty. Several reference measurements were taken from facades, doors, and windows in order to compare the values obtained using the measuring tape with those derived from the digital model Figure 7.
The comparison between the digital model and the tape measurements is presented in Table 4. The 12.5% model was excluded, since measurements could not be performed on the point cloud due to the low resolution obtained.
In general, the dimensions obtained from the digital models are lower than those measured directly with the measuring tape. As expected, the 100% model provides the closest agreement with the real dimensions. The differences observed may result from the lack of definition of the edges in the digital models (Figure 7), which leads to a loss of precision when selecting the contour points to be measured.
Once all the models had been evaluated, the information contained in the 100% model (Figure 8) was used to generate a more complete digital model by means of BIM software.
First, the point cloud corresponding to the model generated with 100% of the data, obtained from Pix4D, was exported to Autodesk ReCap (Figure 9a) to subsequently import the point cloud into Autodesk Revit (Figure 9b).
The current conservation state of the asset is severely degraded. A significant portion of the roof structure of the main building has collapsed, while the outer masonry enclosure wall exhibits several partially ruined sections. The workers’ housing located in the northern area is in an even more advanced state of deterioration, with only scarce visible remains preserved, which hinders the direct identification of its original morphology, spatial layout, and constructive logic. This condition limits the possibility of understanding the complex exclusively through its present physical remains and reinforces the value of digital reconstruction as a complementary tool for its architectural interpretation. Figure 10 shows several views of the HBIM model generated in Autodesk Revit.
Within this framework, the HBIM model generated from the point-cloud data made it possible not only to reproduce the currently preserved geometry of the complex, but also to reconstruct missing parts of the building envelope and other lost architectural elements. This process enabled a more complete representation of the original volumetric and spatial configuration of the sugar mill, facilitating a clearer interpretation of the relationships between its main functional components. In particular, the reconstruction of the workers’ housing was developed through a hypothesis-based modelling process supported by the constructive evidence still observable on site, including wall traces, residual alignments, volumetric proportions, and the arrangement of the preserved fragments. Although this reconstruction necessarily entails a degree of interpretative uncertainty, it constitutes a technically coherent approximation grounded in the available material evidence. Consequently, the developed HBIM model can be considered a valuable support tool for the documentation, interpretation, and potential future restoration of this industrial heritage asset.
Consequently, the HBIM model not only enhances the documentation and interpretation of the site but also provides a technically grounded basis for future conservation, restoration, and adaptive reuse strategies, thereby supporting the architectural recovery of the complex and contributing to its potential valorization as a destination for cultural and industrial heritage tourism. Moreover, the methodology developed in this study can be applied to other historic sugar mills, thereby contributing to the recovery and revalorization of the industrial heritage associated with the sugar industry along the eastern Andalusian coast.
4. Conclusions
In this study, a methodology was developed for the digital reconstruction of the San Joaquín sugar mill (Maro, Málaga) through the application of UAV-based photogrammetric techniques. The influence of the number of input images and the associated computational time on the quality of the resulting models was analyzed in order to determine an appropriate balance between processing cost and geometric reliability. In addition, a HBIM model of the site was generated from the point-cloud data.
A comparative assessment was carried out using 100%, 50%, 25%, and 12.5% of the total images captured during the UAV survey. The results showed that increasing the number of images improved the completeness and accuracy of the reconstructed model, although at a higher computational cost. While the models generated by 50% and 25% of the images provided high-resolution representations of the main architectural elements, they were not able to fully reconstruct the chimney. Only the model based on 100% of the acquired images provided a complete representation of the complex.
The point-cloud model obtained from the full image dataset was subsequently used to generate a HBIM-based digital reconstruction. Given the poor current conservation state of the sugar mill, this second model made it possible to reconstruct the main structural elements of the complex, including a hypothesis-based representation of the former workers’ housing, which is currently almost entirely ruined. In this regard, the resulting HBIM model provides a technically grounded basis for future architectural recovery, conservation, and adaptive reuse interventions.
Overall, the methodology proposed in this work constitutes a useful tool for the documentation, reconstruction, and dissemination of former industrial facilities. Its application may contribute not only to the preservation and revalorization of industrial heritage assets, but also to their use in educational initiatives and cultural tourism through virtual reality or web-based environments. Furthermore, the methodology developed here can be extended to other historic sugar mills, thereby contributing to the recovery of the heritage value associated with the sugar industry along the eastern Andalusian coast.
Author Contributions
Conceptualization, F.J.T.V., S.M.B. and L.S.H.; methodology, F.J.T.V. and S.M.B.; software, S.M.B.; validation, F.J.T.V., S.M.B. and L.S.H.; formal analysis, F.J.T.V., S.M.B., C.B.G., M.H.F. and L.S.H.; investigation, F.J.T.V., S.M.B. and C.B.G.; resources, S.M.B and L.S.H.; data curation, S.M.B.; writing—original draft preparation, F.J.T.V; writing—review and editing, F.J.T.V., S.M.B., C.B.G., M.H.F. and L.S.H.; supervision, F.J.T.V and L.S.H.; project administration, F.J.T.V; funding acquisition, F.J.T.V., S.M.B. and L.S.H. All authors have read and agreed to the published version of the manuscript.
Funding
This research and the APC were funded by the “Consejería de Fomento, Articulación del Territorio y Vivienda de la Junta de Andalucía (España)” under the programme “Ayudas para Universidades Públicas Andaluzas de Proyectos de Investigación 2024”, through the Research Project UMA 24.05 CAD-Ingenio, “Catalogación patrimonial y digitalización mediante drones de ingenios de caña de azúcar de Andalucía Oriental”.
Data Availability Statement
The data presented in this study are available on reasonable request from the corresponding author.
Acknowledgments
The authors would like to acknowledge the support of the Universidad de Málaga, Campus de Excelencia Internacional (CEI) Andalucía TECH.
Conflicts of Interest
The authors declare no conflicts of interest.
References
- Jiménez-Brobeil, S.A. Introduction of Sugarcane in Al-Andalus (Medieval Spain) and Its Impact on Children’s Dental Health. Int. J. Osteoarchaeol. 2021, 32, 283–293. [Google Scholar] [CrossRef]
- Capilla, F. The Sugar Industry in Nerja and Maro (I): Pre-Industrial Sugar Mills; Libros de la Axarquía: Vélez-Málaga, Spain, 2016. [Google Scholar]
- Sáez-Calvo, J.A. Inheritance Value of the Machinery of the Factory “Azucarera Del Pilar” in Motril and the Sugar Industry in Eastern Andalusia. In Explorations in the History and Heritage of Machines and Mechanisms; Ceccarelli, M., López-García, R., Eds.; Springer: Cham, Switzerland, 2022; pp. 537–550. [Google Scholar]
- Galloway, J.H. The Sugar Cane Industry: An Historical Geography from Its Origins to 1914; Cambridge University Press: Cambridge, UK, 2005. [Google Scholar]
- Prinsen, H.C. The World’s Cane Sugar Industry: Past and Present; Cambridge University Press: Cambridge, UK, 2010. [Google Scholar]
- Pezzi, P. Sugar in the Province of Málaga; Sociedad Amigos de la Cultura de Vélez-Málaga: Málaga, Spain, 2019. [Google Scholar]
- Capilla, F. The “San José” Sugar Factory in Nerja (1870–1968) and Its Transformation into the “El Chaparil” Secondary School (1976–2002). Isla De. Arriarán 2002, 19, 191–212. [Google Scholar]
- The International Committee for the Conservation of the Industrial Heritage (TICCIH). The Nizhny Tagil Charter for the Industrial HeritageCharter – TICCIH. Available online: https://ticcih.org/about/charter/ (accessed on 6 April 2026).
- UNESCO World Heritage Centre - World Heritage List. Available online: https://whc.unesco.org/en/list/ (accessed on 6 April 2026).
- Claver, J. A Multi-Criteria Cataloguing of the Immovable Items of Industrial Heritage of Andalusia. Appl. Sci. 2019, 9, 275. [Google Scholar] [CrossRef]
- Trujillo, F.J. De Re Metallica: An Early Ergonomics Lesson Applied to Machine Design in the Renaissance. Sustainability 2021, 13, 9984. [Google Scholar] [CrossRef]
- Galantucci, R.A.; Fatiguso, F. Advanced Damage Detection Techniques in Historical Buildings Using Digital Photogrammetry and 3D Surface Analysis. J. Cult. Herit. 2019, 36, 51–62. [Google Scholar] [CrossRef]
- Rodríguez, F. Heritage and City: Sugar Industrial Heritage in the Axarquía Region—between Neglect and Valorization. Isla De. Arriarán 2006, 28, 7–38. [Google Scholar]
- Tejedor, B. Non-Destructive Techniques (NDT) for the Diagnosis of Heritage Buildings: Traditional Procedures and Future Perspectives. Energy Build. 2022, 263, 112029. [Google Scholar] [CrossRef]
- Strząbała, K. Determining Changes in Building Tilts Based on UAV Photogrammetry. Measurement 2022, 202, 111772. [Google Scholar] [CrossRef]
- Martín-Béjar, S. Graphic Applications of Unmanned Aerial Vehicles (UAVs) in the Study of Industrial Heritage Assets. Appl. Sci. 2020, 10, 8821. [Google Scholar] [CrossRef]
- Yang, B. Approaches for Exploration of Improving Multi-Slice Mapping via Forwarding Intersection Based on Images of UAV Oblique Photogrammetry. Comput. Electr. Eng. 2021, 92, 107135. [Google Scholar] [CrossRef]
- Arias, P. Low-Cost Documentation of Traditional Agro-Industrial Buildings by Close-Range Photogrammetry. Build. Environ. 2007, 42, 1817–1827. [Google Scholar] [CrossRef]
- Yang, X. Review of Built Heritage Modelling: Integration of HBIM and Other Information Techniques. J. Cult. Herit. 2020, 46, 350–360. [Google Scholar] [CrossRef]
- Yang, A. Adopting Building Information Modeling (BIM) for the Development of Smart Buildings: A Review of Enabling Applications and Challenges. Adv. Civ. Eng. 2021, 2021, 8811476. [Google Scholar] [CrossRef]
- Angulo-Fornos, R.; Castellano-Román, M. HBIM as Support of Preventive Conservation Actions in Heritage Architecture: Experience of the Renaissance Quadrant Façade of the Cathedral of Seville. Appl. Sci. 2020, 10, 2428. [Google Scholar] [CrossRef]
- Penjor, T.; Banihashemi, S.; Hajirasouli, A.; Golzad, H. Heritage Building Information Modeling (HBIM) for Heritage Conservation: Framework of Challenges, Gaps, and Existing Limitations of HBIM. Digit. Appl. Archaeol. Cult. Herit. 2024, 35, e00366–e00366. [Google Scholar] [CrossRef]
- Liu, J.; Li, B. Heritage Building Information Modelling (HBIM): A Review of Published Case Studies. Int. Arch. Photogramm. Remote Sens. Spat. Inf. Sci. 2024, XLVIII-1–2024, 387–393. [Google Scholar] [CrossRef]
- Gigliarelli, E.; Calcerano, F.; Cessari, L. Heritage BIM, Numerical Simulation and Decision Support Systems: An Integrated Approach for Historical Buildings Retrofit. Energy Procedia 2017, 133, 135–144. [Google Scholar] [CrossRef]
- Klapa, P. 3D Heritage Reconstruction through HBIM and Multi-Source Data Fusion: Geometric Change Analysis across Decades. Appl. Sci. 2025, 15, 8929. [Google Scholar] [CrossRef]
- De Gregorio, S. Designing the Sustainable Adaptive Reuse of Industrial Heritage to Enhance the Local Context. Sustainability 2020, 12, 9059. [Google Scholar] [CrossRef]
- Çeltekligil, A.; Arabacıoğlu, F.P. Adaptive Reuse in Industrial Heritage: A Bibliometric Review (2004–2024). Proceedings of the Proceedings of the International Conference of Contemporary Affairs in Architecture and Urbanism 2025, Vol. 8, 850–862. [Google Scholar] [CrossRef]
- Pardo, C.J.; Pino, J. Conservation, Management and Tourist Use of Pre-Industrial Heritage: Identification of Spanish Experiences from a Territorial Analysis. J. Hosp. Tour. Manag. 2015, 3, 1–22. [Google Scholar]
- Pardo, C.J. The Post-Industrial Landscapes of Riotinto and Almadén, Spain: Scenic Value, Heritage and Sustainable Tourism. J. Herit. Tour. 2017, 12, 331–346. [Google Scholar] [CrossRef]
- Martín-Béjar, S. Sugar Cane Industrial Heritage on the Eastern Coast of Málaga: A Tourist Route Opportunity. Proc. IOP Conf. Ser. Mater. Sci. Eng. 2021, Vol. 1193, 12138. [Google Scholar] [CrossRef]
- Hajirasouli, A. Virtual Reality-Based Digitisation for Endangered Heritage Sites: Theoretical Framework and Application. J. Cult. Herit. 2021, 49, 140–151. [Google Scholar] [CrossRef]
- Novotný, M.; Lacko, J.; Samuelčík, M. Applications of Multi-Touch Augmented Reality Systems in Education and Presentation of Virtual Heritage. Procedia Comput. Sci. 2013, 25, 231–235. [Google Scholar] [CrossRef]
- Ott, M.; Pozzi, F. Towards a New Era for Cultural Heritage Education: Discussing the Role of ICT. Comput. Hum. Behav. 2011, 27, 1365–1371. [Google Scholar] [CrossRef]
- San Joaquín Sugar Factory, Águila Aqueduct and Las Mercedes Company Town Maro (Nerja) (Industrial Heritage) - Province - Diputación de Málaga. Available online: https://www.malaga.es/en/laprovincia/patrimonio/lis_cd-19665/san-joaquin-sugar-factory-aguila-aqueduct-and-las-mercedes-company-town-maro-nerja-industrial-heritage (accessed on 6 April 2026).
- ENAIRE. Spanish Airports and Air Navigation. Available online: https://www.enaire.es/home_en (accessed on 6 April 2026).
Figure 1.
(a) San Joaquín sugar mill; (b) Águila Aqueduct.
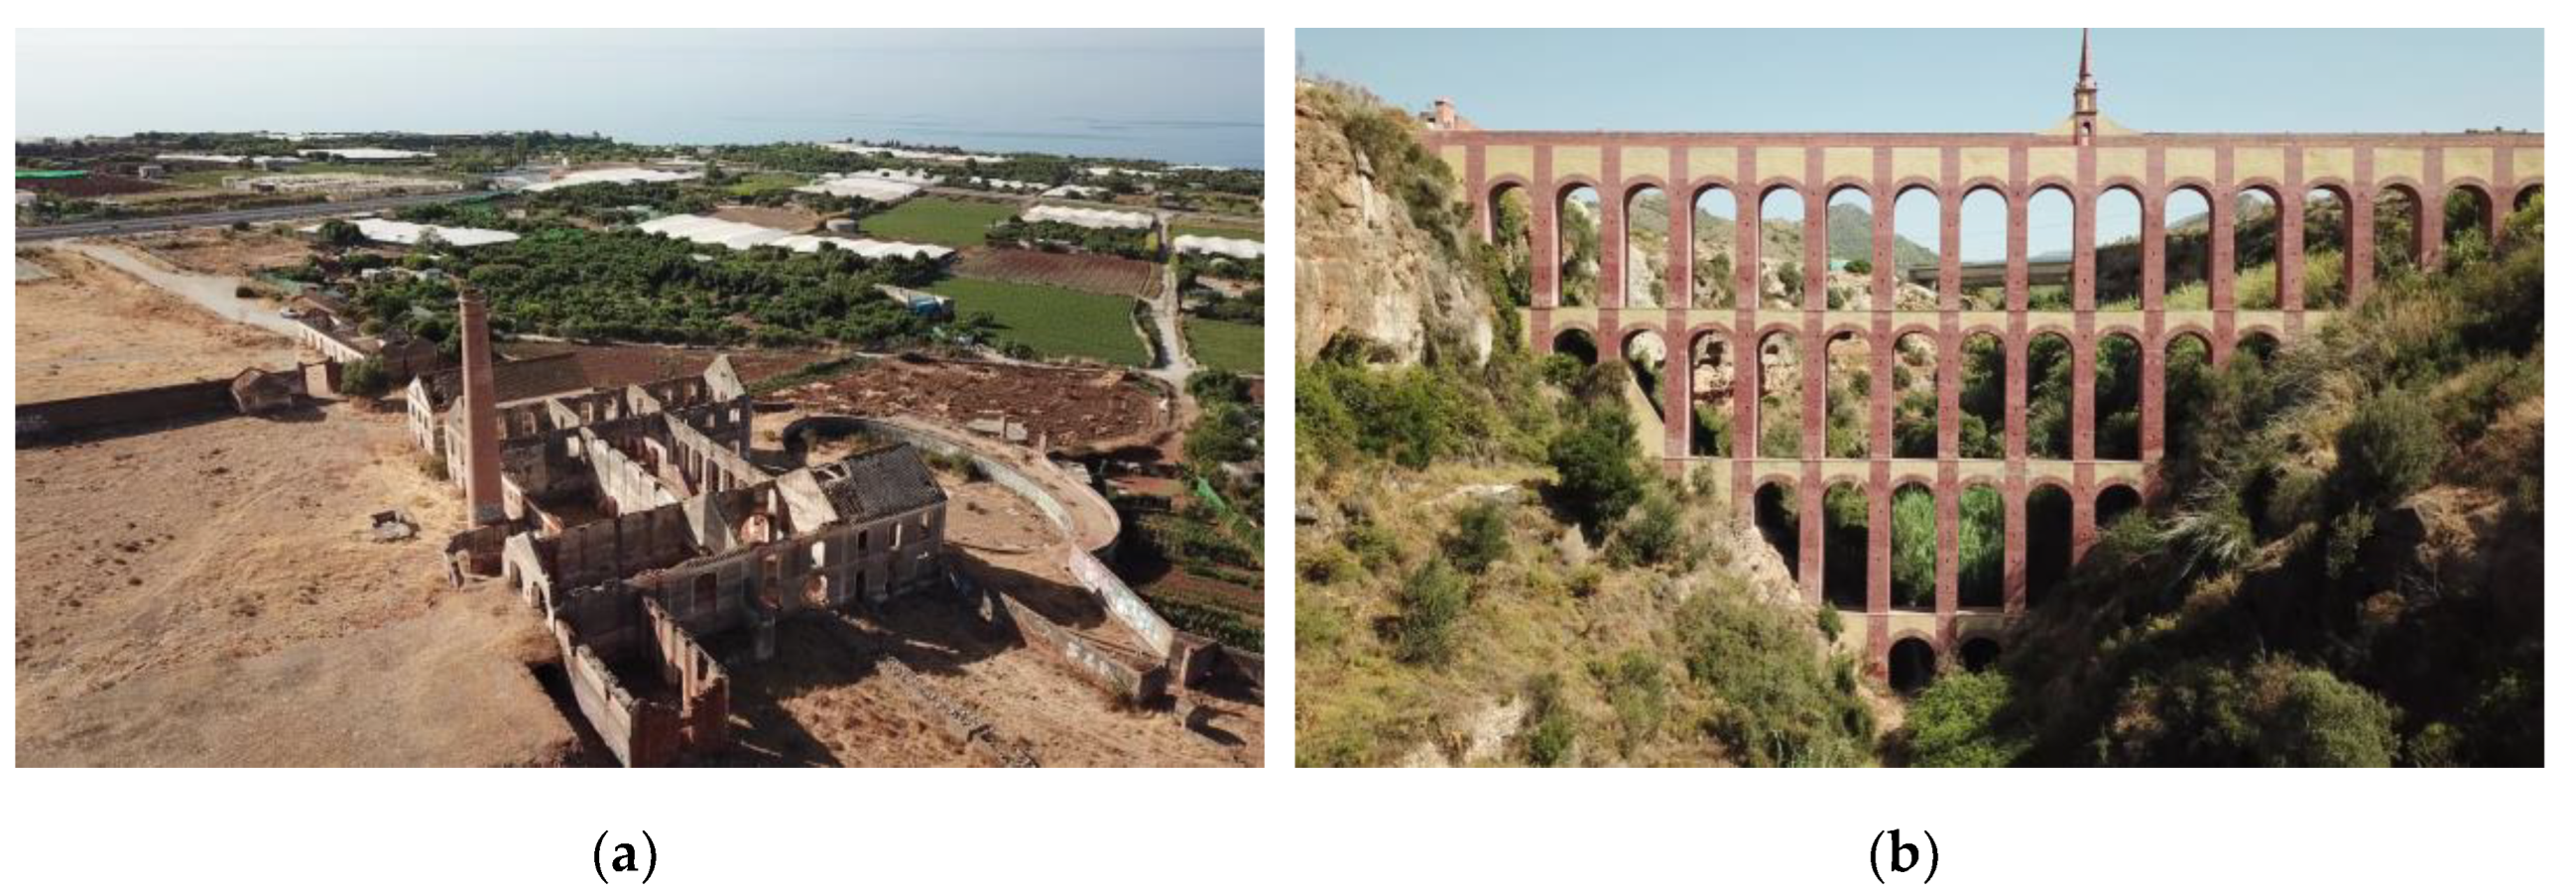
Figure 2.
San Joaquín sugar mill. (a) Access and buildings; (b) Front and rear views. (c) Aerial views.
Figure 2.
San Joaquín sugar mill. (a) Access and buildings; (b) Front and rear views. (c) Aerial views.
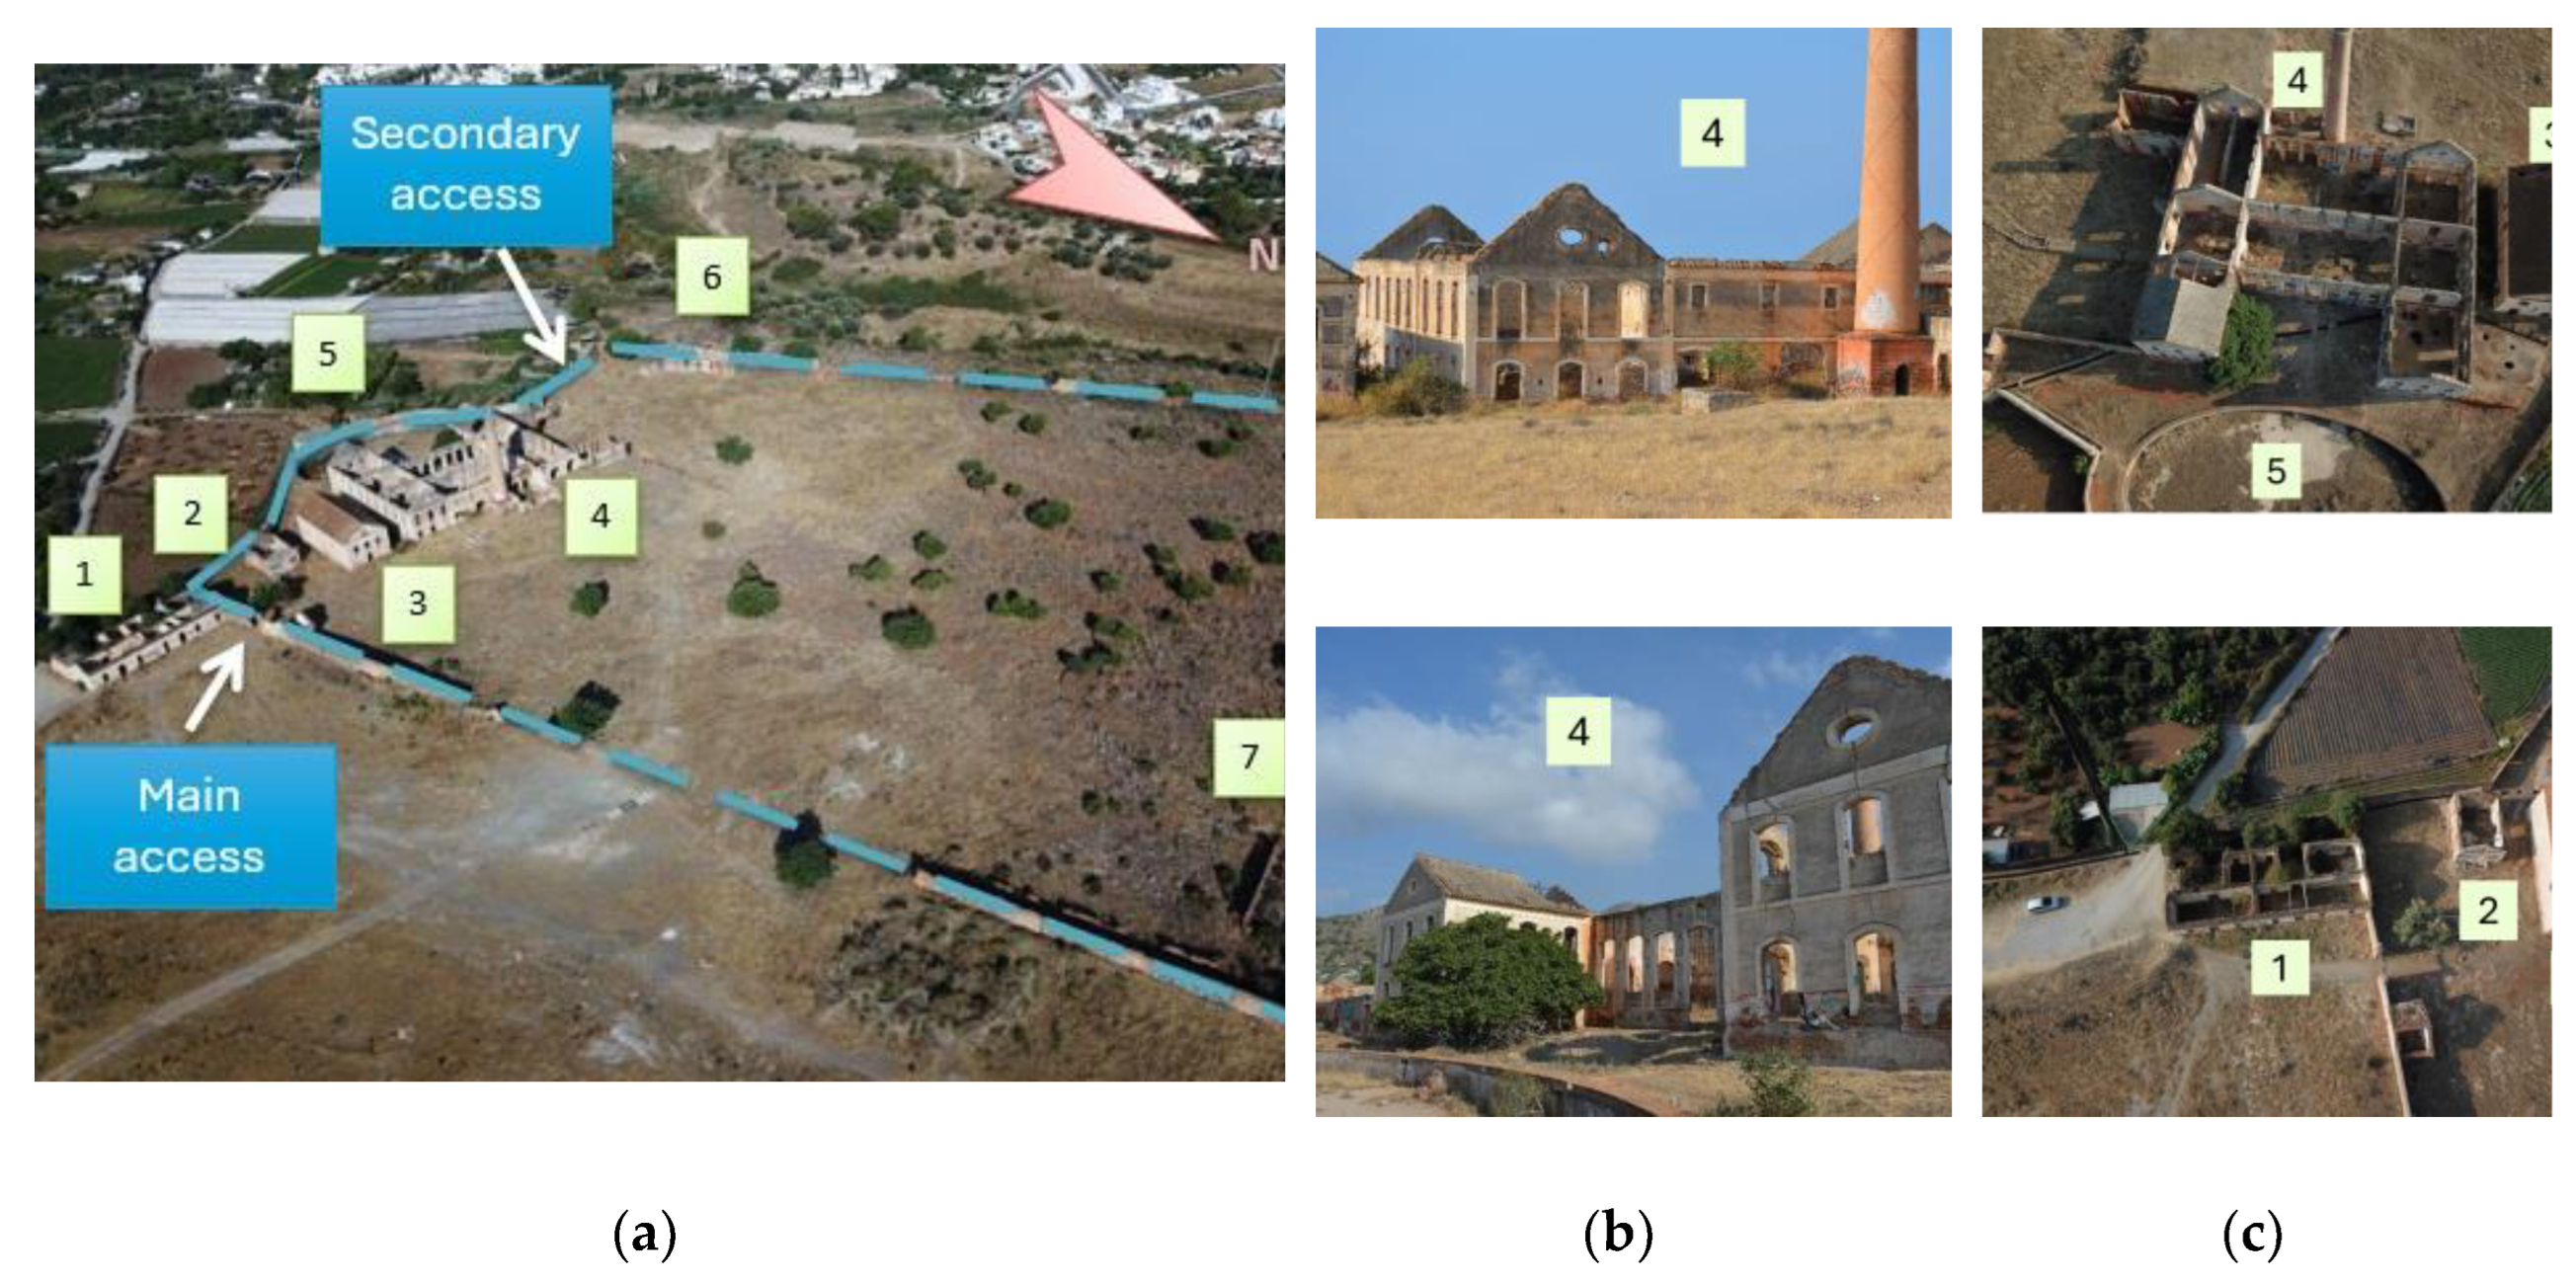
Figure 3.
UAV for aerial image acquisition.
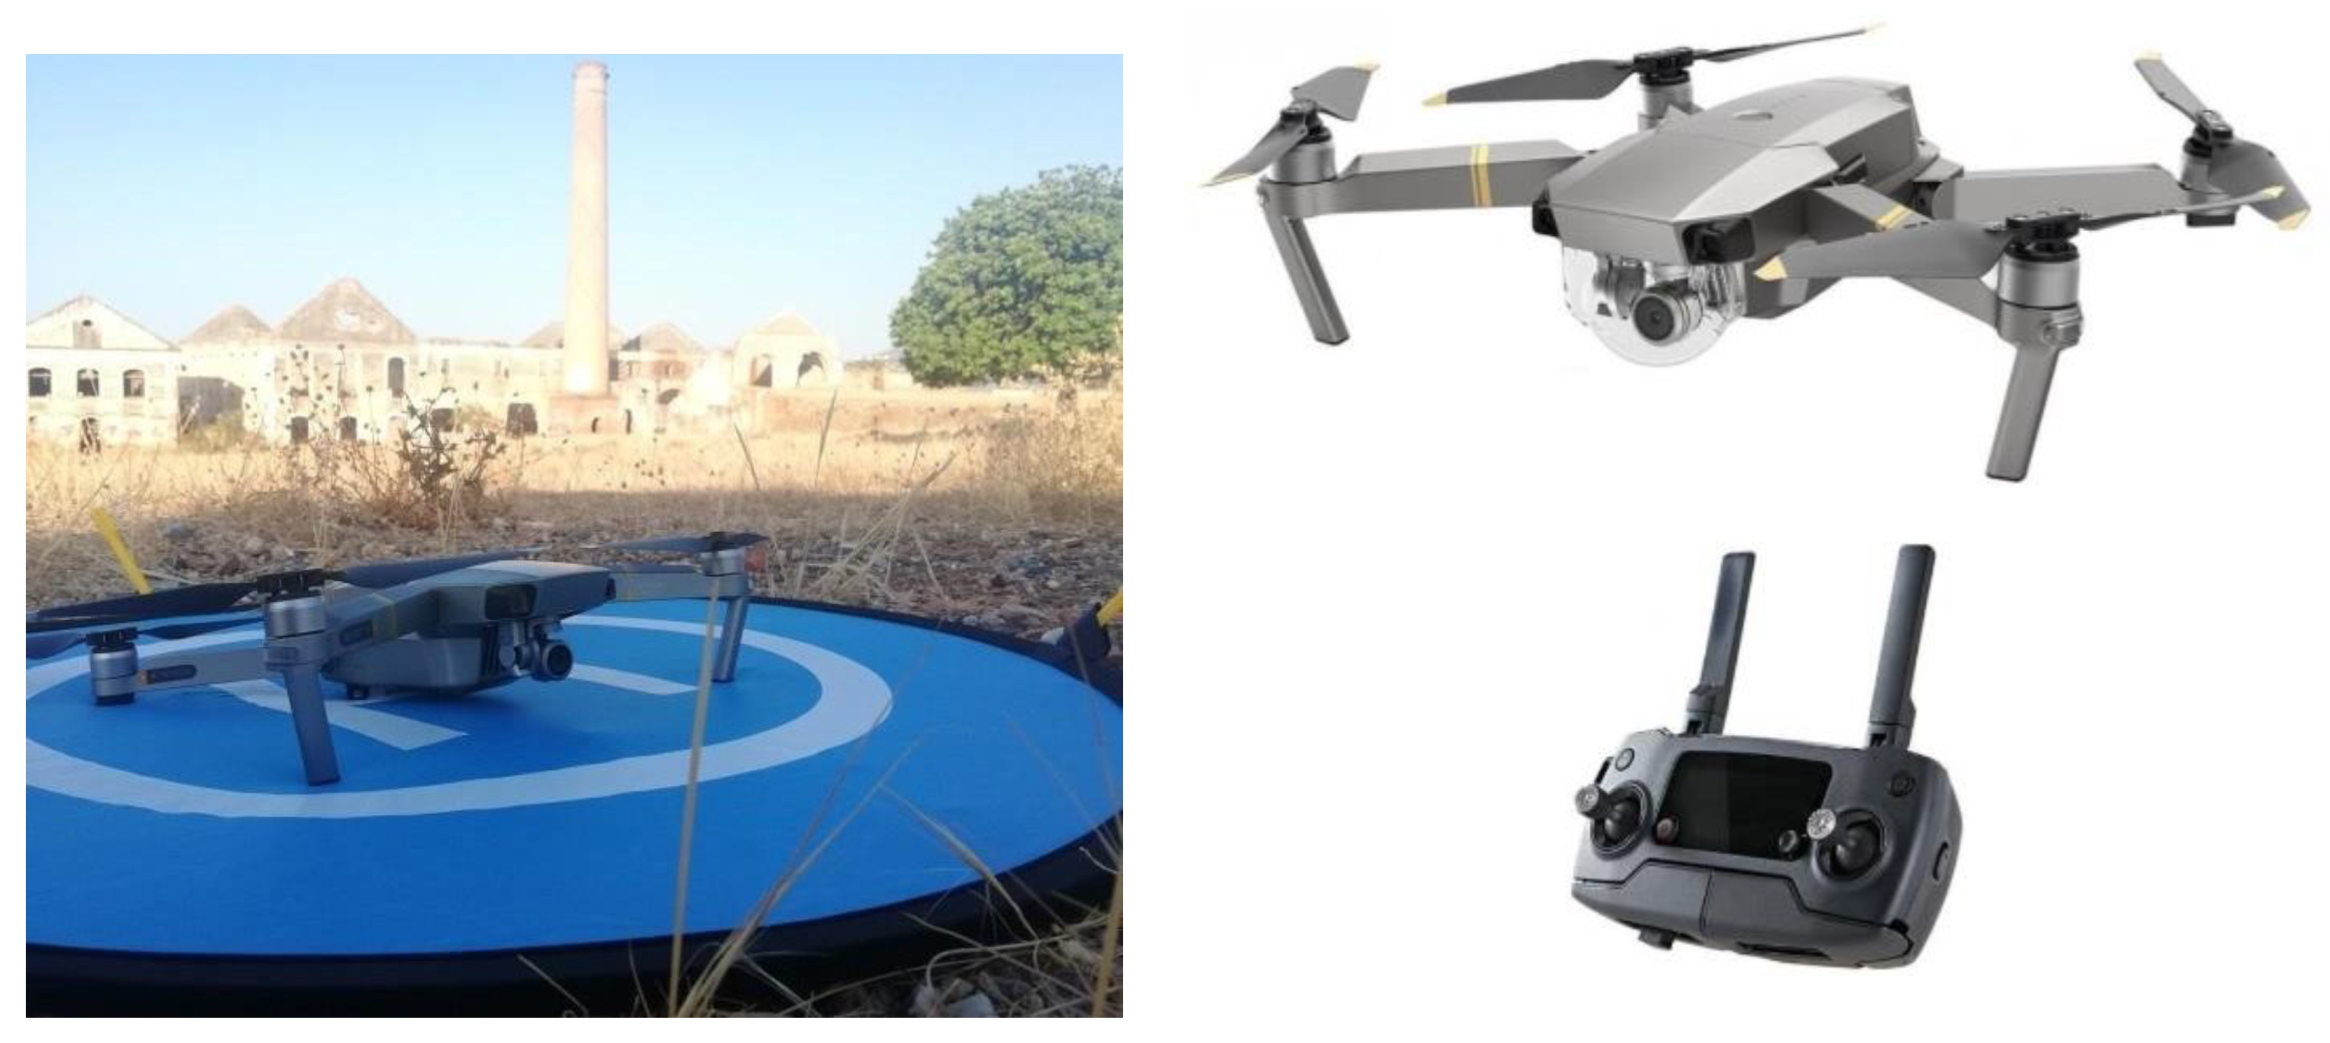
Figure 4.
Design of the (a) UAV flight conditions and (b) flight paths.
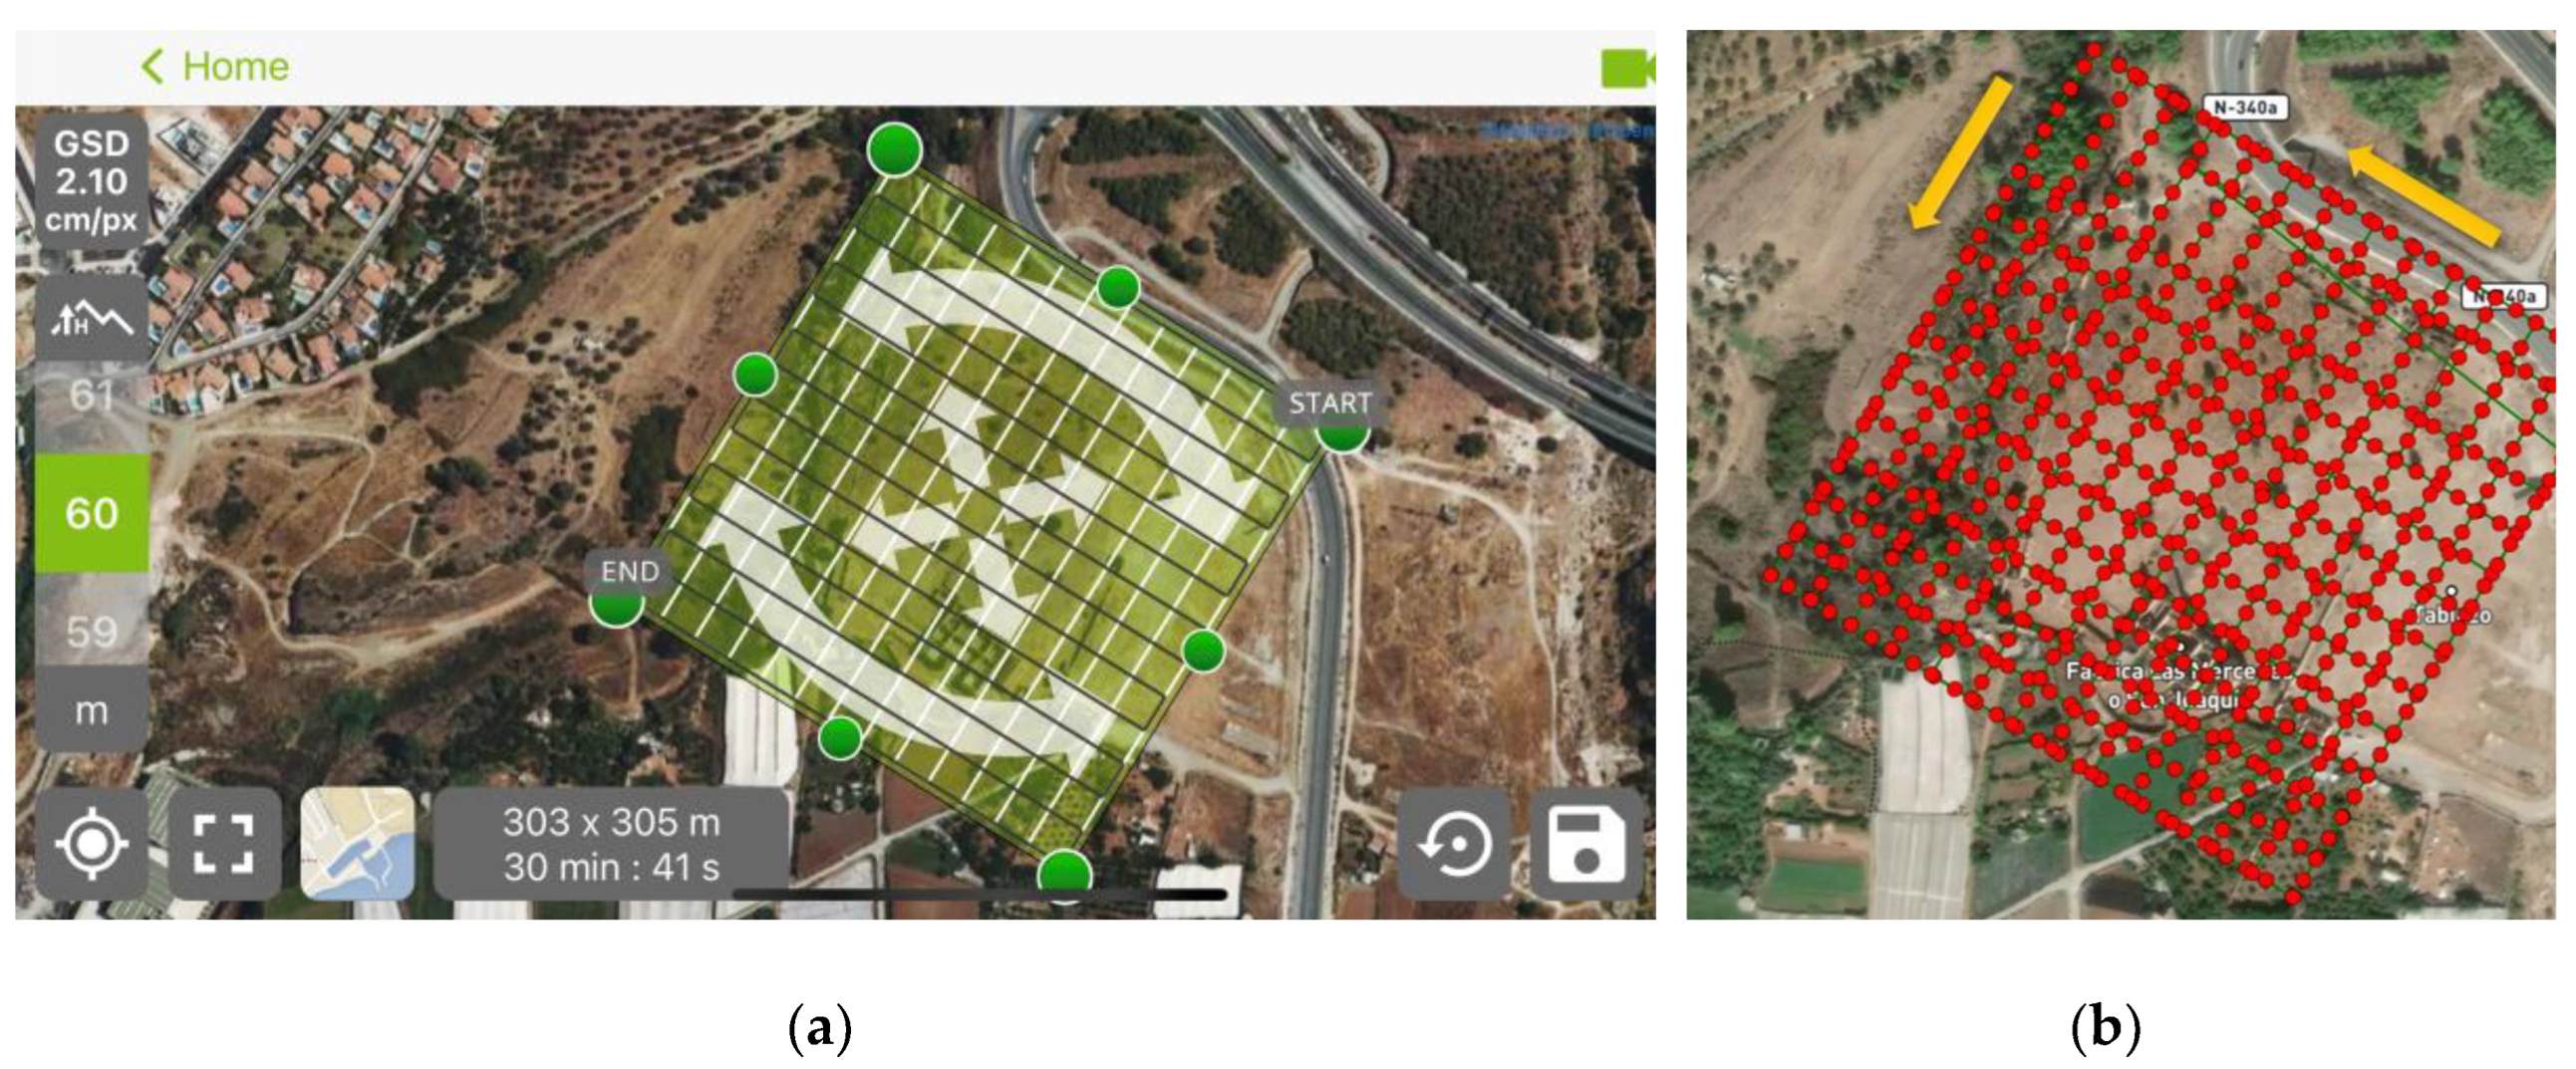
Figure 5.
Reconstruction process for each model: (a) Flight path; (b) Image overlap; (c) Image generated from the point cloud.
Figure 5.
Reconstruction process for each model: (a) Flight path; (b) Image overlap; (c) Image generated from the point cloud.
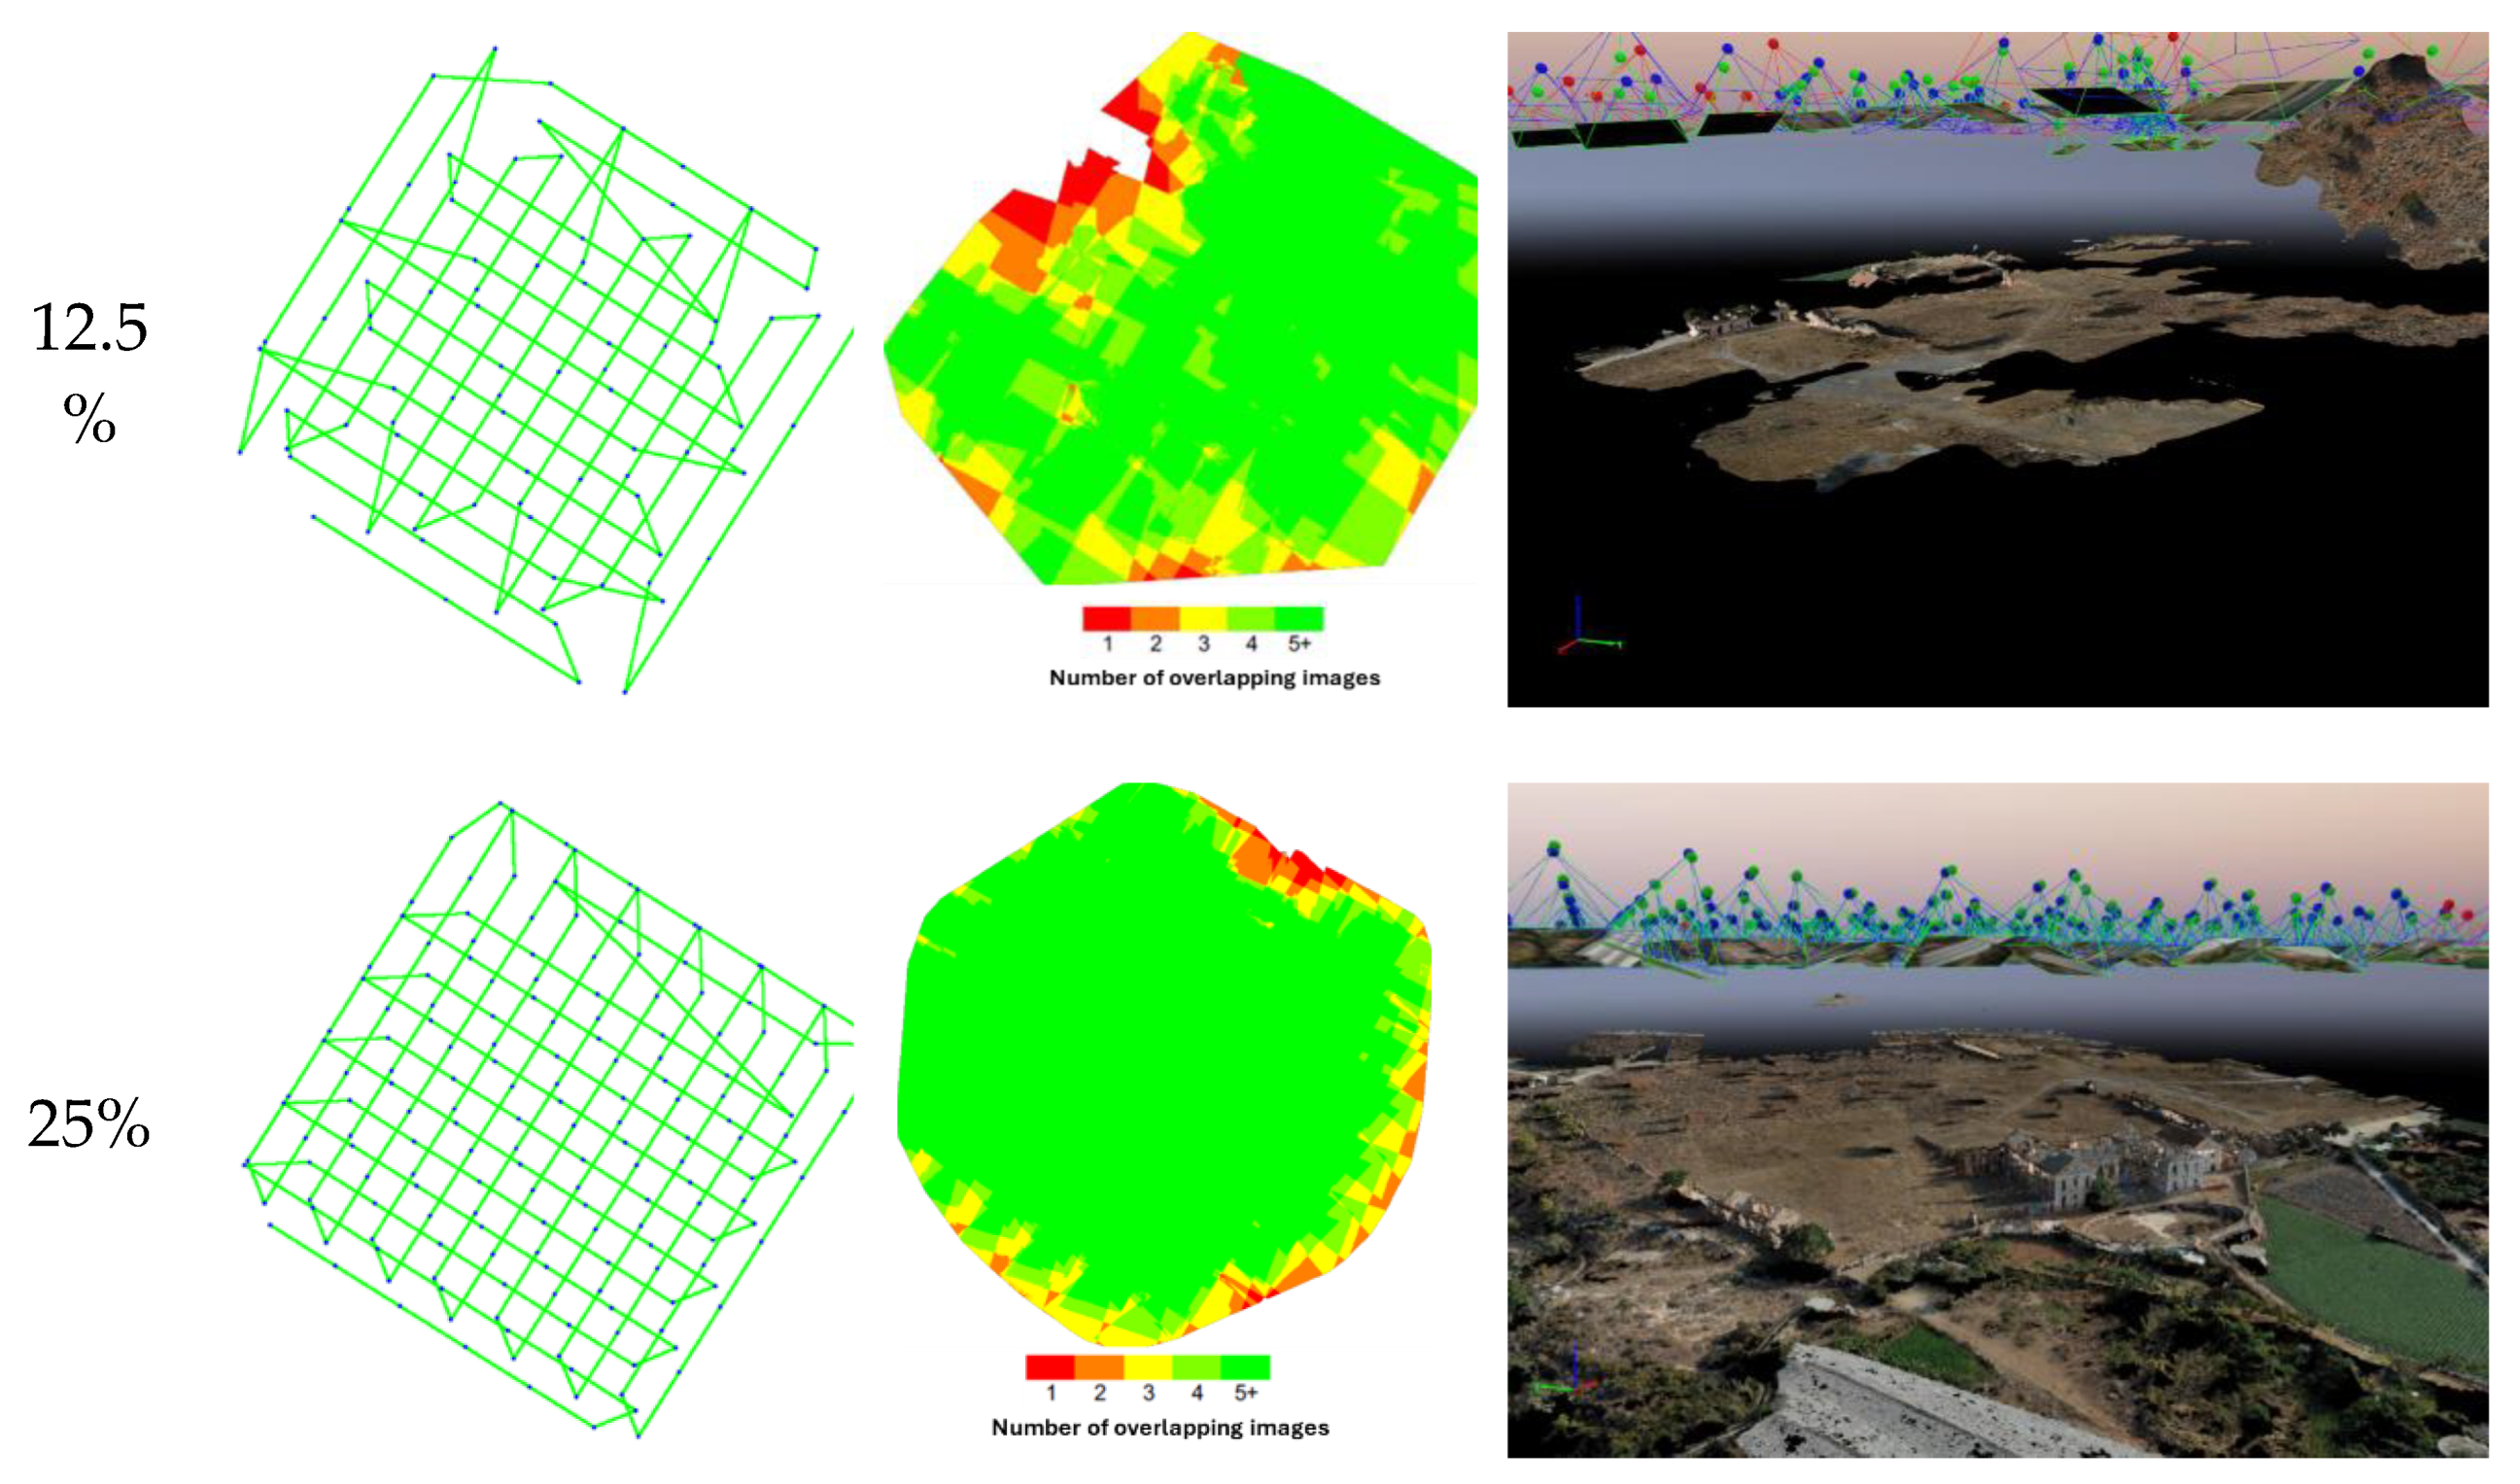
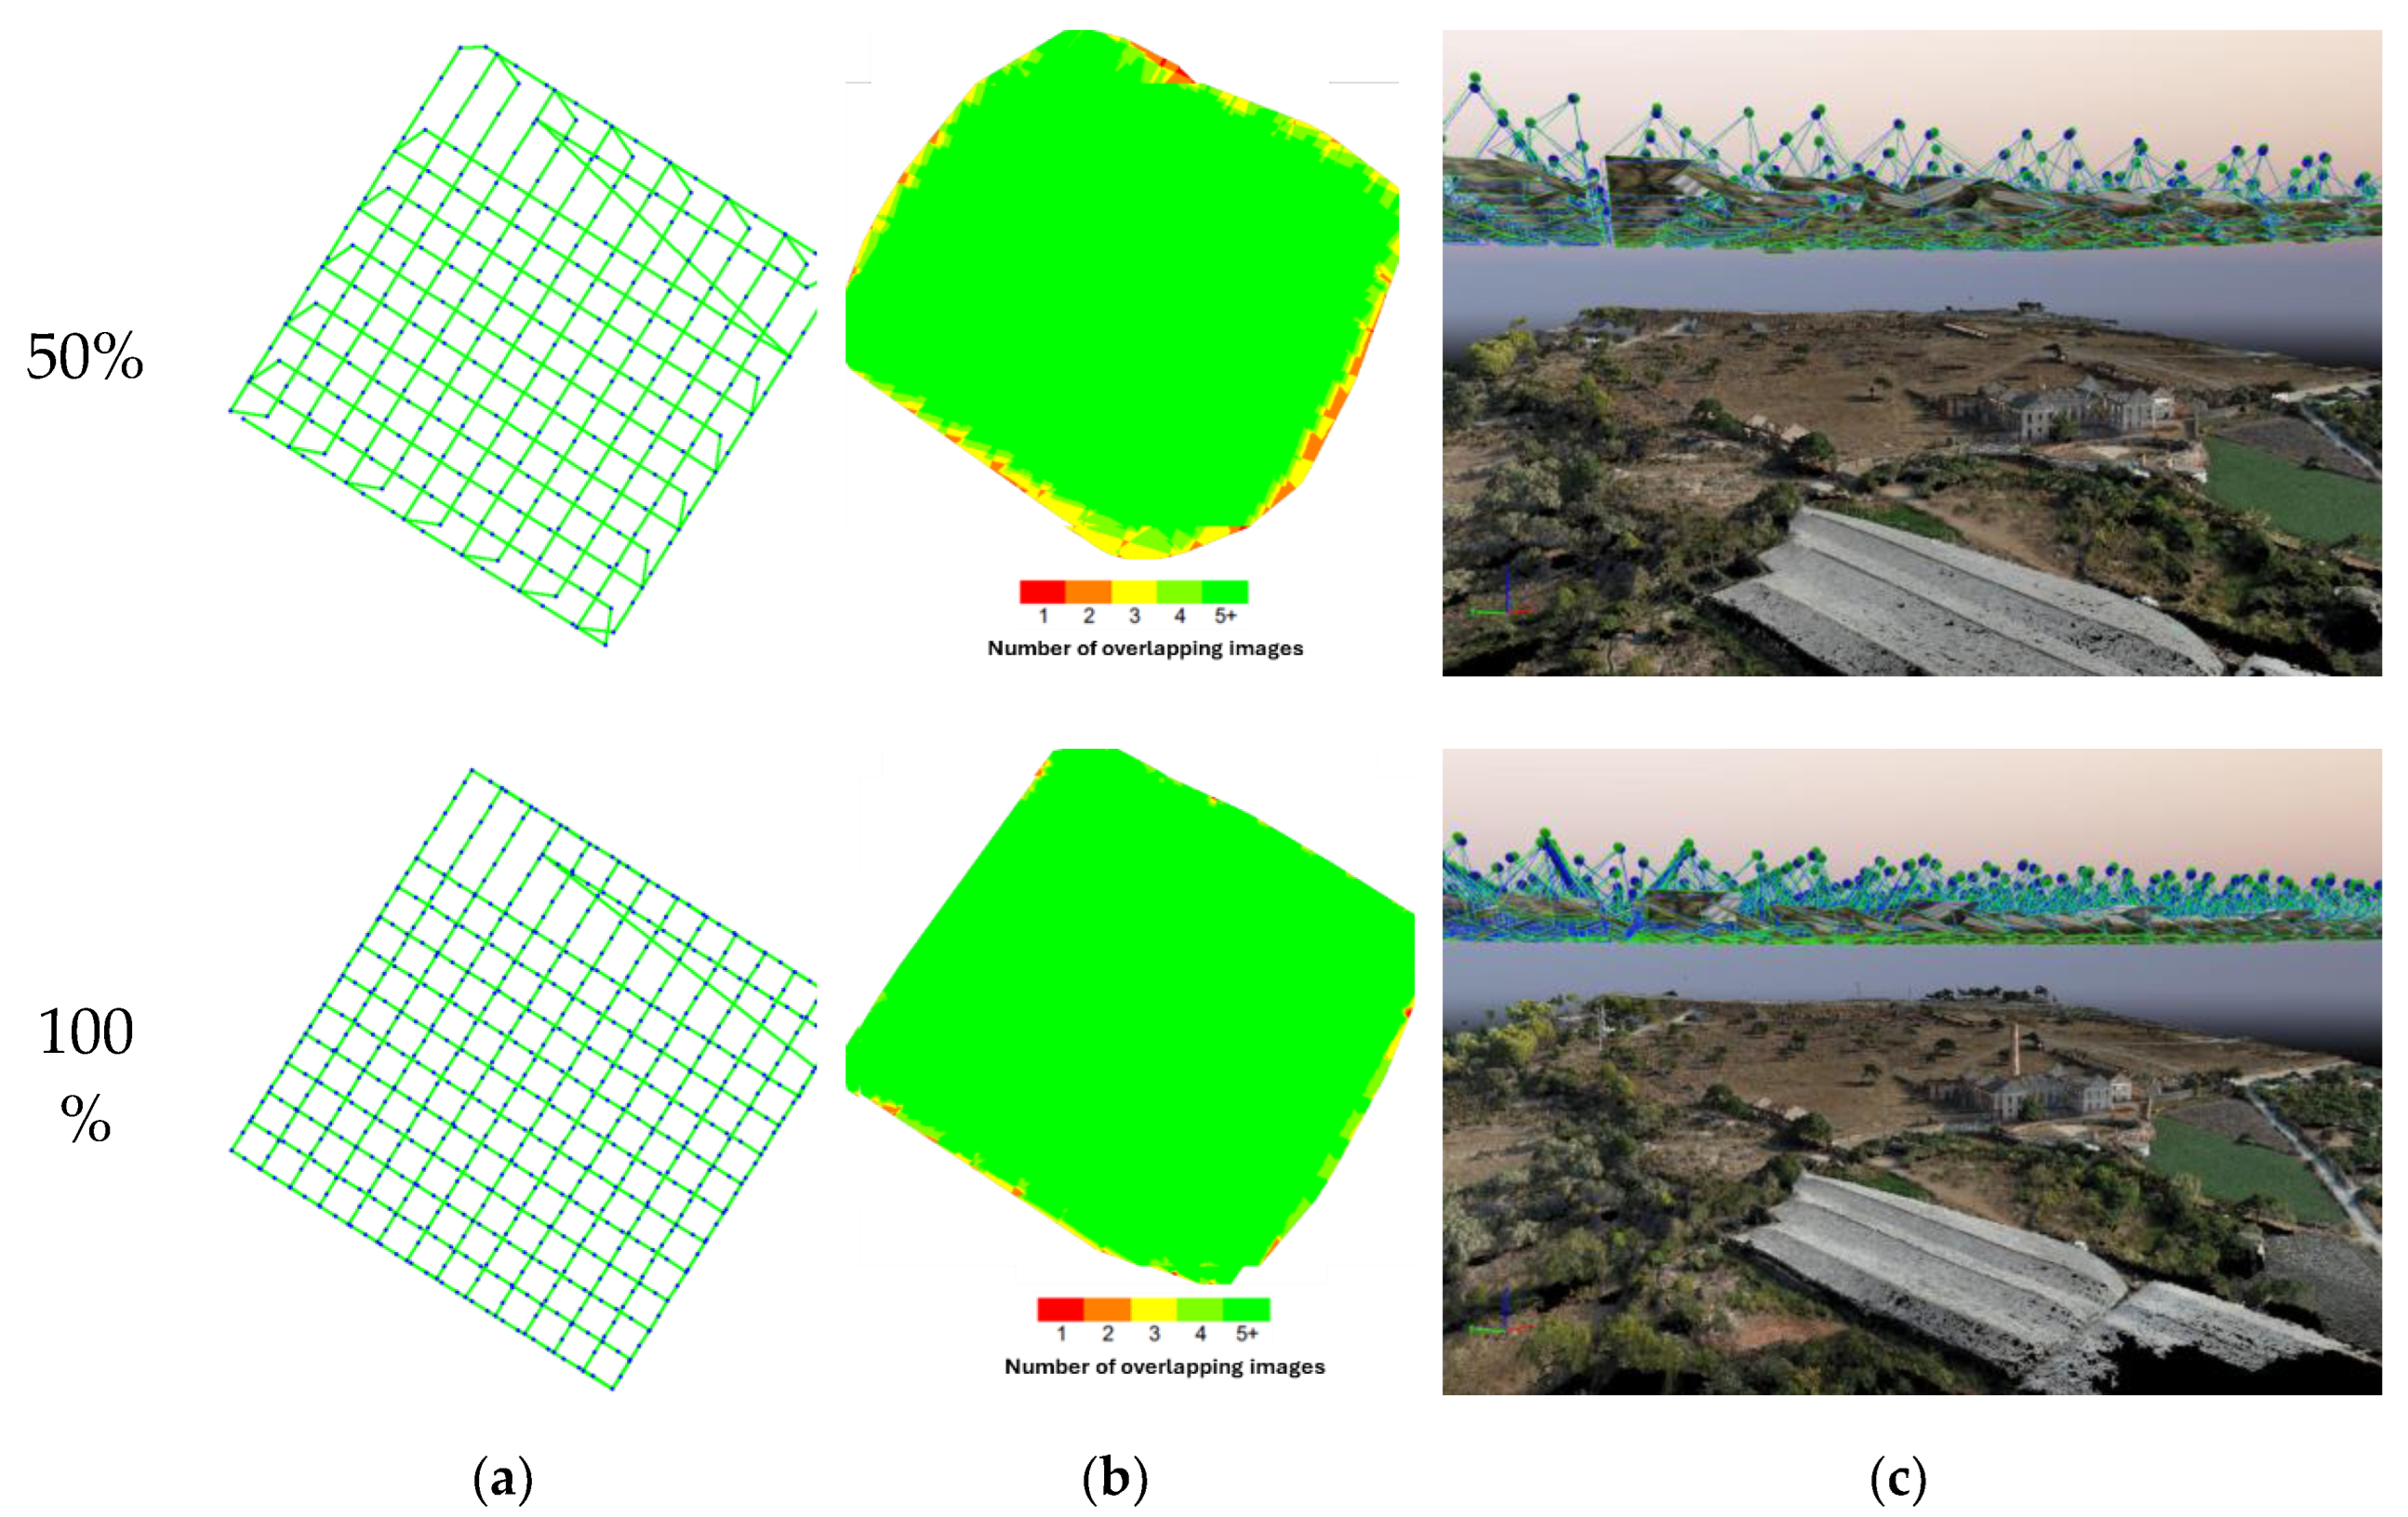
Figure 6.
Dense point-cloud model of the San Joaquín sugar mill: (a) 12.5%, (b) 25%, (c) 50%, and (d) 100% of the acquired images.
Figure 6.
Dense point-cloud model of the San Joaquín sugar mill: (a) 12.5%, (b) 25%, (c) 50%, and (d) 100% of the acquired images.
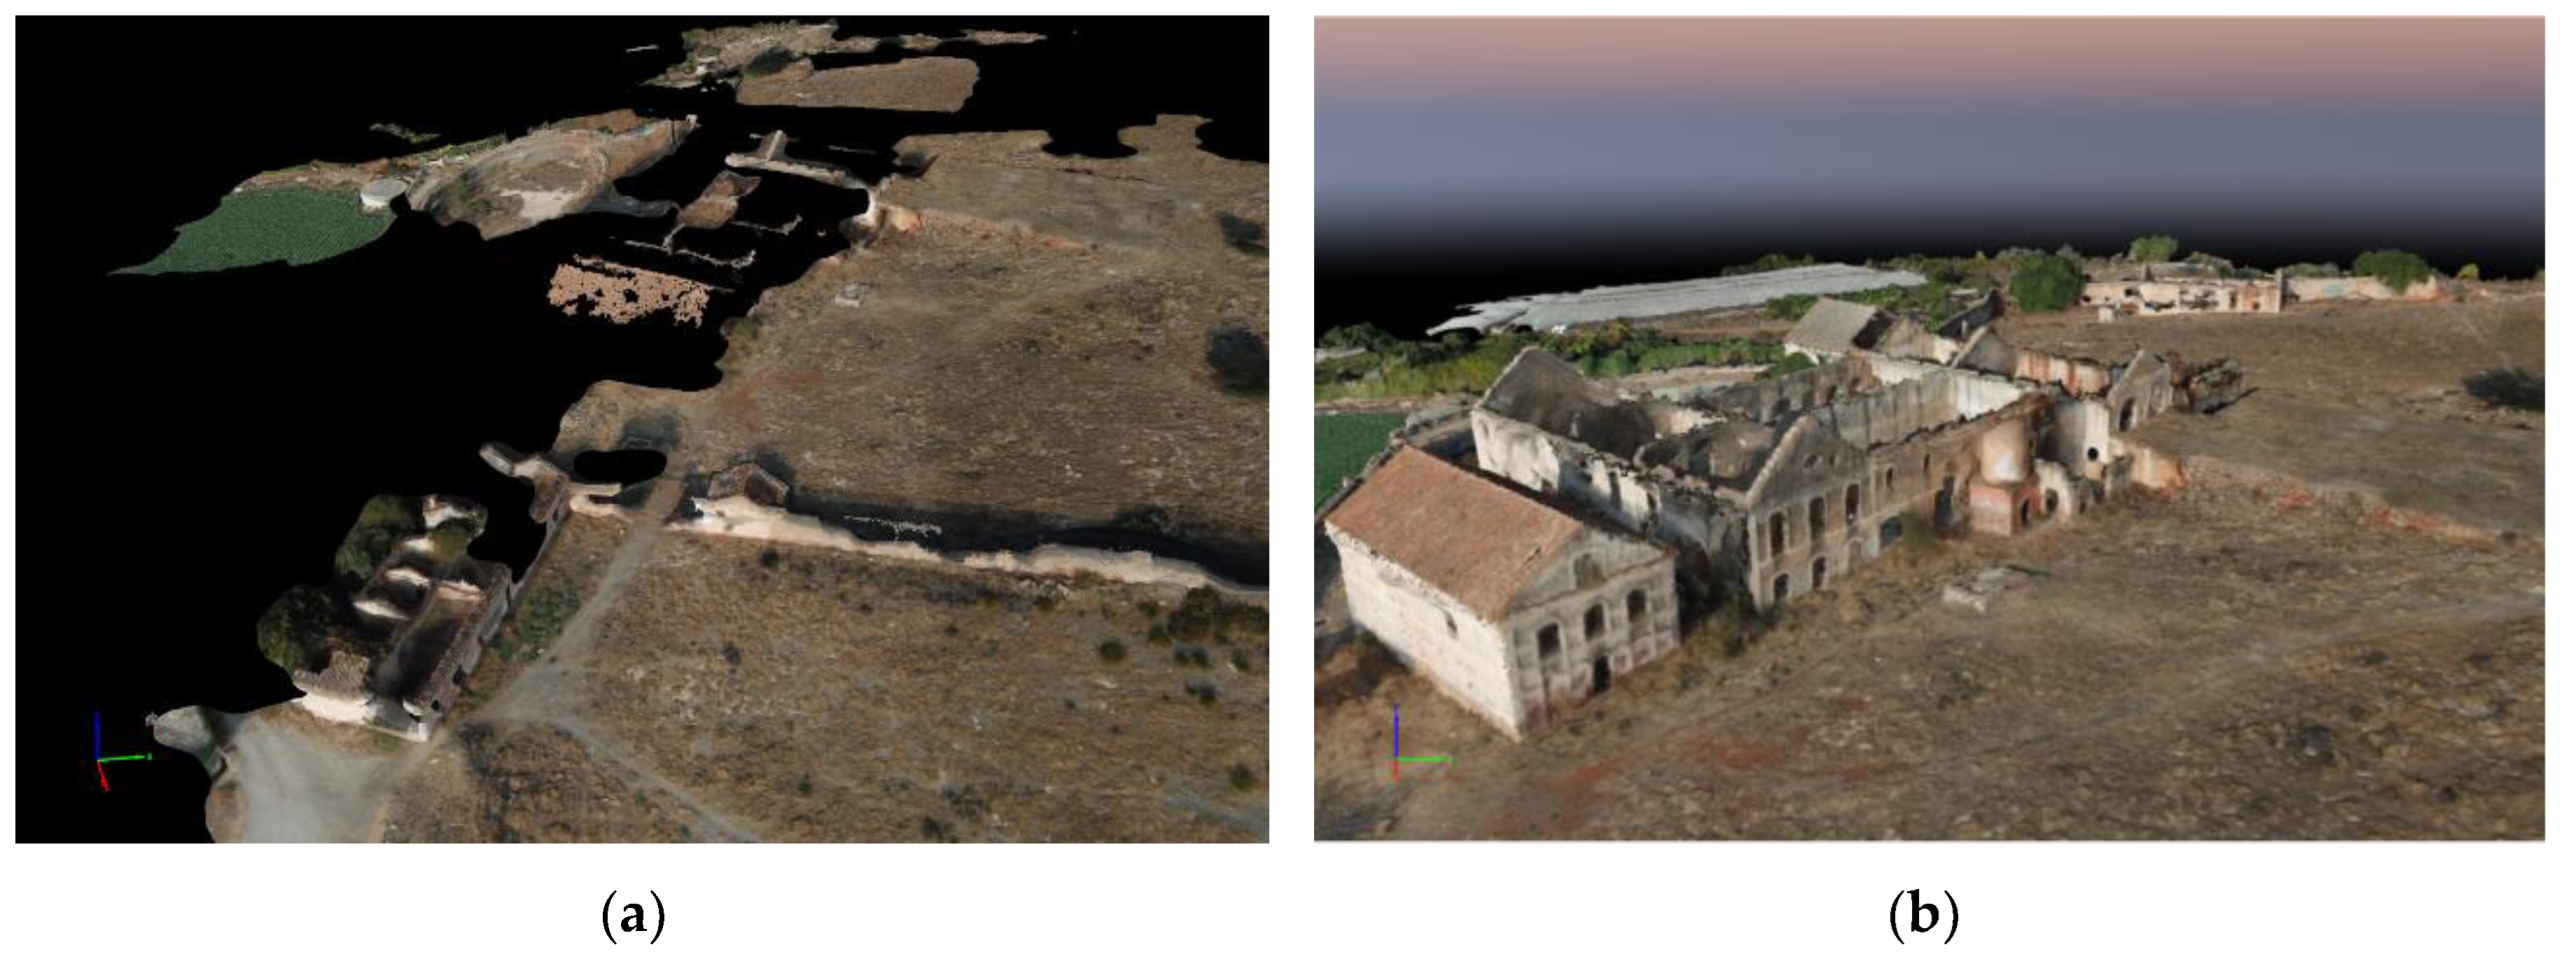
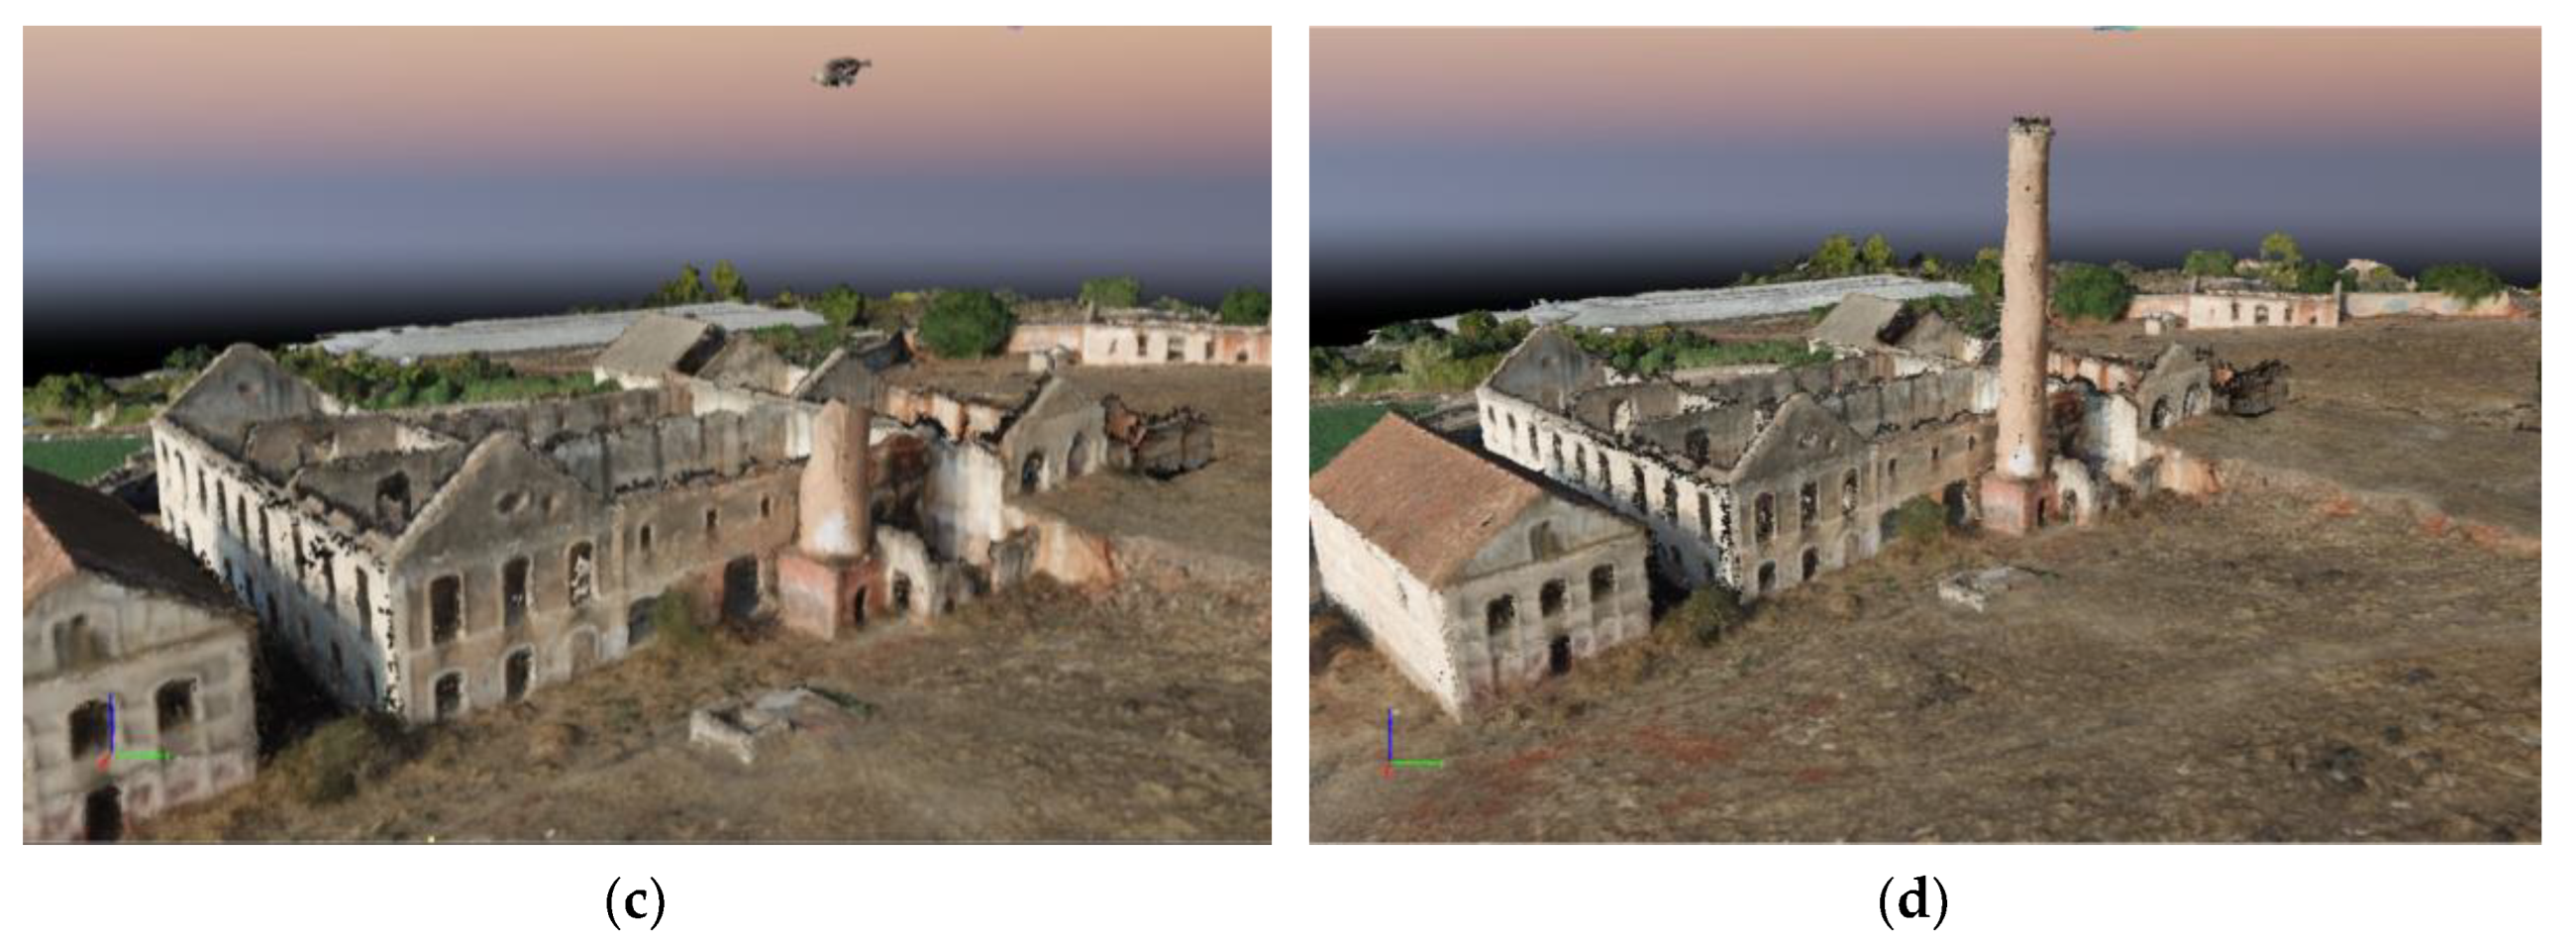
Figure 7.
Reference measurement elements: (a) Width of the side door in the outer wall; (b) Length of the chimney base; (c) Width of the chimney base; (d) Height of the chimney base; (e) Width of the door of the building to the left of the main building; (f) Height of the door of the building to the left of the main building.
Figure 7.
Reference measurement elements: (a) Width of the side door in the outer wall; (b) Length of the chimney base; (c) Width of the chimney base; (d) Height of the chimney base; (e) Width of the door of the building to the left of the main building; (f) Height of the door of the building to the left of the main building.
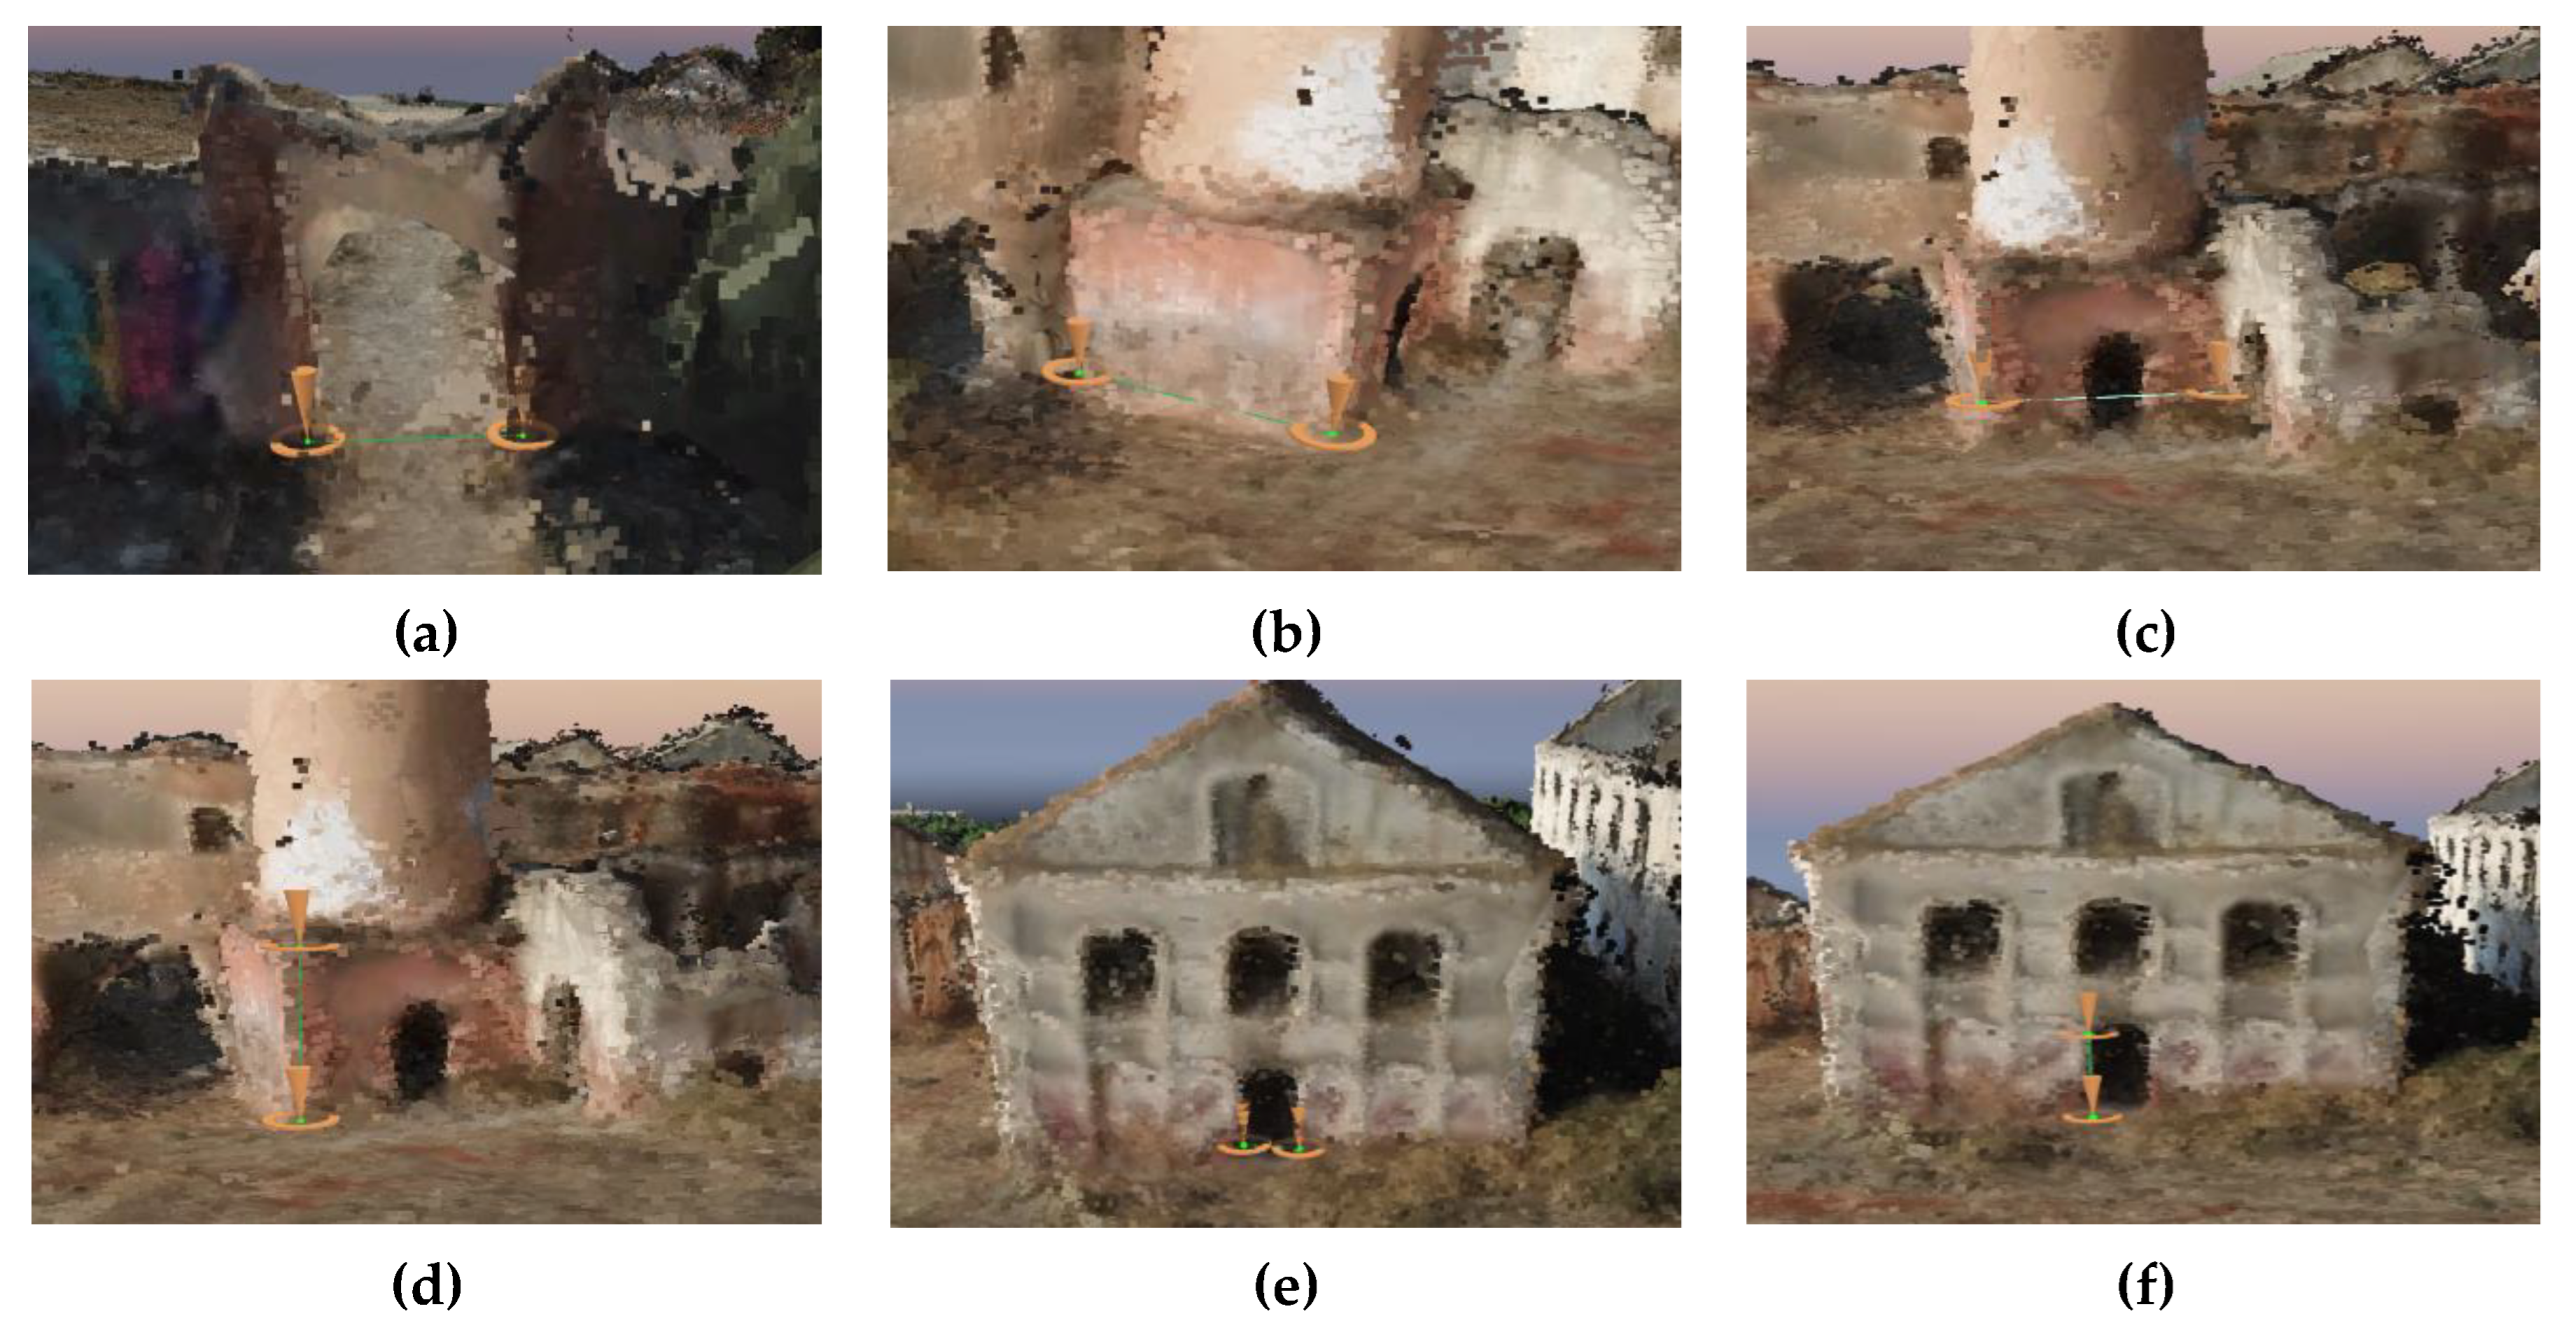
Figure 8.
Digital point-cloud model obtained using 100% of the photographs: (a) General view; (b) North facade; (c) South facade.
Figure 8.
Digital point-cloud model obtained using 100% of the photographs: (a) General view; (b) North facade; (c) South facade.
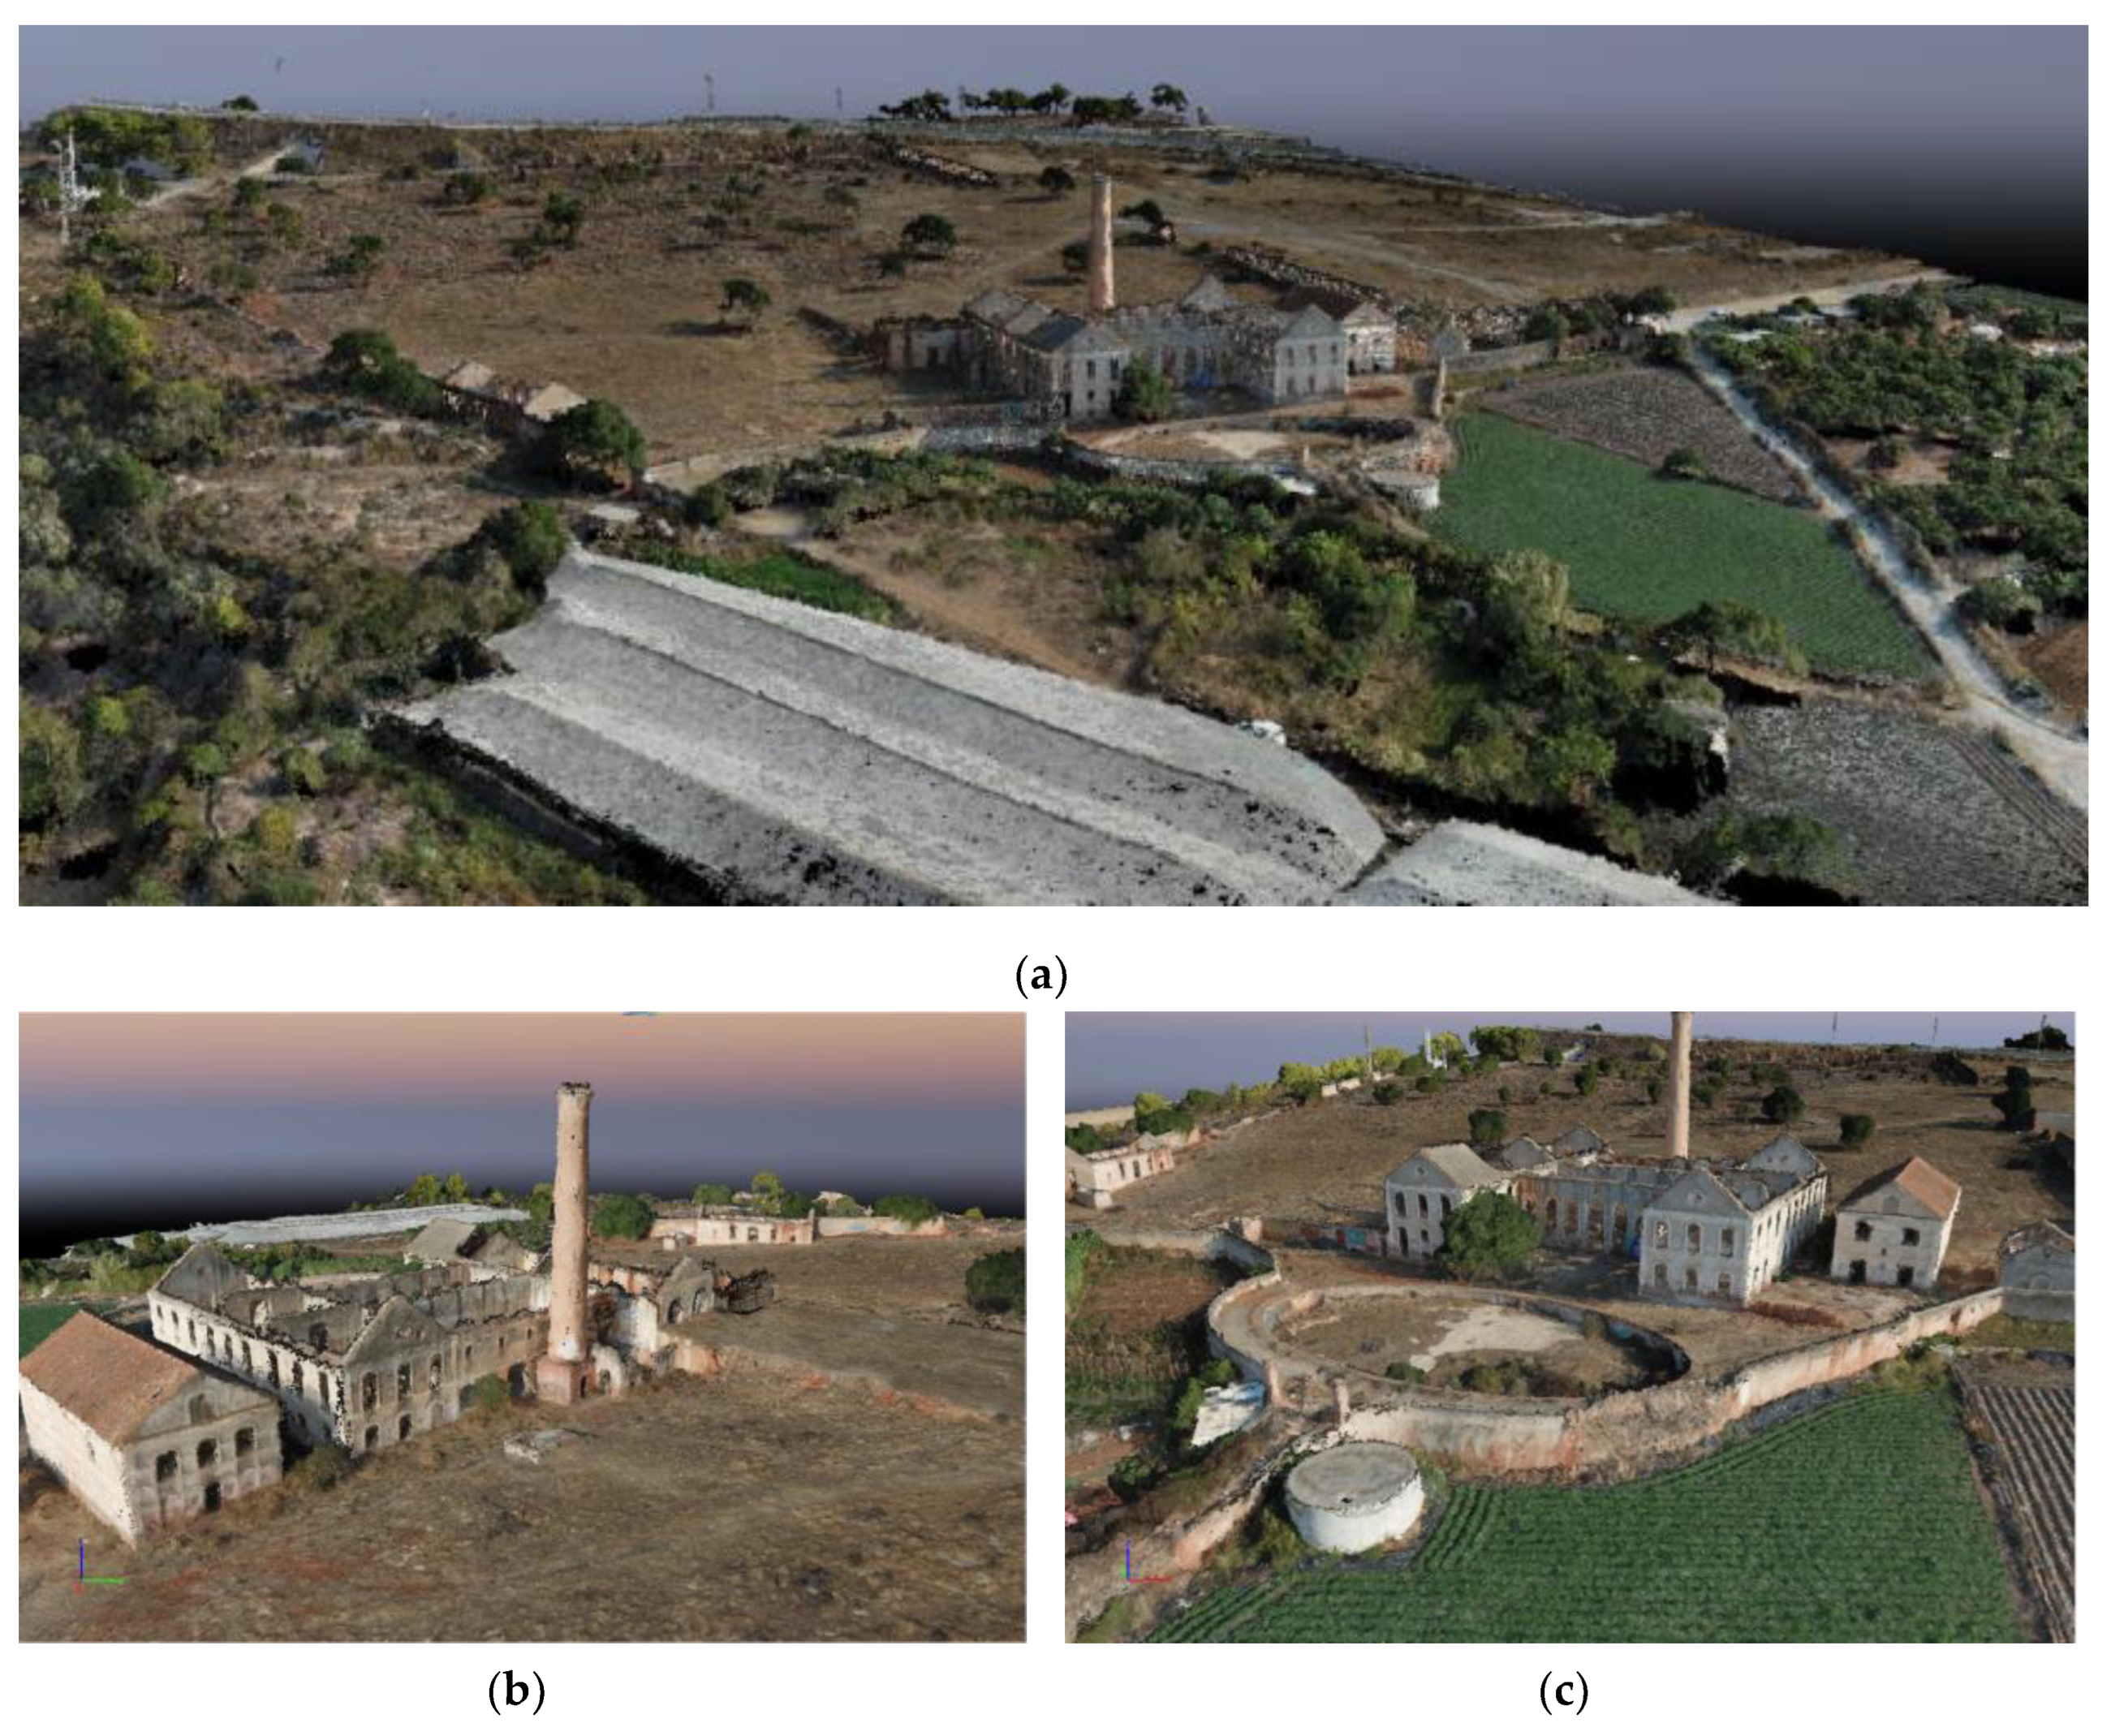
Figure 9.
Digital point-cloud: (a) Main building in Autodesk Recap; (b) General view in Autodesk Revit.
Figure 9.
Digital point-cloud: (a) Main building in Autodesk Recap; (b) General view in Autodesk Revit.
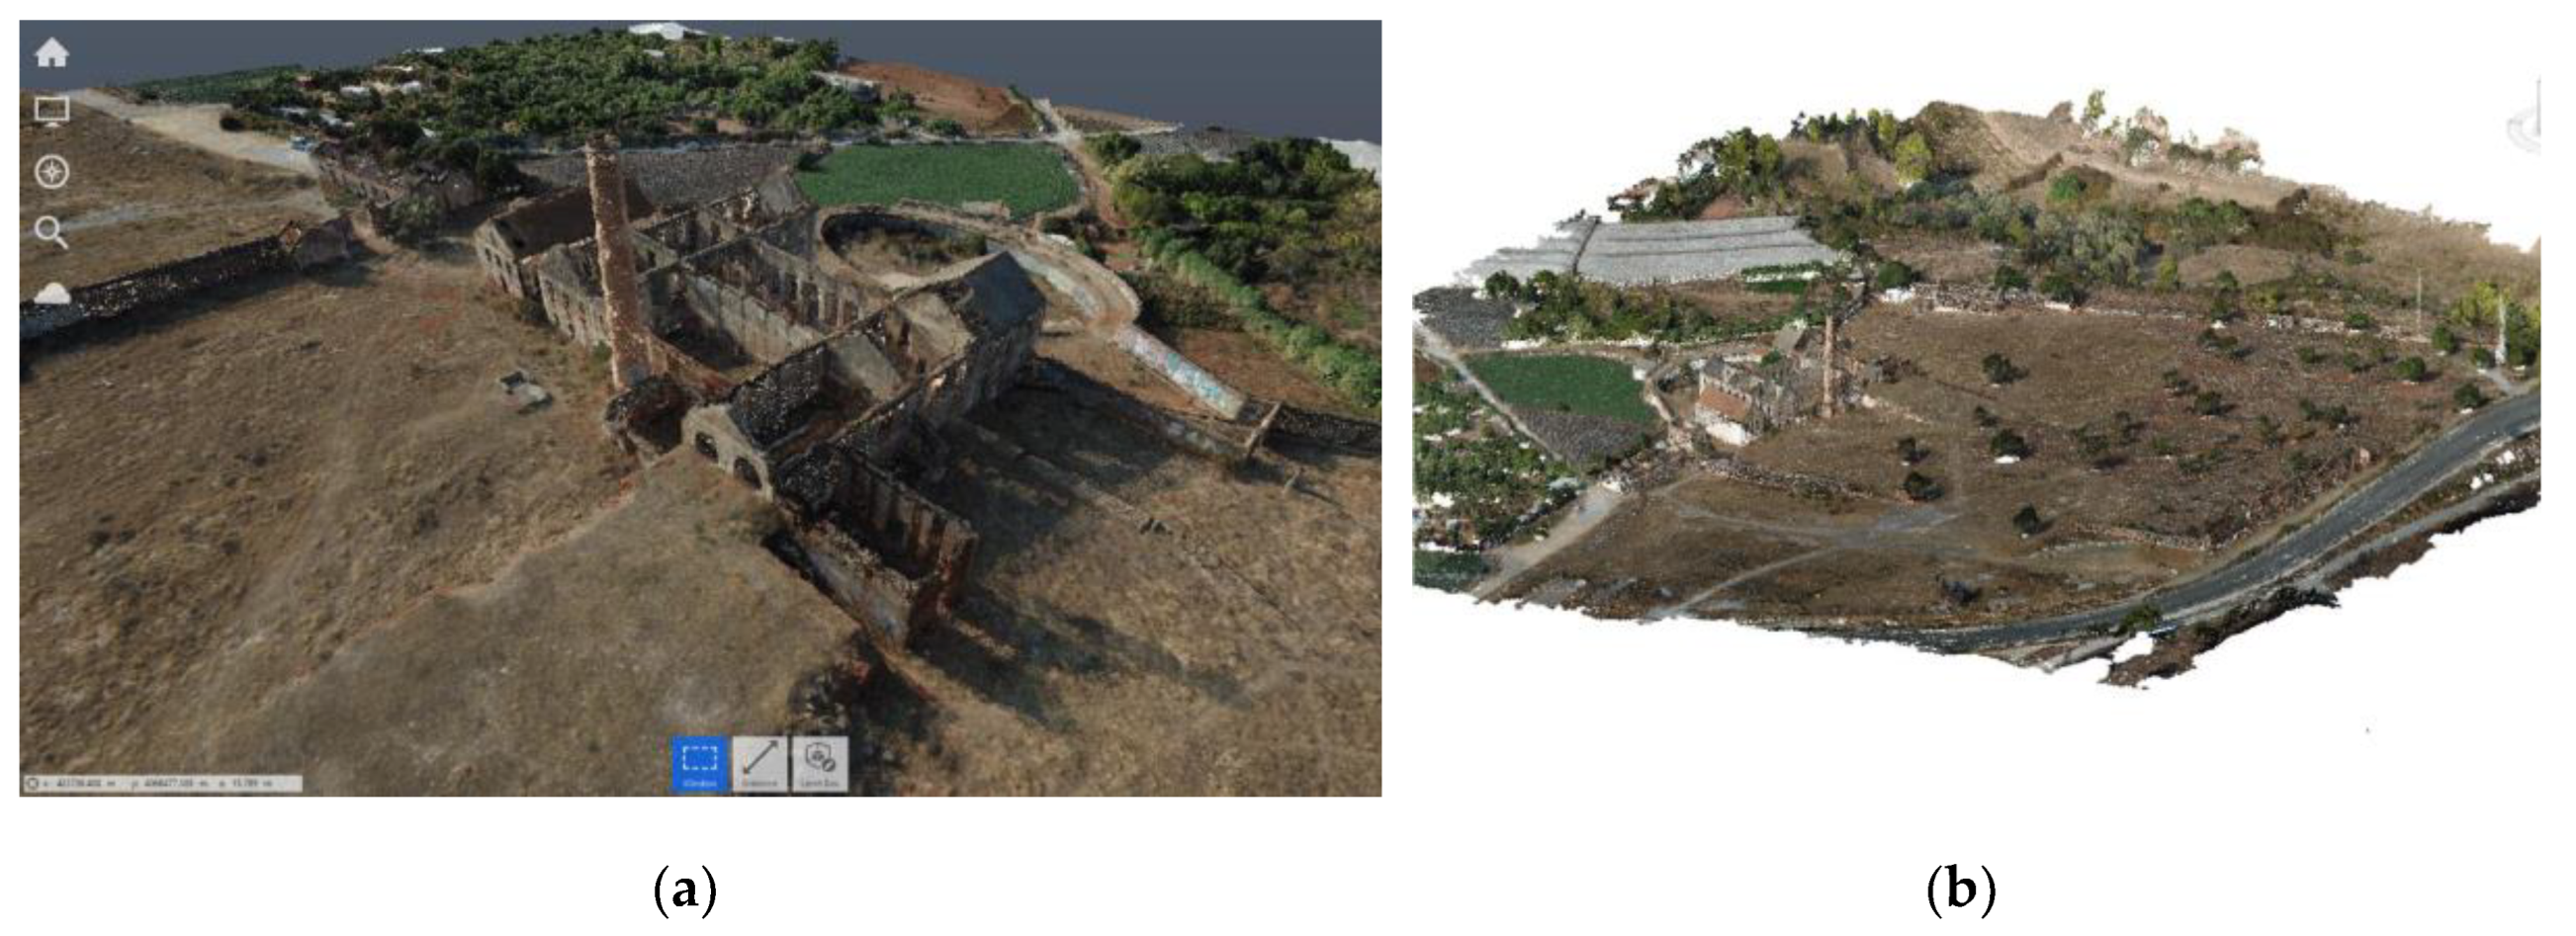
Figure 10.
HBIM model: (a) Front overview; (b) Rear overview; (c) North facade of the main building; (d) South facade of the main building.
Figure 10.
HBIM model: (a) Front overview; (b) Rear overview; (c) North facade of the main building; (d) South facade of the main building.
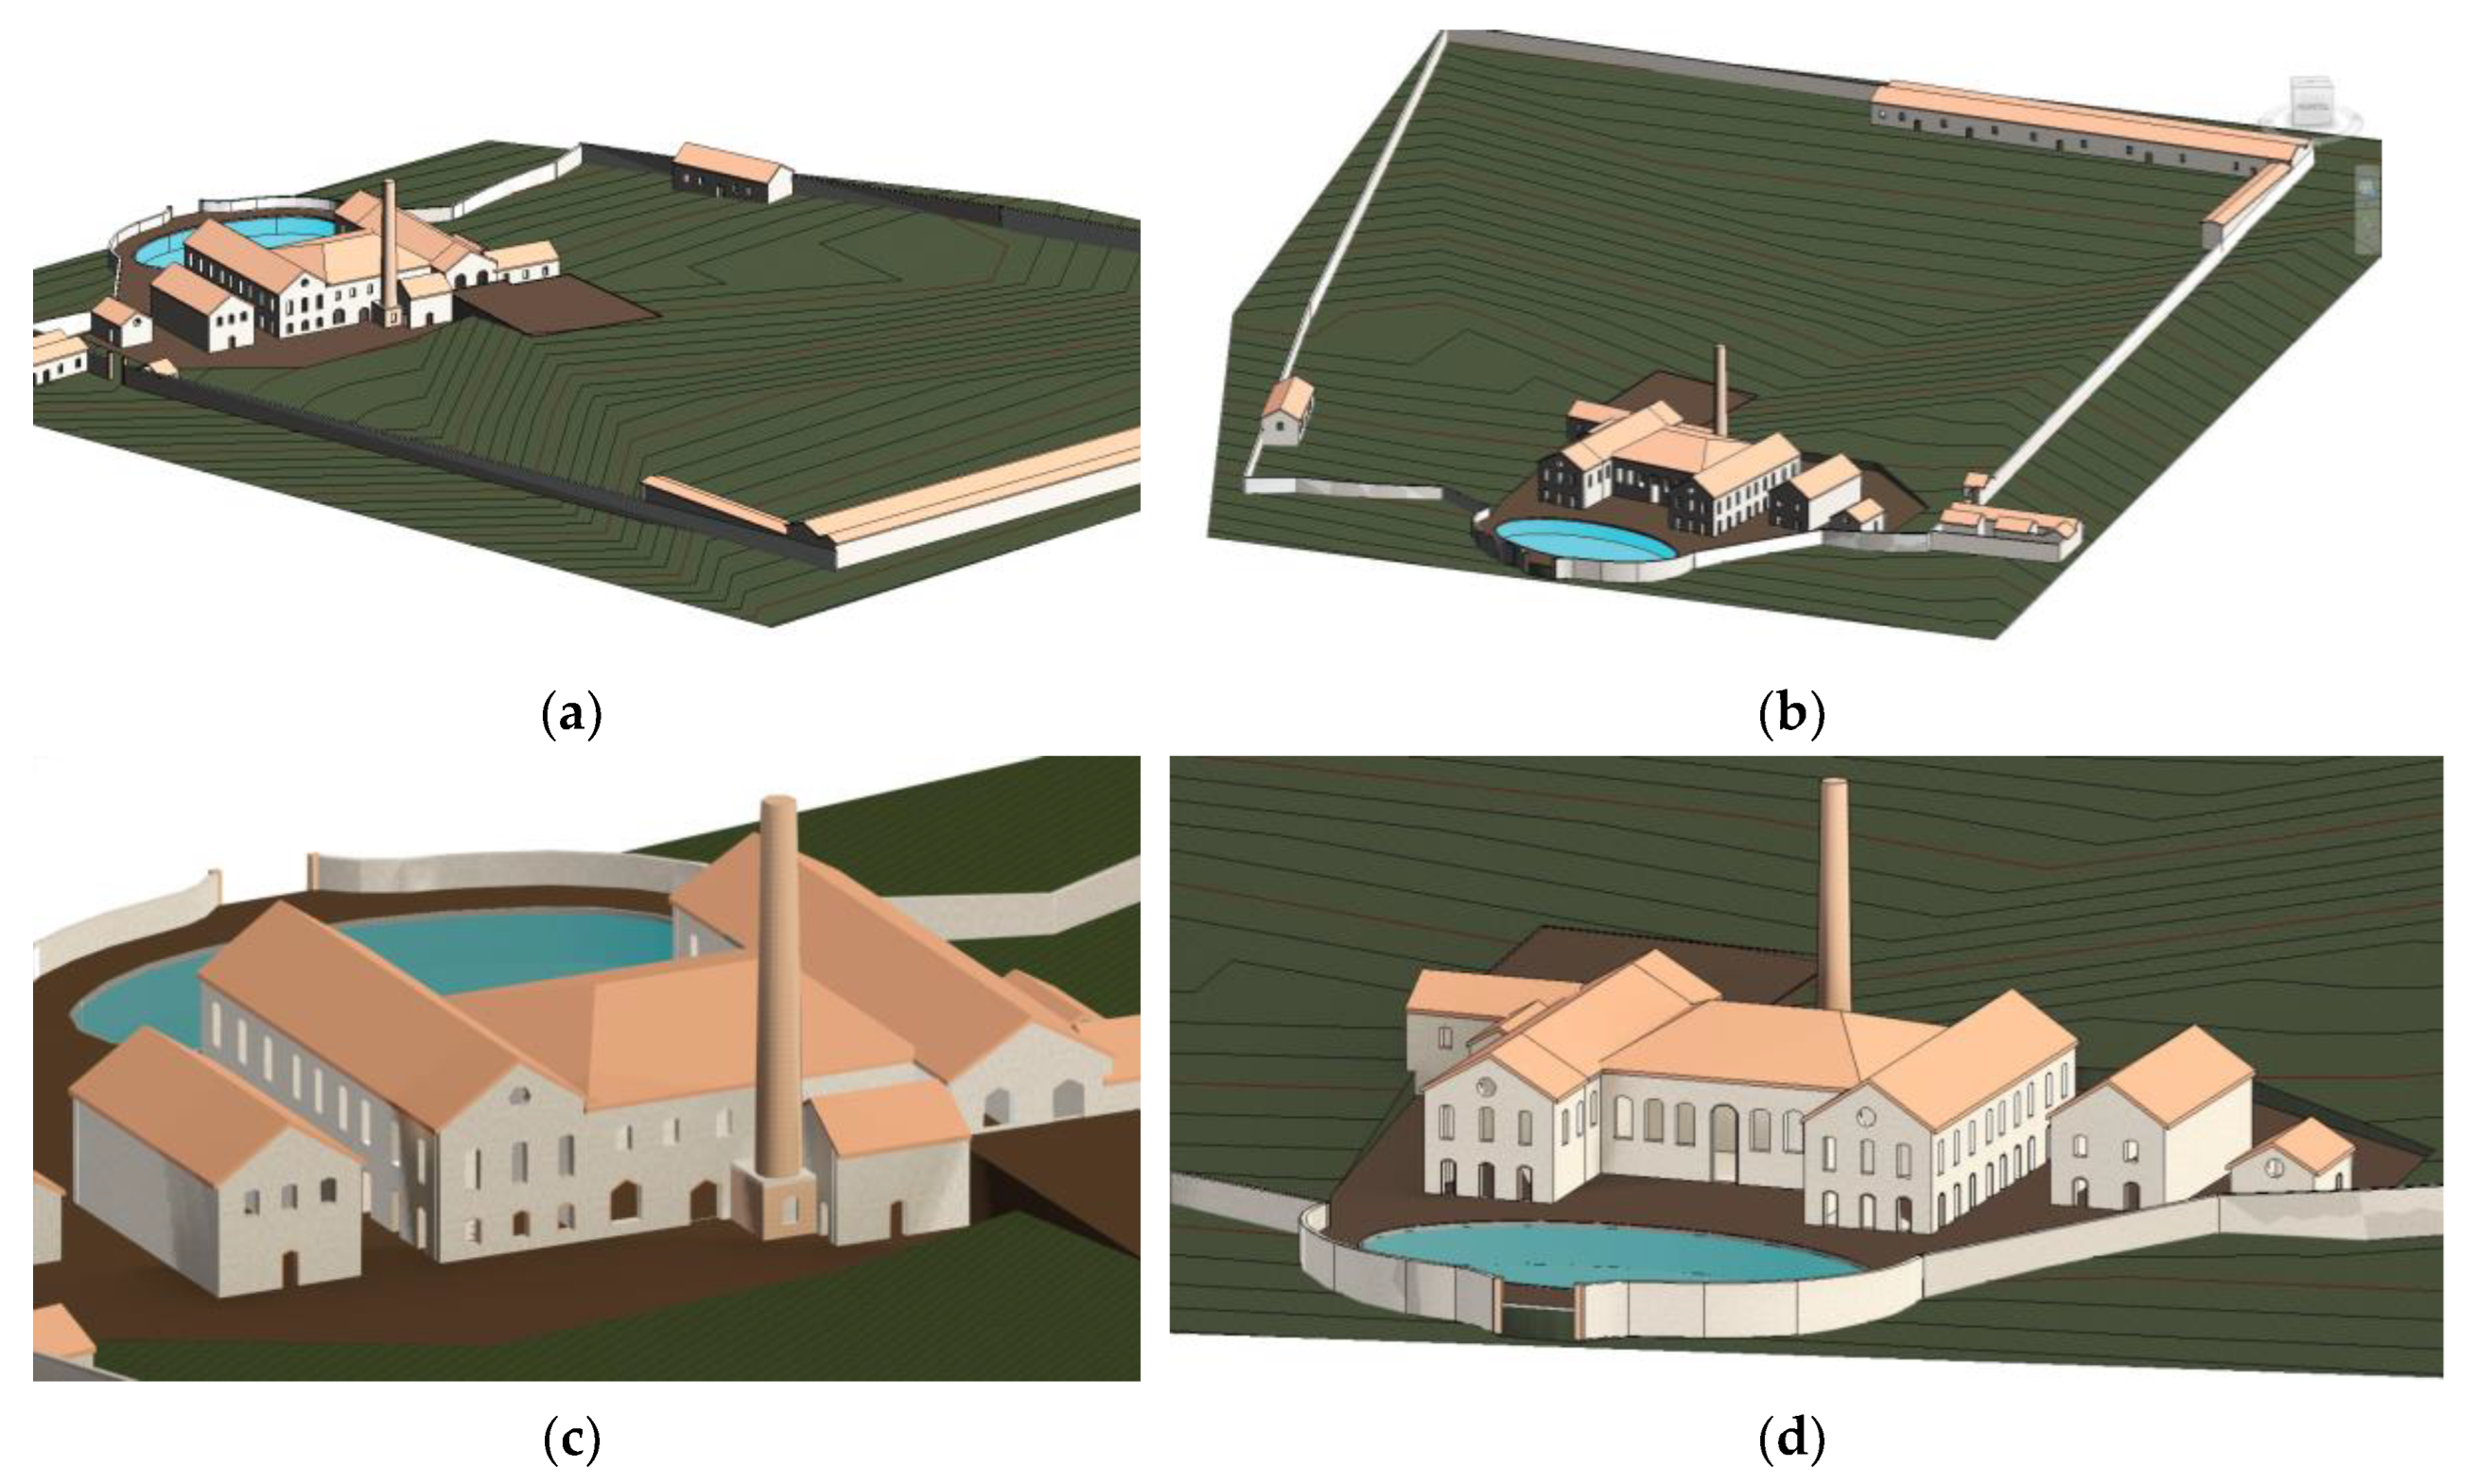

Table 1.
Main technical specifications of the UAV (model DJI Mavic Pro Platinum)
| Component | Parameter | Value |
|---|---|---|
| Aircraft | Weight with battery | 7.1 N |
| Maximum flight speed | 65 km/h | |
| Maximum flight range | 15 km | |
| Camera | Sensor | 1/2.3″ CMOS |
| Effective pixels | 12.35 MP | |
| Lens | FOV 78.8°, 26 mm, f/2.2 | |
| Battery | Capacity | 3830 mAh |
| Type | LiPo 3S | |
| Maximum flight time per battery | 25 min |
Table 2.
Technical information for each of the models
| Parameter | Model | ||||
|---|---|---|---|---|---|
| 12.5% | 25% | 50% | 100% | ||
| Number of input images | 87 | 174 | 348 | 696 | |
| Number of images accepted | 49 | 165 | 348 | 696 | |
| Computational time | 15 min | 58 min | 2 h 35 min | 3 h 50 min | |
| Covered area (km2) | 0.047 | 0.120 | 0.147 | 0.163 | |
| Average point-cloud density (points/m3) | 249.70 | 241.09 | 276.38 | 312.56 | |
Table 3.
Position and orientation uncertainty of the generated models.
| Uncertainty | 100% | 50% | 25% | 12.5% |
|---|---|---|---|---|
| Position (m) | 0.017 | 0.017 | 0.016 | 0.056 |
| Orientation (°) | 0.017 | 0.017 | 0.017 | 0.065 |
Table 4.
Comparison of tape measurements with the digital model measurement
| Dimension (m) | Tape measurement | 100% | 50% | 25% |
|---|---|---|---|---|
| Width of the side door in the outer wall (a) | 3.20 | 2.94 | 3.00 | 2.92 |
| Length of the chimney base (b) | 3.70 | 3.55 | 3.48 | 3.45 |
| Width of the chimney base (c) | 3.30 | 3.21 | 3.29 | 2.94 |
| Height of the chimney base (d) | 3.30 | 3.08 | 3.02 | 3.17 |
| Width of the door of the building to the left of the main building (e) | 1.04 | 0.99 | 0.96 | 0.96 |
| Height of the door of the building to the left of the main building (f) | 1.94 | 1.98 | 2.01 | 1.81 |
Disclaimer/Publisher’s Note: The statements, opinions and data contained in all publications are solely those of the individual author(s) and contributor(s) and not of MDPI and/or the editor(s). MDPI and/or the editor(s) disclaim responsibility for any injury to people or property resulting from any ideas, methods, instructions or products referred to in the content. |
© 2026 by the authors. Licensee MDPI, Basel, Switzerland. This article is an open access article distributed under the terms and conditions of the Creative Commons Attribution (CC BY) license (http://creativecommons.org/licenses/by/4.0/).
Copyright: This open access article is published under a Creative Commons CC BY 4.0 license, which permit the free download, distribution, and reuse, provided that the author and preprint are cited in any reuse.


