

Submitted:
27 April 2026
Posted:
29 April 2026
You are already at the latest version
Abstract
This study evaluates the impact of water washing on the suitability of biochars from tomato (TB) greens and vineyard (VB) prunings as peat replacement in gardening substrates. Therefore, a 31-day pot-experiment was performed to assess seed germination and growth of tomato plants on biochar/peat substrates (60:40 v/v) using fresh (TB 0 and VB 0) and washed biochar (TB 1, TB 2 and VB 1, VB 2). For both biochars, washing resulted in a notable decline of the pH = 10 to values around 9. The electrical conductivity (EC) of TB 0 was with 9147± 96 µS cm-1 higher than that of VB 0 (1539 ± 33 µS cm-1), indicating a high salt content of the first. Washing reduced those values to 272 ± 21 µS cm-1 and 75.4 ± 4 µS cm-1, respectively. Performance of tomato plants, grown on the substrate mixture increased with salt removal. Statistical analysis revealed a stronger impact of EC than of pH on plant performance. High salt concentrations affected in particular the germination most likely through osmotic stress. Biomass production was reduced by high Ca and K concentrations and showed no significant correlation with EC, Na or Cl contents. This work demonstrates that biochars with high pH and salt content previously considered unusable in plant substrates can be transformed into a suitable peat substitute by simply washing with water. This helps to reduce wasting the ecological important peat while promoting circular economy by recycling green waste-derived biochar as sustainable gardening substrate.
Keywords:
peat replacement
; nutrient excess in biochar
; green waste recycling
; plant health
; circular economy
1. Introduction
Biochar is a carbonaceous material obtained from biomass, typically derived from agricultural or biowaste, through heat treatment under pyrolysis conditions to prevent rapid oxidation and conversion to CO₂ [1]. Aside of its common application as soil amendment and improver, it has also been discussed as a peat substitute in horticulture thanks to its unique properties [1,2,3]. The physical and chemical properties of biochar depend on the feedstock and pyrolysis temperature. They generally exhibit common characteristics, such as high carbon (C) content and aromaticity which increasing pyrolysis temperature. The latter is expected to determine its chemical resistance to biodegradation, turning biochar amendment to soil into an important tool for C sequestration [4,5]. Studies indicated that the application of biochar in agriculture can increase soil productivity, soil microbial biomass and plant nitrogen uptake [6]. It enhances soil organic carbon (SOC) stocks and can reduce uptake of heavy metals from soils [1,5,7]. Because wood derived biochar is typically alkaline, its application as an amendment to soils with low pH, positively affects soil characteristics by raising the pH level. This is particularly useful for basifying polluted soil [8].
Biochar is also discussed as a potential peat substitute [9,10]. Promising results were published by García-Rodríguez et al. [6], showing that in semi hydroponic cultures of lettuce using substrate mixtures of vermiculite, peat and biochar with a biochar/peat ratio of 30:40 yields better plant growth and nitrogen use efficiency than the mixture with only vermiculite and peat. Comparable findings were also reported by Rathnayake et al. [11] and Massa et al. [12] indicating that sawdust and popular wood-derived biochar addition to planting substrate at concentrations of 25 to 50% and 20% (v/v), respectively, can increase plant performance.
However, other studies revealed less encouraging findings assuming that some biochars have some counterproductive characteristics, reducing plants growth [13,14]. One particularly problematic aspect of many biochars, especially when applied in horticulture, is their high pH which can result in the insolubility of many plant nutrients [13,15,16,17]. Commonly associated with the high alkalinity is a high electrical conductivity (EC), indicating elevated contents of salts which can cause osmotic stress for plants [16,18]. Often, such stress can be avoided by limiting the amount of biochar added to the peat substrate to concentrations that are only slightly increasing pH and EC [6]. Investigating the feasibility of peat replacement in planting substrates for tomato from biochars such as chitin, peat, rice husk and tomato greens, Nocentini et al. [9] confirmed the big impact of biochar composition and properties on plant performance. Whereas replacement of peat by 60% (v/v) with biochar from chitin considerably increased plant dry mass production relative to the pure peat substrate. However, the addition of biochar from tomato greens inhibited already seed germination. The first was explained by the high N content of biochar, providing this essential nutrient during early seedling development. Statistical analysis showed further that the negative impact of tomato green derived biochar cannot be explained by the potential presence of phytotoxic compounds or high pH values alone. It seems rather to be related to high concentration of salts in general and ions such as sodium (Na+) and potassium (K+) in particular. Whereas the first affects the osmotic pressure, the latter may be related to the phenomenon of ion antagonism where the presence of one element limits the adsorption of others [19].
Despite the growing interest in recycling green waste as sustainable approach in the frame of circular economy by its transformation into biochar and subsequent use in horticulture, the understanding of how biochar affects plant growth is still scarce [13,18,20]. Therefore, the goal of the present work was to fill this research gap by identifying the key players responsible for the negative impact of alkaline biochars on plant performance. Based on the first results published by Nocentini et al. [9] we hypothesize that the salt composition of biochars rather than solely their alkalinity affects germination and plant performance.
To test this hypothesis, we selected two biochars with comparable pH but different EC and different ion composition and tested their performance as peat substitution in planting substrate. The first biochar derived from tomato greens as a representative of biochars with high EC [9]. The second originated from vineyard pruning residues [6]. To reduce their alkalinity the biochars were washed with distilled water. We abstained from using organic or inorganic solvents for the removal of potentially phytotoxic compounds to avoid as much as possible potential alteration of the organic fraction [21,22]. However, decreasing alkalinity by removing the salts with water is not selective and reduces also the content of plant available nutrients. In addition, it liberates potential adsorption sites at the surface of the biochar that may compete with the plants for nutrients [23].
Thus, our study evaluates not only the effect of washing intensity on biochar properties, organic matter structure their elemental composition and ion content, but also their impact on the performance of plant development. For this purpose, a greenhouse pot experiment was conducted, and the germination rate and growth of tomato seeds and plants was assessed over a period of 31 days. The used substrates were based on these two biochars, mixed at proportion 60:40 (v/v) with peat-based commercially available planting substrate, without adding any nutrient solutions, following Nocentini et al. [9]. At the end of the experiment, plant weight, SPAD (Soil Plant Analysis Development) values, and leaf area were measured.
2. Materials and Methods
2.1. Biochar Production, Washing of the Biochars and Characterization of the Biochars and the Peat Substrate
The selected feedstocks to produce biochar were tomato (Solanum lycopersicum) greens and vineyard (Vitis vinifera) pruning residues. Prior to the production of the tomato greens biochar (TB 0), the feedstock was dried in an oven at 40ºC for a week and after that cut manually into pieces with a length of < 5 cm. This material was pyrolyzed at 400ºC for 3 hours using a closed custom made stainless steel reactor [9], which was filled up to 2/3 of its volume and flashed with N2 to remove air. Afterwards the reactor was given into a preheated muffler (Hobersal, Caldes de Montbui, Spain) for 3 h. Syngas, produced during the pyrolysis was able to leave the reactor through a stainless-steel tube reaching from the reactor to the outside of the muffler and connected to a gas-trap filled with oil. The vineyard pruning biochar (VB 0) was provided by the company “Caviro-Enomondo” (Faenza, Italy) and obtained after pyrolysis at a temperature of 500°C [6].The peat “Sphagnum peat substrate” was purchased from the company “Klasmann-Deilmann GmbH” (Geeste, Germany).
To remove the salt, 25 g biochars were added to 500 ml Elix Water (double distilled water), and shaken in rotary shaker for 1 hour. Subsequently, the water was removed by filtration using laboratory filter paper (Dorsan Filtration, International) and the biochar was dried at 40°C (TB 1 and VB 1). Half of the washed biochars were subjected to one additional wash (TB 2 and VB 2). This process was repeated until enough material was obtained for the experiments.
2.2. Characterization of the Peat and the Biochars
The pH (H2O) of the peat as well as of the untreated and washed biochars were determined in triplicates in a water suspension (1:10 w/v) with a Crison 40 pH-meter (Crison, Alella, Spain). Subsequently, the supernatant was separated by filtration (Whatman Nº2 Filter) to measure the EC in the filtered solution using a Crison EC-meter Basic 30+ and a Crison Basic 20 conductivity meter (Crison, Alella, Spain).
Total carbon (TC) and total nitrogen (TN) of all feedstocks were determined in triplicates via dry combustion using a Flash 2000 elemental micro-analyser (Thermo Scientific, Bremen, Germany). Mineral nutrients were quantified for the original materials from the extracts obtained after controlled acidic digestion with ultrapure nitric and hydrochloric acid of the samples in a DigiPREP Block Digestion Systems (SCP Science, Montreal, Canada) using inductively coupled plasma-optical emission spectroscopy (ICP-OES) (Varian Inc., Palo Alto, CA, USA) [6]. The chloride (Cl-) content was determined spectrophotometrically (OMEGA) [24].
Solid-state 13C NMR spectroscopy, applied for a more comprehensive analysis of the chemical composition of the organic matter of the peat substrate and the biochars was performed using a Bruker Avance III HD 400 MHz spectrometer. The dry and homogenized sample material was put into a zirconium rotor of 4 mm OD with KEL-F-caps. The spectra were acquired with the cross polarization (CP) technique and magic-angle spinning of the rotor at 14 kHz. A ramped 1H-pulse was applied during a contact time of 1 and a pulse delay of 300 ms was employed. The 13C chemical shifts were calibrated relative to tetramethylsilane (0 ppm) with glycine (COOH at 176.08 ppm). The spectra were quantified by integration subdividing them into the following different chemical shift regions as described in Knicker [25] alkyl C (0–45 ppm); N-alkyl/methoxyl C (45–60 ppm); O-alkyl C (60–90 ppm); aromatic C and phenol C (90–160 ppm); carboxyl/amide C and carbonyl C (160–245 ppm). The spinning speed of 14 kHz was not sufficient for complete removal of the chemical shift anisotropy, thus spinning side bands occurred at both sides of the parent material at a distance of the spinning speed (here between 225–300 ppm and 0–45 ppm). Their intensities were added to that of the parent signal between 160 and 90 ppm [25].
2.3. Greenhouse Experiment and Analysis
For the greenhouse pot experiment, the untreated and washed biochars were mixed with peat in a ratio of 60:40 (v/v) [9]. For each mixture the maximum water holding capacity (WHC) was determined in triplicates. Therefore, 6 g of sample were placed over a Dorsan 102 filter into a funnel and saturated with distilled water. After 2 h percolation, the weight of the wet sample was measured and the amount of water that can be held against gravity was calculated by weight difference.
For the potting experiment, 120 ml plastic containers, previously perforated on the bottom, were filled with 100 ml of the substrate mixtures. In each pot three tomato seeds (Solanum lycopersicum; Roma variety; brand: “HA - Huerto y Jardín”) were sawn. Subsequently, the pots were posted into the greenhouse and moistened to 65% of WHC. They were covered with plastic transparent film until most seeds had germinated monitoring the germination rate during all the experiment. The greenhouse conditions were a 24 ± 2ºC / 17 ± 2ºC (day/night) temperature and a 60 ± 10% relative humidity (EL-1-USB data logger, Lascar Electronics Inc., Erie, PA, USA). The photoperiod was 16 h/8 h with a flux density of photosynthetic photons (Mean PAR) 300–350 µmol m−2 s−1 (quantum sensor, LI-6400; Li-COR, Lincoln, NE, USA) and a light emission of 9000–10,000 lux (Digital Lux Meter, LX1010B; Carson Electronics, Valemount, Canada). After 12 days, only the strongest seedling was kept in each pot to avoid nutrients competition between shoots. Each treatment was realised in quadruplicate. To maintain the moisture of the pot, they were weighted every two days to determine water loss. The lost water was replaced accordingly. The growth of the plants was monitored by measuring the epicotyl length from the soil surface to the insertion point of the highest leaves. The location of the pots within the tray was rotated to provide comparable light and environmental conditions for all plants during the length of the experiment (31 days). Neither pesticides nor extra fertilizers were applied before or during these studies.
At the end of the experiment, thus 31 days after sowing (DAS), the relative chlorophyll content of the plants was obtained with a SPAD-502 Plus 8 (KONICA MINOLTA, Tokyo, Japan) [26]. Then, leaves were harvested per pot, laid on a white background and photographed to measure the total leaf area using the ImageJ program. Subsequently, the aboveground part of each shoot was cut, and its fresh and dry weights were obtained before and after drying at 40ºC for 24 hours. The roots were carefully separated manually from the growing substrate, washed with distilled water and dried at 40ºC for 24 hours, before being weighted.
The Cl- content of substrates, before and after the experiment, and biochars were determined from a aqueous extraction by using a colorimetric method, based on displacement of thiocyanate by Cl- ion, and was measured with the absorbance microplate reader “Omega SPECTROstar” (BMG LABTECH GmbH, Germany) [27].
2.3. Statistical Analysis
Statistical analysis was performed using the STATGRAPHICS Centurion XIX software (StatPoint Technologies, Warrenton, VA, USA). Both “one-way” and “two-way” analysis of variance (ANOVA) was applied to determine the significant differences between groups of samples. In addition, a Pearson correlation and a two principals component analysis (PCA) have been carried out to evaluate the effect that each variable has on the results. All comparisons of means were determinate using the Tukey’s honestly significant difference (HSD).
3. Results and Discussion
3.1. Impact of Washing on the Characteristics of the Biochars
The pH values of the washed materials (Table 1) decreased significantly after the first and second washing, indicating the removal of compounds responsible for the alkalinity of the biochars. The TB 0 had an initial pH of 9.7 ± 0.1, which reduced to 9.1 ± 0.0 after the first and to 8.5 ± 0.1 after the second wash. Comparably, the initial VB pH of 10.3 ± 0.0 decreased to 9.4 ± 0.1 and then to 8.9 ± 0.2 after the first and second washing, respectively, indicating a loss of soluble cations by the washing process. However, the optimal pH value for tomato growth between 6.0 and 6.8 was still not reached and limitation with respect to P, Fe and micro-nutrient availability for plant growth must be encountered. The lowering of the pH goes hand in hand with a considerable decrease of EC (Table 1) in particular for TB, suggesting an efficient removal of soluble salts and ionic components, which is in line with the findings of Dunlop et al. [28].
The EC values of substrates is commonly associated with their content of soluble salts and nutrients. Whereas low values are related to nutrient deficiencies, high salt concentrations can cause salt stress. Main players are Na and Cl ions in the soil solution, and its adverse effect on plants include primary stresses like osmotic stress and ion imbalance, as well as secondary stresses like oxidative stress and metabolic abnormalities [29]. Tomatoes are moderately salt sensitive with optimal ECs below 2.25 mS cm-1. According to the values in Table 1, this threshold is reached already for the untreated VB but for TB only after the first washing. Tolerable extractable Cl- concentrations are reported to be in the range of 0.1 to 0.2 mg g-1 [30]. For TB 0 the Cl- content of 17.7 ± 0.9 mg g-1 was approximately 10 times higher than this value and only after two washings, a considerable lowering to 0.5 mg g-1 was reached (Table 1). With 0.4 mg g-1, VB 0 only slightly exceeded the value for optimal tomato growth. However, two times washing resulted in an approximation to this optimum.
A comparable pattern was observed with respect to the concentration of extractable Na+ (Table 2). Whereas TB 0 shows extremely high concentration of 7.4 mg g-1 this value was reduced to 1.3 mg g-1 after two washings. The moderate content of 0.7 mg g-1 for VB 0 remained almost unaffected by the treatment.
Concomitantly with the loss of salts, a slight but not significant increase of the total carbon (TC) and total nitrogen (TN) occurred, suggesting that loss of organic material caused by the washing may be negligible. Comparable observations are reported in the literature [31,32]. In our study the TC of TB 0 and VB 0 increased from 422.3 ± 10.9 mg g-1 and 408.9 ± 7.4 mg g⁻¹ to 472.9 ± 31.4 mg g-1 and 483.1 ± 54.7 mg g-1, respectively, after two washings. Whereas VB 0 showed the typical high C/N ratio expected for wood-derived biochar [9,33,34,35], TB 0 had a considerably lower ratio of 21 which is typical for biochar produced from green waste containing organic N compounds. A part of the latter was reported to be transformed into pyrrole-like structures during the heating process [36].
The concentrations of As, Cd, Cr, Cu, Ni, Hg and Pb in all biochars were not significantly affected by the washing and are below or close to the minimum threshold of potentially toxic elements (PTEmin) for composts from organic waste in Europe (ENV.A.2./ETU/2001/0024, Annex 2). Zn concentrations were between 0.15 and 0.28 mg g-1 and thus still below PTEmax for this element (1.50 mg g-1) (Table 2).
The contents of the nutrients K and S decreased after washing for all treatments, although it was more pronounced for TB (Table 2). The leaching of these elements during washing is best explained by their high solubility in water [35,37,38],.
Contents of Ca, Mg and Na were considerably higher in TB 0 than in VB 0 and largely removed by the treatment. For VB no clear tendency was detected for these elements although Ca, Mg and Mn levels showed a small increase after washing, most likely caused by a relative enrichment due to the loss of other elements (Table 2)[31,37].
3.2. Characterization by Solid-State 13C NMR Spectroscopy
The solid-state 13C NMR spectra of the fresh biochars shown in Figure 1 confirm the high aromaticity typically observed for such samples (Table 3)[25]. The respective chemical shift regions of phenol C (160 to 140 ppm) and aryl C (140 -90 ppm) comprise together 58% for TB 0 and 79% for VB of the total 13C intensity. The aryl C to O-aryl C ratio of VB 0 is with 6.3 wider than for TB 0 with 5.0 indicating that the aromatic network of VB 0 has less O-substitution than TB 0. This can be explained by the higher production temperature of VB leading to transformation of benzofuran structures into arenes units [39,40]. However, here it must be mentioned that in biochar organic N occurs mostly as pyrrole [41] and it adjusts C resonates into the chemical shift region between 160 and 140 ppm. Accordingly, such compounds are likely to contribute to the intensity of this region in the spectrum of TB 0.
Lower production temperature and the higher N content of TB 0 compared to VB 0 can also explain the difference in the intensity of the O-alkyl and alkyl C region of their spectra, since increasing pyrolysis temperature is commonly associated with loss and transformation of alkyl C (Table 3). Both in the spectrum of TB 0 and VB 0 a small and narrow signal at 164 ppm was identified and can be assigned to carbonate C.
Following the washing process, the spectrum of TB 2 did not indicate any major alterations of the chemical composition. VB 2 on the other hand, revealed a slight increase of the aryl C/O-aryl C ratio and decrease of the relative contribution of alkyl C (Table 3). This may be due to small loss of water-soluble phenols and alkyl moieties.
3.3. Impact of biochar washing on the Peat-biochar substrate characteristics
As expected, mixing the biochars with the peat at a ratio of 60 to 40 (v/v) decreased the pH (Table 4). However, with plant growth the pH of all mixes enhanced until the end of the experiment. The higher pH values obtained from the same mixes after 31 DAS may be caused by the relative accumulation of inorganic alkaline biochar compounds caused by the preferential degradation of peat-derived organic matter. The accumulation of cations and alkali compounds could affect the rhizosphere [32]. Another explanation is the effect of biochar on microorganisms, stimulating the alkalising process in the nitrogen cycle, such as denitrification. This process, particularly the reduction of N₂O to N₂, consumes protons (H⁺), which could potentially increase the pH of the substrate after 31 days [7,42].
The EC (μS cm⁻¹) decreased slightly in almost all mixes after 31 DAS. Regarding the mixes with different biochars, significant differences were observed between the different biochars and between mixes that used washed and unwashed biochars. As expected, mixes containing unwashed biochar had higher EC values (TB 0: 4517 ± 398 μS cm⁻¹; VB 0: 751 ± 105 μS cm⁻¹) than mixes containing biochar washed once (TB 1: 1355 ± 32 μS cm⁻¹; VB 1: 433 ± 0 μS cm⁻¹), and mixes using biochar washed twice have the lowest EC values (TB 2: 619 ± 7 μS cm⁻¹; VB 2: 261 ± 13 μS cm⁻¹). These effects on the EC are produced by the loss of soluble ions during water treatment, and can be seen in Table 1 and Table 2 [28].
The WHC (%) was not significantly affected by the washing of TB 0 and VB showed only minor alterations, indicating that the pore structure was if et all only slightly affected by the removal of salts through the washing.
The Cl- content (mg g⁻¹) of the mixes reflects the efficient removal of this ion with washing since it decreases considerably from TB 0 to TB 2 and slightly from VB 0 to VB 2 and thus also in the respective mixes (Table 1). Plant growth had no major impact on its content in the substrate except for TB 0. The Cl- content (mg g⁻¹) of the mixes (Table 4) reflects the efficient removal of this ion with washing since it decreases considerably from TB 0 to TB 2 and slightly from VB 0 to VB 2 and thus also in the respective mixes (Table 1). Plant growth had no major impact on its content in the substrate except for TB 0. These results are linked to the Na⁺ content results (Table 2) as weight per weight of dry sample of the used substrates 60:40 Biochar: Peat with fresh and washed biochars.
3.4. Germination and Growth of Tomato Plants on Peat Substrate Mixed with Washed and Unwashed Biochar
Without water rinsing, only 33.3 ± 27.2% (4 of 10) of the seeds planted on the TB 0/peat substrate germinated after 28 DAS. This is in line with the observations by Nocentini et al. [9]. Two times washing considerably increased the rate to 75.0 ± 16.7%, which was already reached after 18 DAS (Figure 2, Table 5). VB 0 amendment achieved 100% germination but only after 28 DAS. Respectively, with rinsing VB two times, the delay until maximal germination shortened to 12 days. Bearing in mind that no major differences of the pH values were observed among the starting substrates (Table 4), the improved germination may be explained with the removal of salts, which were toxic at levels occurring in TB but were still tolerated at levels present in VB [43]. Salt stress reduces a seed's ability to absorb water (osmotic stress) and causes an ion imbalance within the seed (ionic stress), ultimately inhibiting germination and preventing crop production [13,32,44]. Such compounds could be cations, such as K, Na and Ca. In addition, these toxic compounds that inhibited germination in TB 0 were apparently reduced by washing the biochar [13]. Other phytotoxic compounds such as PAHs may naturally be present in biochars from certain feedstocks (such as vines [43]), usually hindering germination [45,46]. However, in our study, VB achieves 100% of total germination even without washing, which indicates that it contained problematic compounds to a lower extent than TB 0.
One time washing already increased plant performance with respect to TB 0 (Figure 3). A plant height of 37.3 ± 7.3 mm was obtained for TB 2 which is in the range observed for the VB experiment with unwashed and washed biochar (Figure 4, Table 5). Thus, it can be concluded that only at that stage, compounds causing plant stress were reduced sufficiently to allow comparable plant development to the VB treatment even after delayed germination.
Although plant weights were increased by biochar washing, the total water consumption of the plants growing on TB containing substrate remained unaffected (Table 5). It varied between 64.0 ± 1.9 g for TB 1; and 78.5 ± 6.0 g for TB 2. For the VB treatments, on the other hand a slight but not significant increase from 84.8 ± 9.9 g for VB 0; to 96.9 ± 10.7 g for VB 2 was revealed. These results suggest that irrigation replaced mainly water lost from the substrate by evaporation rather than through up-take by the plants. It may be further concluded that the salt content of the substrate had no major impact on its water retention capacity. Although it has been reported that washing can increase the specific surface area and total pore volume of biochar by removing soluble components that could block the pores [47]. However, there were significant differences between the two types of biochar, with greater water consumption for VB treatments than for TB treatments either due to different water loss due to evaporation or what is more likely caused by the better plant growth on VB [1].
The shoot fresh and dry weight of the plants showed the same trend with biochar treatment as the plant height. However, whereas the water content of the plants increased after washing for TB, it decreased for VB. At the same time the leaf area increased for the plants on both biochar substrates with washing. This allows the assumption that washing of the biochar enhanced succulence for plants on TB but decreased it for those on VB. On the other hand, dry mass weight of shoots an increased for both biochars with washing which is in line with results reported by Intani et al. [13] and Rogovska et al. [46] showing that biochar washing significantly improved the early growth of various plants.
The dry root weight improved significantly after two washings for both types of biochar (TB 2: 22 ± 13 mg, VB 2: 28 ± 4 mg). These results are in line with other studies assigning a significant increase in root development after biochar washing [48] to removing of phytotoxic compounds, excess salts, organic compounds, and other substances that are harmful to plant development [13,44,48]. Except for the mix with TB 0, the dry root/shoot ratio ranges between 0.2 and 0.4 which is slightly higher than reported by Naciri et al. [49] for tomato plants in hydroponic cultures of tomato plants (0.1 and 0.2). Environmental stress can lead to significantly higher ratios, as it can be observed for the plants cultivated on TB 0 [50].
SPAD values, are used as indicators of chlorophyll contents and therefore provide an additional index for plant health [6,26]. Whereas for TB 0 no values could be obtained due to low leaf production, TB 2 (39.2 ± 2.0) provided the best value. For the VB treatments no significant impact of biochar washing on the SPAD was revealed [13,44].
3.5. Pearson Correlation: Revealing the Relations Between Micronutrients and Other Parameters
Summarizing the results of the plant physiological parameters, the VB and TB treatments had a considerable different impact on plant health which cannot be explained with high alkalinity only. In order to obtain a better understanding, which parameter is responsible for the low performance of TB 0, a Pearson correlation was applied.
The Pearson product-moment correlation coefficient measures the strength and direction of a linear relationship between two continuous variables. It indicates how well the relationship between the two variables can be described by a straight line. This coefficient produces a value between -1 and +1 that denotes the strength and direction of the correlation. A positive number implies that if one variable increases, the other tends to increase; thus, a negative number implies the opposite, i.e. that if one variable increases, the other tends to decrease [51].
Figure 5 shows various strong positive and negative correlations. One example is the positive correlation between EC and the contents of Na, Cl, Ca and K, confirming that EC is strongly associated with the concentration of ions in the sample. However, among the ions, only Ca seems to have a major impact on the pH value. Correlating the pH with plant performance parameters indicates a low impact, possibly because even after two washings, the pH of the substrate was already above the optimal values for tomato plants [28]. In contrast to the changes of the pH values by washing, the alteration of EC together with the contents of Na, Cl, Ca, K and S had a clear negative impact on the germination process, which is best explained with osmotic stress. However, after germination total biomass production was only affected by Ca, K and S concentrations, most likely due to nutrient antagonism. Excessive Ca and K promotes nutrient antagonism and inhibits root development or chlorophyll synthesis [52,53]. The impact of K on the chlorophyll production may be confirmed by the strong positive correlation between K content and SPAD. The P contents of the tested mixtures showed no impact on plant health parameters.
3.6. Principal Component Analyses: Revealing the Influence of Biochar Washing on Their Parameters
Principal Component Analysis (PCA) was performed to identify the biochar parameters that most strongly influenced tomato plant performance. The biplot (Figure 6) shows that PC1 explains 68.37% and PC2 11.91% of the total variance, together accounting for approximately 80% of the variability, indicating a robust representation of the dataset.
PC1 clearly separates the treatments along a gradient from stress-related conditions to plant growth performance. On the negative side of PC1, TB 0 is associated with high EC and Cl⁻, indicating saline stress. In contrast, all VB treatments as well as TB 2 are located on the positive side of PC1 and correlate with growth-related traits such as shoot FW, DW, LA, root DW (RW), total germination (TG), plant height (PH), and SPAD values.
The shift from TB 0 to TB 1 and TB 2 along PC1 reflects the effect of washing, which reduced EC and Cl⁻ and thereby alleviated plant stress. Notably, TB 2 clusters with the VB treatments on the positive side of PC1, indicating improved growth conditions. All VB treatments are positioned near the vertical axis, suggesting that salinity plays a minor role in these treatments.
PC2 explains a smaller proportion of the variance and is primarily associated with substrate pH. Higher pH values are directed towards the upper right quadrant, whereas plant growth parameters (FW, DW, LA, RW) are oriented towards the lower region. VB 0 is located in the upper right region, suggesting an association with higher pH, while VB 2 is more closely aligned with biomass-related traits, indicating the strongest positive effect on plant growth.
Overall, the PCA indicates that salinity-related parameters (EC and Cl⁻) have a stronger influence on plant performance than substrate pH. In order to extract which ions may be responsible a second PCA plot relating plant growth parameters to ion concentrations was performed.
Figure 7 shows a PCA, performed to identify the ions biochar micronutrients parameters that most strongly influenced in the germination and biomass production weight of the tomato plants. The respective biplot (Figure 7) shows that PC1 explains 79.2% and PC2 13.9% of the total variance, together accounting for approximately 93% of the variability, indicating a robust representation of the dataset.
As already observed in Figure 6, the PC1 clearly separates the treatments and the parameters, along a plant stress gradient from stress-related conditions to plant germination and growth performance. On the negative side of PC1, VB 0, VB 1 and VB 2 are associated with high growth-related traits, like germination (G). G at 12 and 31 DAS, root weight (RW) and dry weight (DW), whereas the indicating that the vineyard biochar is, in general, more favourable than tomato biochar for the plant development. In contrast, on the positive side of PC1 can be connected to plant stress connected to high contents of are located all of parameters related with the substrate ions content (Na, Cl, Ca, K, and S. However, as already indicated with the Pearson Correlation (Figure 5), P contents have minor impact on the variability than P, S), as well as TB 0 and TB 1, indicating a high ions content on these substrates. On the other hand, TB 2 are located on the negative PC1 side, but disconnected or detached from the VB treatments. That may indicate that, although TB 2 has a good performance on the plant development, it has a significant difference in its characteristics to the VB treatments.
The location of shift from VB 0 to VB 1 and VB 2 shows a decreasing shift along PC1 and an increasing one along in PC2, following the parameters related with the germination and growth of the tomato plants. This is in line with, indicating the improved growth conditions after washing with the washings of this biochar. However, their location is largely disconnected to that. On the other hand, the TB 0 and the treatments show a more notable spacing along the PC1, from the TB 0, the most positive treatment, to TB 2, the more negative. That shown the substantial changes in the ion’s composition of the treatments with the washings.
The opposite direction of the vectors for Cl, Na, K and S. This may be indicated that for the variability of the VB treatments the ion concentrations were of subordinate importance whereas for the variability of TB, they were the main responsible ions parameters, and the growth parameter indicate that a big ions content implies a small growth and germination of tomato plants. Also, TB 0, that is in the same quadrant than the ions parameters, show the highest content of them. On the other hand, P is in another quadrant, implying that does not have as harmful effects as the other ions to the growth and germination.
4. Conclusions
The results of this study demonstrate that washing with water represents an effective method for improving the performance of biochars as plant-growing substrates, particularly for those that are initially characterised by high salinity and alkalinity. Our findings demonstrate that successive washing treatments reduces the pH and substantially diminishes the EC of the biochars through the removal of soluble salts and alkaline compounds. The removal of those components from the tested biochars created a plant substrate additive that allowed tomato seed germination and subsequent plant growth even at high application rates of 60% (v/v). Thus, our study emphasises that biochars with high salt content and pH, previously considered "virtually unusable" as peat replacement in gardening soils – in particular in high concentration – due to their detrimental properties, can be transformed by a simple treatment into a valuable additive in horticultural substrates. Our studies support further that biochars should not be seen as a homogenous compound class with common impacts on plant health and soil properties but represent products with properties determined by the feedstock. As shown in the present investigation, the nature of feedstock affects not only the characteristics of the organic aromatic network or the porosity but also the composition of the inorganic fraction [15,54]. Since some of the latter are water soluble, they can serve as plant nutrients but also as nutrient antagonists with the respective negative impacts on plant health. According to our results, this is in particular true for Ca and K suggesting that their contents in a biochar needs specific attention to avoid negative impacts on plant production.
Author Contributions
Conceptualization: JM.G.B, A.G.R., ME.F.B and H.K.; Methodology: JM.G.B, A.G.R. and H.K.; Software: JM.G.B.; Validation: JM.G.B. and H.K.; Formal analysis: JM.G.B; Investigation: JM.G.B; Resources: H.K; Data curation: JM.G.B; Writing: JM.G.B and H.K; Original draft preparation: JM.G.B; Writing-review and editing: JM.G.B., A.G.R., ME.F.B. and H.K; Visualization: JM.G.B; Supervision: ME.F.B. and H.K; Project administration: H.K; Funding acquisition: H.K. All authors have read and agreed to the published version of the manuscript.
Funding
This research was funded by EIT Food program (Black to the Future Project, EIT-21217) receiving funding from the European Institute of Innovation and Technology (EIT), a body of the European Union, under Horizon Europe, the EU Framework Programme for Research and Innovation.
Data Availability Statement
The original contributions presented in this study are included in the article/supplementary material. Further inquiries can be directed to the corresponding author(s).
Acknowledgments
The Gruppo Caviro is acknowledged for the supplying and shipping of the biochar. M. Velasco Molina, María Sanchez Carrasco and Francisco J. Moreno-Racero are thanked for their technical help in the laboratory. The analytical service of the IRNAS-CSIC is thanked for their support.
Conflicts of Interest
The authors declare no conflicts of interest.
References
- Schmidt, H.P.; Kammann, C.; Hagemann, N.; Leifeld, J.; Bucheli, T.D.; Sánchez Monedero, M.A.; Cayuela, M.L. Biochar in Agriculture – A Systematic Review of 26 Global Meta-Analyses. GCB Bioenergy 2021, 13, 1708–1730. [Google Scholar] [CrossRef]
- de la Rosa, J.M.; Paneque, M.; Miller, A.Z.; Knicker, H. Relating Physical and Chemical Properties of Four Different Biochars and Their Application Rate to Biomass Production of Lolium Perenne on a Calcic Cambisol during a Pot Experiment of 79 Days. Sci. Total Environ. 2014, 499, 175–184. [Google Scholar] [CrossRef] [PubMed]
- He, Y.; Yao, Y.; Ji, Y.; Deng, J.; Zhou, G.; Liu, R.; Shao, J.; Zhou, L.; Li, N.; Zhou, X.; et al. Biochar Amendment Boosts Photosynthesis and Biomass in C3 but Not C4 Plants: A Global Synthesis. GCB Bioenergy 2020, 12, 605–617. [Google Scholar] [CrossRef]
- Pituello, C.; Francioso, O.; Simonetti, G.; Pisi, A.; Torreggiani, A.; Berti, A.; Morari, F. Characterization of Chemical–Physical, Structural and Morphological Properties of Biochars from Biowastes Produced at Different Temperatures. J. Soils Sediments 2015, 15, 792–804. [Google Scholar] [CrossRef]
- Das, S.K.; Ghosh, G.K.; Avasthe, R. Application of Biochar in Agriculture and Environment, and Its Safety Issues. In Biomass Convers. Biorefinery; 2020. [Google Scholar] [CrossRef]
- García-Rodríguez, Á.F.; Moreno-Racero, F.J.; García de Castro Barragán, J.M.; Colmenero-Flores, J.M.; Greggio, N.; Knicker, H.; Rosales, M.A. Influence of Biochar Mixed into Peat Substrate on Lettuce Growth and Nutrient Supply. Horticulturae 2022, 8. [Google Scholar] [CrossRef]
- Joseph, S.; Cowie, A.L.; Van Zwieten, L.; Bolan, N.; Budai, A.; Buss, W.; Cayuela, M.L.; Graber, E.R.; Ippolito, J.A.; Kuzyakov, Y.; et al. How Biochar Works, and When It Doesn’t: A Review of Mechanisms Controlling Soil and Plant Responses to Biochar. GCB Bioenergy 2021, 13, 1731–1764. [Google Scholar] [CrossRef]
- De la Rosa, J.M.; Santa-olalla, A.; Campos, P.; López-núñez, R.; González-pérez, J.A.; Almendros, G.; Knicker, H.E.; Sánchez-martín, Á.; Fernández-boy, E. Impact of Biochar Amendment on Soil Properties and Organic Matter Composition in Trace Element-Contaminated Soil. Int. J. Environ. Res. Public Health 2022, 19. [Google Scholar] [CrossRef]
- Nocentini, M.; Panettieri, M.; García de Castro Barragán, J.M.; Mastrolonardo, G.; Knicker, H. Recycling Pyrolyzed Organic Waste from Plant Nurseries, Rice Production and Shrimp Industry as Peat Substitute in Potting Substrates. J. Environ. Manag. 2021, 277. [Google Scholar] [CrossRef]
- Kern, J.; Tammeorg, P.; Shanskiy, M.; Sakrabani, R.; Knicker, H.; Kammann, C.; Tuhkanen, E.M.; Smidt, G.; Prasad, M.; Tiilikkala, K.; et al. Synergistic Use of Peat and Charred Material in Growing Media–an Option to Reduce the Pressure on Peatlands? J. Environ. Eng. Landsc. Manag. 2017, 25, 160–174. [Google Scholar] [CrossRef]
- Rathnayake, D.; Creber, H.; Van Poucke, R.; Sohi, S.; Meers, E.; Mašek, O.; Ronsse, F. Biochar from Sawmill Residues: Characterization and Evaluation for Its Potential Use in the Horticultural Growing Media. Biochar 2021, 3, 201–212. [Google Scholar] [CrossRef]
- Massa, D.; Bonetti, A.; Cacini, S.; Faraloni, C.; Prisa, D.; Tuccio, L.; Petruccelli, R. Soilless Tomato Grown under Nutritional Stress Increases Green Biomass but Not Yield or Quality in Presence of Biochar as Growing Medium. Hortic. Environ. Biotechnol. 2019, 60, 871–881. [Google Scholar] [CrossRef]
- Intani, K.; Latif, S.; Islam, M.S.; Müller, J. Phytotoxicity of Corncob Biochar before and after Heat Treatment and Washing. Sustain. 2019, 11. [Google Scholar] [CrossRef]
- Mustafa, A.; Holatko, J.; Hammerschmiedt, T.; Kucerik, J.; Skarpa, P.; Kintl, A.; Racek, J.; Baltazar, T.; Malicek, O.; Brtnicky, M. Comparison of the Responses of Soil Enzymes, Microbial Respiration and Plant Growth Characteristics under the Application of Agricultural and Food Waste-Derived Biochars. Agronomy 2022, 12. [Google Scholar] [CrossRef]
- Campos, P.; Miller, A.Z.; Knicker, H.; Costa-Pereira, M.F.; Merino, A.; De la Rosa, J.M. Chemical, Physical and Morphological Properties of Biochars Produced from Agricultural Residues: Implications for Their Use as Soil Amendment. Waste Manag. 2020, 105, 256–267. [Google Scholar] [CrossRef] [PubMed]
- Hailegnaw, N.S.; Mercl, F.; Pračke, K.; Száková, J.; Tlustoš, P. Mutual Relationships of Biochar and Soil PH, CEC, and Exchangeable Base Cations in a Model Laboratory Experiment. J. Soils Sediments 2019, 19, 2405–2416. [Google Scholar] [CrossRef]
- Prasad, M.; Chrysargyris, A.; McDaniel, N.; Kavanagh, A.; Gruda, N.S.; Tzortzakis, N. Plant Nutrient Availability and PH of Biochars and Their Fractions, with the Possible Use as a Component in a Growing Media. Agronomy 2020, 10, 1–17. [Google Scholar] [CrossRef]
- Dunlop, S.J.; Arbestain, M.C.; Bishop, P.A.; Wargent, J.J. Closing the Loop: Use of Biochar Produced from Tomato Crop Green Waste as a Substrate for Soilless, Hydroponic Tomato Production. HortScience 2015, 50, 1572–1581. [Google Scholar] [CrossRef]
- Buss, W.; Graham, M.C.; Shepherd, J.G.; Mašek, O. Risks and Benefits of Marginal Biomass-Derived Biochars for Plant Growth. Sci. Total Environ. 2016, 569–570, 496–506. [Google Scholar] [CrossRef]
- Steiner, C.; Harttung, T. Biochar as a Growing Media Additive and Peat Substitute. Solid Earth 2014, 5, 995–999. [Google Scholar] [CrossRef]
- Liu, S.; He, Z.; Dong, Q.; Zhao, A.; Huang, F.; Bi, D. Comparative Assessment of Water and Organic Acid Washing Pretreatment for Nitrogen-Rich Pyrolysis: Characteristics and Distribution of Bio-Oil and Biochar. Biomass Bioenergy 2022, 161, 106480. [Google Scholar] [CrossRef]
- Liu, Z.; Hoekman, S.K.; Balasubramanian, R.; Zhang, F.S. Improvement of Fuel Qualities of Solid Fuel Biochars by Washing Treatment. Fuel Process. Technol. 2015, 134, 130–135. [Google Scholar] [CrossRef]
- Thomas Klasson, K.; Uchimiya, M.; Lima, I.M. Uncovering Surface Area and Micropores in Almond Shell Biochars by Rainwater Wash. Chemosphere 2014, 111, 129–134. [Google Scholar] [CrossRef]
- Peinado-Torrubia, P.; Franco-Navarro, J.D.; Lucas, M.; Romero-Jiménez, D.; Moreno-Racero, F.J.; Díaz-Rueda, P.; Rosales, M.A.; Lindahl, M.; Díaz-Espejo, A.; Álvarez, R.; et al. Plants Maximise Chloride Uptake during Early Vegetative Development to Stimulate Cell Expansion, Maturation of the Photosynthetic Apparatus, and Growth. Plant J. 2025, 123, 1–18. [Google Scholar] [CrossRef]
- Knicker, H. Solid State CPMAS 13C and 15N NMR Spectroscopy in Organic Geochemistry and How Spin Dynamics Can Either Aggravate or Improve Spectra Interpretation. Org. Geochem. 2011, 42, 867–890. [Google Scholar] [CrossRef]
- Chrysargyris, A.; Prasad, M.; Kavanagh, A.; Tzortzakis, N. Biochar Type and Ratio as a Peat Additive/Partial Peat Replacement in Growing Media for Cabbage Seedling Production. Agronomy 2019, 9. [Google Scholar] [CrossRef]
- Rosales, M.A.; Franco-Navarro, J.D.; Peinado-Torrubia, P.; Díaz-Rueda, P.; Álvarez, R.; Colmenero-Flores, J.M. Chloride Improves Nitrate Utilization and NUE in Plants. Front. Plant Sci. 2020, 11, 1–13. [Google Scholar] [CrossRef]
- Dunlop, S.J.; Arbestain, M.C.; Bishop, P.A.; Wargent, J.J. Closing the Loop: Use of Biochar Produced from Tomato Crop Green Waste as a Substrate for Soilless, Hydroponic Tomato Production. HortScience 2015, 50, 1572–1581. [Google Scholar] [CrossRef]
- Yang, Y.; Guo, Y. Elucidating the Molecular Mechanisms Mediating Plant Salt-Stress Responses. New Phytol. 2018, 217, 523–539. [Google Scholar] [CrossRef] [PubMed]
- Deanda-Tovar, A.A.; Rodríguez-Pérez, J.E.; Sahagún-Castellanos, J.; Colinas-y-León, M.T.B.; Pérez-Rodríguez, P.; Paredes-Cervantes, A.E. Tomato Lines Tolerant to Sodium Chloride at Early Growth Stages. Horticulturae 2025, 11. [Google Scholar] [CrossRef]
- Boakye, P.; Tran, H.N.; Lee, D.S.; Woo, S.H. Effect of Water Washing Pretreatment on Property and Adsorption Capacity of Macroalgae-Derived Biochar. J. Environ. Manag. 2019, 233, 165–174. [Google Scholar] [CrossRef] [PubMed]
- Yu, H.; Zou, W.; Chen, J.; Chen, H.; Yu, Z.; Huang, J.; Tang, H.; Wei, X.; Gao, B. Biochar Amendment Improves Crop Production in Problem Soils: A Review. J. Environ. Manag. 2019, 232, 8–21. [Google Scholar] [CrossRef] [PubMed]
- García-Jaramillo, M.; Trippe, K.M.; Helmus, R.; Knicker, H.E.; Cox, L.; Hermosín, M.C.; Parsons, J.R.; Kalbitz, K. An Examination of the Role of Biochar and Biochar Water-Extractable Substances on the Sorption of Ionizable Herbicides in Rice Paddy Soils. Sci. Total Environ. 2020, 706, 135682. [Google Scholar] [CrossRef]
- Colmenero-Flores, J.M.; Franco-Navarro, J.D.; Cubero-Font, P.; Peinado-Torrubia, P.; Rosales, M.A. Chloride as a Beneficial Macronutrient in Higher Plants: New Roles and Regulation. Int. J. Mol. Sci. 2019, 20, 1–32. [Google Scholar] [CrossRef] [PubMed]
- Liu, Z.; Hoekman, S.K.; Balasubramanian, R.; Zhang, F.S. Improvement of Fuel Qualities of Solid Fuel Biochars by Washing Treatment. Fuel Process. Technol. 2015, 134, 130–135. [Google Scholar] [CrossRef]
- Knicker, H. “Black Nitrogen” - an Important Fraction in Determining the Recalcitrance of Charcoal. Org. Geochem. 2010, 41, 947–950. [Google Scholar] [CrossRef]
- Mukhopadhyay, S.; Masto, R.E.; Sarkar, P.; Bari, S. Biochar Washing to Improve the Fuel Quality of Agro-Industrial Waste Biomass. J. Energy Inst. 2022, 102, 60–69. [Google Scholar] [CrossRef]
- Korai, P.K.; Sial, T.A.; Pan, G.; Abdelrahman, H.; Sikdar, A.; Kumbhar, F.; Channa, S.A.; Ali, E.F.; Zhang, J.; Rinklebe, J.; et al. Wheat and Maize-Derived Water-Washed and Unwashed Biochar Improved the Nutrients Phytoavailability and the Grain and Straw Yield of Rice and Wheat: A Field Trial for Sustainable Management of Paddy Soils. J. Environ. Manag. 2021, 297. [Google Scholar] [CrossRef]
- Le Brech, Y.; Delmotte, L.; Raya, J.; Brosse, N.; Gadiou, R.; Dufour, A. High Resolution Solid State 2D NMR Analysis of Biomass and Biochar. Anal. Chem. 2015, 87, 843–847. [Google Scholar] [CrossRef]
- Knicker, H.; Velasco-Molina, M.; Knicker, M. 2D Solid-State Hetcor1H-13C Nmr Experiments With Variable Cross Polarization Times As a Tool for a Better Understanding of the Chemistry of Cellulose-Based Pyrochars—a Tutorial. Appl. Sci. 2021, 11. [Google Scholar] [CrossRef]
- Paneque, M.; De la Rosa, J.M.; Kern, J.; Reza, M.T.; Knicker, H. Hydrothermal Carbonization and Pyrolysis of Sewage Sludges: What Happen to Carbon and Nitrogen? J. Anal. Appl. Pyrolysis 2017, 128, 314–323. [Google Scholar] [CrossRef]
- Pan, S.Y.; Di Dong, C.; Su, J.F.; Wang, P.Y.; Chen, C.W.; Chang, J.S.; Kim, H.; Huang, C.P.; Hung, C.M. The Role of Biochar in Regulating the Carbon, Phosphorus, and Nitrogen Cycles Exemplified by Soil Systems. Sustain. 2021, 13, 1–34. [Google Scholar] [CrossRef]
- Martínez-Gómez, Á.; Andrés, M.F.; Barón-Sola, Á.; Díaz-Manzano, F.E.; Yousef, I.; Mena, I.F.; Díaz, E.; Gómez-Torres, Ó.; González-Coloma, A.; Hernández, L.E.; et al. Biochar from Grape Pomace, a Waste of Vitivinicultural Origin, Is Effective for Root-Knot Nematode Control. Biochar 2023, 5. [Google Scholar] [CrossRef]
- Carril, P.; Ghorbani, M.; Loppi, S. Effect of Biochar Type, Concentration and Washing Conditions on the Germination Parameters of Three Model Crops; 2023; pp. 1–12. [Google Scholar]
- Bargmann, I.; Rillig, M.C.; Buss, W.; Kruse, A.; Kuecke, M. Hydrochar and Biochar Effects on Germination of Spring Barley. J. Agron. Crop Sci. 2013, 199, 360–373. [Google Scholar] [CrossRef]
- Rogovska, N.; Laird, D.; Cruse, R.M.; Trabue, S.; Heaton, E. Germination Tests for Assessing Biochar Quality. J. Environ. Qual. 2012, 41, 1014–1022. [Google Scholar] [CrossRef] [PubMed]
- Chen, D.; Li, R.; Bian, R.; Li, L.; Joseph, S.; Crowley, D.; Pan, G. Contribution of Soluble Minerals in Biochar to Pb2+ Adsorption in Aqueous Solutions. BioResources 2016, 12, 1662–1679. [Google Scholar] [CrossRef]
- Liu, C.; Sun, B.; Zhang, X.; Liu, X.; Drosos, M.; Li, L.; Pan, G. The Water-Soluble Pool in Biochar Dominates Maize Plant Growth Promotion Under Biochar Amendment. J. Plant Growth Regul. 2021, 40, 1466–1476. [Google Scholar] [CrossRef]
- Naciri, R.; Rajib, W.; Chtouki, M.; Zeroual, Y.; Oukarroum, A. Potassium and Phosphorus Content Ratio in Hydroponic Culture Affects Tomato Plant Growth and Nutrient Uptake. Physiol. Mol. Biol. Plan. 2022, 28, 763–774. [Google Scholar] [CrossRef]
- Mohammed, S.P.; Yen, J.Y.; Hsu, Y.C.; Chou, H.Y.; Natarajan, S.; Eybishitz, A. Integrative Trait Analysis for Enhancing Heat Stress Resilience in Tomato (Solanum Lycopersicum L.): A Focus on Root, Physiological, and Yield Adaptations. Plants 2025, 14, 1–19. [Google Scholar] [CrossRef]
- Calcan, S.I.; Pârvulescu, O.C.; Ion, V.A.; Răducanu, C.E.; Bădulescu, L.; Madjar, R.; Dobre, T.; Egri, D.; Moț, A.; Iliescu, L.M.; et al. Effects of Biochar on Soil Properties and Tomato Growth. Agronomy 2022, 12, 25–27. [Google Scholar] [CrossRef]
- Xu, X.; Du, X.; Wang, F.; Sha, J.; Chen, Q.; Tian, G.; Zhu, Z.; Ge, S.; Jiang, Y. Effects of Potassium Levels on Plant Growth, Accumulation and Distribution of Carbon, and Nitrate Metabolism in Apple Dwarf Rootstock Seedlings. Front. Plant Sci. 2020, 11, 1–13. [Google Scholar] [CrossRef]
- Reitz, N.F.; Shackel, K.A.; Mitcham, E.J. Differential Effects of Excess Calcium Applied to Whole Plants vs. Excised Fruit Tissue on Blossom-End Rot in Tomato. Sci. Hortic. (Amsterdam). 2021, 290, 110514. [Google Scholar] [CrossRef]
- Knicker, H.; Hilscher, A.; González-Vila, F.J.; Almendros, G. A New Conceptual Model for the Structural Properties of Char Produced during Vegetation Fires. Org. Geochem. 2008, 39, 935–939. [Google Scholar] [CrossRef]
Figure 1.
13C NMR Spectra of biochar from tomato green waste and vineyard pruning produced at 400°C and 500°C, respectively before (TB 0, VB 0) and after two times washing (TB 2 and VB 2). Asterisks indicate spinning side bands.
Figure 1.
13C NMR Spectra of biochar from tomato green waste and vineyard pruning produced at 400°C and 500°C, respectively before (TB 0, VB 0) and after two times washing (TB 2 and VB 2). Asterisks indicate spinning side bands.
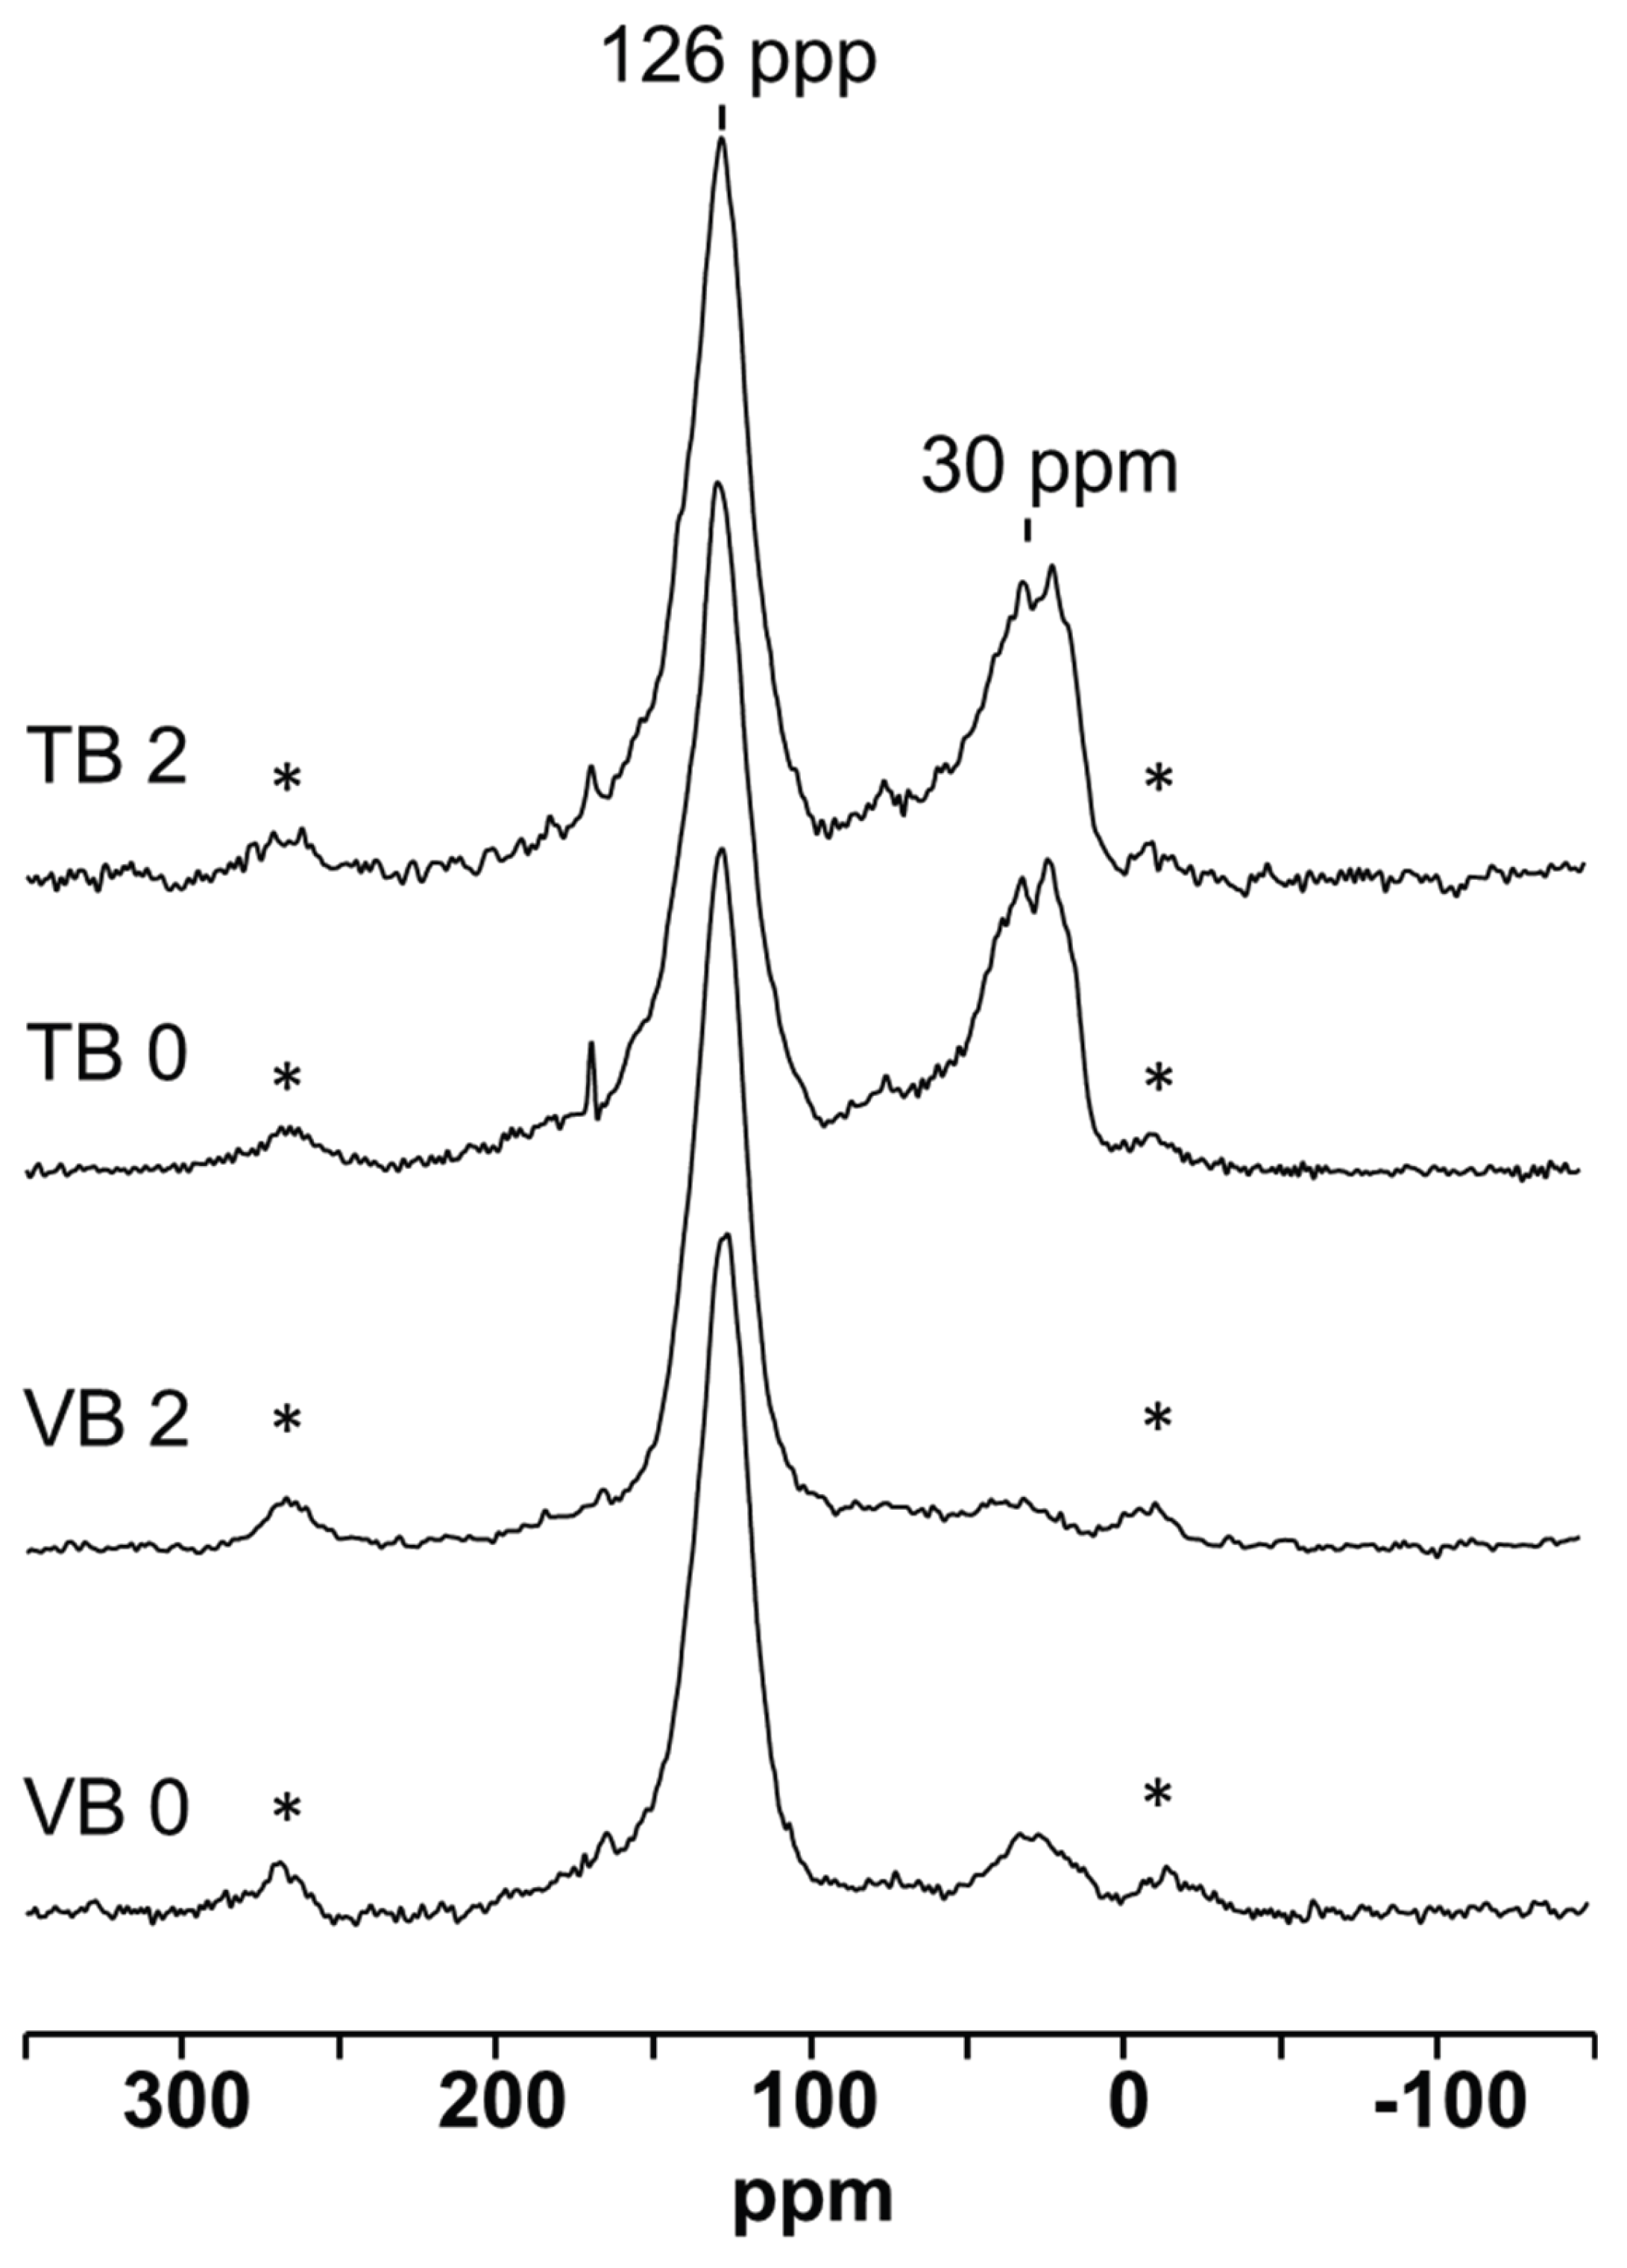
Figure 2.
Germination rates of tomato seeds sowed on different biochar: peat substrate mixtures, based on tomato biochar ( Figure 2a) with no washing treatment (TB 0), with one washing (TB 1) and with two washings (TB 2) (v/v); and based on vineyard biochar (Figure 2b) with no washing treatment (VB 0), with one washing (VB 1) and with two washings (VB 2) (v/v). Values are the accumulated percentage of seeds germinated at days counted. DAS, days after sowing.
Figure 2.
Germination rates of tomato seeds sowed on different biochar: peat substrate mixtures, based on tomato biochar ( Figure 2a) with no washing treatment (TB 0), with one washing (TB 1) and with two washings (TB 2) (v/v); and based on vineyard biochar (Figure 2b) with no washing treatment (VB 0), with one washing (VB 1) and with two washings (VB 2) (v/v). Values are the accumulated percentage of seeds germinated at days counted. DAS, days after sowing.
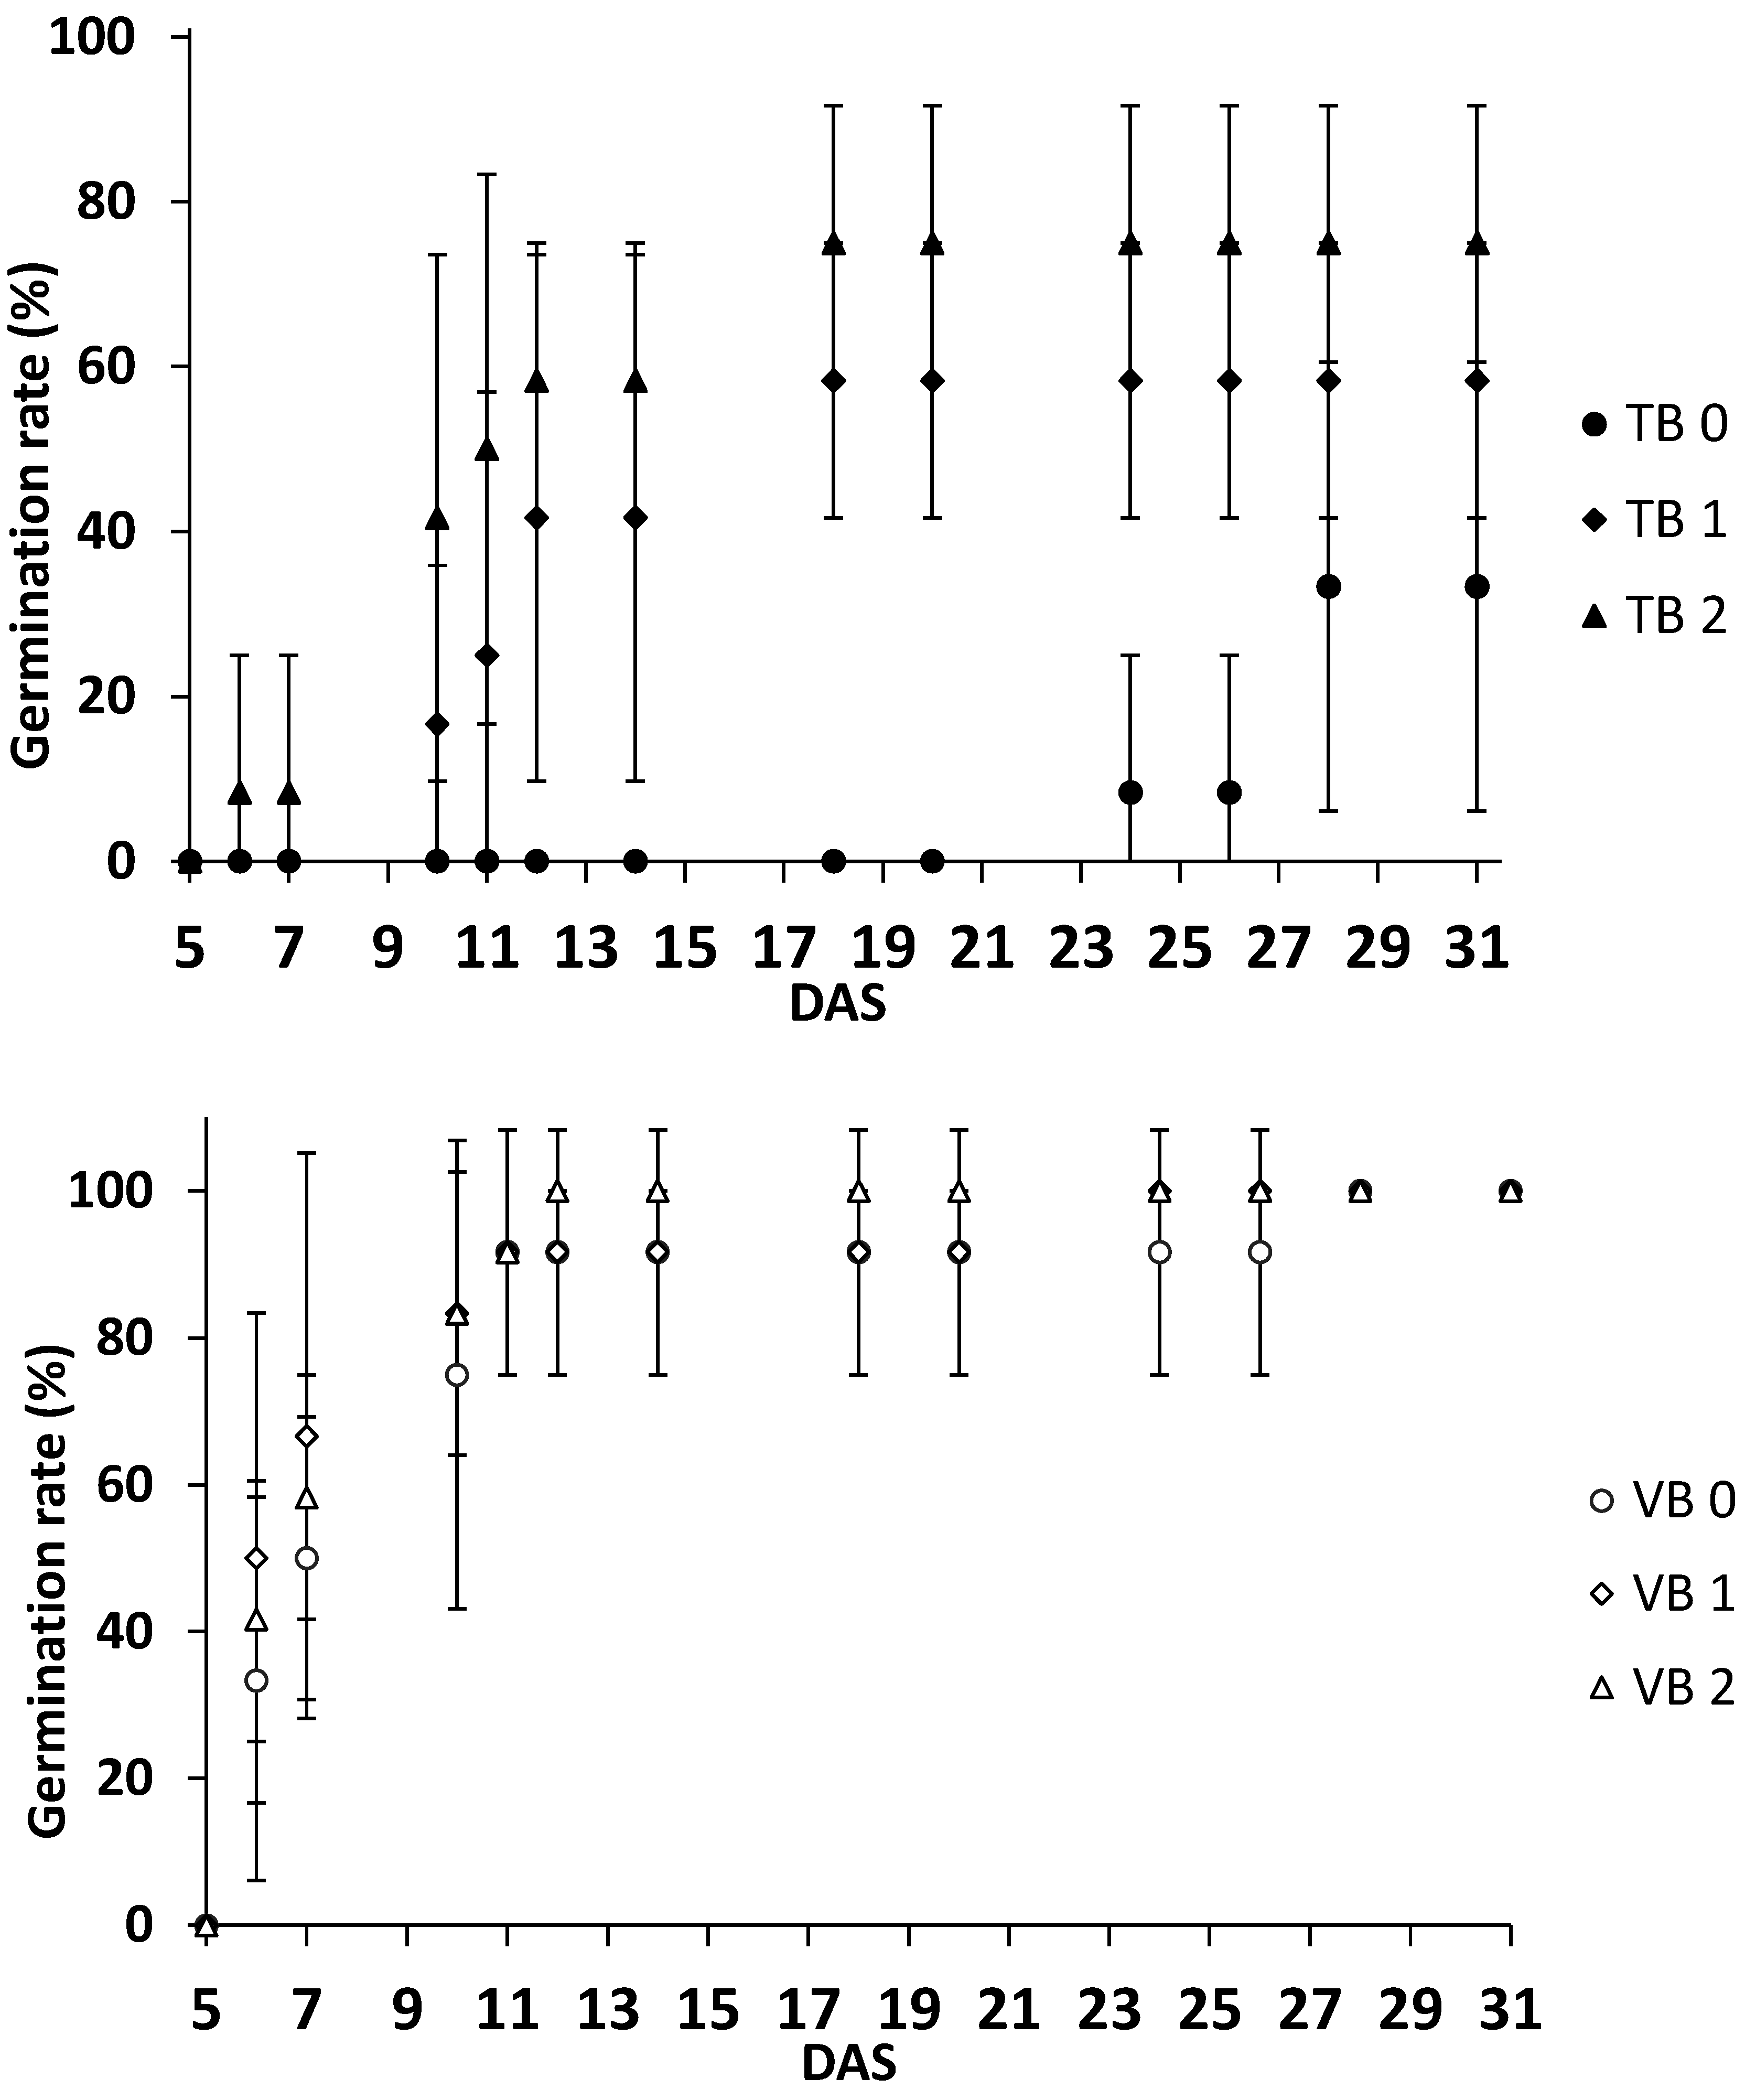
Figure 3.
Condition of plants at 31 days after sowing. Starting from the left (in columns): VB 2, VB 1, VB 0, TB 2, TB 1 and TB 0.
Figure 3.
Condition of plants at 31 days after sowing. Starting from the left (in columns): VB 2, VB 1, VB 0, TB 2, TB 1 and TB 0.
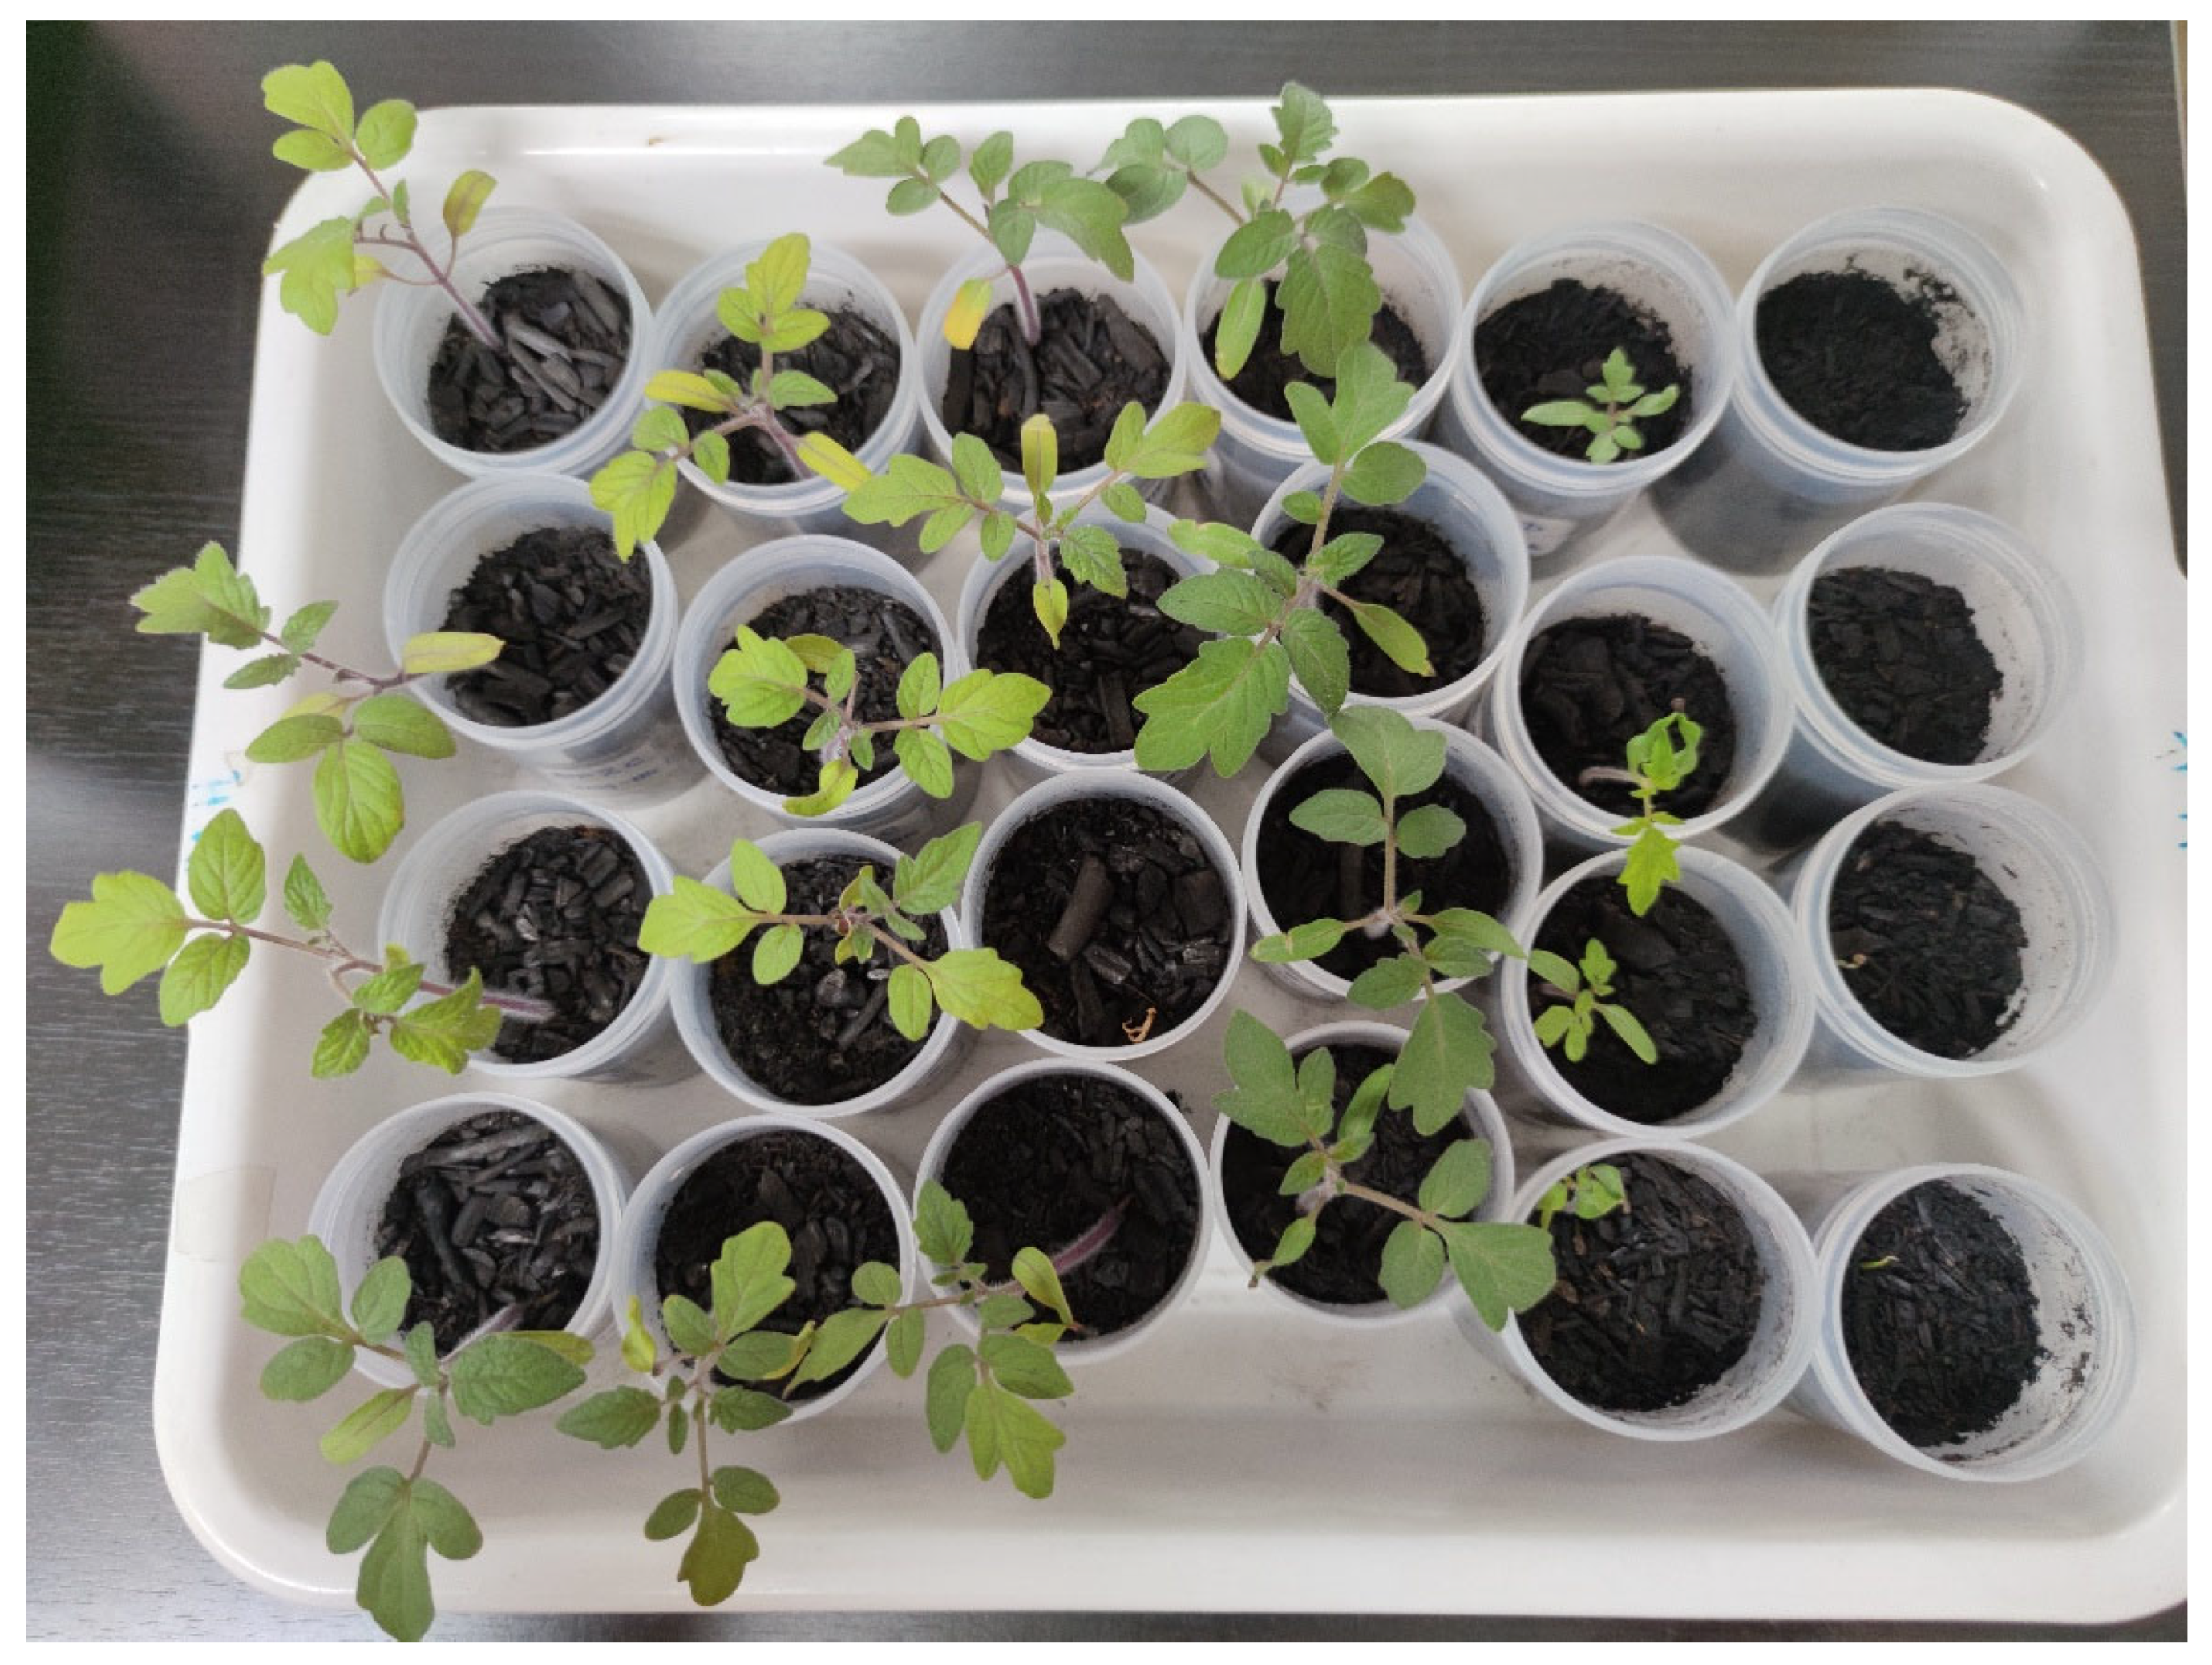
Figure 4.
Evolution of growth with the time of tomato plants sown on different biochar: peat substrate mixtures, based on tomato biochar ( Figure 4a) with no washing treatment (TB 0), with one washing (TB 1) and with two washings (TB 2) (v/v); and based on vineyard biochar (Figure 4b) with no washing treatment (VB 0), with one washing (VB 1) and with two washings (VB 2) (v/v). Values are the accumulated percentage of seeds germinated at days counted. DAS, days after sowing.
Figure 4.
Evolution of growth with the time of tomato plants sown on different biochar: peat substrate mixtures, based on tomato biochar ( Figure 4a) with no washing treatment (TB 0), with one washing (TB 1) and with two washings (TB 2) (v/v); and based on vineyard biochar (Figure 4b) with no washing treatment (VB 0), with one washing (VB 1) and with two washings (VB 2) (v/v). Values are the accumulated percentage of seeds germinated at days counted. DAS, days after sowing.
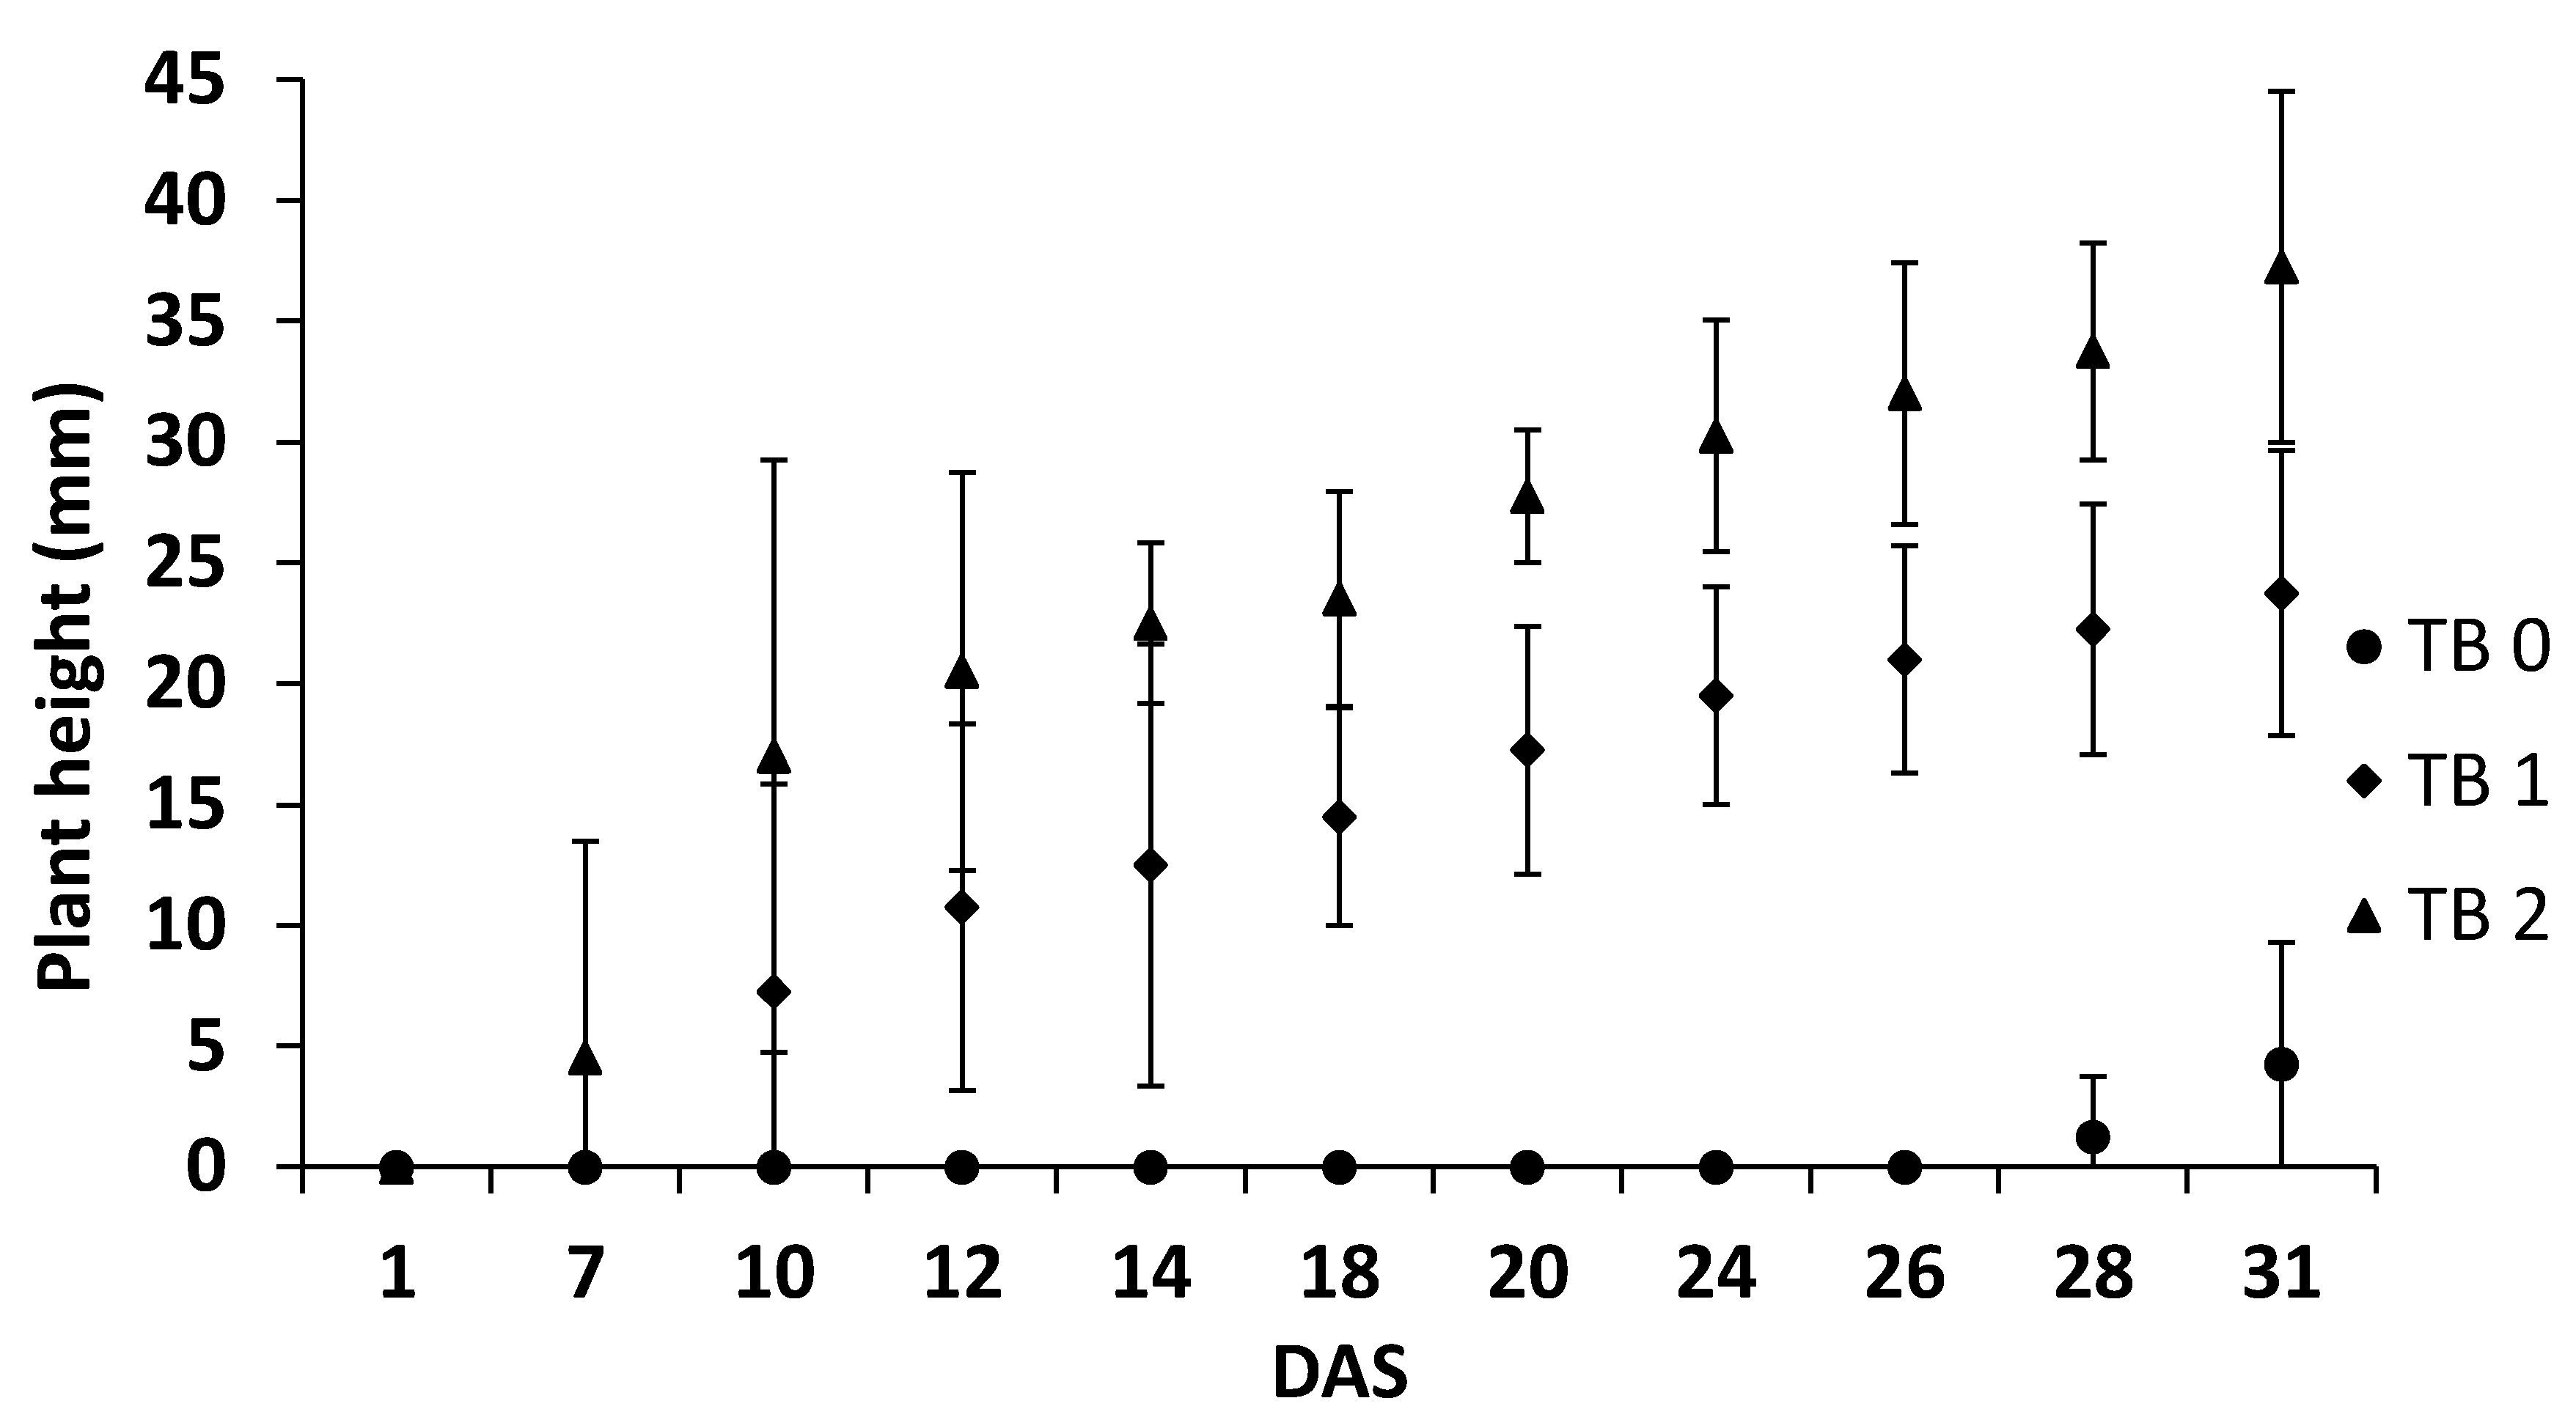
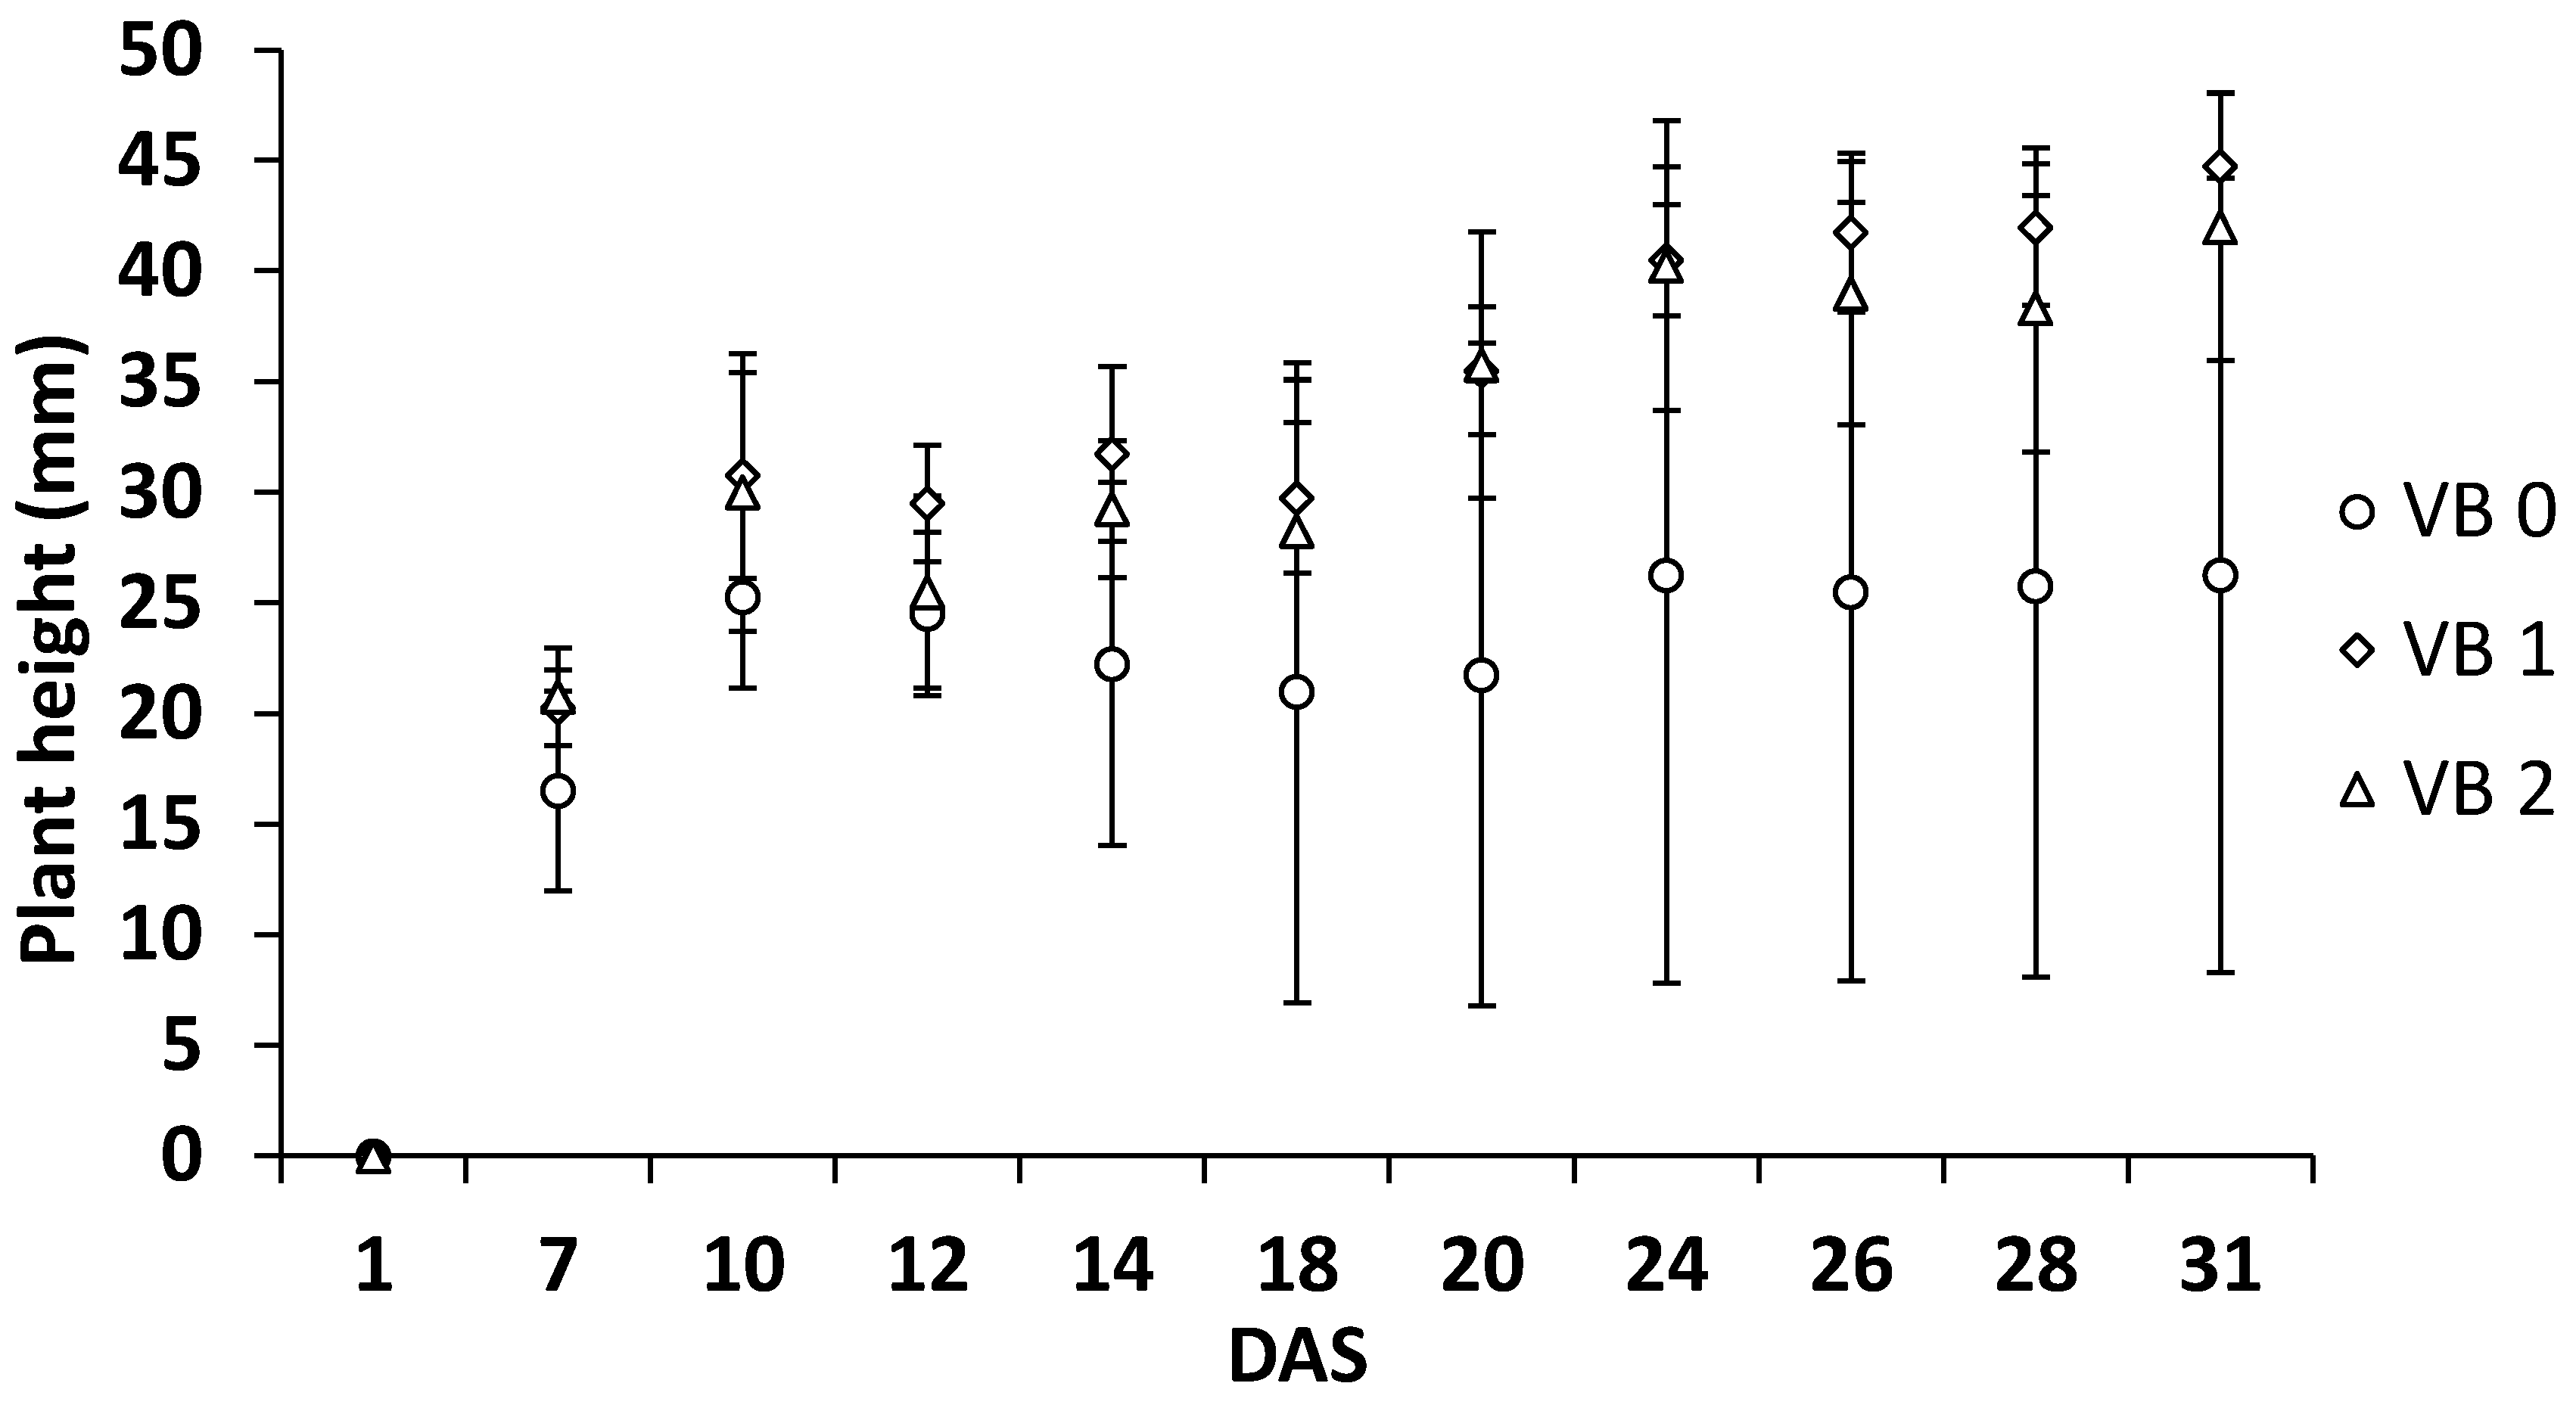
Figure 5.
Pearson product-moment correlation matrix. Parameters: Germination (at 12 and 31 DAS), Biomass production at 31 DAS, SPAD, pH (at 0 and 31 DAS), EC (at 0 and 31 DAS), ions content (Na, Cl, Ca, K, P, S). Correlations: Not significant at 5% (X), positive and significant at 5% (Red); negative and significant at 5% (Blue).
Figure 5.
Pearson product-moment correlation matrix. Parameters: Germination (at 12 and 31 DAS), Biomass production at 31 DAS, SPAD, pH (at 0 and 31 DAS), EC (at 0 and 31 DAS), ions content (Na, Cl, Ca, K, P, S). Correlations: Not significant at 5% (X), positive and significant at 5% (Red); negative and significant at 5% (Blue).
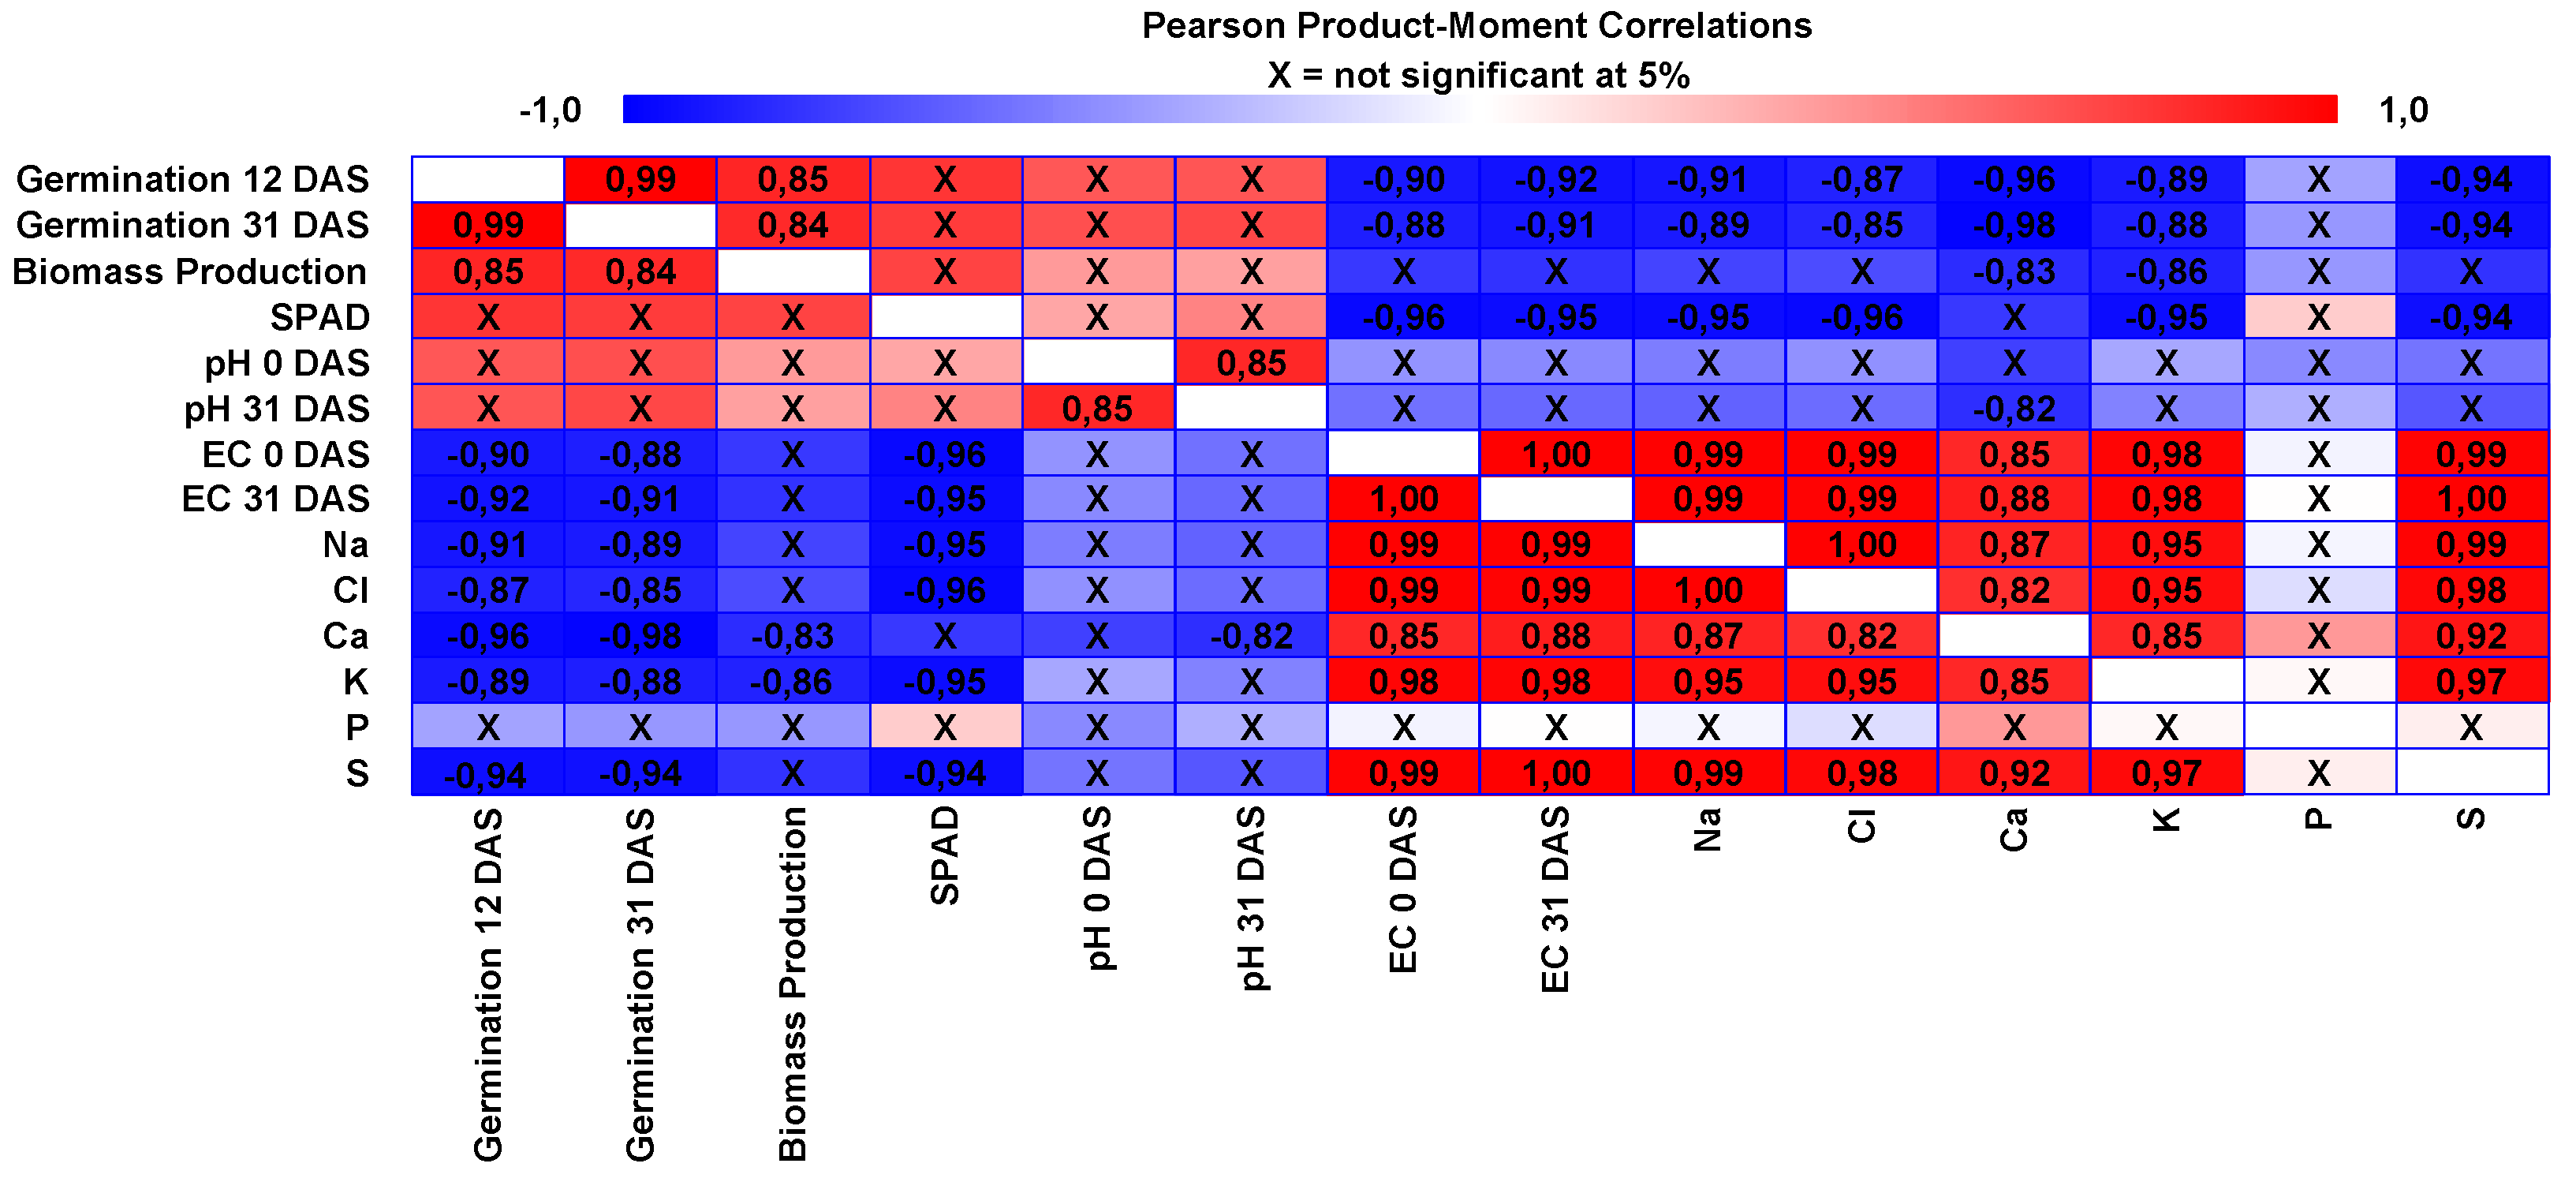
Figure 6.
PCA biplot with the first two PCA axes, with projected centroids of treatments based on tomato biochar (TB 0-dark red, TB 1-red and TB 2-orange) and vineyard biochar based (VB 0-black, VB 1- grey and VB 2- white). Substrate parameters (pH (at 0 and 31 DAS), EC (at 0 and 31 DAS), Cl-, water consumption (WC) and WHC) and plant parameters (Total germination (TG), plant height (PH), shoot fresh weight (FW), dry weight (DW), Root weight (RW), leaf area (LA) and SPAD) are shown.
Figure 6.
PCA biplot with the first two PCA axes, with projected centroids of treatments based on tomato biochar (TB 0-dark red, TB 1-red and TB 2-orange) and vineyard biochar based (VB 0-black, VB 1- grey and VB 2- white). Substrate parameters (pH (at 0 and 31 DAS), EC (at 0 and 31 DAS), Cl-, water consumption (WC) and WHC) and plant parameters (Total germination (TG), plant height (PH), shoot fresh weight (FW), dry weight (DW), Root weight (RW), leaf area (LA) and SPAD) are shown.
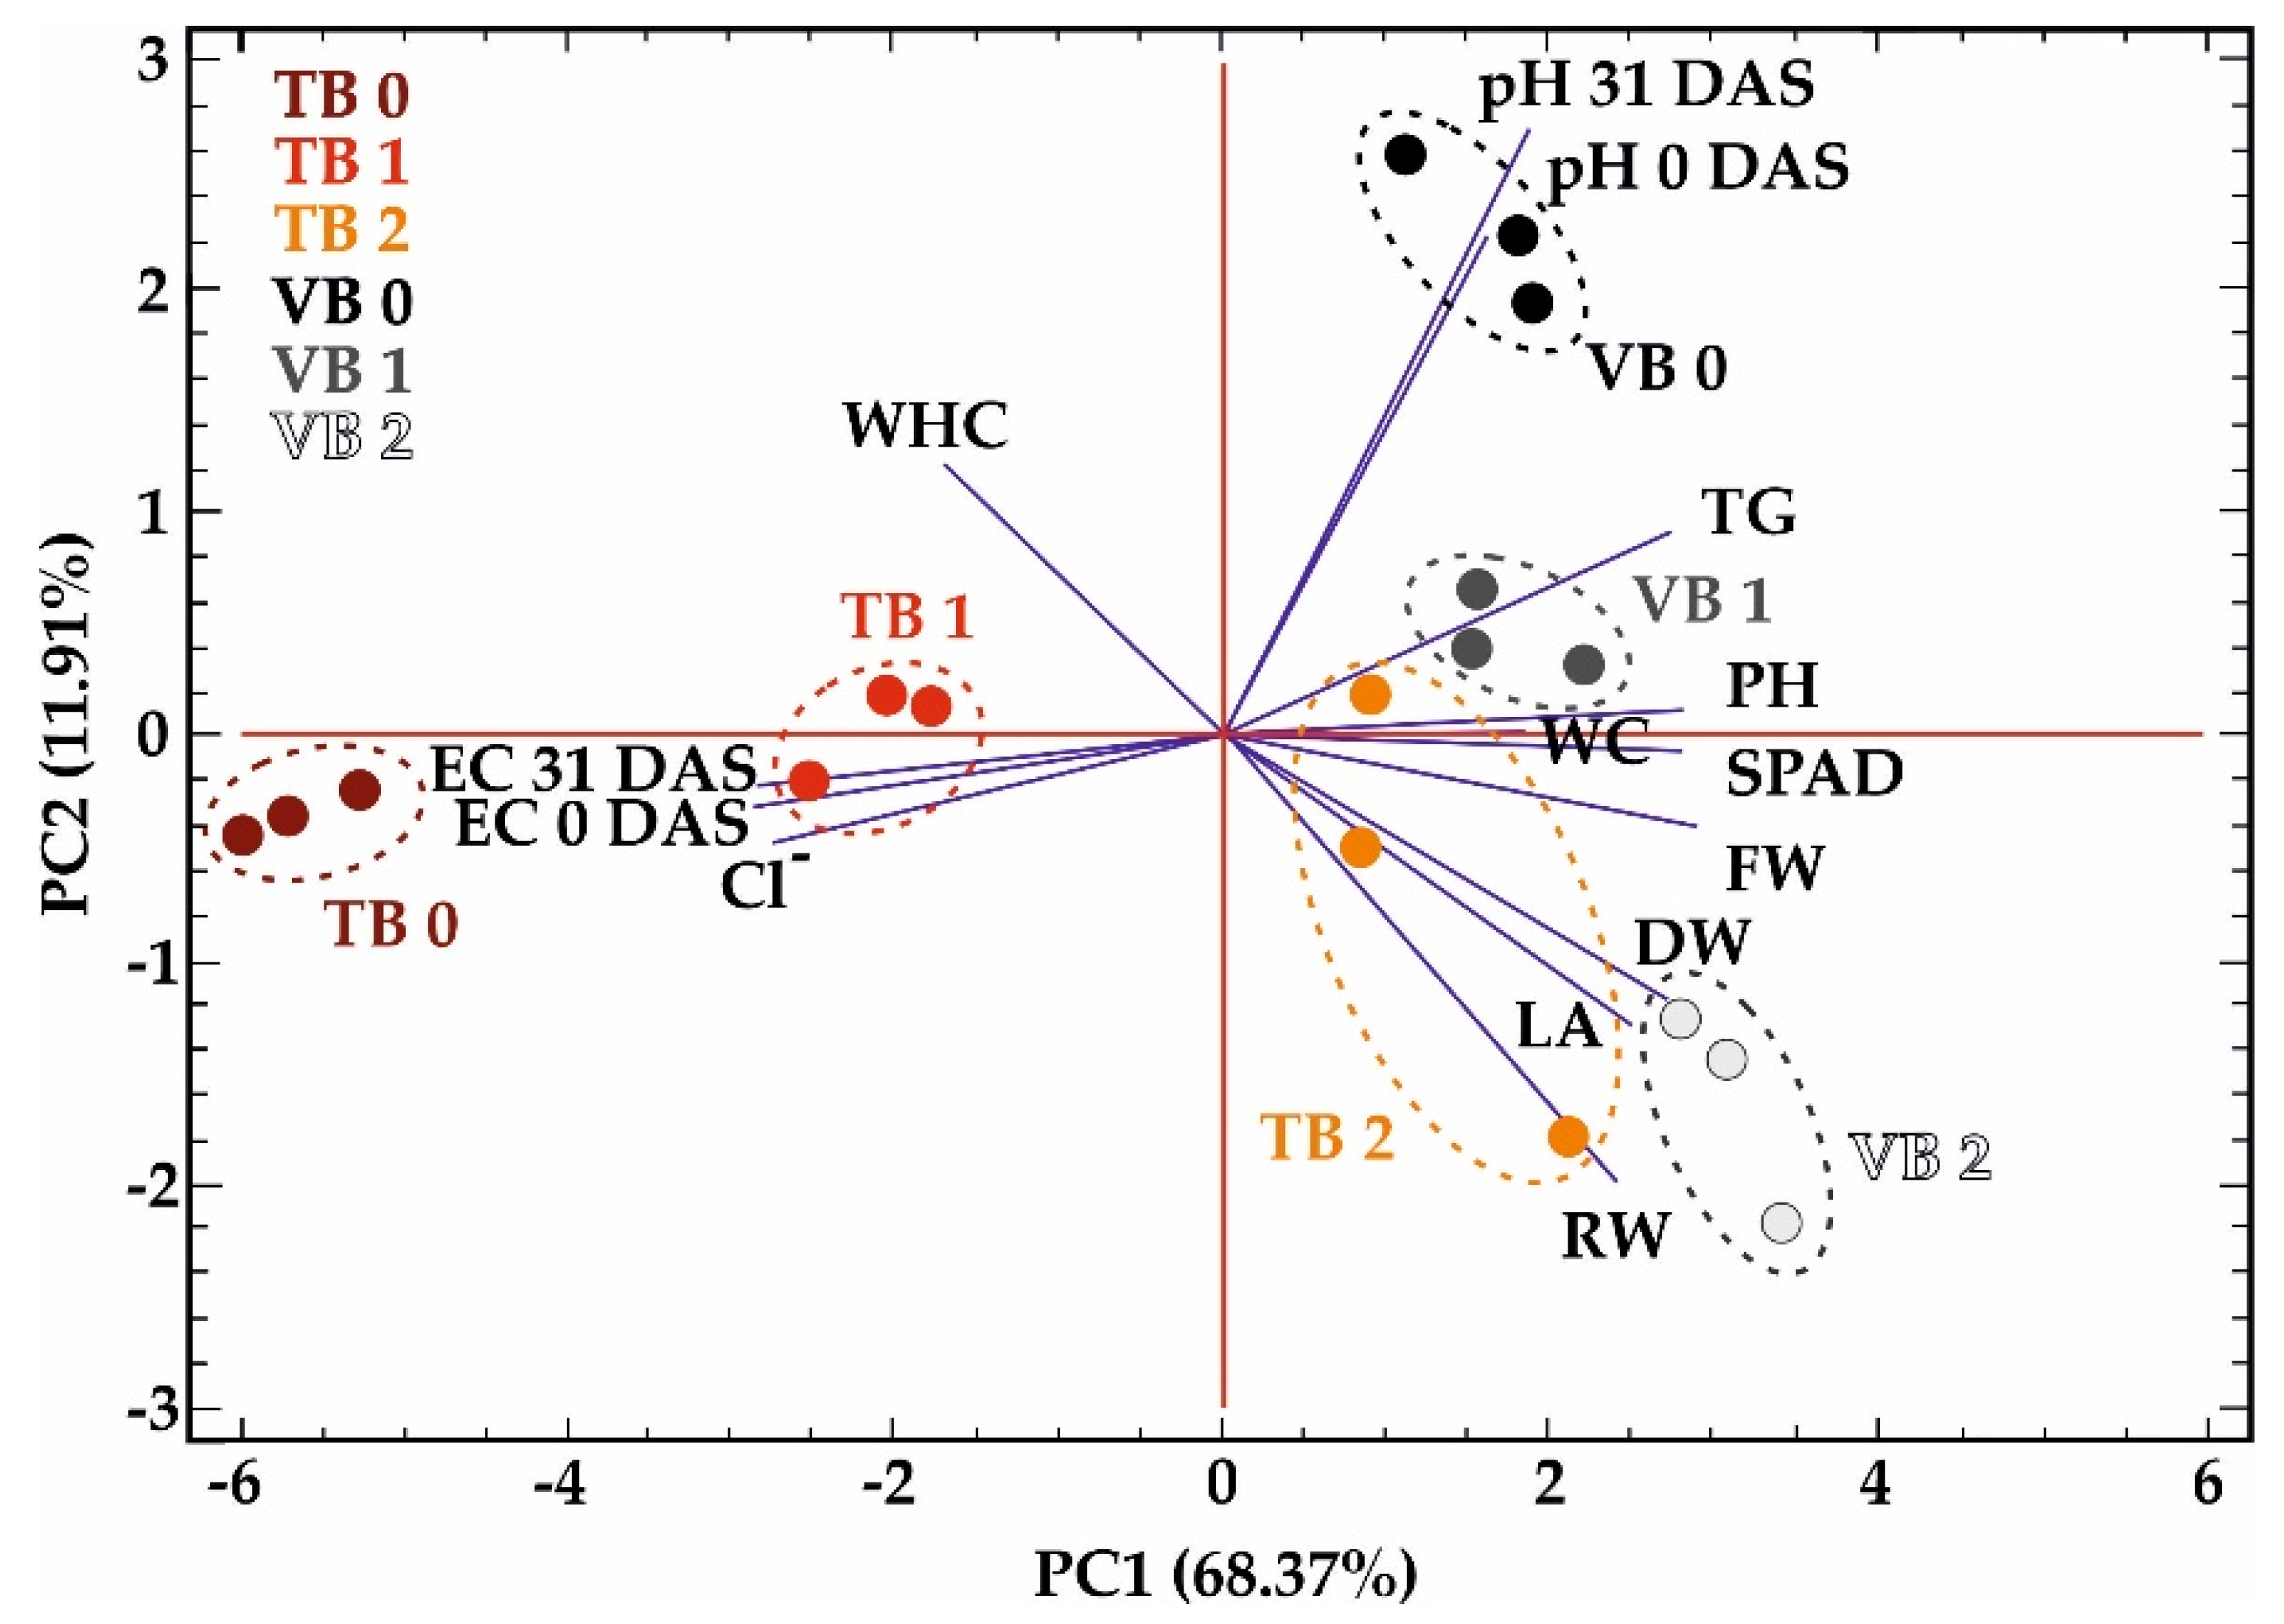
Figure 7.
PCA biplot with the first two PCA axes, with projected centroids of treatments based on tomato biochar (TB 0-dark red, TB 1-red and TB 2-orange) and vineyard biochar based (VB 0-black, VB 1- grey and VB 2- white). Plant parameters: Germination at 12 DAS (G 12 DAS), Germination at 31 DAS (G 31 DAS), Dry Weight (DW), Root Dry Weight (RW); and substrate ions content (Na, Cl, Ca, K, P, S) are shown.
Figure 7.
PCA biplot with the first two PCA axes, with projected centroids of treatments based on tomato biochar (TB 0-dark red, TB 1-red and TB 2-orange) and vineyard biochar based (VB 0-black, VB 1- grey and VB 2- white). Plant parameters: Germination at 12 DAS (G 12 DAS), Germination at 31 DAS (G 31 DAS), Dry Weight (DW), Root Dry Weight (RW); and substrate ions content (Na, Cl, Ca, K, P, S) are shown.
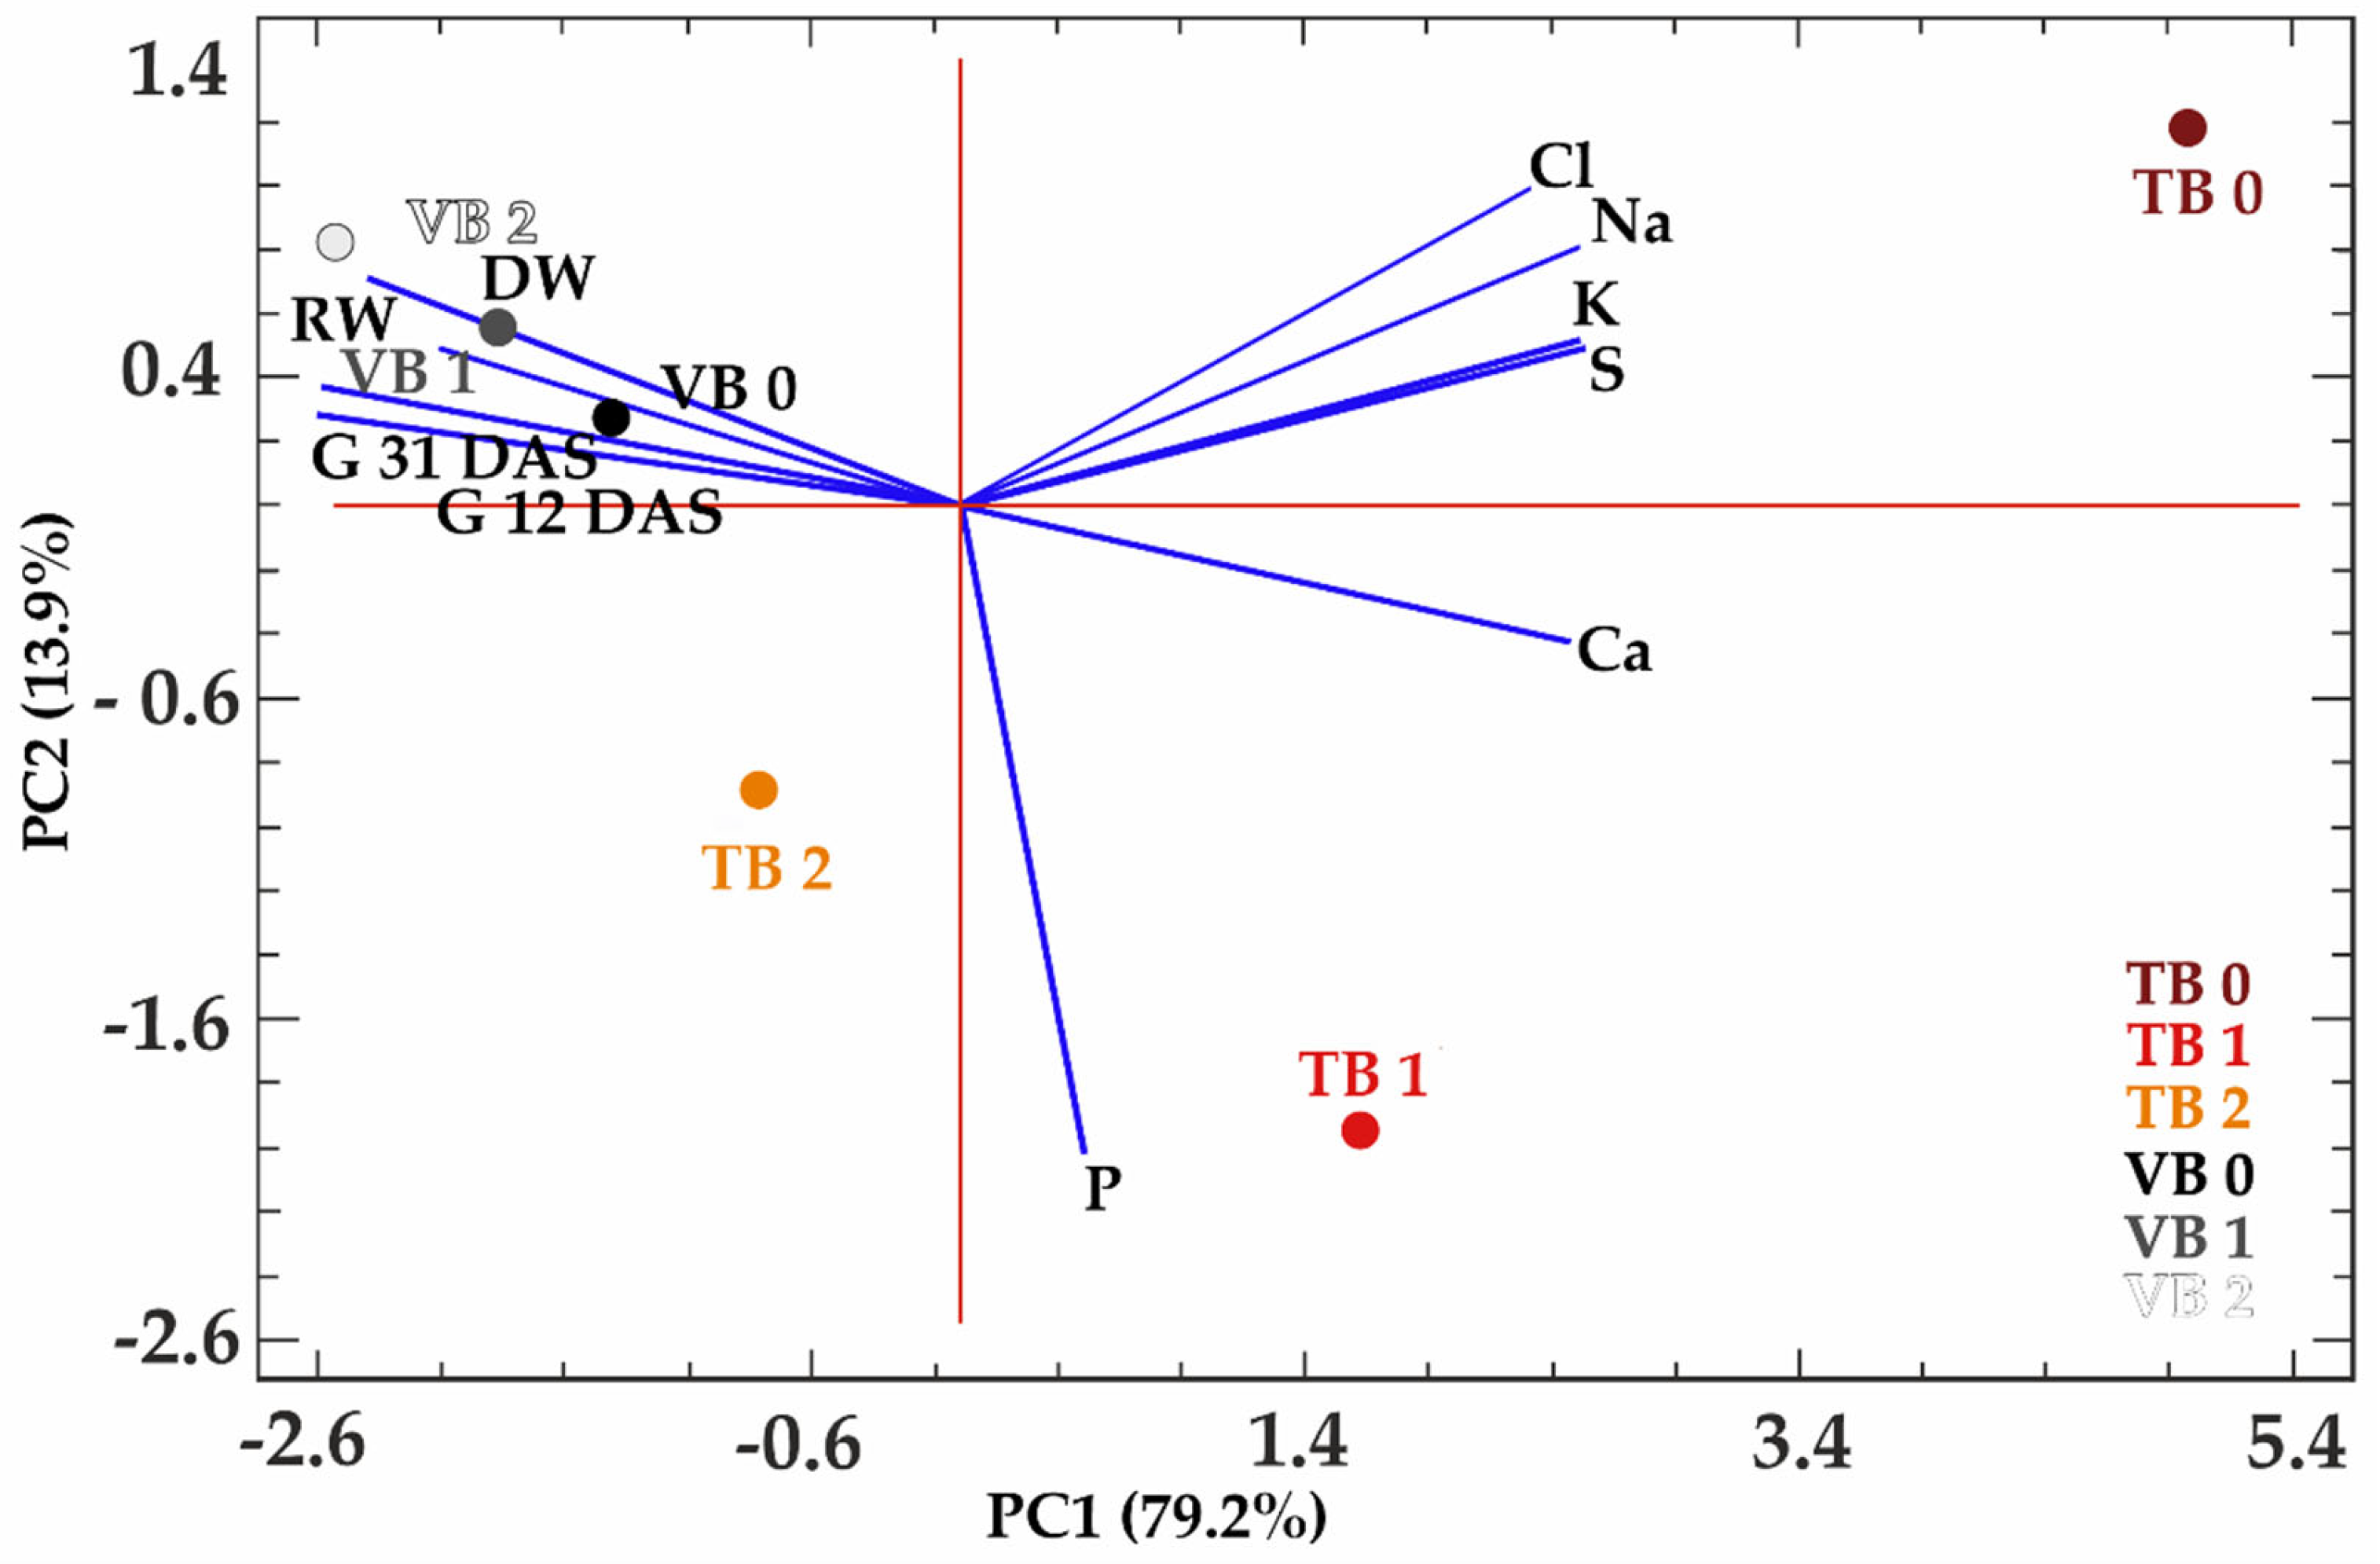

Table 1.
pH, electrical conductivity (EC), total carbon (TC) and nitrogen (TN) contents, the C/N ratios and Cl- content of the peat substrate (PE) and biochars derived from tomato green waste (TB) and vineyard pruning residues (VB) before (XX 0) and after he first (XX 1) and second (XX 2) washing with distilled water.
Table 1.
pH, electrical conductivity (EC), total carbon (TC) and nitrogen (TN) contents, the C/N ratios and Cl- content of the peat substrate (PE) and biochars derived from tomato green waste (TB) and vineyard pruning residues (VB) before (XX 0) and after he first (XX 1) and second (XX 2) washing with distilled water.
| Material | pH | EC (μs cm-1) | TC (mg g-1) | TN (mg g-1) | C/N | Cl- (mg g-1) |
|
TB 0 TB 1 TB 2 |
9.7±0.1a 9.1±0.0b 8.5±0.1c |
9147±96a 782±29b 272±21c |
422.3±10.9a* 462.1±42.7a 472.9±31.4a |
20.6±0.6b 30.7±3.0a 27.3±1.6a |
20.5±0.2a 15.0±0.1b 17.3±0.2b |
17.7±0.9a 2.5±0.2b 0.5±0.1c |
| p | *** | *** | ns | ** | *** | *** |
|
VB 0 VB 1 VB 2 |
10.3±0.0a 9.4±0.1b 8.9±0.2c |
1539±33a 376±39b 75.4±4c |
408.9±7.4a* 552.7±0.0 a 483.1±54.7a |
5.0±0.0b 7.4±0.0a 7.4±1.1a |
861.6±12.1a 75.1±0.0b 65.5±2.1c |
0.4±0.0a 0.3±0.1b 0.2±0.0b |
| p | *** | *** | ns | ** | *** | ** |
| PE | 6.5±0.1 | 833±4 | 510.0±194.9 | 19.9±4.6 | 25.8±7.1 | 0.3±0.1 |
|
M W MxW |
ns* *** *** |
*** *** *** |
* ns ns |
*** *** ns |
*** *** *** |
*** *** *** |
*ns: no significant differences. Values followed by different letters in the same column indicate significant differences according to Tukey’s test. Levels of significance: “ns.” p > 0.05. * p ≤ 0.05. ** p ≤ 0.01. *** p ≤ 0.001. Statistical differences between material (M), number of washings (W) and their interaction (MxW) are shown at the bottom of the table.
Table 2.
Total contents of micro-nutrients in the fresh biochars TB 0 and VB 0, after the first (TB 1 and VB 1) and second washing (TB 2 and VB 2), and the peat.
Table 2.
Total contents of micro-nutrients in the fresh biochars TB 0 and VB 0, after the first (TB 1 and VB 1) and second washing (TB 2 and VB 2), and the peat.
| Material |
Zn (mg g-1) |
Ca (mg g-1) |
Fe (mg g-1) |
K (mg g-1) |
Mg (mg g-1) |
Mn (mg g-1) |
Na (mg g-1) |
P (mg g-1) |
S (mg g-1) |
|
TB 0 TB 1 TB 2 VB 0 VB 1 VB 2 PE |
0.2 0.2 0.2 0.2 0.3 0.2 0.04 |
119.7 101.5 69.8 45.2 54.1 56.5 14.9 |
0.2 1.1 0.5 2.4 6.4 6.8 6.1 |
33.5 18.4 9.6 14.4 9.2 7.8 1.5 |
18.1 11.2 10.5 6.0 8.2 8.6 1.8 |
0.08 0.09 0.06 0.3 0.4 0.4 0.2 |
7.4 2.1 1.3 0.7 0.9 0.7 0.2 |
4.4 7.2 6.2 4.4 4.0 4.1 0.7 |
13.2 4.9 1.8 0.7 0.6 0.6 3.1 |
Table 3.
Relative contribution of different C classes to the total organic C of fresh (TB 0 and VB 0) and the biochars after two washings (TB 2 and VB 2) according to solid-state 13C NMR spectroscopy.
Table 3.
Relative contribution of different C classes to the total organic C of fresh (TB 0 and VB 0) and the biochars after two washings (TB 2 and VB 2) according to solid-state 13C NMR spectroscopy.
| C group (% of TOC) | TB 0 | TB 2 | VB 0 | VB 2 |
| Carbonyl C | 2.5 | 2.5 | 1.4 | 2.2 |
| Carboxyl C | 4.3 | 4.8 | 4.5 | 4.2 |
| O-aryl C | 9.6 | 10.1 | 9.2 | 9.4 |
| aryl C | 47.9 | 48.2 | 67.6 | 70.6 |
| O-alkyl C | 10.7 | 10.8 | 6.8 | 7.3 |
| alkyl C | 24.9 | 23.5 | 10.4 | 6.3 |
| aryl C/O-aryl C | 100.0 | 100.0 | 100.0 | 100.0 |
Table 4.
pH (at 0 and 31 DAS), electrical conductivity (EC) (at 0 and 31 DAS), water holding capacity (WHC%) and chloride content (Cl-) (at 0 and 31 DAS), of substrates based on washed and non-washed biochars mixed with peat at 60:40 (v/v).
Table 4.
pH (at 0 and 31 DAS), electrical conductivity (EC) (at 0 and 31 DAS), water holding capacity (WHC%) and chloride content (Cl-) (at 0 and 31 DAS), of substrates based on washed and non-washed biochars mixed with peat at 60:40 (v/v).
| Treatment | pH | EC (μS cm-1) | WHC (%) | Cl- (mg g-1) | |||
| 0 DAS* | 31 DAS | 0 DAS | 31 DAS | 0 DAS | 31 DAS | ||
|
TB 0 TB 1 TB 2 |
8.1±0.1b 8.1±0.0b 8.2±0.0a |
8.7±0.2b 8.8±0.1b 9.3±0.1a |
4517±398a 1355±32b 619±7c |
3843±533a 1357±88b 601±39c |
223±16a 179±11a 176±27a |
26.7 2.6 0.4 |
19.1±2.3a 3.2±0.5b 0.4±0.0c |
| p | * | *** | *** | *** | * | - | *** |
|
VB 0 VB 1 VB 2 |
9.3±0.1a 8.4±0.0b 8.6±0.0b |
10.1±0.1a 9.5±0.0b 9.0±0.1c |
751±105a 433±0b 261±13c |
590±22a 310±14b 250±13c |
181±12b 213±0a 127±5c |
0.4 0.3 0.2 |
0.5±0.1a 0.3±0.0b 0.2±0.1b |
| p | *** | *** | *** | *** | *** | - | ** |
|
M W MxW |
*** *** *** |
*** *** *** |
*** *** *** |
*** *** *** |
* *** *** |
- - - |
*** *** *** |
*DAS: Days After Sowing. Values followed by different letters in the same column indicate significant differences according to Tukey’s test. Levels of significance: “ns.” p > 0.05. * p ≤ 0.05. ** p ≤ 0.01. *** p ≤ 0.001. Statistical differences between material (M), number of washings (W) and their interaction (MxW) are shown at the bottom of the table.
Table 5.
Total germination (TG), plant height (PH), shoot weight (FW and DW), plant water content (WC), leaf area (LA), chlorophyll indicator (SPAD), root dry weight (DW) and root: shoot ratio (R/S) of tomato plants cultivated under different peats: biochar substrates based on washed and non-washed biochars.
Table 5.
Total germination (TG), plant height (PH), shoot weight (FW and DW), plant water content (WC), leaf area (LA), chlorophyll indicator (SPAD), root dry weight (DW) and root: shoot ratio (R/S) of tomato plants cultivated under different peats: biochar substrates based on washed and non-washed biochars.
| Treatments |
TG (%) |
PH (mm) |
Water consumption (mL) |
Shoot FW (mg) |
Shoot DW(mg) |
Plant WC (%) |
LA (cm2) |
SPAD Index |
Root DW(mg) |
Dry R/S |
|
TB 0 TB 1 TB 2 |
33.3±27.2b 58.3±16.7ab 75.0±16.7a |
4.3±5.1c 23.8±5.9b 37.3±7.3a |
72.5± 1.2a 64.0± 1.9b 78.5± 6.0a |
4±4 b 88±21b 531±171a |
1±1b 7±2b 51±17a |
81.6±8.4b 92.0±0.5a 90.5±0.5a |
BD** 2.2±1.1b 15.5±8.3a |
BD** 26.7±6.3b 39.2±2.0a |
1±1b 2±1b 22±13a |
1.3 0.3 0.4 |
| p | ns | *** | ** | *** | *** | * | ** | *** | ** | - |
|
VB 0 VB 1 VB 2 |
100±0a 100±0a 100±0a |
35.0±5.0a 44.8±3.3a 42.0±6.1a |
84.8± 9.9b 104± 4.6a 96.9±10.7ab |
446±43a 438±55a 533±96a |
40±4b 51± 6b 80±3a |
91.1±0.2a 88.3±0.4b 85.0±0.6c |
9.5±1.8a 11.1±1.7a 14.2±5.7a |
31.0±4.3a 29.3±3.7a 34.7±4.5a |
8±5c 18±3b 28±4a |
0.2 0.4 0.3 |
| p | ns* | ns | * | ns | *** | *** | ** | *** | *** | - |
|
M W MxW |
*** * * |
*** *** ** |
*** * ** |
*** *** *** |
*** *** ns |
ns * *** |
** *** * |
*** *** *** |
** *** ns |
- - - |
*ns: no significant differences. **BD: Below detection. Values followed by different letters in the same column indicate significant differences according to Tukey’s test. Levels of significance: “ns.” p > 0.05. * p ≤ 0.05. ** p ≤ 0.01. *** p ≤ 0.001. Statistical differences between material (M), number of washings (W) and their interaction (MxW) are shown at the bottom of the table.
Disclaimer/Publisher’s Note: The statements, opinions and data contained in all publications are solely those of the individual author(s) and contributor(s) and not of MDPI and/or the editor(s). MDPI and/or the editor(s) disclaim responsibility for any injury to people or property resulting from any ideas, methods, instructions or products referred to in the content. |
© 2026 by the authors. Licensee MDPI, Basel, Switzerland. This article is an open access article distributed under the terms and conditions of the Creative Commons Attribution (CC BY) license (http://creativecommons.org/licenses/by/4.0/).
Copyright: This open access article is published under a Creative Commons CC BY 4.0 license, which permit the free download, distribution, and reuse, provided that the author and preprint are cited in any reuse.


