Submitted:
28 April 2026
Posted:
29 April 2026
You are already at the latest version
Abstract
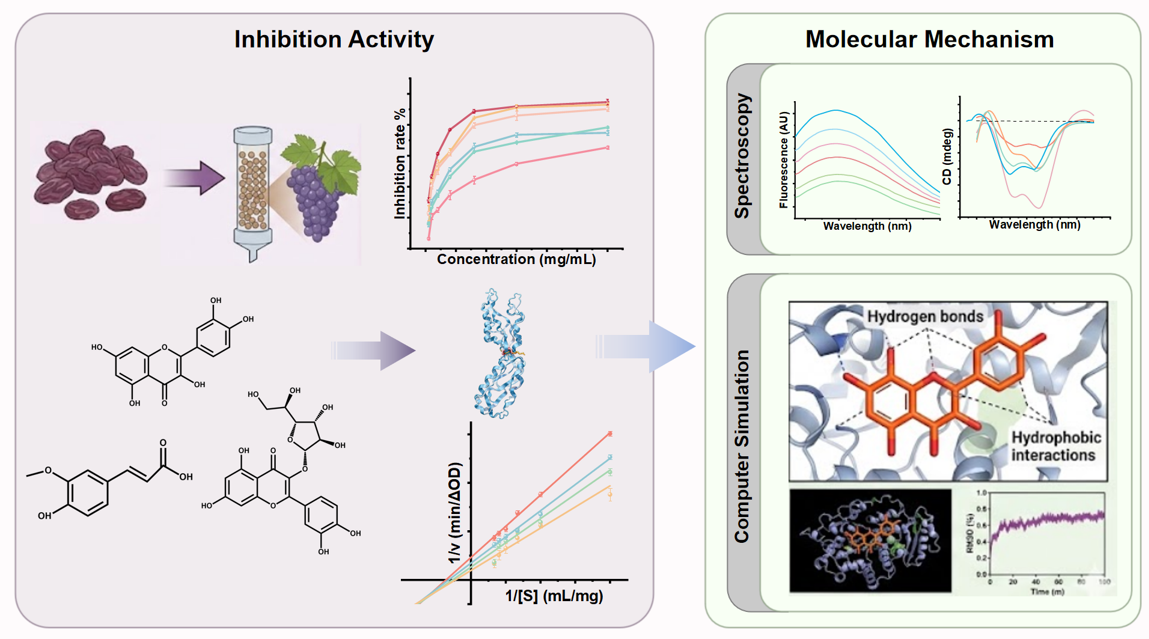
Natural α-amylase inhibitors from plant sources remain underexplored, whereas raisin polyphenols exhibit considerable inhibitory potential. In this study, raisin polyphenols were purified with D101 macroporous resin, and the adsorption process followed the pseudo-first-order kinetic model and the Langmuir isotherm model, indicating monolayer, exothermic adsorption. UHPLC-MS/MS analysis of the purified raisin polyphenols (PRP) identified 10 phenolic compounds, with ferulic acid, quercetin, and isoquercetin as the major constituents. The inhibitory mechanism of PRP against porcine pancreatic α-amylase (PPA) was systematically investigated using inhibition kinetics, fluorescence spectroscopy, circular dichroism (CD) spectroscopy, molecular docking, and molecular dynamics (MD) simulations. PRP exhibited strong inhibitory activity (IC50=3.15±0.16 mg/mL) and acted as a mixed-type inhibitor, whereas the major monomers showed distinct inhibition behaviors. Fluorescence and CD analyses indicated that PRP and its monomers altered the microenvironment around tryptophan and tyrosine residues, induced secondary-structure rearrangement in PPA, and reduced enzymatic activity. MD simulations confirmed the stability of the polyphenol-PPA complexes. Binding free-energy calculations showed that quercetin had the most favorable overall binding affinity and complex stability among the tested monomers, driven mainly by hydrogen bonding and hydrophobic interactions. These findings clarify the α-amylase inhibitory mechanisms of PRP and its key constituents and provide a theoretical basis for developing natural hypoglycemic functional ingredients and plant-derived α-amylase inhibitors.
Keywords:
raisin polyphenols
; ultrasound-assisted purification
; α-amylase inhibition
; inhibitory mechanism
; molecular docking
; molecular dynamics
1. Introduction
Against the backdrop of major public health challenges associated with global dietary shifts, diabetes and its complications have become the ninth leading cause of death worldwide, after only cancer and cardiovascular disease[1]. Extensive evidence shows that postprandial hyperglycemia is closely associated with type 2 diabetes. Accordingly, controlling postprandial blood glucose has become a central goal of diabetes management[2]. One effective approach is to intervene in carbohydrate digestion, because α-amylase is the key enzyme that hydrolyzes α-1,4-glycosidic bonds in starch and therefore plays an essential role in glucose release. Inhibition of α-amylase can delay starch digestion and subsequent glucose absorption[3,4]. However, although currently used synthetic inhibitors, such as acarbose, voglibose, and miglitol, are effective, they are often associated with gastrointestinal side effects and limited long-term tolerability[5,6]. Identifying safer and more effective alternatives has therefore become an important research priority. In this context, natural polyphenols have attracted considerable attention because of their broad bioactivity and favorable safety profile. Polyphenols have been extensively investigated as natural inhibitors owing to their remarkable biological activities and favorable safety profiles[7]. For example, Zhu et al.[7] explored the inhibitory mechanism of polyphenols from Flos Trollii against α-amylase, while Wu et al.[8] evaluated the α-amylase inhibitory effects of polyphenols derived from blueberry leaves.
Xinjiang is one of the major raisin-producing regions in China, and the “Green Pearl” raisins from Turpan have received national and international recognition[9]. However, studies on the molecular mechanisms by which raisin polyphenolic compounds inhibit α-amylase remain limited. An integrated strategy that combines multispectral techniques with computational modeling has been widely used to investigate α-amylase inhibition at the molecular level[10,11]. Experimentally, inhibitory activity assays and enzyme kinetics quantify inhibitory potency and identify inhibition modes[12], whereas multispectral methods, such as fluorescence spectroscopy and circular dichroism, provide direct evidence of ligand-enzyme interactions and conformational changes[13]. Computationally, molecular docking predicts preferred binding conformations and key intermolecular forces within the active site, whereas molecular dynamics simulations characterize complex stability, conformational flexibility, and binding free energy under near-physiological conditions[14]. By integrating experimental validation with computational prediction, the binding behavior, conformational changes, intermolecular interactions, and dynamic stability of α-amylase inhibitors can be systematically characterized, thereby establishing a more complete “structure-activity-mechanism” relationship[15,16]. For example, Liao et al.[17] used this strategy to clarify the inhibitory mechanism of Zn2+ on pancreatic and salivary α-amylases. Zn2+ binding induced distinct secondary-structure changes, including decreased α-helix content and increased β-sheet, β-turn, and random coil contents. Zn2+ coordinated with His217 and formed a cation-π interaction with Trp244, locking the dihedral angle C–CA–CB–CG in a planar conformation and rigidifying the active pocket. This restriction suppressed the opening-closing motion required for catalysis and thereby inhibited enzymatic activity. Similarly, Avwioroko et al.[18] characterized the interaction between citric acid and α-amylase and examined its inhibitory potential, antiglycation activity, and related mechanisms through spectroscopic, kinetic, and molecular docking analyses. Comparative studies that integrate multispectral techniques with molecular dynamics simulations remain limited, even though these approaches are important for systematically clarifying the inhibition mechanisms, binding behaviors, conformational changes, and dynamic stability of purified polyphenols and their key monomeric compounds. To date, the inhibitory mechanism of purified raisin polyphenols against α-amylase has not been reported, and the structure-activity-mechanism relationship of their characteristic phenolic monomers remains unclear at the molecular level.
Against this background, this study combined multispectral techniques with computational modeling to clarify how raisin polyphenols inhibit α-amylase. The binding interactions between macroporous resin-purified raisin polyphenols and α-amylase, as well as the accompanying conformational changes, were systematically examined. Through structure-activity analysis, the molecular basis for the inhibitory effects of raisin polyphenols as natural α-amylase inhibitors was elucidated, thereby revealing the microscopic basis of their potential role in blood glucose regulation. These findings provide a theoretical and methodological foundation for the development of functional foods designed to regulate blood glucose levels.
2. Materials and Methods
2.1. Chemicals and Materials
Raisins from Xinjiang, China, were purchased commercially. Analytical-grade reagents included anhydrous sodium carbonate, Folin-Ciocalteu reagent, ABTS, DPPH, ascorbic acid, and ethanol (Beijing InnoChem Science & Technology Co., Ltd., China); macroporous resins (XAD7HP, X-5, D101, AB-8, and NKA-II; Shanghai Yuanye Bio-Technology Co., Ltd., China); PPA (50 U/mg), acarbose, ferulic acid, quercetin, isoquercetin, and phosphate-buffered saline (PBS) (Shanghai Macklin Biochemical Co., Ltd., China); and 3,5-dinitrosalicylic acid (DNS; Shanghai Aladdin Biochemical Technology Co., Ltd., China). All reagents were of analytical grade and were used without further purification. Deionized water was used throughout.
2.2. Adsorption Kinetic Curves and Fitting Models
Adsorption kinetic curves and corresponding fitting models were obtained with slight modifications to a previously reported method[19]. Exactly 5 g of D101 macroporous resin was weighed and added to 25 mL of raisin polyphenol solution. Adsorption was carried out with shaking at 150 rpm and 25℃ for different contact times. At each time point, the concentration of the raisin polyphenol solution was determined, and the adsorption capacity of the macroporous resin for raisin polyphenols was calculated using Equation (1).
The adsorption kinetics of polyphenols on the resin were evaluated using the pseudo-first-order model (2) and the pseudo-second-order model (3).
2.3. Adsorption Isotherms and Fitting Models
Adsorption isotherms and corresponding fitting models were determined with slight modifications to a previously reported method[20]. Five grams of the selected D101 macroporous resin was mixed with 25 mL of aqueous raisin polyphenol solution at different concentrations in a conical flask and shaken for 12 h at 25, 35, and 45℃. The polyphenol content and equilibrium adsorption capacity of D101 resin were then determined, and the equilibrium data were fitted with the Langmuir equation (4) and the Freundlich equation (5).
where Qm is the theoretical maximum adsorption capacity (mg/g); KL is the equilibrium constant of the Langmuir model (L/mg); KF is the equilibrium constant of the Freundlich model [(mg/g)(L/mg)1/n]; and 1/n is an empirical constant that reflects the adsorption driving force of the adsorbent.
2.4. Dynamic Adsorption and Desorption Curves
Dynamic adsorption and desorption experiments were performed in a 20 × 300 mm chromatographic column packed with 20 g of pretreated macroporous resin by the wet method. A 250 mL aliquot of raisin polyphenol extract (3.5 mg/mL) was loaded onto the column at flow rates of 2.4, 3.6, and 4.8 BV/h, with 5 mL fractions collected for absorbance determination. The breakthrough point was defined as the eluate absorbance reaching one-tenth that of the feed solution, and the corresponding breakthrough curve was constructed.
At room temperature, the chromatographic column was rinsed with distilled water at 2.4 BV/h to remove water-soluble impurities from the macroporous resin. After the water eluate became colorless, the resin column was eluted with 90% ethanol at 2.4 BV/h. The ethanol eluate was collected every 2 mL, and its polyphenol concentration was determined by the Folin-phenol method. The elution profile was then monitored and an elution curve was constructed.
2.5. UHPLC-MS/MS Identification of Raisin Polyphenols
Phenolic compounds were identified using an UltiMate 3000 high-performance liquid chromatograph coupled to an Orbitrap Exploris 480 high-resolution mass spectrometer. Chromatographic conditions were as follows: ACQUITY UPLC HSS T3 column (2.1 × 100 mm, 1.8 μm); mobile phase A, deionized water containing 0.1% formic acid; and mobile phase B, acetonitrile containing 0.1% formic acid. The gradient elution program was as follows: mobile phase B 0-30% (0-10 min), mobile phase B 30-40% (10-25 min), mobile phase B 40-50% (25-30 min), mobile phase B 50-70% (30-40 min), mobile phase B 70-100% (40-45 min), mobile phase B 100% (45-60 min), mobile phase B 100-0% (60-60.5 min), and mobile phase B 0% (60.5-70 min). The injection volume was 1 μL, the flow rate was 0.4 mL/min, and the column temperature was 35℃.
Mass spectrometry was performed with an electrospray ionization (ESI) source in negative ion mode. The MS1 resolution was set to 70,000 and the MS2 resolution to 17,500. The capillary voltage was 3.2 kV, the nebulizer pressure was 1.5 bar, the dry gas temperature was 320℃, the carrier gas flow rate was 15 L/min, and the mass scan range was 100-1,200 m/z.
2.6. Assessment of Antioxidant Capacity of Raisin Polyphenols
The hydroxyl radical-scavenging activity was determined according to a previously reported method[21]. Briefly, 1.00 mL each of 9.0 mM FeSO4, 9.0 mM salicylic acid in ethanol, raisin polyphenol solution at varying concentrations, and 8.8 mM H2O2 was mixed to form the reaction system. The mixture was incubated at 37℃ for 30 min, cooled to 25℃, and the absorbance was measured immediately at 530 nm with a UV spectrophotometer.
The DPPH radical-scavenging activity was determined according to an established method[22]. Two milliliters of 0.1 mM DPPH ethanolic solution was mixed with 2.00 mL of raisin polyphenol solution at various concentrations. The mixture was incubated in the dark at 25℃ for 30 min, and the absorbance was measured at 519 nm.
The ABTS radical-scavenging activity was determined as previously described[23]. A working solution was freshly prepared by diluting the ABTS stock solution with distilled water to obtain an absorbance of approximately 0.70 at 750 nm. Then, 0.30 mL of raisin polyphenol solution at different concentrations was mixed with 3.00 mL of the ABTS working solution. After incubation in the dark at 25℃ for 6 min, the absorbance was recorded immediately at 734 nm.
2.7. Inhibitory Capacity of Raisin Polyphenols toward PPA
The α-amylase inhibition assay was performed with slight modifications based on the method of Xie et al.[24]. PPA was prepared as a 0.05 mg/mL solution in PBS buffer (25 mM, pH 6.8). Equal volumes of this PPA solution and each of the five polyphenol solutions (0.5-15 mg/mL) were mixed and incubated at 37℃ for 10 min. Subsequently, 100 μL of 10 mg/mL starch solution was added, and the mixture was incubated again at 37℃ for 10 min. Then, 150 μL of DNS reagent was added, and the reaction mixture was heated in a boiling water bath for 10 min. After cooling in an ice bath under light protection, the absorbance was measured at 540 nm. Acarbose served as the positive control. Four parallel groups were established: blank (A1), blank control (A2), sample (A3), and sample control (A4). The α-amylase inhibition rate was calculated using Equation (5):
2.8. Kinetic Analysis of α-Amylase Inhibition
Kinetic analysis of α-amylase inhibition by purified raisin polyphenols (PRP) and their major monomeric components was performed with minor modifications based on a published protocol[25]. The reaction system contained soluble starch at varying concentrations (2.5-15 mg/mL) as the substrate and polyphenols at 0-4 mg/mL as the inhibitor, with PPA (0.05 mg/mL) as the enzyme. The initial reaction rate was determined spectrophotometrically, and the inhibition kinetics were analyzed using Lineweaver-Burk plots, in which the reciprocal of the reaction rate (1/V) was plotted against the reciprocal of the substrate concentration (1/[S]). The kinetic parameters (Km and Vmax) were obtained from the following models:
where [I] represents the inhibitor concentration, and Ki denotes the inhibition constant.
2.9. Fluorescence Quenching Assay of α-Amylase
Fluorescence quenching assays were performed according to Huang et al.[26] and Liu et al.[27] by incubating PPA (1.0 mg/mL) with polyphenol solutions at varying concentrations (0.00625-0.4 mg/mL) at a 1:1 volume ratio for 15 min at 310 K. The fluorescence spectra were recorded with a Hitachi F-7100 spectrofluorometer (Japan) using an excitation wavelength of 280 nm and an emission range of 300-400 nm. Measurements were carried out in a 1 cm quartz cuvette, and the spectra were corrected by subtracting the corresponding buffer or ligand blanks. Quenching constants and binding-site numbers were determined using the Stern-Volmer and double-logarithmic equations:
where F0 and F represent the fluorescence intensities of PPA before and after polyphenol binding, respectively; Kq is the bimolecular quenching rate constant; and τ0 is the intrinsic fluorescence lifetime of the enzyme in the absence of quencher. For α-amylase, τ0=2.97×10⁻⁸ s (Prendergast et al., 1983); [Q] is the molar concentration of the polyphenolic ligand; Ka is the binding constant; and n represents the number of binding sites.
2.10. CD Analysis
CD spectroscopy was used to evaluate secondary-structure changes in PPA upon interaction with polyphenols. The measurements followed the procedure of Avinash Kumar et al. [28] with minor modifications. Far-UV CD spectra of PPA (2.5 μM), either alone or in the presence of 20 μM polyphenols (PRP, ferulic acid, isoquercetin, or quercetin), were recorded at 25℃ using an Applied Photophysics qCD spectrometer equipped with a 0.1 cm pathlength quartz cuvette. All spectra were baseline-corrected by subtracting the corresponding PBS and polyphenol solution spectra. Secondary-structure deconvolution was performed with the DichroWeb server (SELCON3 algorithm, reference set 7, 190-260 nm) to quantify changes in α-helix and β-sheet content.
2.11. Molecular Docking
Molecular docking simulations were conducted to predict the binding modes and interactions between polyphenols and PPA. The crystal structure of PPA (PDB ID: 1HX0) was prepared by removing water molecules, adding hydrogen atoms, and automatically defining the active site. Docking was performed using AutoDock 4.2.6[29] with grid boxes of 100 × 100 × 100 Å3 covering the entire protein. Ligand structures (ferulic acid, quercetin, and isoquercetin) were energy-minimized using the Amber14 force field before docking. The resulting binding conformations were visualized and analyzed with PyMOL 2.3.0 to evaluate optimal poses and key intermolecular interactions.
2.12. MD Simulations
MD simulations were performed to examine the stability and interaction dynamics of PPA-polyphenol complexes. All simulations were carried out using GROMACS 2022.1[30] with the Amber14sb force field. The protein-ligand complexes were solvated in an 8.0 nm3 cubic box containing TIP3P water molecules under periodic boundary conditions. After energy minimization, each system underwent a 100 ns production run in the NPT ensemble. The Leapfrog integrator was used with a 2 fs time step, LINCS constraints were applied to all bonds, and temperature and pressure were maintained with the V-rescale thermostat (298.15 K) and Parrinello-Rahman barostat, respectively. Trajectory analyses were performed using standard GROMACS utilities, and visualization was carried out with VMD [31].
3. Results and Discussion
3.1. Screening of Macroporous Resins and Process Optimization
To enrich polyphenols from raisin extract, five macroporous resins (XAD7HP, X-5, D101, NKA-II, and AB-8) were evaluated, and their physical properties are summarized in Supplementary Table S1. The adsorption and desorption performance of these resins is shown in Supplementary Figure S1(a). Among them, D101 resin exhibited the best overall performance, combining high adsorption capacity with efficient desorption, and was therefore selected for subsequent purification experiments. Figure 1(b) shows that the adsorption capacity increased as the polyphenol concentration in the solution increased. This trend indicates that a higher initial concentration enhanced the driving force for mass transfer and promoted adsorption. However, when the concentration exceeded 3.5 mg/mL, the adsorption ratio began to decline. As shown in Figure 1(c), the adsorption capacity of D101 resin first increased and then gradually decreased as the pH of the sample solution increased, reaching a maximum at pH 5. This trend may be attributed to stronger hydrogen-bonding interactions between polyphenols and the resin under mildly acidic conditions. At higher pH, deprotonation of phenolic hydroxyl groups can weaken these interactions and reduce adsorption. Figure S1(d) indicates that desorption efficiency increased markedly as the ethanol concentration in the eluent rose to 90%, but decreased beyond this point. At lower ethanol concentrations, the hydrogen-bonding interactions between polyphenols and the resin may not be disrupted sufficiently, whereas excessively high ethanol concentrations may co-elute other adsorbed impurities, such as proteins and pigments.
Based on these observations, a sample-solution pH of 5, a polyphenol concentration of 3.5 mg/mL, and an eluent containing 90% ethanol (v/v) were selected for subsequent experiments.
3.2. Adsorption Kinetics and Fitting Models
Adsorption kinetics describe the relationship between the adsorption rate and the time required to reach equilibrium and are therefore important for equipment selection and process design[32]. As shown in Figure 1(a), the adsorption capacity of D101 resin for polyphenols increased rapidly during the first 100 min, after which the rate of increase slowed between 100 and 260 min. The rapid initial uptake can be attributed to the large number of available adsorption sites on the resin surface. As these surface sites became progressively occupied, mass-transfer resistance increased and the adsorption rate gradually decreased until equilibrium was reached.
In general, adsorption proceeds through three stages: film diffusion (boundary-layer diffusion), intraparticle diffusion, and final adsorption at active sites. Kinetic models describing intraparticle diffusion are not suitable for the entire dynamic adsorption process, but they can help identify the rate-limiting step. To further characterize the adsorption behavior and clarify the mechanism, the pseudo-first-order and pseudo-second-order models were fitted, as shown in Figure 1(b-c). The pseudo-first-order model is commonly used to describe the initial stage of adsorption, whereas the pseudo-second-order model is often applied to the overall adsorption process. As shown in Table 1, the adsorption capacity predicted by the pseudo-first-order model (Qe = 2.57 mg/g) was closer to the experimental value (Qe = 2.60 mg/g) than that predicted by the pseudo-second-order model (Qe = 8.48 mg/g). In addition, the R² value of the pseudo-first-order model (0.993) was higher than that of the pseudo-second-order model (0.984). These results indicate that the pseudo-first-order model better describes the adsorption of raisin polyphenols on D101 resin.
3.3. Adsorption Isotherms
An adsorption isotherm describes the relationship between the equilibrium concentration of the adsorbate and the equilibrium adsorption capacity of the adsorbent once equilibrium has been reached. Analysis of adsorption isotherms helps clarify the interactions between adsorbents and adsorbates, optimize process parameters, and reduce energy consumption[33].
As shown in Figure 2(a), at a given concentration, the equilibrium adsorption capacity of the resin gradually decreased as temperature increased, indicating that elevated temperatures are unfavorable for adsorption. In addition, as the equilibrium concentration (Ce) increased, the amount of polyphenols adsorbed on D101 resin increased until saturation was approached.
As shown in Figure 2(b-c), the adsorption behavior of D101 resin at 25, 35, and 45℃ was analyzed using the Langmuir and Freundlich models. The Langmuir model assumes monolayer adsorption on a homogeneous solid surface, with equivalent adsorption sites and no interactions among adsorbed molecules. As shown in Table 2, the predicted maximum adsorption capacity (Qm) decreased as temperature increased, indicating that adsorption of polyphenols on D101 resin was exothermic. In addition, the KL value decreased with increasing temperature, suggesting that lower temperatures favored polyphenol adsorption on D101 resin. According to the Freundlich model, adsorption occurs on a heterogeneous surface, and each adsorption site has a different binding energy. In general, adsorption is favorable when 1/n lies between 0 and 1[20]. As shown in Table 2, the 1/n values obtained at the different temperatures were all within this range, indicating that polyphenols could be readily adsorbed on D101 resin. Overall, because the Langmuir model gave the highest R2 values, it was considered the best model for describing polyphenol adsorption on D101 resin at the tested temperatures, further indicating predominantly monolayer adsorption.
3.4. Dynamic Adsorption and Desorption Curves
As shown in Figure 3(a), no absorption peak was observed in the initial eluate, indicating that no raisin polyphenols were detected. As the loading volume increased, the absorbance gradually rose and the resin column progressively approached saturation. With further loading, raisin polyphenols began to break through and appeared in the eluate. This result indicates that an excessively high loading flow rate shortens the contact time between the polyphenol solution and the resin particles, decreases adsorption efficiency, and causes premature breakthrough. Conversely, an excessively low loading flow rate prolongs the adsorption process and reduces production efficiency. Considering both adsorption performance and practical throughput, a loading flow rate of 2 BV/h was selected as the optimal condition, at which the breakthrough volume of the extract reached 4.7 BV.
As shown in Figure 3(b), under dynamic conditions, the raisin polyphenols adsorbed on D101 macroporous resin were readily eluted. Approximately 40 mL of 90% ethanol was sufficient to elute most of the polyphenols from the D101 resin, yielding a relatively concentrated elution peak.
3.5. Identification of Polyphenols in Dried Apricots by UHPLC-QTOF-MS/MS
The aim of this study was to identify the major polyphenolic components in raisin polyphenols using the UHPLC-QTOF-MS/MS method. The composition of the raisin polyphenols was analysed by UHPLC-QTOF-MS/MS in negative ion mode, and the total ion chromatogram (TIC) is shown in Figure S4 As shown in Table S3, a total of 13 phenolic compounds were identified, comprising 3 flavonoids, 8 phenolic acids, 1 hydroxycinnamic acid and 1 phenolic aldehyde derivative. Among these, quercetin had the highest content, accounting for 26.16% of the total polyphenol content; followed by isoquercitrin and ferulic acid, accounting for 20.48% and 13.15% of the total polyphenol content, respectively. Based on the above content analysis, this study selected these three polyphenolic compounds with the highest proportions for subsequent experimental research.
3.6. Evaluation of the Antioxidant Capacity of Raisin Polyphenols
The antioxidant capacity of raisin polyphenols before and after purification was evaluated by measuring their scavenging activities against hydroxyl radicals (·OH), DPPH·, and ABTS·⁺ radicals[34]. As shown in Figure 4, the scavenging activities against all three radicals increased markedly in a concentration-dependent manner. After purification, the IC50 values decreased significantly, from 247.27 ± 11.06 to 212.80 ± 12.30 μg/mL for ·OH, from 6.07 ± 0.09 to 3.70 ± 0.08 μg/mL for DPPH·, and from 47.05 ± 0.38 to 22.68 ± 0.16 μg/mL for ABTS·⁺. These results demonstrate that purification substantially enhanced the antioxidant activity of raisin polyphenols.
3.7. Inhibitory Activity of Raisin Polyphenols against α-Amylase
α-Amylase is a key digestive enzyme that hydrolyzes starch into oligosaccharides, which are subsequently converted to glucose and rapidly absorbed[35]. By slowing starch digestion and glucose release, α-amylase inhibitors can help attenuate postprandial hyperglycemia[36]. Therefore, inhibition of α-amylase is widely regarded as an effective strategy for diabetes management. As shown in Figure 5 and Table 3, concentration-dependent inhibition of α-amylase was observed for crude and purified raisin polyphenols as well as the three representative monomeric compounds. Among them, PRP exhibited the strongest inhibitory activity, with an IC50 of 3.15 ± 0.16 mg/mL, followed by quercetin, ferulic acid, isoquercetin, and crude polyphenols, with IC50 values of 4.44 ± 0.21, 6.02 ± 0.21, 11.20 ± 0.56, and 24.55 ± 0.23 mg/mL, respectively. The markedly stronger inhibition by PRP than by crude polyphenols suggests that purification enriched the active components and reduced interference from impurities such as sugars and proteins. The stronger activity of PRP relative to any single monomer may also reflect synergistic interactions among multiple polyphenols. In addition, quercetin inhibited PPA more strongly than ferulic acid and isoquercetin, which may be related to its greater number of phenolic hydroxyl groups and stronger interactions with the enzyme.
3.8. Kinetic Analysis of Enzyme Inhibition
The inhibition types and kinetic parameters of polyphenols toward α-amylase were determined using Lineweaver-Burk double-reciprocal plots to further clarify the inhibitory mechanism. As shown in Figure 6(a), the PRP lines intersected in the third quadrant, and both Vmax and Km decreased as PRP concentration increased, indicating mixed-type inhibition. Similarly, the Lineweaver-Burk plot for ferulic acid (Figure 6b) showed intersecting lines in the third quadrant, with reduced Vmax and increased Km, also suggesting mixed-type inhibition. These results indicate that both PRP and ferulic acid can bind to the free enzyme (E) and the enzyme-substrate complex (ES), forming inactive EI or ESI complexes. For quercetin (Figure 6c), Vmax remained essentially unchanged whereas Km increased, indicating a predominantly competitive inhibition pattern. Isoquercetin (Figure 6d) showed lines intersecting on the y-axis, with increased Km and constant Vmax, which is also characteristic of competitive inhibition, indicating that isoquercetin binds mainly to the free enzyme (E) to form an EI complex rather than interacting appreciably with ES. Overall, PRP exhibited mixed inhibition, which may be related to the mixed-type contribution of ferulic acid and the competitive contribution of quercetin and isoquercetin[7,37,38,39].
3.9. Mechanisms of Fluorescence Quenching
Binding of small molecules can alter the microenvironment of protein chromophores, and the resulting fluorescence quenching phenomenon is widely used to evaluate polyphenol-protein interactions[40,41]. Aromatic amino acid residues, especially tyrosine and tryptophan, are the major contributors to the intrinsic fluorescence of α-amylase[42]. As shown in Figure 7(a-d), PPA exhibited a strong fluorescence emission peak at 335 nm, and the addition of polyphenols caused a concentration-dependent decrease in fluorescence intensity, consistent with previous reports. After addition of PRP, quercetin, or isoquercetin[40], the emission maximum shifted to longer wavelengths, from 335 nm to 340, 344, and 354 nm, respectively. This red shift indicates that these ligands altered the microenvironment around aromatic residues, increased local polarity, and decreased hydrophobicity. In contrast, after addition of ferulic acid, the fluorescence peak shifted slightly to 333 nm, suggesting a more hydrophobic local environment around Trp residues, possibly because hydrogen bonding or hydrophobic interactions promoted burial of hydrophobic groups within the protein. Overall, the fluorescence changes indicate that polyphenol binding induced conformational rearrangement in PPA. Among the tested monomers, quercetin caused the largest decrease in PPA fluorescence intensity, which is consistent with its strong in vitro inhibitory activity.
Fluorescence quenching mechanisms are generally classified as static quenching, which involves formation of a quencher-fluorophore complex; dynamic quenching, which arises from collisions between the quencher and the fluorophore; or a combination of both[43]. Static quenching indicates that polyphenols form ground-state, nonfluorescent complexes with PPA, reflecting stable binding[44]. To further clarify the mechanism of polyphenol-induced PPA fluorescence quenching, the fluorescence data were analyzed using the Stern-Volmer equation. As shown in Figure 7(e), the F0/F curves versus [Q] for PRP and the three monomeric phenols showed good linearity, indicating a single dominant quenching mechanism. The quenching constants (kq) for PRP, ferulic acid, isoquercetin, and quercetin were 5.89, 4.62, 3.27, and 2.08 (×1012 L mol-1·s-1), respectively, all far above the maximum diffusion-controlled collisional quenching constant (2×10¹⁰ L mol-1·s-1). Therefore, the quenching of PPA by all four polyphenols can be assigned to a static mechanism. The binding constants (Ka) were 21.99, 18.04, 17.50, and 16.95 (mL mg-1), respectively. These data indicate that PRP showed the highest apparent binding affinity overall, while ferulic acid exhibited the highest apparent Ka among the three monomers. In addition, the n values for all four polyphenols were close to 1, indicating one major binding site on PPA[45].
3.10. CD Analysis
Conformational changes in the secondary structure of PPA were investigated by circular dichroism spectroscopy, as shown in Figure 8 and Table 4. PPA exhibited two characteristic negative peaks at 208 and 226 nm, which are typical of an α-helix structure and correspond to the π-π* and n-π* transitions, respectively[46]. The addition of polyphenols caused clear changes in these signals, indicating alterations in the secondary structure of PPA. As shown in Table 4, after binding with quercetin, isoquercetin, ferulic acid, and PRP, the α-helix content changed from 30.7% to 32.5%, 18.0%, 35.7%, and 25.8%, respectively. The β-sheet content changed from 20.5% to 14.8%, 31.2%, 15.9%, and 28.4%, respectively, whereas the β-turn content changed from 17.3% to 25.3%, 19.0%, 16.8%, and 18.5%, respectively. The random coil content also changed from 31.5% to 27.4%, 31.8%, 31.6%, and 27.3%, respectively. These results indicate that polyphenol binding induced a clear rearrangement of PPA secondary structure, which could disrupt the structural environment required for efficient substrate binding and catalysis.
3.11. Molecular Docking Simulation
To investigate the binding sites, affinities, and interaction types of different polyphenols with PPA, binding-mode analyses were performed for the simulated conformations of the PPA-ferulic acid, PPA-quercetin, and PPA-isoquercetin systems, as shown in Figure 9. As shown in Figure 9(a-b), ferulic acid was stably accommodated in a PPA cavity formed by His299, Trp58, Leu165, Tyr62, and Trp59, where it established both hydrogen-bonding and hydrophobic interactions. Specifically, ferulic acid formed one hydrogen bond with His299 and hydrophobic interactions with several surrounding residues, which enhanced ligand-protein binding. As shown in Figure 9(c-d), quercetin was stably bound within a cavity composed of His305, Asp356, Trp59, Gln63, Leu165, Tyr62, Asp300, His299, Asp197, and Arg195, engaging in both hydrogen bonds and hydrophobic interactions. As shown in Figure 9(e-f), isoquercetin occupied a cavity comprising Gly306, Tyr151, Leu165, Ile148, His201, Leu162, Val163, Val157, Asp197, Ala198, His305, and Asp300, also through hydrogen-bonding and hydrophobic interactions. Isoquercetin formed four hydrogen bonds with Asp197, Ala198, His305, and Asp300, along with hydrophobic contacts with eight surrounding residues, which enhanced its binding to PPA. Notably, among the three monomers, quercetin showed the richest network of hydrogen-bonding and hydrophobic interactions, indicating a more compact binding mode with PPA. This result is consistent with the in vitro inhibition assays.
3.12. MD Simulations
Figure 10(a) illustrates the time-dependent evolution of RMSD values for the protein systems during the simulation[47]. The RMSD values of the PPA-ferulic acid, PPA-quercetin, and PPA-isoquercetin complexes remained low and gradually stabilized over the 100 ns trajectory, with average values of 0.119 ± 0.008, 0.133 ± 0.010, and 0.159 ± 0.021 nm, respectively. These small fluctuations indicate that all three systems maintained good structural stability during the simulation[43]. As shown in Figure 10(b), the Rg values displayed only slight fluctuations, with average values of 2.309 ± 0.006, 2.321 ± 0.006, and 2.332 ± 0.007 nm for the PPA-ferulic acid, PPA-quercetin, and PPA-isoquercetin complexes, respectively. The minimal variation in Rg indicates that the overall compactness of the PPA-polyphenol complexes was maintained throughout the simulation.
As shown in Figure 10(c), the SASA values of the systems remained stable throughout the simulation, with average values of 191.323 ± 2.816, 191.379 ± 2.388, and 195.837 ± 2.230 nm2 for the PPA-ferulic acid, PPA-quercetin, and PPA-isoquercetin complexes, respectively. The stability of SASA indicates that PPA reached a relatively steady conformational state after ligand binding and that polyphenol binding did not induce large overall structural fluctuations.
Root mean square fluctuation (RMSF) reflects the flexibility of amino acid residues in a protein. The RMSF profiles of all residues in the three systems are shown in Figure 10(d). The average RMSF values for the PPA-ferulic acid and PPA-isoquercetin systems were generally lower than that for the PPA-quercetin system, indicating that these two ligands more strongly restricted local residue fluctuations and contributed to local structural stabilization of PPA.
As shown in Figure 10(e), the average numbers of hydrogen bonds formed between polyphenols and PPA throughout the simulation were 0.488, 1.895, and 4.416, respectively. These persistent hydrogen-bonding interactions indicate that the ligands maintained stable contacts with PPA throughout the trajectory.
Furthermore, the time-dependent variation in the distance between the centers of mass (DCOM) of the protein and the ligand was calculated to evaluate relative ligand localization and microscopic motion. As shown in Figure 10(f), the average DCOM values ± standard deviations for the PPA-ferulic acid, PPA-quercetin, and PPA-isoquercetin systems were 2.687 ± 0.023, 2.629 ± 0.090, and 1.654 ± 0.039 nm, respectively. Overall, the isoquercetin system showed the smallest average distance, indicating that its center of mass remained closest to that of the protein. The ferulic acid system showed the smallest fluctuation, indicating the most stable positional localization during the simulation. The quercetin system had an intermediate average distance but the largest standard deviation, implying greater translational or conformational mobility.
The free energy landscape (FEL) characterizes the free-energy changes of PPA during the simulation. The FEL surfaces of the three complex systems are shown in Figure 10(g-i), where blue indicates the energy minima. Comparison of the three FEL surfaces showed nearly single and smooth energy clusters, without multiple rough minima or large regions of scattered unstable states, indicating that the conformational and energetic states of the complexes were relatively stable.
The binding free energies between PPA and polyphenols were calculated using the MM/PBSA method over the 80-100 ns interval, during which the RMSD values were relatively stable. The results are summarized in Table S3. The total binding free energies (ΔGbind) for the three complexes were -49.927, -61.586, and -47.729 kJ/mol, respectively. Among them, the PPA-quercetin system exhibited the most favorable overall binding free energy, consistent with the molecular docking results and the in vitro inhibition assays. Further energy-decomposition analysis showed that the non-polar interaction energies (ΔGvdw + ΔGnp) were -123.021 kJ/mol for ferulic acid, -60.288 kJ/mol for quercetin, and -124.064 kJ/mol for isoquercetin, indicating that non-polar interactions favored ligand binding in all three systems. In contrast, the electrostatic interaction energies (ΔGele + ΔGPB) were 68.998, 32.854, and 76.335 kJ/mol, respectively, all positive, indicating unfavorable net electrostatic contributions to binding in these systems.
Overall, non-polar interactions, mainly van der Waals forces and non-polar solvation free energy, were the primary driving forces for the binding of ferulic acid, quercetin, and isoquercetin to PPA. However, total binding stability depended on the balance among all energy terms. Although ferulic acid and isoquercetin showed larger favorable non-polar contributions, quercetin exhibited the most favorable overall ΔGbind, indicating the strongest net binding affinity. This conclusion is consistent with the docking results and the in vitro inhibition data.
4. Conclusions
This study demonstrates that PRP are promising PPA inhibitors that can effectively suppress enzymatic activity. Using multispectral techniques combined with computational simulations, we systematically investigated the inhibitory mechanism of PRP toward PPA. The results indicate that PRP acts as a mixed-type inhibitor, whereas its major monomeric components display distinct inhibition behaviors: ferulic acid shows mixed-type inhibition, while quercetin and isoquercetin show predominantly competitive inhibition. Spectral analyses showed that these polyphenols bound to PPA, altered the microenvironment of aromatic residues, and induced secondary-structure rearrangement, thereby reducing catalytic activity. Molecular docking and molecular dynamics simulations further confirmed that hydrogen bonding and hydrophobic interactions dominate the stable binding of polyphenols to PPA, and MM/PBSA analysis indicated that quercetin had the most favorable overall binding free energy among the tested monomers. In addition, D101 macroporous resin enabled efficient enrichment of raisin polyphenols and markedly improved their bioactivity. These findings clarify the structure-activity relationship of raisin polyphenols as natural α-amylase inhibitors, enrich the theoretical basis for plant polyphenols in regulating carbohydrate metabolism, and support the development of raisin-derived hypoglycemic functional ingredients.
Author Contributions
Cheng Ma: Writing – original draft, Methodology, Investigation, Formal analysis, Data curation. Zhongyang Li: Investigation, Formal analysis. Jiangli Lin: Writing-review & editing, Conceptualization, Funding acquisition. Bin Wu: Preprocess samples and verify the manuscript format. Shuailian Zhao: Methodology, Conceptualization. Xiaojing Yao: Formal analysis, Conceptualization. Xiuling Zhu: Investigation, Data curation. Writing – review & editing, Resources, Xiangyun Wei: Project administration, Investigation. Shishan Zhou: Supervision, Methodology, Investigation.
Funding
This work was supported by the Science and Technology Department of Xinjiang Uygur Autonomous Region (2022B03006-1).
Institutional Review Board Statement
Not applicable.
Informed Consent Statement
Not applicable.
Data Availability Statement
The original contributions presented in this study are included in the article/supplementary material. Further inquiries can be directed to the corresponding author(s).
Conflicts of Interest
The authors confirm that they have no conflicts of interest with respect to the work described in this manuscript.
References
- Ogle, G. D.; Wang, F.; Haynes, A.; Gregory, G. A.; King, T. W.; Deng, K.; Dabelea, D.; James, S.; Jenkins, A. J.; Li, X. Global type 1 diabetes prevalence, incidence, and mortality estimates 2025: Results from the International diabetes Federation Atlas, and the T1D Index Version 3.0. Diabetes Res. Clin. Pract. 2025(225), 112277. [CrossRef]
- Prama, T. T.; Rahman, M. J.; Zaman, M.; Sarker, F.; Mamun, K. A. DiaBD: A diabetes dataset for enhanced risk analysis and research in Bangladesh. Data Brief. 2025, 61, 111746. [Google Scholar] [CrossRef]
- Im, E.-K. Utility of casual postprandial glucose levels in type 2 diabetes management. Diabetes Care 2004, 27, 334–339. [Google Scholar] [CrossRef]
- Kirkman, M. S.; Shankar, R. R.; Shankar, S.; Shen, C.; Brizendine, E.; Baron, A.; McGill, J. Treating postprandial hyperglycemia does not appear to delay progression of early type 2 diabetes: the Early Diabetes Intervention Program. Diabetes Care 2006, 29((9)), 2095–2101. [Google Scholar] [CrossRef]
- Dong, Y.; Sui, L.; Yang, F.; Ren, X.; Xing, Y.; Xiu, Z. Reducing the intestinal side effects of acarbose by baicalein through the regulation of gut microbiota: An in vitro study. Food Chem. 2022, 394, 133561. [Google Scholar] [CrossRef]
- Mabate, B.; Daub, C. D.; Malgas, S.; Edkins, A. L.; Pletschke, B. I. A combination approach in inhibiting type 2 diabetes-related enzymes using Ecklonia radiata fucoidan and acarbose. Pharmaceutics 2021, 13((11)), 1979. [Google Scholar] [CrossRef]
- Sun, L.; Wang, Y.; Miao, M. Inhibition of α-amylase by polyphenolic compounds: Substrate digestion, binding interactions and nutritional intervention. Trends Food Sci. Technol. 2020, 104, 190–207. [Google Scholar] [CrossRef]
- Wu, H.; Liu, X.; Xie, S.; Zhou, J.; Corradini, M. G.; Pan, Y.; Cui, X. Inhibitory effects of phenolic compounds from blueberry leaf on α-amylase and α-glucosidase: kinetics, mode of action, and molecular interactions. J. Sci. Food Agric. 2025, 105((8)), 4524–4536. [Google Scholar] [CrossRef] [PubMed]
- Chen, Y.; Lian, W.; Li, K.; Han, C.; Liu, W.; Japar, A.; Lei, J. Quality Evolution of Turpan Dry Red Wine During Aging Under Controlled Micro-Oxygenation. J. Food Sci. 2025, 90((8)), e70468. [Google Scholar] [CrossRef]
- Zhang, B.; Deng, Y.; Song, Y.; Yang, F.; He, Y.; Guo, T. Inhibition effects of xanthohumol on α-amylase and α-glucosidase: Kinetics, multi-spectral and molecular docking. Int. J. Biol. Macromol. 2025, 311, 143676. [Google Scholar] [CrossRef] [PubMed]
- Gupta, J.; Das, K.; Rajamani, P. Size-responsive differential modulation in α-amylase by MPA-CdSe QDs: multispectroscopy and molecular docking study. J. Nanoparticle Res. 2021, 23((8)), 190. [Google Scholar] [CrossRef]
- Liu, Q.-Z.; Zhang, H.; Dai, H.-Q.; Zhao, P.; Mao, Y.-F.; Chen, K.-X.; Chen, Z.-X. Inhibition of starch digestion: The role of hydrophobic domain of both α-amylase and substrates. Food Chem. 2021, 341, 128211. [Google Scholar] [CrossRef]
- Shen, H.; Wang, J.; Ao, J.; Hou, Y.; Xi, M.; Cai, Y.; Li, M.; Luo, A. Structure-activity relationships and the underlying mechanism of α-amylase inhibition by hyperoside and quercetin: Multi-spectroscopy and molecular docking analyses. Spectrochim. Acta Part A Mol. Biomol. Spectrosc. 2023, 285, 121797. [Google Scholar] [CrossRef]
- Oyewusi, H. A.; Wu, Y.-S.; Safi, S. Z.; Wahab, R. A.; Hatta, M. H. M.; Batumalaie, K. Molecular dynamics simulations reveal the inhibitory mechanism of Withanolide A against α-glucosidase and α-amylase. J. Biomol. Struct. Dyn. 2023, 41((13)), 6203–6218. [Google Scholar] [CrossRef]
- Jiang, C.; Wang, L.; Shao, J.; Jing, H.; Ye, X.; Jiang, C.; Wang, H.; Ma, C. Screening and identifying of α-amylase inhibitors from medicine food homology plants: Insights from computational analysis and experimental studies. J. Food Biochem. 2020, 44((12)), e13536. [Google Scholar] [CrossRef]
- Zhu, X.; Yan, K.; Ye, X.; Xiang, X.; Ru, Y.; Niu, Y.; Liu, Y.; Xi, J.; Liu, K. Polyphenols from Flos Trollii inhibit α-amylase and α-glucosidase: Kinetic analysis and mechanistic insights. LWT 2025, 225, 117940. [Google Scholar] [CrossRef]
- Liao, S.-M.; Shen, N.-K.; Liang, G.; Lu, B.; Lu, Z.-L.; Peng, L.-X.; Zhou, F.; Du, L.-Q.; Wei, Y.-T.; Zhou, G.-P. Inhibition of α-amylase activity by Zn2+: Insights from spectroscopy and molecular dynamics simulations. Med. Chem. 2019, 15((5)), 510–520. [Google Scholar] [CrossRef] [PubMed]
- Avwioroko, O. J.; Anigboro, A. A.; Atanu, F. O.; Otuechere, C. A.; Alfred, M. O.; Abugo, J. N.; Omorogie, M. O. Investigation of the binding interaction of α-amylase with Chrysophyllum albidum seed extract and its silver nanoparticles: a multi-spectroscopic approach. Chem. Data Collect. 2020, 29, 100517. [Google Scholar] [CrossRef]
- Lu, Y.; Liu, Y.; Chang, X.; Bai, L.; Bai, Y.; Qi, H. Efficient purification of polyphenols from Ascophyllum nodosum using Macroporous Resin: Adsorption Mechanism, Kinetics, and enhanced bioactivity. Sep. Purif. Technol. 2025, 366, 132704. [Google Scholar] [CrossRef]
- Yang, Y.; Zhu, Q.; Yan, X.; Zhou, Z.; Zhao, J.; Xia, J.; Gao, X.; Ye, M.; Deng, L.; Zeng, Z. Enrichment of polyphenols from Cinnamomum camphora seed kernel by macroporous adsorption resins and evaluation of its antioxidant and enzyme inhibitory activities. Ind. Crop. Prod. 2024, 222, 119486. [Google Scholar] [CrossRef]
- Guo, L.; Tan, D.-C.; Bao, R.-J.; Sun, Q.; Xiao, K.-M.; Xu, Y.; Wang, J.-M.; Hua, Y. Purification and antioxidant activities of polyphenols from Boletus edulis Bull.: Fr. J. Food Meas. Charact. 2020, 14((2)), 649–657. [Google Scholar] [CrossRef]
- Abramovič, H.; Grobin, B.; Poklar Ulrih, N.; Cigić, B. Relevance and standardization of in vitro antioxidant assays: ABTS, DPPH, and Folin–Ciocalteu. J. Chem. 2018, 2018((1)), 4608405. [Google Scholar] [CrossRef]
- Sahin, S.; Isik, E.; Aybastier, O.; Demir, C. Orthogonal signal correction-based prediction of total antioxidant activity using partial least squares regression from chromatograms. J. Chemom. 2012, 26((7)), 390–399. [Google Scholar] [CrossRef]
- Xie, J.; Liu, S.; Dong, R.; Xie, J.; Chen, Y.; Peng, G.; Liao, W.; Xue, P.; Feng, L.; Yu, Q. Bound polyphenols from insoluble dietary fiber of defatted rice bran by solid-state fermentation with trichoderma viride: profile, activity, and release mechanism. J. Agric. Food Chem. 2021, 69((17)), 5026–5039. [Google Scholar] [CrossRef]
- Liu, S.; Yu, J.; Guo, S.; Fang, H.; Chang, X. Inhibition of pancreatic α-amylase by Lonicera caerulea berry polyphenols in vitro and their potential as hyperglycemic agents. LWT 2020, 126, 109288. [Google Scholar] [CrossRef]
- Huang, Y.; Condict, L.; Richardson, S. J.; Brennan, C. S.; Kasapis, S. Exploring the inhibitory mechanism of p-coumaric acid on α-amylase via multi-spectroscopic analysis, enzymatic inhibition assay and molecular docking. Food Hydrocoll. 2023, 139, 108524. [Google Scholar] [CrossRef]
- Liu, D.; Cao, X.; Kong, Y.; Mu, T.; Liu, J. Inhibitory mechanism of sinensetin on α-glucosidase and non-enzymatic glycation: Insights from spectroscopy and molecular docking analyses. Int. J. Biol. Macromol. 2021, 166, 259–267. [Google Scholar] [CrossRef] [PubMed]
- Kumar, A.; Kumar Singh, V.; Kayastha, A. M. Studies on α-amylase inhibition by acarbose and quercetin using fluorescence, circular dichroism, docking, and dynamics simulations. Spectrochim. Acta Part A Mol. Biomol. Spectrosc. 2024, 314, 124160. [Google Scholar] [CrossRef]
- Eberhardt, J.; Santos-Martins, D.; Tillack, A. F.; Forli, S. AutoDock Vina 1.2.0: New Docking Methods, Expanded Force Field, and Python Bindings. J. Chem. Inf. Model. 2021, 61((8)), 3891–3898. [Google Scholar] [CrossRef]
- Van Der Spoel, D.; Lindahl, E.; Hess, B.; Groenhof, G.; Mark, A. E.; Berendsen, H. J. C. GROMACS: Fast, flexible, and free. J. Comput. Chem. 2005, 26((16)), 1701–1718. [Google Scholar] [CrossRef]
- Cava, C.; Bertoli, G.; Castiglioni, I. Potential Drugs Against COVID-19 Revealed By Gene Expression profile, Molecular Docking and Molecular Dynamic Simulation. Future Virol. 2021, 16((8)), 527–542. [Google Scholar] [CrossRef]
- Shen, D.; Labreche, F.; Wu, C.; Fan, G.; Li, T.; Dou, J.; Zhu, J. Ultrasound-assisted adsorption/desorption of jujube peel flavonoids using macroporous resins. Food Chem. 2022, 368, 130800. [Google Scholar] [CrossRef]
- Gao, F.; Muhammad, T.; Bakri, M.; Yang, W.-W.; Pataer, P.; Yang, X.-X. In-situ measurement of the adsorption thermodynamics of rutin on macroporous adsorption resins by fiber-optic sensing. Instrum. Sci. Technol. 2019, 47((2)), 170–184. [Google Scholar] [CrossRef]
- Huang, Q.; Wen, T.; Fang, T.; Lao, H.; Zhou, X.; Wei, T.; Luo, Y.; Xie, C.; Huang, Z.; Li, K. A comparative evaluation of the composition and antioxidant activity of free and bound polyphenols in sugarcane tips. Food Chem. 2025, 463, 141510. [Google Scholar] [CrossRef]
- Chi, C.; Shi, M.; Zhao, Y.; Chen, B.; He, Y.; Wang, M. Dietary compounds slow starch enzymatic digestion: A review. Front. Nutr. 2022, 9–2022. [Google Scholar] [CrossRef]
- Sun, L.; Warren, F. J.; Gidley, M. J. Natural products for glycaemic control: Polyphenols as inhibitors of alpha-amylase. Trends Food Sci. Technol. 2019, 91, 262–273. [Google Scholar] [CrossRef]
- Zheng, Y.; Yang, W.; Sun, W.; Chen, S.; Liu, D.; Kong, X.; Tian, J.; Ye, X. Inhibition of porcine pancreatic α-amylase activity by chlorogenic acid. J. Funct. Foods 2020, 64, 103587. [Google Scholar] [CrossRef]
- Man, Z.; Feng, Y.; Xiao, J.; Yang, H.; Wu, X. Structural changes and molecular mechanism study on the inhibitory activity of epigallocatechin against α-glucosidase and α-amylase. Front. Nutr. 2022. [Google Scholar] [CrossRef]
- Huang, M.; Xiao, Q.; Li, Y.; Ahmad, M.; Tang, J.; Liao, Q.; Tan, C. Inhibition of α-amylase activity by quercetin via multi-spectroscopic and molecular docking approaches. Food Biosci. 2024, 61, 104951. [Google Scholar] [CrossRef]
- Sun, N.; Xie, J.; Zheng, B.; Xie, J.; Chen, Y.; Hu, X.; Yu, Q. The inhibition mechanism of bound polyphenols extracted from mung bean coat dietary fiber on porcine pancreatic α-amylase: kinetic, spectroscopic, differential scanning calorimetric and molecular docking. Food Chem. 2024, 436, 137749. [Google Scholar] [CrossRef] [PubMed]
- Wang, Y.; An, J.; Yao, S.; Zhang, C.; Zhou, Y.; Li, L.; Li, H. Effect of Sugarcane Polyphenol Extract on α-Amylase Inhibition and Mechanism Exploration. Foods 2025, Vol. 14. [Google Scholar] [CrossRef] [PubMed]
- Lai, M.; Chen, H.; Liu, X.; Li, F.; Liu, F.; Li, Y.; Yan, J.; Lin, L. Exploration of phenolic profile from mangosteen (Garcinia mangostana L.) pericarp and their contribution to inhibitory effects on α-amylase and α-glucosidase. LWT 2024, 203, 116350. [Google Scholar] [CrossRef]
- Liu, S.; Meng, F.; Guo, S.; Yuan, M.; Wang, H.; Chang, X. Inhibition of α-amylase digestion by a Lonicera caerulea berry polyphenol starch complex revealed via multi-spectroscopic and molecular dynamics analyses. Int. J. Biol. Macromol. 2024, 260, 129573. [Google Scholar] [CrossRef] [PubMed]
- Le, D. T.; Kumar, G.; Williamson, G.; Devkota, L.; Dhital, S. Molecular interactions between polyphenols and porcine α-amylase: An inhibition study on starch granules probed by kinetic, spectroscopic, calorimetric and in silico techniques. Food Hydrocoll. 2024, 151, 109821. [Google Scholar] [CrossRef]
- Yu, M.; Zhu, S.; Huang, D.; Tao, X.; Li, Y. Inhibition of starch digestion by phenolic acids with a cinnamic acid backbone: Structural requirements for the inhibition of α-amylase and α-glucosidase. Food Chem. 2024, 435, 137499. [Google Scholar] [CrossRef]
- Liu, T.; Teng, X.; Tian, Y.; Yao, Y.; Wang, Y.; Wang, W. Chemical composition analysis and antioxidant activity evaluation of leaf, calyx,and fruit of Physalis peruviana L. Food Ferment. Ind. 2024, 50((20)), 243–251. [Google Scholar]
- Wu, X.; Xu, L.-Y.; Li, E.-M.; Dong, G. Application of molecular dynamics simulation in biomedicine. Chem. Biol. Drug. Des. 2022, 99((5)), 789–800. [Google Scholar] [CrossRef] [PubMed]
Figure 1.
Adsorption kinetics curve (a) and linear fitting based on the pseudo-first-order (b) and pseudo-second-order (c) models for polyphenols on D101 resin at 25 ℃.
Figure 1.
Adsorption kinetics curve (a) and linear fitting based on the pseudo-first-order (b) and pseudo-second-order (c) models for polyphenols on D101 resin at 25 ℃.

Figure 2.
Adsorption isotherms (a) and linear fitting based on the Langmuir (b) and Freundlich (c) models for polyphenols on D101 resin at 25, 35, and 45℃.
Figure 2.
Adsorption isotherms (a) and linear fitting based on the Langmuir (b) and Freundlich (c) models for polyphenols on D101 resin at 25, 35, and 45℃.

Figure 3.
Adsorption Breakthrough and Dynamic Desorption Tests. (a) Adsorption breakthrough curve of polyphenols from raisins on D101 macroporous resin; (b) Dynamic desorption curve of polyphenols on D101 macroporous resin.
Figure 3.
Adsorption Breakthrough and Dynamic Desorption Tests. (a) Adsorption breakthrough curve of polyphenols from raisins on D101 macroporous resin; (b) Dynamic desorption curve of polyphenols on D101 macroporous resin.

Figure 4.
Evaluation of the antioxidant activity of polyphenol solutions before and after purification. (a) ·OH radical-scavenging ability of the polyphenol solutions before and after purification.(b) DPPH· radical-scavenging ability of polyphenol solutions before and after purification. (c)ABTS·+ radical-scavenging ability of polyphenol solutions before and after purification.

Figure 5.
The inhibitory effect of polyphenols on enzymes.

Figure 6.
Lineweaver-Burk plots for inhibition of PPA by PRP (a), ferulic acid (b), quercetin (c) and isoquercetin (d).3.8 Fluorescence Quenching Mechanism.
Figure 6.
Lineweaver-Burk plots for inhibition of PPA by PRP (a), ferulic acid (b), quercetin (c) and isoquercetin (d).3.8 Fluorescence Quenching Mechanism.

Figure 7.
(a) Fluorescence spectra of the interactions between PRP, (b) ferulic acid, (c) quercetin, and (d) isoquercetin and α-amylase. (e) Stern-Volmer plots showing the quenching effects of PPA on each polyphenol. plots of log[F0 -F)/F] versus log[Q] for quenching effects of each polyphenol on PPA.

Figure 8.
CD spectra of PPA following interaction with various polyphenols.

Figure 9.
Binding modes of polyphenols with PPA in the PPA-Ferulic Acid (a-b), PPA-Quercetin (c-d), and PPA-Isoquercetin (e-f) systems. (a, c, e) Two-dimensional binding mode diagrams of polyphenols with PPA, where green dashed lines indicate hydrogen bonds and red gear-like patterns represent hydrophobic interactions. (b, d, f) Left: Position of polyphenols within the three-dimensional structure of PPA; Right: Three-dimensional binding mode diagram of polyphenols with PPA.

Figure 10.
(a) RMSD values of PPA in the system as a function of simulation time. (b) Radius of gyration (Rg) of the system as a function of simulation time. (c) Solvent accessible surface area (SASA) of the protein in the system as a function of simulation time. (d) RMSF values of all amino acid residues of PPA in the system. (e) Number of hydrogen bonds between PPA and polyphenols in the system as a function of simulation time. (f) Distance between centers of mass (DCOM) of PPA and polyphenols. (g-i) Free energy landscape (FEL) diagrams of the complexes in the PPA-Ferulic Acid, PPA-Quercetin, and PPA-Isoquercetin systems.


Table 1.
Kinetic equations and parameters for polyphenol adsorption on D101 resin.
| Models | Equations | Parameters | ||
| Pseudo-first-order | ln(Qe-Qt)=-0.02 t+0.95 | k1=0.02 min-1 | R2=0.993 | Qe=2.57 mg/g |
| Pseudo-second-order | t/Qt=0.41 t+0.23 | k2=0.039 | R2=0.984 | Qe=4.29 mg/g |
Table 2.
Isotherm equations and parameters for polyphenol adsorption on D101 resin.
| Models | T(℃) | Equations | Parameters | ||
| KL (mL/mg) | Qm | R2 | |||
| Langmuir | 25 | Ce/Qe=0.12Ce+0.40 | 0.29 | 8.33 | 0.99002 |
| 35 | Ce/Qe=0.16Ce+0.48 | 0.32 | 6.45 | 0.96842 | |
| 45 | Ce/Qe=0.17Ce+0.59 | 0.29 | 5.76 | 0.97659 | |
| KF | 1/n | R2 | |||
| Freundlich | 25 | lnQe=0.63lnCe+0.046 | 1.047 | 0.63 | 0.87688 |
| 35 | lnQe=0.83lnCe-0.267 | 0.766 | 0.83 | 0.92198 | |
| 45 | lnQe=0.99lnCe-0.557 | 0.573 | 0.99 | 0.93380 | |
Table 3.
Fluorescence quenching parameters, binding constants, and IC50 values for the inhibition of PPA by polyphenols.
Table 3.
Fluorescence quenching parameters, binding constants, and IC50 values for the inhibition of PPA by polyphenols.
| polyphenols | Kq (×1012 L·mg-1·S-1) | Ksv (×103 L·mg-1) | Ka(mL·mg-1) | n | IC50 (mL·mg-1) |
| Purified polyphenols | 5.89 | 17.48 | 21.99 | 1.39 | 3.15±0.16 |
| Quercetin | 4.62 | 13.74 | 18.04 | 1.23 | 4.44±0.21 |
| Ferulic Acid | 3.27 | 9.73 | 17.50 | 1.08 | 6.02±0.21 |
| Isoquercetin | 2.08 | 6.07 | 16.95 | 0.99 | 11.20±0.56 |
| Crude polyphenols | - | - | - | - | 24.55±0.23 |
Table 4.
Structural content (%) of PPA before and after binding with raisin polyphenols and their major components.
Table 4.
Structural content (%) of PPA before and after binding with raisin polyphenols and their major components.
| Content | polyphenol species | ||||
| PPA | Quercetin | Isoquercetin | Ferulic Acid | PRP | |
| α-Helix | 30.7 | 32.5 | 18.0 | 35.7 | 25.8 |
| β-Sheet | 20.5 | 14.8 | 31.2 | 15.9 | 28.4 |
| β-Turn | 17.3 | 25.3 | 19.0 | 16.8 | 18.5 |
| Random Coil | 31.5 | 27.4 | 31.8 | 31.6 | 27.3 |
Disclaimer/Publisher’s Note: The statements, opinions and data contained in all publications are solely those of the individual author(s) and contributor(s) and not of MDPI and/or the editor(s). MDPI and/or the editor(s) disclaim responsibility for any injury to people or property resulting from any ideas, methods, instructions or products referred to in the content. |
© 2026 by the authors. Licensee MDPI, Basel, Switzerland. This article is an open access article distributed under the terms and conditions of the Creative Commons Attribution (CC BY) license (http://creativecommons.org/licenses/by/4.0/).
Copyright: This open access article is published under a Creative Commons CC BY 4.0 license, which permit the free download, distribution, and reuse, provided that the author and preprint are cited in any reuse.


