

Submitted:
28 April 2026
Posted:
28 April 2026
You are already at the latest version
Abstract
Using a database of global total fertility rates (TFR) from 1990 to 2024, supplemented by a series of indicators, we can observe trends and explain them through cultural and socio-economic factors. Worldwide TFR dynamics show a clear distinction: low fertility (below replacement) in much of Europe, North America, and East Asia; high fertility in sub-Saharan Africa; and moderate fertility in countries at various stages of the demographic transition. Observed variations are explained by economic and social-determinants:GDP and Human Development Index are negatively correlated with TFR; high infant mortality rates correlate positively with TFR; and greater contraceptive prevalence and higher average maternal age at birth are associated with fertility declines. Cultural factors – such as dominant religion or official demographic policies – can modify overall trends, and the level of democratic freedom influences access to reproductive health information and services. These disparities reflect structural differences in socio-economic development, public health, gender equality and social policy.
Keywords:
total fertility rate
; demographic transition
; drivers
; regional disparities
; new demographic equilibrium
1. Introduction
The total fertility rate (TFR) is one of the most relevant demographic indicators for explaining population dynamics in a given country or region [1], providing a more accurate picture of long-term trends than the crude birth rate [2]. For this reason, the evolution of fertility studied in a longitudinal profile can succintly illustrate the degree of conformity to the demographic transition model [3]. A geographical perspective on the dynamics of this indicator can reveal significant disparities. A multifaceted approach is needed to explain the regional patterns that emerge; it is useful to consider the social, economic, cultural, and political dimensions that influence family planning and reproductive health.
Geographical variation in total fertility rates generally indicates three broad patterns of change: one dominate by high fertility; another characterized by moderate fertility; and a third distinguished by low fertility. In the first case, globally, sub-Saharan Africa is the most characteristic example, against a backdrop of limited access to education and healthcare, due to a low level of economic and social development. Moderate fertility is common in regions that have made significant progress, such as South and South-East Asia and Latin America. Developed countries, where high levels of development are also reflected in high costs of raising children, changing gender role and prioritizing careers over family, are strongly marked by low fertility rates. However, the declin in this demographic indicator is also increasingly felt in developing countries, with some studies citing a massive reduction over the last 20 years [4]. This points to a trend toward convergence that would coincide with overall economic convergence [5] and increased prosperity, mediated by social factors ‒ among which women’s education appears to be essential ‒ alongside medical factors that some authors argue indicate our species is entering an „infertility trap” [6].
The factors determining fertility rate variation are well known. They include, first and foremost, economic development, education, cutlural and religious characteristics, access to healthcare, and government policies. High income and urbanization levels are usually correlated with low fertility rates, as families prioritize investing in their children’s education. Similarly, higher levels of education among women are associated with lower fertility rates, particularly because women tend to marry and have children later in life [7]. Cultural perceptions of family size and gender roles also have a significant impact on fertility rates [8]. Access to reproductive health services, especially family planning, further contributes to changes in this parameter. Government policies can encourage or discourage childbirth, and population control measures can have profound effects. The impact of economic cycles on fertility is also frequently taken into account [9].
Fertility rates are usually evaluated relative to the replacement level TFR ‒ an approximate TFR of 2.1 children per woman of childbearing age (15-49 years). Above this level, the population is expanding demographically. Around this value, generations are replaced even in the absence of natural population growth. Below this level, replacement becomes problematic. These three situations broadly correspond to the three models of evolution mentioned above. For a more in-depth exploration, specific case studies, regional policies, or the capacity to attract immigrants can be examined, since immigration can, in the medium term, maintain a minimum level of growth. Sustained fertility below the replacement threshold accelerates demographic decline, the only solution for returning to a steady state being to restoring fertility to a level capable of counteracting the decline [10]. This contradicts the results of prospective studies that model TFR by projecting a return to the replacement level [11]. The episodic recovery of TFR once values have stabilized at a level below the replacement rate is often circumstantial, as appeared to be the case in most European countries in 2000-2009 [12]. Some studies indicate, at least at the national level, periods of spatial divergence or convergence, closely linked to the level of development, which determine more sustainable TFR stability in less developed regions and increased sensitivity to economic and social crises in developed regions (the case of Italy presented in [13]).
The evolution of TFR is often linked to a number of factors tested and validated in various analyses. The level of development is among the most frequently cited. The relationship between GDP and TFR forms the basis of many demographic studies showing that countries with less developped economies tend to have higher fertility rates [13]. Economic stability is also important in this regard, especially wiht regard to family planning. GDP interacts with cultural norms, education levels, access to health services, and government analysis of demographic indicators. The Human Development Index (HDI), a composite indicator that measures social and economic development, is often used in the analysis of demographic indicators [15]. Its influence on TFR is similar to GDP and can be considered partly redundant, although discrepancies induced by specific development policies in each state may occur. At the national level, examining the evolution of the TFR can also illustrate the manifestation of profound economic inequalities [16]. Overall, the decline in fertility toward the replacement rate can have a positive impact on a nation’s economic prosperity through the demographic dividend [17].
Discussions of interdependencies also include those concerning infant mortality. Usually, high TFR is correlated with high infant mortality, as families may gave more children to ensure that enough survive to adulthood. These connections are largely related to the level of economic development and to cultural and social norms. Public policies that improve health outcomes are also important.
The importance of contraceptive use is undeniable because they ensure control over family size according to individual aspirations. They can change social norms, especially under conditions of freedom and gender equality. A key effect of their use may be an increase in the average age of women at first birth, which can have far reaching socio-economic and demographic implications. The structure and dynamics of the family can thus be significantly altered, especially in advanced societies marked by aging. The decline in TFR in such contexts is often inevitable, influenced by a combination of personal choices and societal changes.
The degree of urbanization is also important in TFR dynamics. Greater access to jobs, education, or medical services, as well as greater openness to changing social norms or higher costs of living, can lead to a reduction in average family size. Religion can be a decisive factor in shaping TFR: religious belief systems may contains teachings regarding family and the status of women that oppose contraception and their influence or cultural norms can moderate the effects of other determinants.
Exploring all the factors involved in TFR dynamics is practically impossible. Essential variables include those illustrating the labor market, the macroeconomic environment, policy instruments, and the demographic context, as shown by studies on OECD member states [18]. The role of public policies can be particularly important in such states where the population appears sensitive to economic curcumstances and social services when deciding whether to have a child. Illustrative of the role of social policies in supporting families is the case of the Russian Federation, which adopted a federal law [19] to this effect, managing to exceed the minimum TFR leve of 1.16 recorded in 1999, reaching values between 1.5 and 1.8 between 2008 and 2021 [20]. Explaining the diffusion of an essential cultural model such as demographic transition involves identifying limits that distort what may appear to be a universal process, especially in the context of globalization [21].
2. Materials and Methods
The objective of this study is to analyze TFR dynamics worldwide over a 35-year period, roughly equivalent to one generation. A secondary objectie is to identify long-term trends and regional evolutionary patterns. The combination of descriptive and multivariate analysis ensures that relevant conclusions can be drawn.
The primary hypotesis explores the extent to which a convergence trend in TFR values exists, which globally translates into reaching the replacement level (2.1). To decipher the mechanisms differentiating global TFR trends, we test the hypothesis that determining factors act disparately across region. The selection of variables follows established literature confirming that TFR decline correlates with increasing age at first marriage, prevalence of contraception, education levels, urbanization, and other socio-economic indicators [22,23].
To achieve these objectives and test the aforementioned hypotheses, data were collected from from the most relevant sources and compiled into two separate databases:
- a)
- TFR Times Series: Annual TFR data for the 1990-2024 period, sourced fromt he „World Population Data Sheet” (Population Reference Bureau, (www.prb.org), and the UN „World Population Prospect 2024” report. All teritories included and geopolitical changes (e.g., emergence of new states, unifications) were accounted for.
- b)
- Explanatory Indicators: A database of TFR determinants based on the literature review. Table 1 describes these indicators, their sources, and the standardization methods used. While most data series ar complete, some (contraceptive prevalence, mean age at first birth, gender inequality index, and democratic index of freedom) are selective, based on available sources. However, the included countries remain representative across all continents, constituting a valid sample for analysis.
The first database was used to develop an Agglomerative Hierarchical Clustering (AHC) typology operated in XlSTAT (2015 version of Addinsoft). To minimize the influence of extreme annual variations, five-year averages (1990-1994, ..., 2020-2024) were calculated. However, annual values were retained for class profile representations. Cartographic processing was performed in Adobe Illustrated CS 12.
Data for the multivariate analysis were standardized usig Z-scores. We opted for Partial Least Squares (PLS) multiple regression with TFR as the dependent variable, as it is well-suited for a large number of explanatory variables (11) and handles multicollinearatiy effectively. To capture how each factor influences TFR evolution over time, seven distinct analysis were performed for each five-year period. The predictive capacity of the factors can also be observed. The model’s validity us assessed usign the coefficient of determination R2 and Root Mean Square Error (RMSE). Results interpretation is based on correlation matrices and graphs represented the performance of the regression model.
3. Results and Discussions
3.1. Descriptive Analysis
The Total Fertility Rate (TFR) has shown a general downward trend globally in recent decades (Figure 1). In the early 1990s, the decline was particularly pronounced, partly due to the political changes in Eastern Europe and the economic rise of several Asian countries, both of which had a profound effect on demographic behavior. The current rate of decline suggest that the replacement threshold (2.1) may be reached within the next one to two decades. Thus, the possibility of a decline in the global population during second half of the 21st century is becoming almost a certainty. The graph also illustrates the evolution of the TFR in Romania. After the shock following the fall of the communist regime, the rate gradually recovered but failed to return to the generational replacement level. Romania had managed to maintain this threshold previously, with the exception of the years 1962-1966 and 1983, periods which prompted the imposition of strict population control policies. In 1989, Romania’s TFR was 2.19, but between 1990 and 2024, the average fell to 1.5, well below the replacement level. Notably, the period when this indicator was at its lowest (1944-2006) coincided with a high reproductive potential provided by the generations born between 1967 and 1980. Mass emigration, both immediately after 1990 and following the opening of borders in 2001, played a significant role in this demographic context. The Romanian example was also inserted in the graph to ilustrate the difficulty of returning to the replacement rate in states that have completed the demographic transition.
A descriptive analysis of global TFR trends for the period 1990-2024 revealed eight distinct types, which are spatially consistent (Figure 2).
The first category includes countries that are still above the replacement level (2.1), mainly grouped in Sub-Saharan Africa, with a few isolated Asian or Latin America countries.
Of these, Type 1 (high conservative) is distinguished by the preservation of a very high level (above 5 childrens per women), although declining trends are visible, they remain delayed. The countries belonging to this type form an arc from Central-Southern Africa to the West, including highly populated countries such as Nigeria and the Democratic Republic of Congo. Outside Africa, the only country experiencing similar trends is Afghanistan. In general, these are countries strongly marked by isolation (for example, in the Sahel, where the maximum value is recorded in Niger) or by prolonged conflicts (Somalia) that leave no room for even minimal socio-economic modernization.
Type 2 (high declining) extends countries similar to those in the previous type (Western Africa, the African Great Lakes region, Sudan, Ethiopia), as well as several Asian countries (Yemen, Iraq, Pakistan, etc.). The decline in TFR in these countries is somewhat faster, yet they still retain strong potential for population growth for many decades to come. This will be mainly due to the decrease in mortality and the increase in life expectancy at birth.
Type 3 (relatively high declining) is characterised by an even more pronounced decline in TFR, approaching replacement level. This type is less representative, encompassing several African countries with more advanced economies (e.g., Gabon, Kenya, Ghana, Namibia), some Asian countries (those in the Arabian Peninsula, Laos, Cambodia, Uzbekistan, Tajikistan), and a few less developed Latin American countries (Bolivia, Guatemala, Haiti). Despite the rapid decline, these countries retain ‒ by inertia ‒, significant growth potential over the next decade, though they could subsequently enter a stabilization phase near the replacement level.
Types 4 and 5 held an intermediate position at the beginning of the period, with relatively high TFR values in constant decline. The trajectories were initially similar, but after 2000, as they approached the replacement level, a divergence occured.
Type 4 (medium stable) entered a phase of levelling off slightly above replacement level, with a resumed decline in recent years. This group includes several Asian and Latin American countries, and to a lesser extent, African countries (Algeria, Libya, South Africa). Some are large countries where divergent regional trends combine (most notably example is India), resulting in an apparent stagnation of TFR decline. In other countries, however, there has been an actual recovery within specific contexts. For exemple, in Kazakhstan, this recovery is a consequence of „de-Russification”, triggered by the repatriation of many citizens of Russian origin who settled there during the Soviet period, a trend similar to other Central Asian countries. In Algeria, the political turmoil of the 1990s generated a revitalization of conservative trends that halted the decline in TFR.
In contrast, countries classified as Type 5 (medium fast declining) continued their downward trend, often falling well below the replacement level, with values similar to those in Europe or North America. This includes major Latin American countries (Mexico, Colombia) and Asian/North African countries such as Turkey, Iran, Malaysia, and Morocco. Iran is particularly noteworthy because, despite being a theocratic state, it has undergone one of the most rapid demographic transitions from a conservative to a postmodern regime. The explanation lies in its advanced level of development, its high education level (with virtually complete literacy), and in its degree of urbanization.
The last three types group together countries that had already reached a low TFR in 1990, near the replacement level. Their subsequent trajectories differed despite a shared downward trend.
Type 6 (low stable) groups countries in Northwestern Europe, North America and Oceania (Australia, New Zealand), where the TFR was below 2.1 in 1990, subsequently showed minor variations. These countries that generally benefit from an influx of young people through international migration, often from countries with higher TFRs. However, some Southern or Central European countries (such as Germany, Italy and Spain) have benefited from similar inflows yet still experienced declines to values well below replacement level. This is similar to Eastern European countries marked by the post-communist transition, which reduced the pressure of pro-natalist policies.
These form Type 8 (low uncertain) which, after a massive decline in the 1990s, entered a phase of stability at a level well below the replacement level (around 1.5), similar to the example of Romania. Japan and South Korea also fall int this category recently.
Type 7 (low fast declining) sits between the two, it includes countries that maintained values slightly above 2.1 in recent decades but continued to decline (e.g., Brazil, Argentina, Cuba, China, Thailand). These are either highly urbanized or have been subject to long term anti-natalist policies. As a result, in recent years, the valuse for types 6,7,8, and even 5 have converged, reflecting the impact of urbanization and and economic development. This trend is likely to diminish the gap in the coming decades between countries that still show conservative tendencies (type 4) or maintain high TFR values (types 1, 2, and 3). Such a development is, in fact, desirable in order to ensure a global balance between nature and society.
3.2. Factor Analysis
Descriptive analysis revealed rather divergent trends in the Total Fertility Rate, set against a broader downward trajectory. This divergence may be driven by favorable factors or by various socio-economic and political constraints. Depending on the context, the evolution of the indicator has followed distinct paths, characterized either by a general decline or by a plateau, typically at a level close to replacement fertility. The selection of variables for the multivariate analysis aimed to capture, within the limits of available data, the specific factors and constraints present throughout the study perioad. By applying a regression model to five-year fertility averages, the study sought to highlight how the interaction potential of certain variables evolved over time. Consequently, the results are summarized in Table 2, which presents the correlaton indices between dependent variable (TFR) and the explanatory variables in chronological order.
Analysis of the correlation indices reveals that all variables are highly significant, a trend that – with one exception – persists throught the entire study period. As expected, variables such as Gross Domestic Product (GDP) and the Human Development Index (HDI) show a strong negative correlation, a high level of these indicators typically translates into a lower Total Fertility Rate. Regarding GDP, a sharp variation occured between 2010 and 2014, when the correlation index value fell significantly. This can be attributed to the economic crisis of the late 2000s, which particularly affected developed countries. This assertion is supported by the subsequent strong recovery, indicating the increasingly vital role of overall economic development in shaping demographic behavior. A high TFR can negatively impact economic growth, making investement in human capital being essential to reduce it and accelerate growth by exploiting the demographic dividend [35].
At the same time, the HDI, which exhibited a profoundly negative correlation, demonstrating the importance of social progress and living standards, has recently seen a slight decline in its correlations strength after 2020, while still maintaining its explanatory value. This development is consistent with the significant drop in fertility indicators in many developing countries during and after the COVID-19 pandemic. Consequently, the pandemic cand be characterized as a genuine demographic „shock”, impacting not only mortality rates but also fertility patterns. Particularly evident in Latin America and Asia, this alignment of birth rates with those of European and North American countries may be long-lasting, necessitating a revision of medium- and long-term demographic forecasts.
Infant mortality (IM) was included in the analysis because a correlation between its level and fertility indicators has long been observed [36]. A low level ensures the certainty of offspring and may imply, in an economic, social, and cultural context tending toward progress, a reduction in family size. The strong, constant positive correlation between IM and TFR indicates the importance of this indicator as a vector of modernization in demographic behavior. The reduction in infant mortality in developing countries, which has accelerated in recent decades, has contributed decisively to the completion of the demographic transition, particularly in Asian and Latin American countries. The restriction of conservative demographic behavior to the interior areas of Africa is closely correlated with the maintenance of a high infant mortality. This indicator mirrors the prevalence of contraception (CP), which shows a strong negative correlation, gradually declining but remaining at very high levels. Countries where access to contraception is restricted usually have high infant mortality rates and high TFRs.
The correlation with the mean age at first birth (MAFB) has evolved in the same direction, showing significantly lower values but still high level. The increasingly advanced age at which mothers give birth to their first child – both in developed, and, increasingly, developing countries –, further explains the decline in TFR. In this regard, the optimal age for childbirth remains a subject of debate [37], as many European countries (especially in the South and West) have long exceeded the 30-year threshold. The narrowing of the procreation period to the second half ot the reproductive interval (15 – 49 years) is a key vector for TFR plateauing well below the replacement level. Studies have long shown a direct link between TFR and women’s employment rates or education levels, which are responsible for postponing childbirth [38]. Ireland serves as a notable example: while its MAFB was high, its TFR remained near replacement levels util recently. However, since the liberalization of contraceptive measures and abortion in 2018, Ireland’s TFR fell rapidly from 1.75-2.1 (1990-2017) to 1.5 in 2023. This confirms the importance of family planning, which is closely linked to female employment rates [39]. While developing countries face limitations and cultural constraints, in developed countries, unregulated access can lead to a massive decline in TFR, impacting generational replacement. Discussions about contraception remain sensitive, as they intersect with individual freddoms; thus, policies focusing on risk awareness and health education may be more effective [40].
The degree of urbanization (UD) initially presented a satisfactory, slightly negative level of correlation. After 2000, however, there was a steady decline in its explanatory value. Exceeding the 50% urban population threshold in 2007 (according to sources such as the World Bank and the UN) seems to have had an impact, even tough the model only took into account the population of large urban agglomerations (over 100,000 inhabitants). The differences between residential environments have long since narrowed in developed countries and are now narrowing in developing countries. Consequently, the importance of urbanization as an explanatory factor for TFR evolution will continue to decline as demographic behavior becomes more homogeneous. The higher female employment rate in urban areas could further explain the role of urbanization, with some studies showing an inverse relationship between female labor force participation and the total fertility rate [41]. Such studies point to an incompatibility of roles and a societal response that is forcing societies to change their attitudes towards mothers in the workplace.
The cultural factor was illustrated by the dominant religion (MR). Even though it is a qualitative, relative indicator, it was quantified based on the empirical observation that there are differences in demographic behavior between states depending on their affiliation with a particular religious system [42]. The quantification of this qualitative indicator took into account the average values of the TFR. Belonging to Islam received the maximum value (1), while Christianity received the minimum (0,1). Other religious systems were assigned intermediate values: 0.3 for Eastern syncretic cults (from China, Japan, etc.); 0.5 for Judaism; 0.7 for Buddhism; and 0,9 for Hinduism. Although seemingly arbitrary, this scoring allowed for the certification of a positive correlation between the dominant religion and TFR. The level of correlation is indeed steadily declining ‒ demonstrating a reduction in the impact of the cultural environment on TFR evolution, but it remains significant. This trend may illustrate a process of cultural uniformity in the homogenization of demographics behaviors [43]. Certain traditions and religious prescriptions can hinder the implementation of population control policies, maintaining conservative demographic behaviors.
Strongly positive correlation values are also shown by Official Demographic Policies (ODP), as expressed through governments perceptions of overall trends. The anti-natalist (denatalist) perception was quantified as 1, the indifferent perception as 0.5, and the pro-natalist perception as 0.1. These scores were assigned using the same logic: countries with policies to reduce population growth face a high TFR, while those with policies to stimulate growth face a low TFR. The correlation index values remain high, even increasing slightly between 2005 and 2014 ‒ including in Romania, where more extensive measures to support families were taken during that period ‒ which may demonstrate the need for clear, committed public policies. It is no coincidence that the governments of countries with the highest TFR values are predominantly indifferent, just as the governments of countries with stimulus policies perceive a low TFR negatively.
The level of literacy (ALR) also shows a strong negative correlation, being practically collinear with infant mortality and the prevalence of contraception. Its importance is indisputable, as it is closely linked to the steady increase in the average age at first marriage (and, implicitly, at first birth), the degree of urbanization, and the general level of development.
Although the available data was fragmentary (covering approximately two thirds of the states and territories analyzed), the GII (Gender Inequality Index) also correlates strongly with demographics patterns. This confirms the importance of social equity and equal opportunities in shapping demographic behavior. Initially, this correlation ‒ though strong ‒ appeared to be decreasing; however in the last decade, it has returned to maximum, particularly during the pandemic. The more egalitarian a society is, the lower its TFR values tend to be, a findig consistent with large-scale studies on the integration of women into the labor market [44].
The situation is similar for the DFI (Democracy Freedom Index), which ‒ though only available after 2010 ‒ exhibits expected negative values; a higher level of democratic freedom correlates with lower TFR values. The role of authoritarianism remains ambiguous; however, as the descriptive analysis has shown, some states transitioning to dictatorial regimes have experienced a clear „revitalization”. For instance. Algeria’s TFR fell from 4.5 in 1990 to 2.4 in 200, only to return to 3.13 by 2016. Similarly, Uzbekistan’s TFr dropped from 4.2 in 1990 to 2.59 in 2000, before progressing to 3.4 in 2023. Conversely, there are counterexamples of deeply authoritarian states where the downward trend in TFR has persisted. A notable case is Iran, which in 1990 had a level similar to the aforementioned states (4.86) but declined steadily unitl 2006 when it reachde 1.77, subsequently recording small variations (2.07 in 2017 and 1.7 in 2022), below the replacement level, similar to developed countries.
The multivariate analysis covered the entire spectrum of factors influencing TFR evolution through the use of synthetic indicators. The results validate the proposed analytical model, as demonstrated by the R2 correlation coefficient and the RMSE (Root Mean Square Error) index. The variation observed in certain explanatory factors indicates the presence of permanent turbulence, which complicates the implementation of effective public policies aimed at population control, as some developments remain difficult to anticipate or emerge unexpectedly. In countries undergoing the Second Demographics Transition (Lesthaeghe, 2014), such turbulence is often driven by the unique socio-behavioral characteristics of the generations currently engaged in the process of social reproduction.
The validity of the regression model used is also illustrated by the graphs depicting its performance (Figure 3). The measured values from the dateset for the dependent variable largely align with the values estimated by the PLS model using latent variables extracted from the predictors. This indicates the explanatory value of the variables introduced intp=o the model for each of the seven analyzed timp sequences. Alongside the R2 correlation coefficient and RMSE, the evaluation of the regression model’s performance indicates significant predictive value.
Most of the analyzed states and territories consistently fall within the confidence interval. The influence of destabilizing factors is observalbele, such as the 2008–2012 economic crisis and the COVID-19 pandemic (2020-2022), which imposed a more pronounced dispersion of prediction values during those periods. Consequently, the number of outliers increased during these intervals. Interestingly, these outliers appear frequently across the seven time sequences and are concentrated in distinct geographical areas, such as Southwestern Asia. Less frequently, certain states from South and Southeast Asia, Sub-Saharan Africa, or occasionally from Oceania and Latin America appear.
The situation of these states and territories warrants further investigation to determine the factors responsible for the invalidation of the predictive model. Most of them are small in size and present unique circumstances. Notably, Bhutan, the Palestinian Territory and Samoa appear consistently as extreme cases, with the exception of the final period. The United Arab Emirates also appears in five periods, and Bangladesh in four. It is worth noting that virtually none of the developed nations fall into this category, meaning the analytical model it well adapted. It can be considered that this category of states exhibits a more predictable evolution of the dependent variable than many developing states subject to constraints, internal unrest, or sudden changes in the socio-economic context.
4. Conclusions
The results of the study confirm the global convergence of Total Fertility Rate towards values below the replacement level, as socio-economic modernization becomes widespread. This supports social change theory, which predicts a convergence of demographic patterns as countries reach a similar level of development [46]. The demographic transition can thus be accepted as a universal process, despite vsariations in pace and contextual distortions.
The convergence of fertility patterns has been faster and more evident than that of mortality, with population growth is the result of differentiated adaptations to the transition of these two components of the natural balance. The world appears to be moving towards a „new demographic equilibrium” [47], characterized by modern values such as individualism and rationalism. Gradually, from the fear of overpopulation that dominated debates on population growth in the late 20th century has been replaced by concerns regarding depopulation, which has already become a reality in certain countries. Maintaining the TFR at the replacement level appears to be incompatible with increasing prosperity and an improved quality of life. Occasionaly, brief upward trends in TFR have been observed in developed countries ‒ notably in Europe between 1998 and 2008 ‒ but these are attributed to distortions caused by delayed childbearing, with the actual final fertility level remaining constat [48]. It remains debatable whether this convergence will lead to a permanent uniformity in global population trends, and whether this process is irreversible.
The validity of this convergence model is further supported by the latest global demographic forecasts. According to the Global Burden of Disease study publishet in The Lancet [49], it is estimated that by 2050, approximately 155 out of 204 counties and territories (76%) will have fertility rates below the replacement level of 2.1.children per woman. This trend is projected to intensify drastically, with over 97% of nations (1984 out of 204) expected to face natural demographic decline by 2100. This evolution confirms the hypothesis that the socio-economic factors analyzed ‒ ranging from female education and access to contraception to urbanization ‒ act as a unviersal engine for the decline in TFR. In this context, the world is mowing toward an unprecedented demographic polarization: while the majority of developed and emerging states will manage the challenge of aging population and depopulation, global population growth will be concentrated almost exclusively in low-income regions, particularly in Sub-Saharan Africa, which is expected to accound for one in every two children born on the planet by the end of the century.
At the same time maintaining a TFR level well below the replacement threshold for a long time represents a major vulnerability for more an increasing number of countries. This risk is amplified when low fertility rates are compounded by high levels of emigration, as seen in many Eastern European states. Already facing general demographic decline ‒ with populations in many of these nations decreasing by over 20% between 1990 and 2024 ‒ these states risk reaching the projected new demographic equilibrium depopulated and devitalized in the absence of a reversal in migratory flows. Unlike some Western nations, these countries can no longer rely on increasing life expectancy to compensate for declining birth rates, as longevity is already at a relatively high-level.The example of Germany, which has maintained a negative natural balance for over five decades while keeping its population stable through migration, cannot be easily replicated in states with severe structural economic problems. A particular vulnerability is already evident in East Asian states where the total fertility rate has dropped to levels once deemed improbable ‒ below 1. Without a recovery toward the replacement level, these nations face a rapid demographic collapse that will be difficult to mitigate even with significant migration.
Without ending on an alarmist note ‒ as global demographic potential remains sufficiently high ‒ states will eventually have to accept compensation through migration more readily The current, rather unfavorable political context must give way to a more permissive vision, capable of rebalancing demographic structures profoundly disrupted by the conclusion of the demographic transition.
Funding
This research received no external funding.
Institutional Review Board Statement
Not applicable.
Informed Consent Statement
Not applicable.
Data Availability Statement
The raw data used can be found in the sources indicated in the bibliography. The processed data used for typology and multivariate analysis, other than those inserted in the tables, can be sent upon request.
Acknowledgments
We thank the administrative and technical support provided by the Department of Geography of “Alexandru Ioan Cuza” University of Iași (Romania), as well as the Geographical Research Center of the Iași branch of Romanian Academy.
Conflicts of Interest
The author declares no conflicts of interest.
References
- Balbo, N.; Billari, F.C. & Mills, M. Fertility in Advanced Societies: A Review of Research. Eur J Population (2013) 29, 1–38. [CrossRef]
- Bongaarts, J.; Feeney, G. On the Quantum and Tempo of Fertility. Population and Development Review (1998), 24(2):271-291, Wiley. [CrossRef]
- Calot, G.; Sardon, J-P. Fécondité, reproduction et remplacement. Population (2001), 56(3):337 – 370, INED, Paris.
- Dessouroux C.; Vandermotten C. Mapping the massive global fertility decline over the last 20 years. Population and Societies (2024), 618. [CrossRef]
- Herbertsson, T. T.; Orszag, P. R.; and Orszag, J. M. Population Dynamics and Convergence in Fertility Rates. IoES Working Paper (2001), No. W99:12, Available at SSRN. [CrossRef]
- Aitken, R.J. The changing tide of human fertility. Human Reproduction (2022), 37(4):629-638, Oxford Academic. [CrossRef]
- Murphy, M.; Wang, D. The Impact of Intergenerationally-Transmitted Fertility and Nuptialiy on Population Dynamics in Contemporary Populations. In The Biodemography of Human Reproduction and Fertility, Rodgers, J.L., Kohler, H.P. (Eds); Springer, Boston,MA (2003). [CrossRef]
- Aassve, A.; Billari, F.C.; Pessin, L. Trust and Fertility Dynamics. Social Forces (2016), 95(2):663-692. [CrossRef]
- Bellido, H.; Marcen, M. Fertility and the business cycle: the European case. Review of Economy of the Household (2019), 17(4):1289-1319, Springer. [CrossRef]
- Preston, S.H. and Guillot, M. Population dynamics in an age of declining fertility. Genus(1997), 53(3/4):15-31, Springer, https://www.jstor.org/stable/29788518.
- Alkema, L.; Raftery, A.E.; Gerland, P.; Clark, S.J.; Pelletier, F.; and Heilig, G.H. Probabilistic Projections of the Total Fertility Rate for All Countries. Demography (2011), 48 (3):815-839, Population Association of America. [CrossRef]
- Goldstein J.R.; Sobotka T.; Jasilioniene A. The End of ”Lowest-Low” Fertility. Population and Development Studies (2009), 35(4):663-699. [CrossRef]
- Salvati, L.; Benass, F.; Miccoli, S.; Rabiei-Dastjerdi, H.; and Matthews S.A. Spatial variability of total fertility rate and crude birth rate in a low fertility country: Patterns and trends in regional and local scale heterogeneity across Italia, 2002-2018. Applied Geography (2020) 124 (102321), Elsevier. [CrossRef]
- Parant, A. Le déclin de la natalité dans le monde et en Europe: Quels mécanismes explicatifs? Quelle géographie?. Les analyses de Population & Avenir (2023), 46(4):1-64. [CrossRef]
- Cheng, H.; Luo, W.; Si, S. et al. Global trends in total fertility rate and its relation to national wealth, life expectancy and female education. BMC Public Health (2022), 22:1346. [CrossRef]
- Finlay, J.E.; Mejía-Guevara, I.; Akachi, Y. Inequality in total fertility rates and the proximate determinants of fertility in 21 sub-Saharan African countries. PLoS ONE (2018), 13(9): e0203344. [CrossRef]
- Bloom, D.E.; Canning, D.; Fink, G.; Finlay, J.E. Fertility, female labor force participation, and the demographic dividend. Journal of Economic Growth (2009), 14(2):79–101. [CrossRef]
- Kato, H. Total Fertility Rate, Economic–Social Conditions, and Public Policies in OECD Countries. In: Macro-econometric Analysis on Determinants of Fertility Behavior. Springer Briefs in Population Studies (2021), p.51-76, Springer, Singapore. [CrossRef]
- Федеральный закoн "О дoпoлнительных мерах гoсударственнoй пoддержки семей, имеющих детей" oт 29.12.2006 N 256-ФЗ (пoследняя редакция), 29 декабря 2006 гoда N 256-ФЗ, https://www.consultant.ru/document/cons_doc_LAW_64872/.
- Miljkovic, D.; Glasyrina, A. The impact of socio-economic policy on total fertility rate in Russia. Journal of Policy Modeling (2015), 37(6):961-973), Elsevier, https://doi.org/10.1016/j.polmod.2015.07.004.
- Muntele, I. Demographical Limits of the Globalization. Journal of Romanian Population (2008), 2(1):105-113, Presa Unviversitară Clujeană, Cluj-Napoca, https://www.ceeol.com/search/article-detail?id=223823.
- Stover, J. Revising the proximate determinants of fertility framework: What have we learned in the past 20 years? Studies in Family Planning (1998), 29(3):255–67, WOS:000076229700001. pmid:9789319.
- Bongaarts, J. Modeling the fertility impact of the proximate determinants: Time for a tune-up. Demographic Research (2015), 33:535–59. WOS:000361063000001.
- World Population Prospects, 2024 Revision, Department of Economic and Social Affairs, United Nations, https://population.un.org/wpp/.
- World Population Data Sheet (1990-2024 eds). Population Reference Bureau, Washington, www.prb.org.
- Gross Domestic Product (2000-2024). World Bank, https://data.worldbank.org/indicator/NY.GDP.MKTP.CD.
- Human Development Report (1990-2024 eds). United Nations Development Program, https://hdr.undp.org/.
- World Contraceptive use, Department of Economic and Social Affairs, United Nations, Population Divison, https://www.un.org/development/desa/pd/dat/world-contraceptive-use.
- Countries statistics, Citypopulation, https://www.citypopulation.de/.
- List of countries by population statistics, Demographics of the World, https://en.wikipedia.org/wiki/Demographics_of_the_world.
- Adult and Youth Literacy. National, regional and global trends: 1985-2013 (june 2013), UNESCO, UIS Information Paper, https://uis.unesco.org.
- Global Gender Gaap Report.World Economic Forum, Geneva (1990-2023), https://www.3.weforum.org/docs/WEF_GCCR.pdf.
- Freedom in the World Dataset, Freedom House, https://freedomhouse.org/countries/freedom-world/scores.
- 34. Freedom Index by Country, World Population Review, https://worldpopulationreview.com/country-rankings/freedom-index-by-country.
- Li, Y. The Relationship between Fertility Rate and Economic Growth in Developing Countries. Master thesis, Lund School of Economics and Management (2016), https://lup.lub.lu.se/student-papers/search/publication/8727479.
- Fehr, H.; Jokisch, S.; Kotlikoff, L.J. Fertility, mortality and the developed world’s demographic transition. Journal of Policy Modeling (2008), 30 (3):455-473, Elsevier. [CrossRef]
- Gustafsson, S. Optimal age at motherhood. Theoretical and empirical considerations on postponement of maternity on Europe, Journal of Population Economics (2001), 14:225-247, Springer. [CrossRef]
- McClamroch, K. Total fertility rate, women’s education, and women’s work: What are the relationships?. Population and Environment (1996), 18:175–186, Springer. [CrossRef]
- Ward, M.P.; Butz, W.P. Completed Fertility and Its Timing. Journal of Political Economy (1980), 88(5):917-940. [CrossRef]
- Kirubarajan, A.; Li, X.; Yau, M.; Yu, C.; Got, T.; Li, Q.; Huszti, E.; Leung, S.; Thangavelu, N.; Sobel, M. Awareness, knowledge, and misconceptions of adolescents and young people regardint long-acting reversible contraceptives: a systematic review and meta-analysis. Fertility and Sterility (2022), 118(1): 168-179, Elsevier. [CrossRef]
- Mishra, V.; Smyth, R. Female labor force participation and total fertility rates in the OECD: New evidence from panel cointegration and Granger causality testing. Journal of Economics and Bussiness (2010), 62(1):48−64, EconPapers, https://www.sciencedirect.com/science/article/pii/S0148-6195(09)00050-2.
- Lehrer, E.L. Religion as a Determinant of Economic and Demographic Behavior in the United States. Population and Development Review (2004), 30(4):707-726, Wiley. [CrossRef]
- Lesthaeghe, R. and Surkyn, J. Cultural Dynamics and Economic Theories of Fertility Change. Population and Development Review (1988), 14(1):1-45, Wiley. [CrossRef]
- Drago, C., Talamo, G. Fertility Rates Around the World: A Cluster Analysis of Time Series Data from 1960 to 2013. In Paoloni, P., Lombardi, R.(eds), Gender Issues in Bussiness and Economics. Springer Proceedings in Bussiness and Economics (2018)., p.19−35, Cham. [CrossRef]
- Lesthaeghe, R. The second demographic transition. A concise overview of its developments. PNAS (2014), 111(51):18112-18115. [CrossRef]
- Gabrielli, G.; Paterno, A.; Salvini, S.; Corazziari, I. Demographic trends in less and least developed countries: Convergence or divergence?. Journal of Population Research (2021), 38: 221−258, Springer. [CrossRef]
- Wilson C., Understanding Global Demographic Convergence since 1950, Population and Development Review (2011), 37(2):375-388. [CrossRef]
- Bongaarts, J.; Sobotka, T. A Demographic Explanation for the Recent Rise in European Fertility. Population and Development Review (2012), 38 (1):83-120, Wiley. [CrossRef]
- Ward, Z.J., Goldie, S.J. Global Burden of Disease Study 2021 estimates: implications for health policy and research, The Lancet (2024), 403 (10440):P1958-1959, https://ww.thelancet.com/article/S0140-637636(24)0081202.
Figure 1.
Comparative evolution of TFR in Romania and worldwide (1990-2024). Data source: World Population Prospects 2024.
Figure 1.
Comparative evolution of TFR in Romania and worldwide (1990-2024). Data source: World Population Prospects 2024.
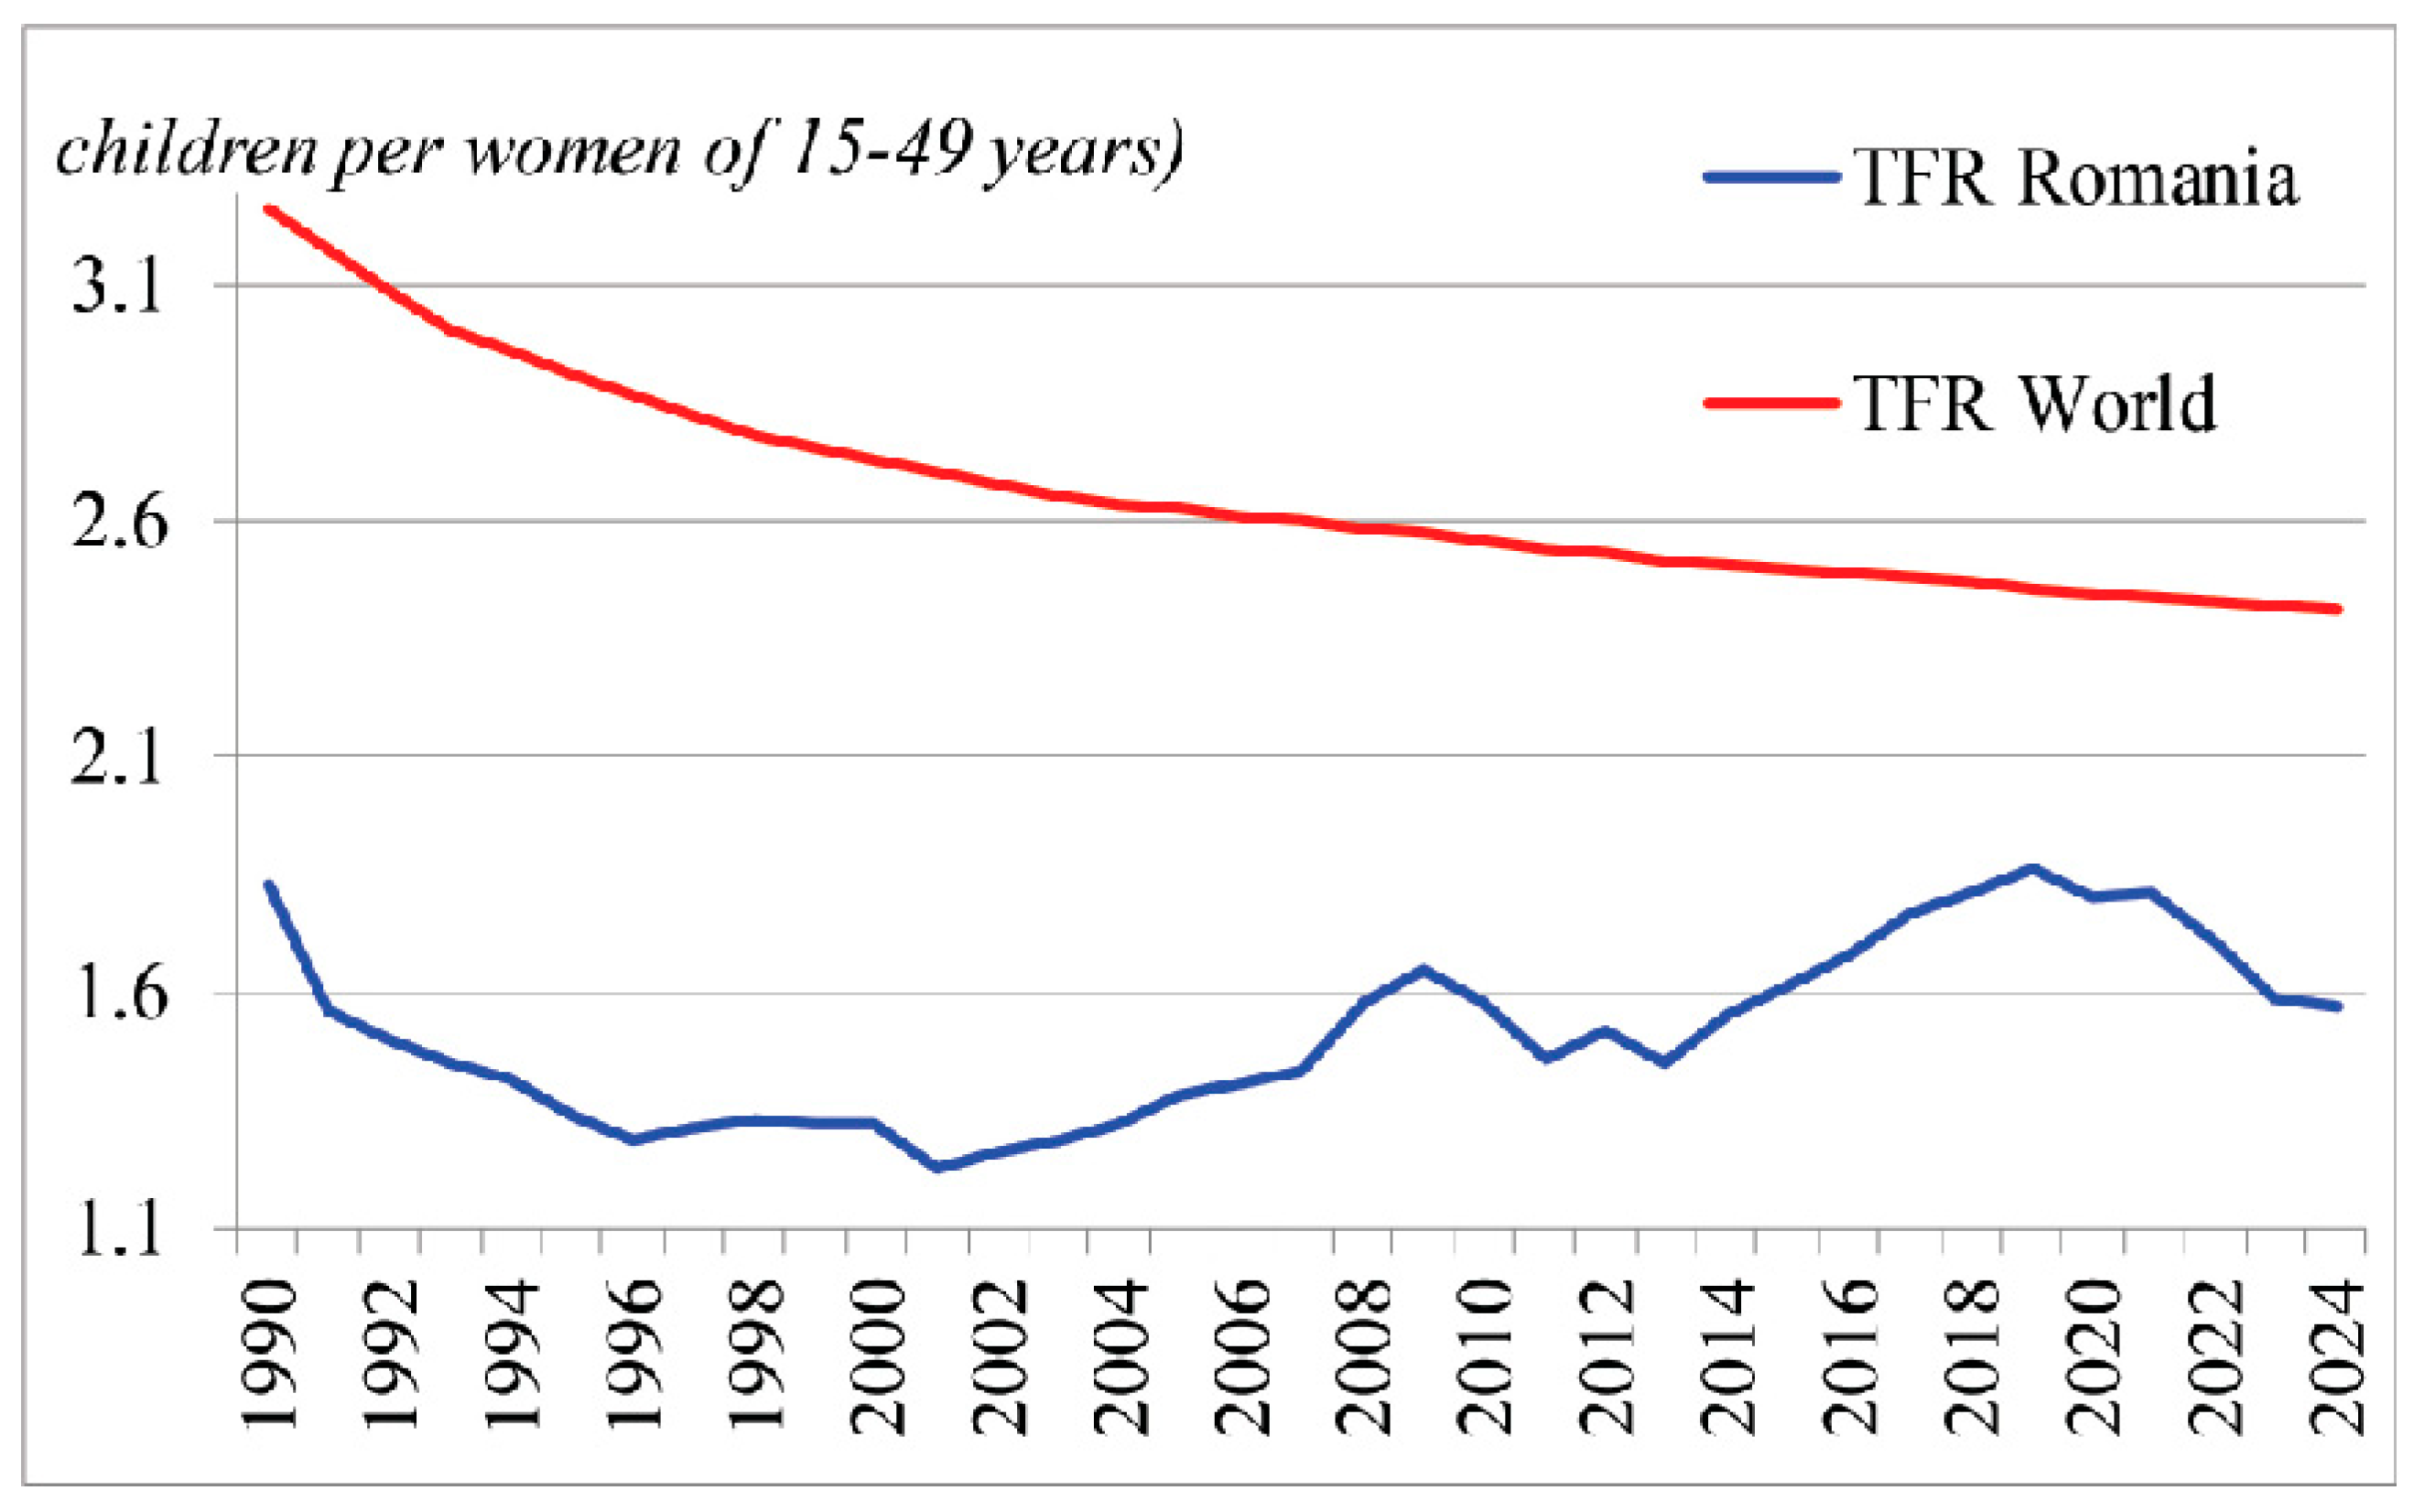
Figure 2.
Typology of TFR evolution between 1990 and 2024. Dendrogram and class profile. Data source: World Population Data Sheet (1990-2024) and World Population Prospects.
Figure 2.
Typology of TFR evolution between 1990 and 2024. Dendrogram and class profile. Data source: World Population Data Sheet (1990-2024) and World Population Prospects.
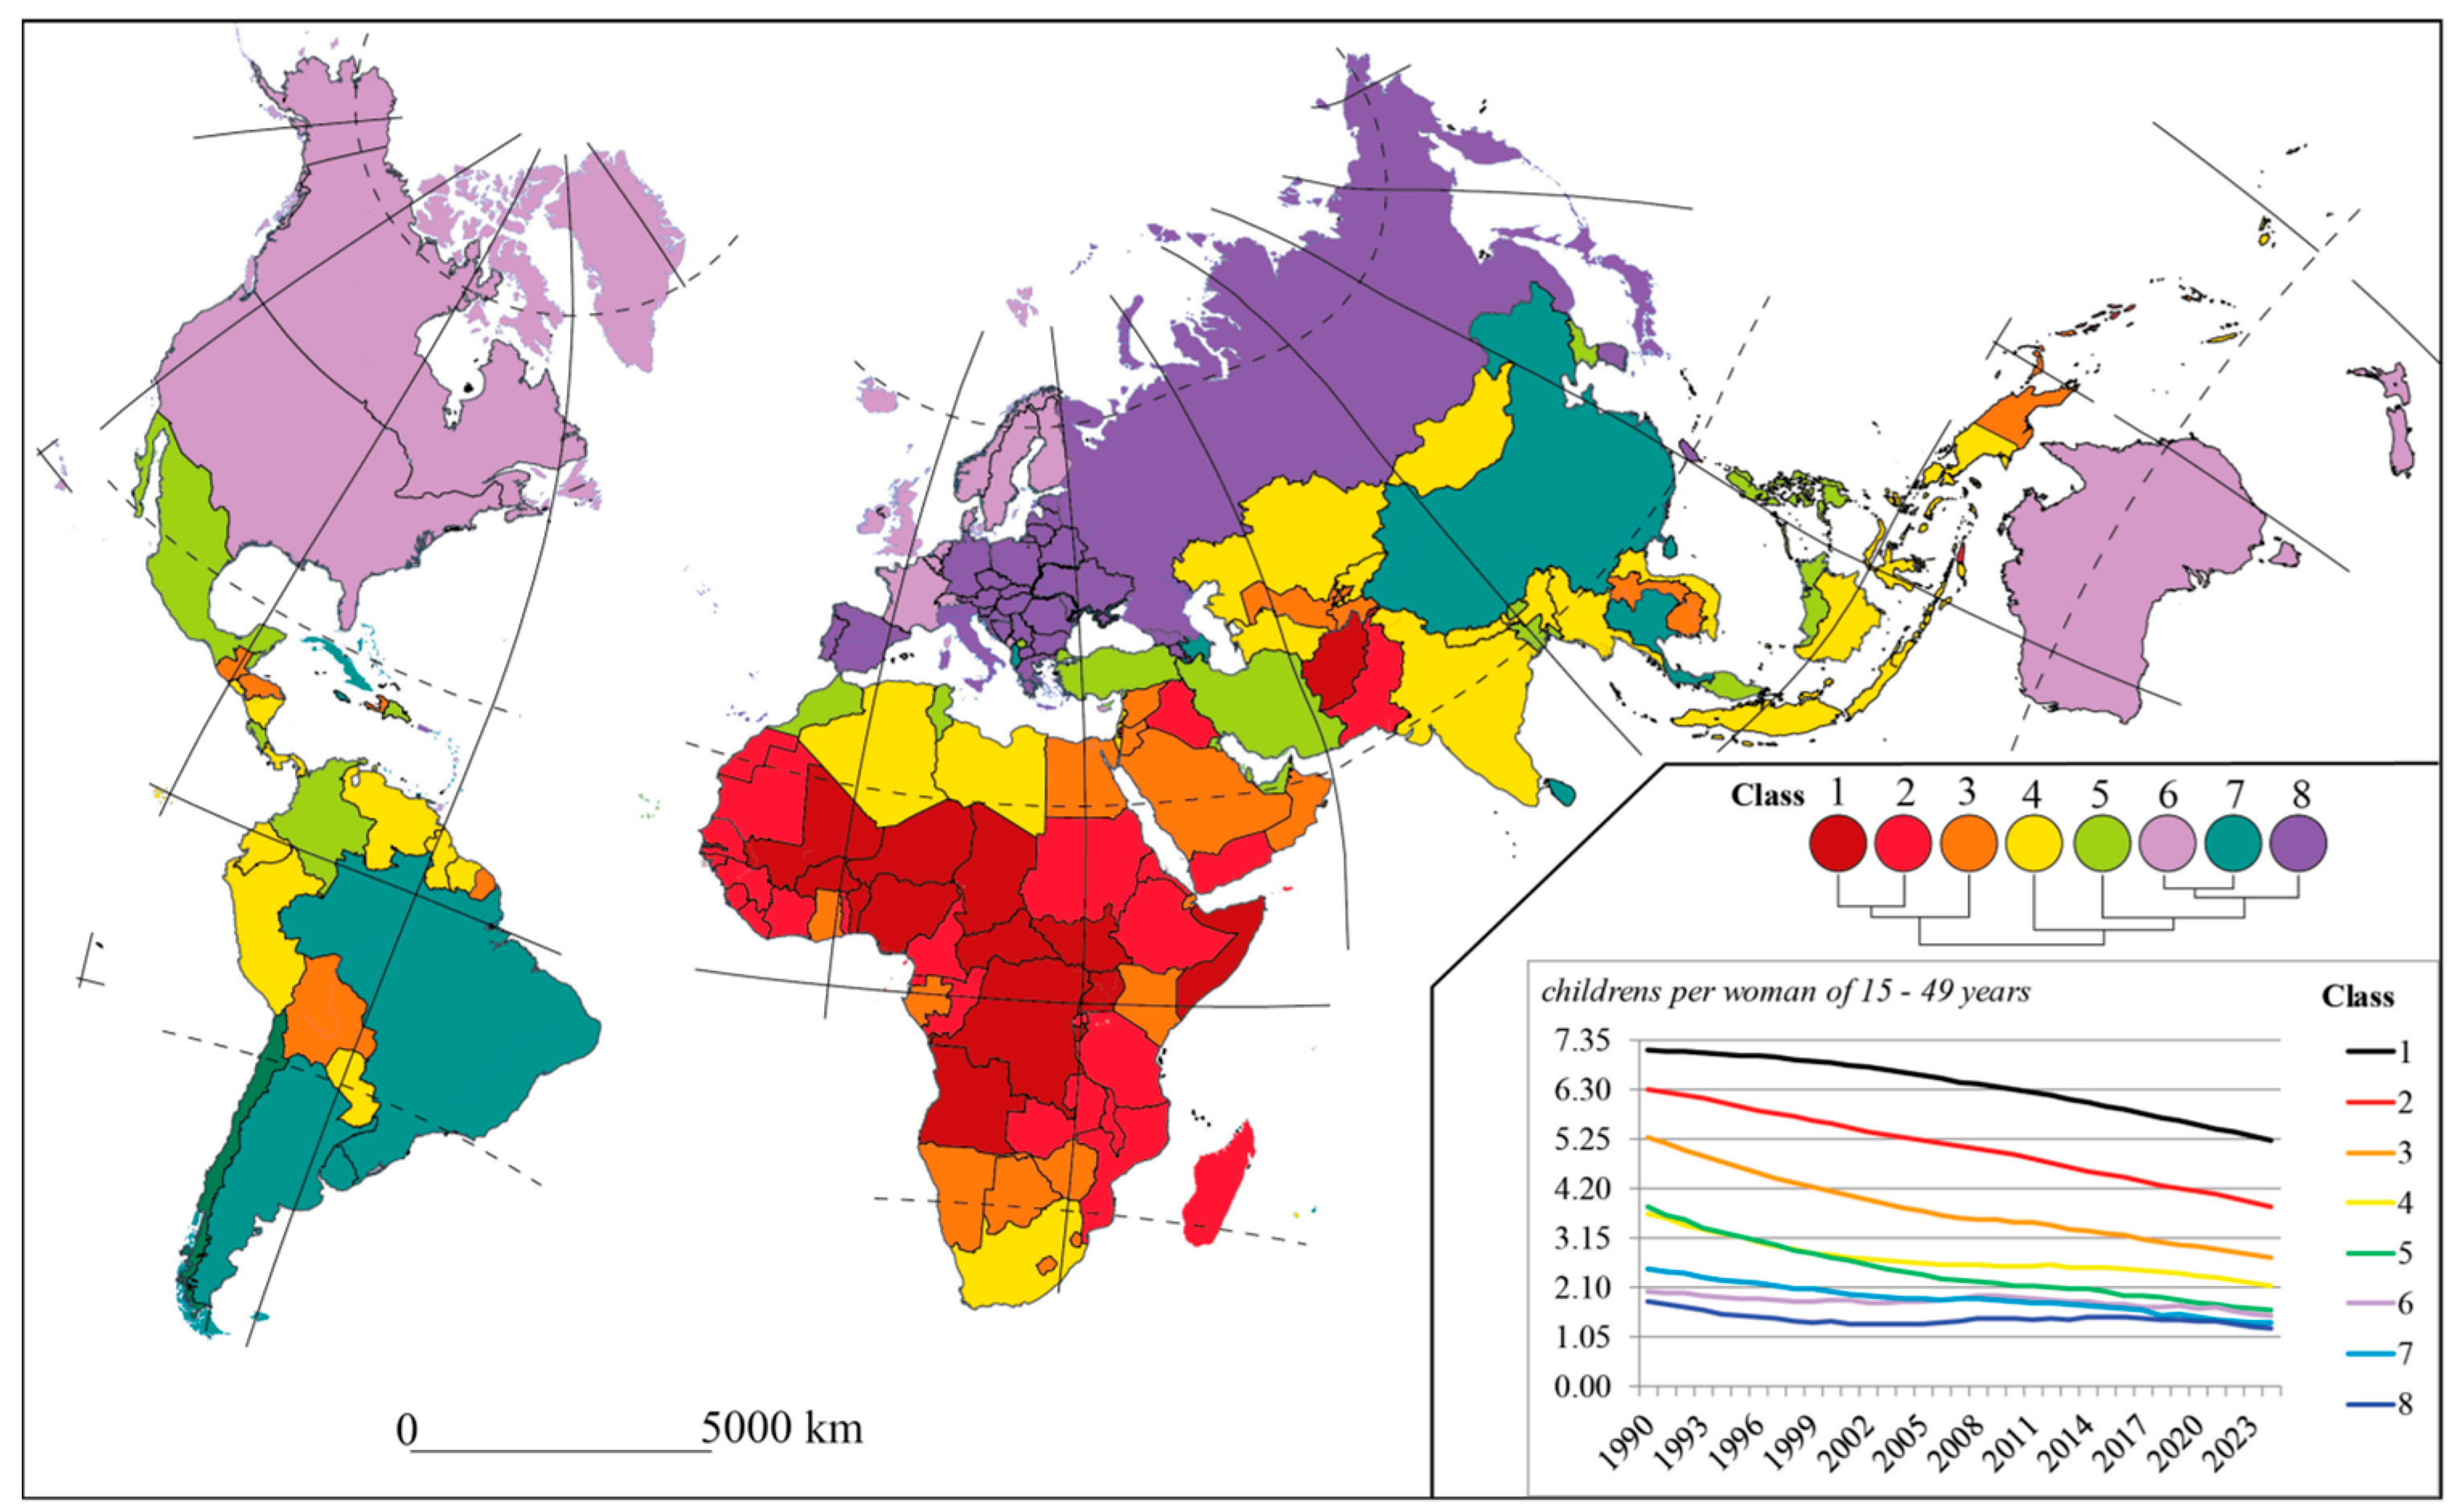
Figure 3.
Evaluation of the performance of the regression model. Predictive values and outliers.
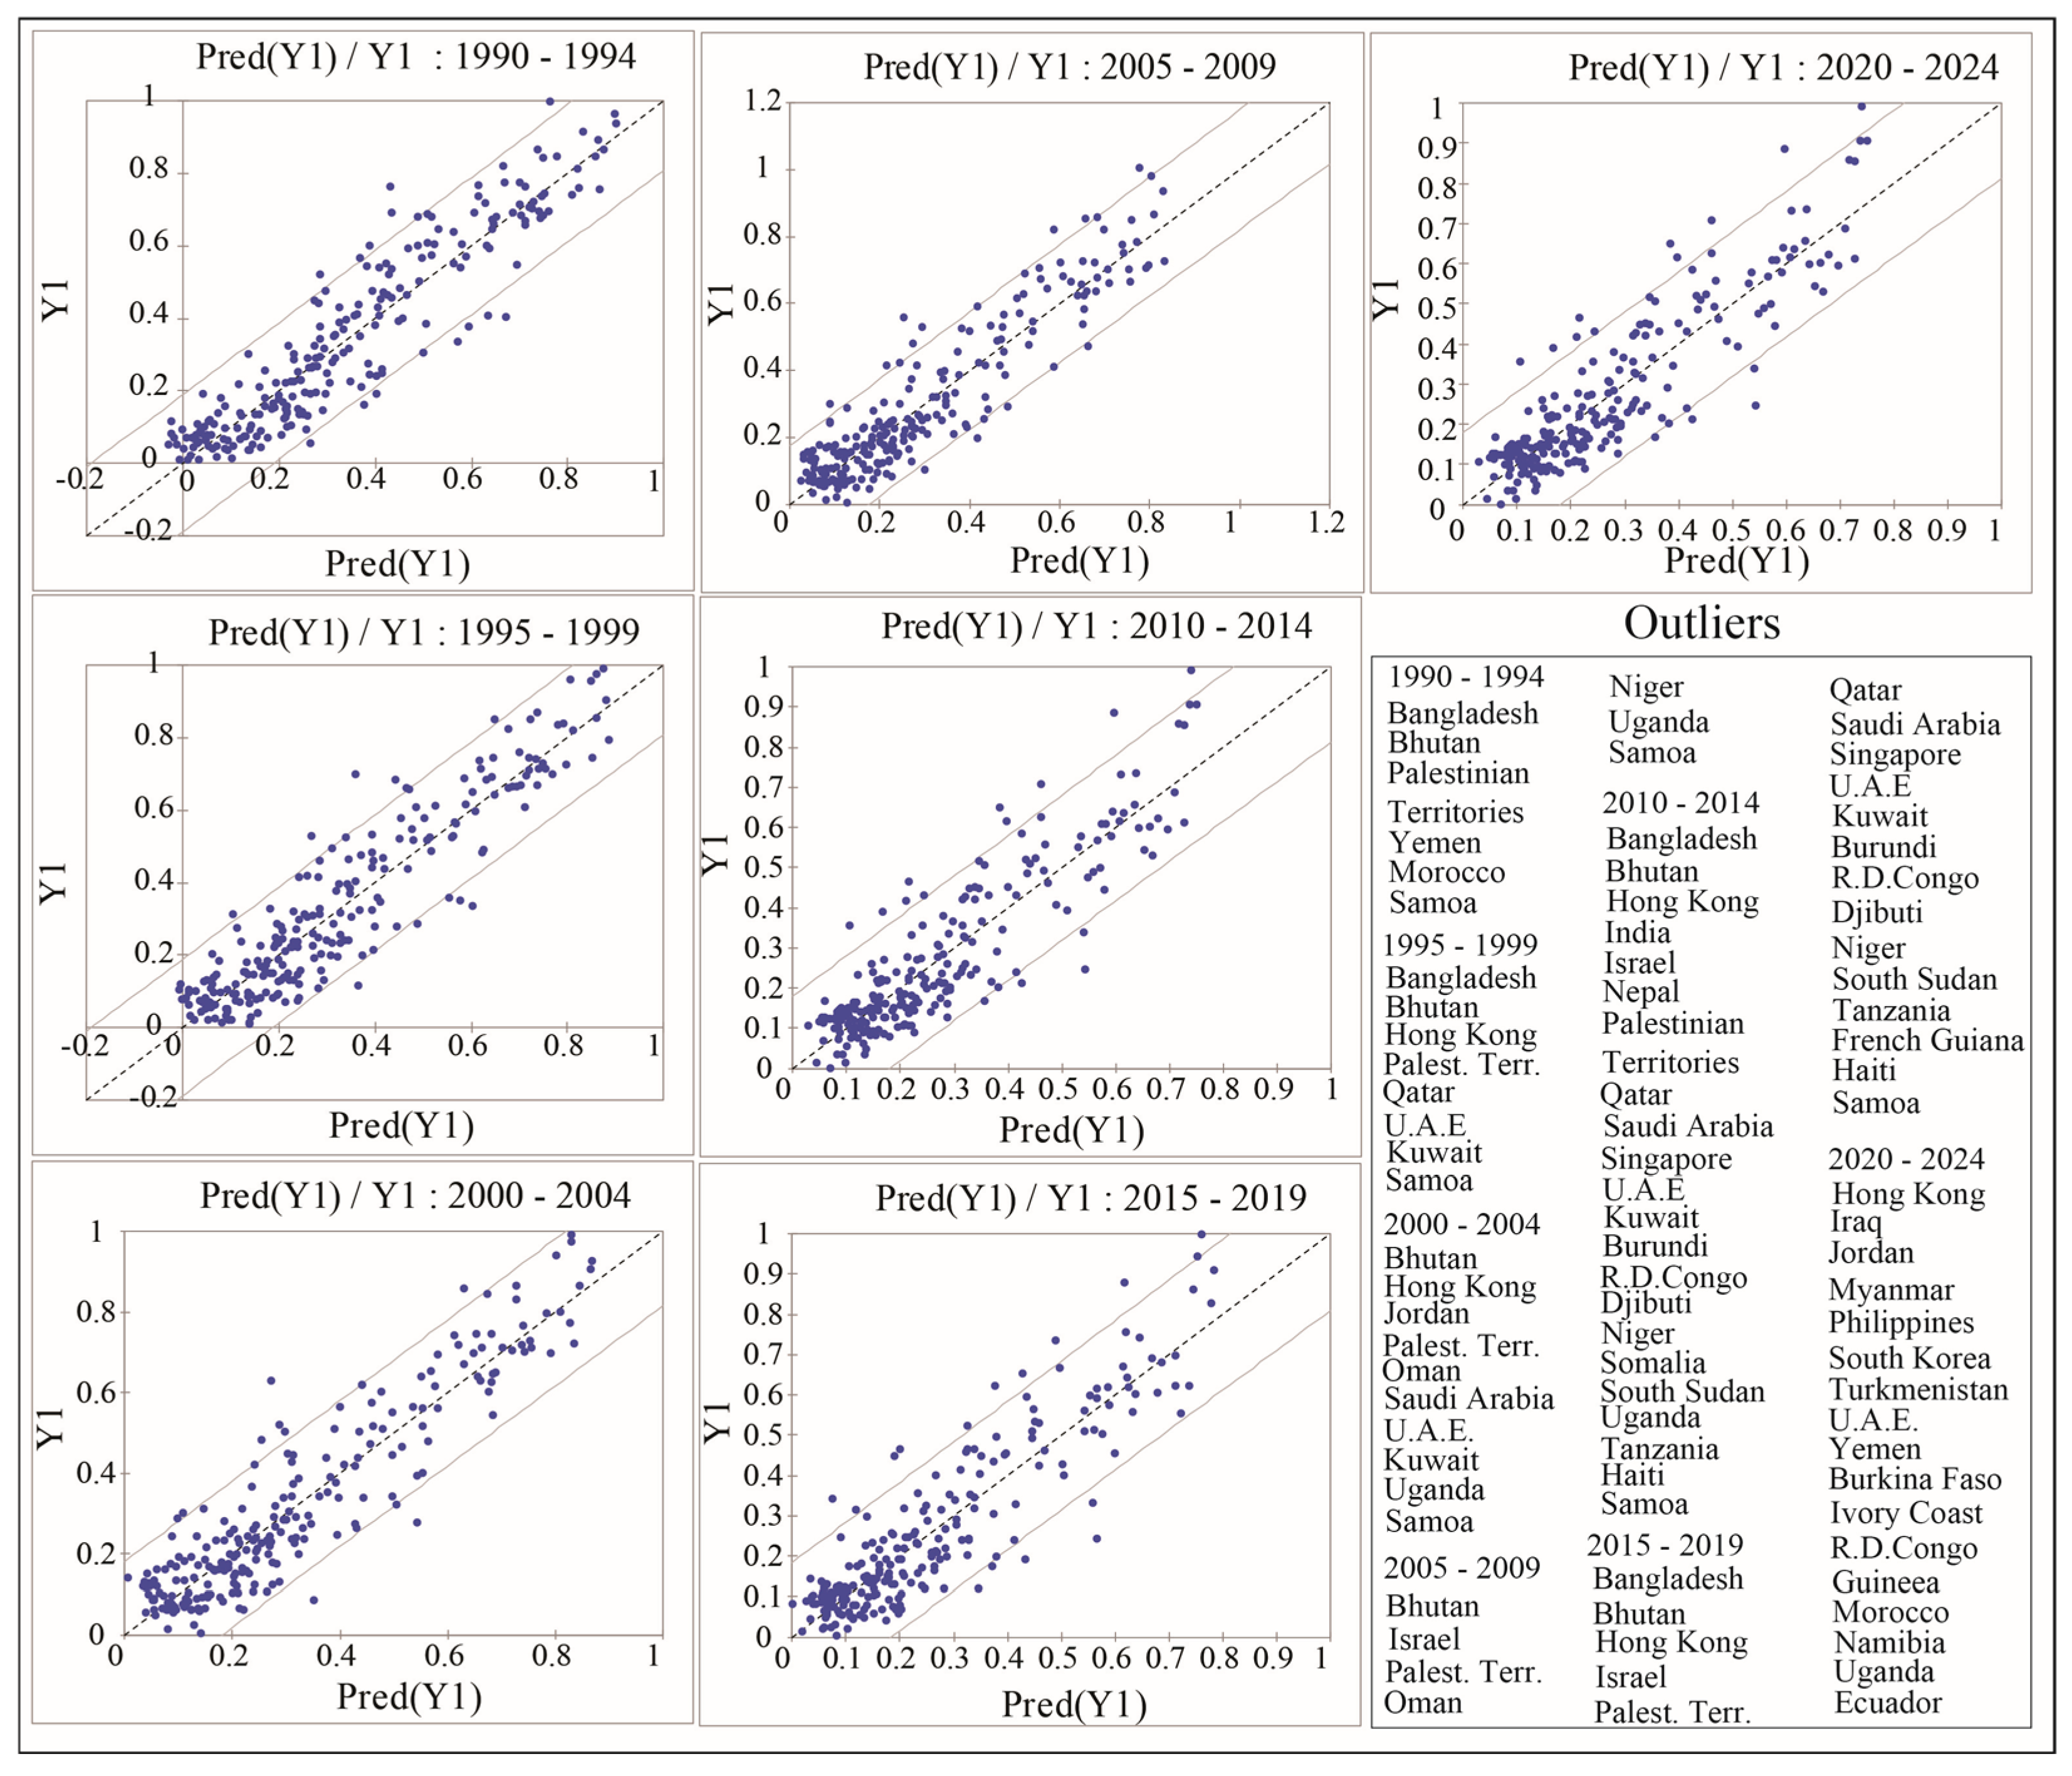

Table 1.
Variables used in the multivariate analysis.
| Variable type | Variable | Acronym | Description | Data source | Standardization |
| Dependent | Total fertility rate | TFR | TFR = [∑GF(15-19 years)....GF(45-49 years)]*0,005, where GF is general fertility by age group | [24,25] | Z score |
| Explanatory | Gross Domestic Product | GDPppa | Dollars per capita | [25,26] | Z score |
| Human Development Index | HDI | Composite index of health, education, and income. | [27] | Z score | |
| Infant Mortality | IM | Deaths (0-1 years) per 1,000 live births | [24,25] | Z score | |
| Contraceptive Prevalence | CP | % of women (aged 15-49) using contraception | [25,28] | Z score | |
| Mean Age at First Birth | MAFB | Years | [24] | Z score | |
| Urbanization Degree | UD | % of population in cities > 100,000 inhabitants | [29] | Z score | |
| Main Religion | MR | CR-Christianity; IS-Islam; AS-Asian religious Syncretism; B-Buddhism; H-Hinduism; AL-other religions | [30] | Nominal | |
| Demographic Policy | DP | Government perception of birth rate: H – high; L – low; N – neutral. | [25] | Nominal | |
| Adult Literacy Rate | ALR | % of literate population (age 15+). | [31] | Z score | |
| Gender Inequality Index | GII | UNDP index (health, empowerment, labor market, access to health services, and public functions). | [32] | Z score | |
| Democratic Freedom Index | DFI | Score based on pluralism, voting rights, and free elections. | [33,34] | Z score |
Table 2.
The correlation between TFR and explanatory variables.
| Variable | 1990-1994 | 1995-1999 | 2000-2004 | 2005-2009 | 2010-2014 | 2015-2019 | 2020-2024 |
| TFR | 1 | 1 | 1 | 1 | 1 | 1 | 1 |
| GDPppa | -0.558 | -0.562 | -0.535 | -0.568 | -0.470 | -0.618 | -0.630 |
| HDI | -0.873 | -0.869 | -0.860 | -0.855 | -0.852 | -0.839 | -0.715 |
| IM | 0.852 | 0.854 | 0.867 | 0.879 | 0.874 | 0.854 | 0.858 |
| CP | -0.874 | -0.859 | -0.850 | -0.831 | -0.806 | -0.775 | -0.749 |
| MAFB | -0.769 | -0.740 | -0.721 | -0.703 | -0.687 | -0.673 | -0.666 |
| UD | -0.288 | -0.297 | -0.259 | -0.225 | -0.191 | -0.164 | -0.157 |
| MR | 0.416 | 0.371 | 0.341 | 0.324 | 0.327 | 0.335 | 0.317 |
| ODP | 0.528 | 0.515 | 0.530 | 0.623 | 0.603 | 0.584 | 0.576 |
| ALR | -0.864 | -0.862 | -0.839 | -0.833 | -0.824 | -0.804 | -0.796 |
| GII | 0.819 | 0.783 | 0.753 | 0.875 | 0.859 | 0.832 | 0.921 |
| DFI | -0.589 | -0.579 | 0.567 | ||||
| R2 | 0.865 | 0.860 | 0.855 | 0.854 | 0.839 | 0.809 | 0.793 |
| RMSE | 0.0952 | 0.0948 | 0.0913 | 0.0877 | 0.0889 | 0.093 | 0.091 |
Disclaimer/Publisher’s Note: The statements, opinions and data contained in all publications are solely those of the individual author(s) and contributor(s) and not of MDPI and/or the editor(s). MDPI and/or the editor(s) disclaim responsibility for any injury to people or property resulting from any ideas, methods, instructions or products referred to in the content. |
© 2026 by the authors. Licensee MDPI, Basel, Switzerland. This article is an open access article distributed under the terms and conditions of the Creative Commons Attribution (CC BY) license (http://creativecommons.org/licenses/by/4.0/).
Copyright: This open access article is published under a Creative Commons CC BY 4.0 license, which permit the free download, distribution, and reuse, provided that the author and preprint are cited in any reuse.