Submitted:
15 April 2026
Posted:
27 April 2026
You are already at the latest version
Abstract
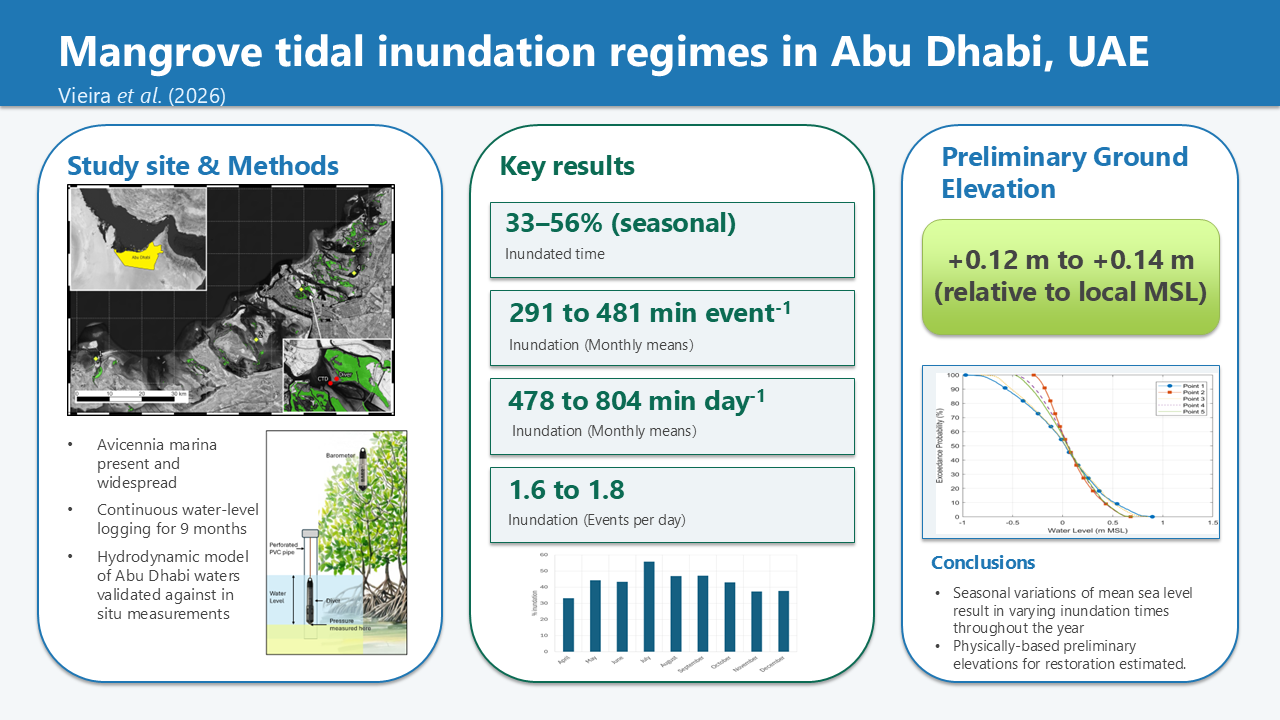
The development of healthy mangroves strongly depends on several factors including water physiochemical characteristics, soil composition and tidal inundation regimes. This paper presents a characterization of tidal inundation regimes for mangroves in Abu Dhabi, based on a field measurement campaign combined with hydrodynamic modelling. Water-level measurements were collected over a 9-month period at a site where Avicennia marina is present and widespread, capturing spring-neap cycles and seasonal variability. The results provide a detailed quantification of tidal inundation characteristics. Mangroves at the study site were inundated for approximately 33-56% of the time, depending on the season, with higher inundation durations during summer months associated with seasonal mean sea level variability. Mean inundation durations averaged 371 min per event and 620 min per day, with an average of 1.7 inundation events per day. A hydrodynamic numerical model was developed and validated against in situ measurements. Model outputs were used to spatially extend site-specific observations and derive estimates of suitable ground elevation for mangrove development, corresponding to values between +0.12 m and +0.14 m relative to local mean sea level. These findings provide a physically based framework to support mangrove restoration and conservation efforts in Abu Dhabi, where improper tidal exposure remains a key factor limiting restoration success.
Keywords:
mangrove
; restoration
; tidal inundation
; numerical modelling
1. Introduction
Mangroves act as ecosystem engineers, stabilizing the soil and creating a habitat that is exploited by a range of organisms, from microbial communities to diverse assemblages of fauna and flora. Mangrove trees are uniquely adapted to conditions that include alternating desiccation and submergence across tidal cycles, low oxygen concentrations in the water, variable and often high salinity, and high air and sea temperatures inherent to the tropics (Friis and Killiea, 2024 [1]). Furthermore, mangrove forests also play a critical role in global carbon sequestration (Alongi, 2014 [2]). It is estimated the carbon stored by mangroves globally to be more than twice the annual emissions caused by anthropogenic activities worldwide (Elwin et al., 2019 [3]). Mangrove deforestation is occurring at a rate of 1-2 % per year across the tropics, which implies that most forests may disappear within this century (Alongi, 2002). Therefore, it is important to understand, conserve and restore such valuable ecosystems.
Mangroves ecosystems represent the only evergreen forests in the United Arab Emirates (UAE), covering approximately 156 km2 of land along the coasts of the country (Friis and Killiea, 2024 [1]). The grey mangrove (Avicennia marina) is the predominant mangrove species along the coasts of the UAE and provides important nursery grounds for many fish and crustacean species, some of which are commercially exploited (Spalding et al., 2010 [5]). This mangrove species, which occupies one of the driest habitats in the world (Howari et al., 2009 [6]), has genetic signatures of selection associated with stress tolerance for both hyper salinity and extreme temperatures (Friis et al., 2024 [7]), and has an important ecological importance in the Arabian Gulf (Saenger and Blasco, 2000 [8]).
Coastal development has substantially degraded the mangrove forests, saltmarshes, seagrass meadows, oyster beds, coral reefs and other coastal ecosystems that traditionally provided invaluable ecosystem goods and services to coastal trading villages of the Arabian Gulf (Burt and Bartholomew, 2019 [9]), although there is strong evidence of recent growth in mangrove extent in the Emirates as a result of afforestation efforts (Mohan et al., 2024 [10]). Planting and maintaining mangroves in shallow areas that are exposed to low wave energy could create valuable habitat and reduce or eliminate the need for hard coastal defense structures in the Gulf (Burt and Bartholomew, 2019 [9]). However, rehabilitation in urban areas have some unique challenges associated with space constraints and the need to utilize novel spaces and habitats that may be less suitable for mangrove establishment (Friess, 2017 [11]).
Successful development of mangroves depends on several factors including physiochemical characteristics, soil composition, and tidal inundation regime. The duration and frequency of the tidal inundation are one of the critical aspects in a successful mangrove site which is often overlooked (Crase et al., 2013 [13]).
The survival of Avicennia marina in anaerobic, waterlogged sediments depends on its specialized aerial roots, or pneumatophores, which provide oxygen to the submerged root system. These roots facilitate gas exchange through surface pores called lenticels and an internal network of air spaces known as aerenchyma (Al-Khayat & Alatalo, 2021 [14]). However, this mechanism is highly vulnerable to prolonged flooding. Because oxygen diffuses much slower in water than in air, the submergence of these aerial roots effectively blocks the intake of atmospheric oxygen (Su et al., 2022 [15]). This leads to root anoxia, forcing the plant into a state of suffocation where it cannot maintain its metabolic needs. Research has shown that if water levels remain high enough to cover the pneumatophores for extended periods, it results in rapid root death and widespread mortality within the forest (Adams & Human, 2016 [16]; Scholander et al., 1955 [17]).
A recent regional analysis using machine learning identified elevation (and associated tidal inundation exposure) as a key determinant of mangrove afforestation success (Dutta Roy et al., 2025 [18]), underscoring the need for studies that directly quantify tidal suitability. Insufficient regard is often given to understanding local hydrology, topography relative to sea level, and the effects these have on soil conditions (Wodehouse and Rayment, 2019 [19]). Previous studies (Crase et al., 2013 [13]; Rogers et al., 2017 [20]; Kumbier et al, 2021 [21]; Sahana et al., 2022 [22]) found hydrological parameters to moderately explain mangrove distribution. Tidal dynamics vary substantially worldwide, with mangroves of the same species found in different tidal ranges (macro, meso and micro) and tidal classifications (diurnal, semidiurnal) (Henderson and Glamore, 2024 [23]).
Other studies correlate mangrove mortality (natural or planted) with inadequate inundation exposure (Erftemeijer and Hamerlynck, 2005 [24]; Samson and Rollon, 2008 [25]; Lee et al., 2019 [26]; Friess et al., 2022 [27]). Van Loon (2007) [28] extended the pioneering work of Watson (1928) [29] on characterizing the hydrological classification for mangroves which include inundation frequency and duration for various species in Southeast Asia.
Primavera and Esteban (2008) [30] indicate that the long-term survival rates of replanted mangroves are generally low at 10-20%. Poor survival can be mainly traced to two factors: inappropriate species and site selection. The main factor is associated with the planting sites being poorly located in the lower intertidal to subtidal zones where mangroves may not persist.
Kodikara et al. (2017) [31] indicate that rate of survival of the restoration of 1,000 to 1,200 ha of mangroves planted after the India Ocean 2004 tsunami along the coast of Sri Lanka was approximately 20%. One of the main reasons highlighted is the choice of topographic positioning. Some planting efforts were situated in the high intertidal areas and even beyond whilst others were in the low intertidal zone where tidal inundation regime was not adequate for species development and survival.
Collectively, these studies demonstrate that inappropriate topographic positioning relative to tidal inundation remains a dominant, yet preventable, cause of mangrove restoration failure, despite advances in planting techniques and species selection.
Wodehouse and Rayment (2019) [19] assessed several mangrove restoration projects at 13 sites in South-East Asia (Thailand and Philippines) and found that survival rates depend on various factors such as mangrove species, planting material (propagules, seedlings, wildlings) and ground elevation (directly related to inundation). Areas with good hydrology showed higher survival rate compared to others with partial or poor hydrological connection.
Erftemeijer et al. (2020) [32] analyzed the plantation of mangroves at an island in the UAE to protect it from coastal erosion. Planting efforts, over a 30-year period, resulted in successfully established mangrove vegetation along 6.7 km of coastline. Survival rates were approximately 26% averaged over the entire period, with best results obtained at planting sites established in artificial tidal channels excavated parallel to the causeway, ensuring appropriate tidal hydrological conditions and protection from wave exposure.
Several studies across the world have been carried out to characterize the tidal inundation characteristics in well-established mangrove areas. Avicennia marina was present in the studies listed below and only the results for this species are summarized.
A simple methodology to determine hydrological suitability for various mangrove species based on water level measurements carried out in Vietnam and Indonesia is presented in Van Loon et al (2016) [33]. It was observed that the area was subject to an average inundation of 254 min day-1 (corresponding to 18% of the time) and 219 min inundation-1.
Inundation characteristics of mangroves in Australia were investigated in Kumbier et al. (2021). Pressure transducers were deployed along several profiles at different ground elevations within an estuary. Mangroves were inundated for 15-71% of the time (corresponding to 216 to 1,022 min day-1) with 1-2 inundations per day, average inundation duration between 113-283 min inundation-1 and average inundation depths between 0.07 and 0.38 m.
Basyuni et al. (2022) [34] carried out a field investigation in North Sumatra, Indonesia, to analyze mangrove survivability in aquaculture ponds. A sensor was deployed and measured average inundations of 304 and 843 min event-1 at two ponds, respectively, with maximums of 4,203 and 13,845 min event-1. Survivability was very low at both locations due to poor hydrological conditions.
Following on the work reported in Erftemeijer et al. (2020) [32], Erftemeijer et al. (2021) [35] indicated that mangrove planting efforts in the UAE at sites that experience tidal inundation between 180-450 min day-1 (13% to 31% of the time) have been generally successful. Sites inundated for more than 500 min day-1 (35% of the time) were generally unsuccessful, apparently exceeding the mangroves’ tolerance for waterlogging, leaving them insufficient time at low tide to bring enough oxygen back into the soil through their pneumatophores for root survival.
Henderson and Glamore (2024) [23] carried out a thorough investigation of mangrove extent across different types of estuaries along the East coast of New South Wales, Australia. Results from the study indicated that inundation frequency differed at the slope limits of the mangrove extent across a profile and between various types of estuaries. However, there were commonalities in extent and inundation characteristics between sites with similar typologies. The annual inundation varied from less than 2% to nearly 80% (29 to 1,152 min day-1), and inundation frequency varied from 20 to 704 times per year (average of 0.1 to 1.9 events day-1).
The hydrological suitability of several mangrove species in restoration efforts in abandoned aquaculture ponds in Indonesia was assessed by Sidik et al. (2025) [36]. The measured average inundation regime was 342 min day-1 (24% of the time) with an inundation frequency of 1.3 events day-1 and a duration of 235 min inundation-1.
In the Arabian Gulf, extreme aridity, high evaporation rates, and seasonal steric sea-level variability introduce distinct tidal and hydroperiod dynamics that limit the transferability of inundation thresholds derived from humid or river-influenced systems (Hosseinibalam et al., 2007 [37]; Lachkar et al., 2022 [38]).
To date there is limited research on mangrove tidal inundation regimes in the UAE and in Abu Dhabi (Figure 1) in particular. Considering that knowledge generated from one location may not apply to others (Bunt, 1996 [39]) it is essential to collect location-specific information. Furthermore, location-specific measurements are important as hydrological characterization based on an open water tide gauge does not provide sufficient information to extrapolate to the specific mangrove project site due to tidal attenuation or amplification (Van Loon et al., 2016 [33]; Hughes, 2019 [40]; Kumbier, 2021 [21]; Henderson and Glamore, 2024 [23]). Existing tidal inundation studies for Avicennia marina are also limited to measurement periods of approximately 1 to 3 months which can be considered too short to assess a site’s seasonal variability.
Figure 1.
Abu Dhabi location (top left box), spatial distribution of mangroves in Abu Dhabi (source: EAD, 2025 [12]), hydrodynamic model extraction points (yellow diamonds) and location of deployed equipment (red circles, bottom right box).
Figure 1.
Abu Dhabi location (top left box), spatial distribution of mangroves in Abu Dhabi (source: EAD, 2025 [12]), hydrodynamic model extraction points (yellow diamonds) and location of deployed equipment (red circles, bottom right box).

This study aims at filling that knowledge gap and developing a preliminary adequate ground elevation for mangroves based on tidal inundation regimes across Abu Dhabi, information that would better inform mangrove restoration projects that are being widely deployed in the UAE (Rondon et al., 2023 [41]). Our findings provide quantitative thresholds for tidal conditions favorable to mangroves in the UAE, in support of local restoration initiatives that call for evidence-based site selection (EAD, 2024 [42]). The tidal levels are based on a validated hydrodynamic model covering the Abu Dhabi region including any attenuation/amplification effects due to bathymetry, bed friction and coastline geometry. The study includes a comprehensive analysis of tidal inundation regimes including the seasonal variation captured throughout the 9-month measurement period.
2. Materials and Methods
2.1. Study Area
The climate in the Gulf region is classified as arid to hyperarid. This aridity results in a significant hydrological deficit, with an excess of evaporation of approximately 2.0 m yr-1 (Lachkar et al., 2022 [38]) over precipitation, which is typically less than 150 mm of annual rainfall (Campos et al., 2020 [43]). The climate can be divided into four periods: a summer season (Jun-Sep), a fall transition (Oct-Nov), a winter season (Dec-Mar), and a spring transition (Apr-May) (Walters, 1990 [44]). Land surface temperatures can reach 50°C or more during summer days, while winter temperatures can be as low as 8°C (Patlakas et al. 2019 [45]). More specifically, temperatures recorded in the mangrove canopy at Ras Ghurab Island, Abu Dhabi, revealed annual ranges of 37°C in the canopy, 30°C on the ground level, and 25°C underground (~15 cm depth). The minimum and maximum temperatures recorded in this micro-habitat ranged from 8°C to 45°C (Friis and Killilea, 2024 [1]).
The tides in Abu Dhabi are mixed semi-diurnal (Daquan et al., 2024 [46]) with an amplitude of approximately 1 m between MLW and MHW (micro-tidal).
2.2. Field Measurements and Analysis
Water level measurements were collected at a mangrove location (Figure 1) within Abu Dhabi, UAE (Figure 1). A pressure, conductivity and temperature gauge (Van Essen CTD-Diver, hereafter referred to as “Diver”), with accuracy of ±0.5 cm and a resolution of 0.2 cm, was installed inside a perforated PVC pipe and laid on the existing ground (Figure 2). The PVC pipe was inserted into the ground and supported by steel rods. The gauge was secured and lowered with a rope to the ground level. Measurements were collected continuously at 5 min intervals throughout the measurement period from 1 April 2025 to 31 December 2025 (9 months). This duration was sufficient to capture spring-neap periods and monthly variability. The Diver ‘zero’ was defined at the installed ground surface at the deployment point (i.e., the elevation of first inundation at that point), and all inundation metrics are therefore referenced to the local ground datum. While geodetic benchmarks (e.g., national vertical datums) are required for construction control, restoration ecology often also uses a ‘biological datum’ (e.g., elevation of first seedling establishment); here we focus on the physical inundation datum while noting the value of biological calibration in future work.
Figure 1.
Schematic of Diver deployment (left) and actual photograph of site installation (right).

A barometer (Van Essen BaroDiver) was also installed at the site for subsequent atmospheric pressure correction. Rainfall contributions were negligible during the measurement period and were therefore not explicitly included in the analysis. A schematic of the deployment is presented in Figure 2. A photograph of the actual installation is also depicted in Figure 2.
A YSI EXO2 sonde (CTD) was deployed in the main mangrove internal channel (see Figure 1). The instrument was placed at an approximate depth of 3 meters and was located about 400 meters from the permanent mangrove water level station. Water level data was collected from the sonde’s depth sensor every 60 minutes during the same period. This collected water level data was subsequently used to perform the hydrodynamic model validation.
Raw pressure data from the Diver was post-processed with Matlab® scripts to correct for atmospheric pressure and calculate tidal inundation regime (inundation min per day, min per inundation, inundation frequency and inundation depth). Figure 3 illustrates how inundation parameters were calculated. An event, as described in this paper, corresponds to one high-tide cycle.
Figure 2.
Example of water level signal and inundation characteristics.

Figure 3.
Hydrodynamic model computational mesh and bathymetry.

2.3. Numerical Modelling
2.3.1. Model Setup
Version 9.0.0 of TELEMAC-2D was applied to this study. TELEMAC -2D (Hervouet, 2007 [47]) is an open-source model developed by the French National Laboratory for Hydraulics and Environment. The model is used widely for calculating hydrodynamics and coastal simulations, by using finite element methods to solve the two-dimensional shallow water equations, which can be calculated as follows:
∂h/∂t+u∙∇(h)+hdiv(u)=Sh
∂u/∂t+u∙∇(u)=-g ∂Z/∂x+Sx+1/h div(hvt ∇u)
∂v/∂t+u∙∇(v)=-g ∂Z/∂y+Sy+1/h div(hvt ∇ v)
Where h is the water depth (m), t is the time (s), g is the gravitational acceleration (ms−2), Z is the free surface elevation (m), x and y are the horizontal space coordinates (m), u and v are the velocity components (ms-1) in x and y directions, respectively, vt is the momentum coefficient (m2s−1), Sh is the source or sink of fluid (ms−1), and Sx and Sy (ms-2) are source terms in x and y directions, respectively, representing the wind, Coriolis force, bottom friction.
TELEMAC -2D was used for accurate simulations of tidal water levels within the domain presented in Figure 4. The model was run for a simulation period of 37 days from March 25th to May 1st, 2025, with a time step of 3 sec. The time series of the water levels was extracted from 1st April 2025 at 00:00 to ensure the results were not affected by the model’s spin-up period.
The hydrodynamic model was implemented to cover the Abu Dhabi coastline, approximately 200 km in length. The model has a flexible, triangular finite element mesh, allowing for increased resolution around the shoreline, channels, shallow areas and locations of interest. At the offshore boundary, the resolution of the mesh is approximately 2,000 meters and gradually refines down to 25 meters. Bathymetric information was obtained from a collection of site surveys (within Abu Dhabi) and the General Bathymetric Chart of the Oceans, GEBCO (The GEBCO_2014 Grid, http://www.gebco.net) for offshore areas. The model domain and bathymetry are presented in Figure 4.
Figure 4.
Measured (black solid line) and modelled (red dashed line) tidal water levels.

2.3.2. Model Validation
Water levels from model results were extracted at the CTD location (Figure 1). Model performance statistics were computed against the field measurements. The statistics include Bias, root mean square error (RMSE) and correlation coefficient (r). The statistics can be defined by the formulas:
Bias= mean(y)-mean(x)
RMSE=√∑i(xi-yi)2)/n
r=∑i [(xi-mean(x))(yi-mean(y))]/√(∑i [(xi-mean(x)]2 ∑i [(yi-mean(y)]2
Where x and y represent the measured and modelled values, respectively.
The comparison of water level time series depicted in Figure 5 shows good agreement between model results and measurements. Figure 6 presents the Quantile-Quantile scatter density plot of measured vs modelled water levels and associated error statistics. The correlation coefficient is 0.97, the root mean square error is 0.09 m, and the bias is 0.03 m. The statistical analysis results demonstrate the good performance of the model. Model validation was performed against the in situ record available for this study period. Other long-term tide gauges within the project area would provide an additional check on potential seasonal MSL drift and are recommended for future regional applications.
Figure 5.
Monthly total inundation (%) for the measurement period April to December 2025.

Figure 6.
Q-Q Scatter Density of Measured CTD tidal water levels against modelled tidal water levels.
Figure 6.
Q-Q Scatter Density of Measured CTD tidal water levels against modelled tidal water levels.

3. Results
3.1. Tidal Inundation Regime
The water level measurements, after atmospheric pressure correction, for the full measurement period are presented in Figure 7 (top). The figure shows that the tidal range varies throughout the measurements period with clear neap-spring tidal cycles and non-tidal influence which may be attributed to meteorological effects. It is also observed that the tidal ranges are larger during the summer months, in line with seasonal variations in the Arabian Gulf due to both atmospheric and steric effects as reported in literature (Sultan et al., 1995 [48]; Hosseinibalam et al., 2007 [37]; Ali et al., 2010 [49]).
The calculated inundation duration per event is depicted in Figure 7 (bottom). An example of long inundation events is presented in Figure 8. Two consequent events occurred on 2 and 3 of July where both high tides (smaller and larger) remained above ground elevation. Although the total inundation of the event is long, the inundation depth decreases to less than 20 cm during lower tide periods.
A summary of the tidal inundation parameters from this and other studies is presented in Table 1. In general, tidal inundation periods (in min event-1 and min day-1) of this study are larger with mean values of 371 min event-1 and 620 min day-1. There is relatively large variability with inundation events varying from 5 min to 1,060 min (17.7 h, see Figure 8). The number of inundation events per day is 1.7, as expected given the semi-diurnal tide (two high and two low tides per day) at the project site. Mangroves are inundated 43.2% of the time on average throughout the 9-month field campaign duration. Average and maximum inundation depths recorded are 15.5 and 101.3 cm, respectively.
Figure 8.
Measured water level (top) and inundation duration per event (bottom) over a 5-day period illustrating some of the larger duration events and corresponding measured water level signal.
Figure 8.
Measured water level (top) and inundation duration per event (bottom) over a 5-day period illustrating some of the larger duration events and corresponding measured water level signal.


Table 1.
Summary of tidal inundation regime at the mangrove site analysis from literature and this study.
Table 1.
Summary of tidal inundation regime at the mangrove site analysis from literature and this study.
| Reference | Inundation (Min/Mean/Max, min Event−1) | Inundation (Min/Mean/Max, min Day−1) | Inundation (Events Day−1) | Inundation (% Time) | Inundation Depth (Mean/max, cm) |
|---|---|---|---|---|---|
| Van Loon et al. (2016) | -/219/- | -/254/- | - | 18** | - |
| Kumbier et al. (2021) | -/113 to 283/- | 216 to 1,022* | 1 to 2 | 15 to 71 | 7 to 38/- |
| Erftemeijer et al. (2021) | - | -/180 to 450/- | - | 13 to 31** | - |
| Henderson and Glamore (2024) | - | 29 to 1,152* | 0.1 to 1.9 | 2 to 80 | - |
| Sidik et al. (2025) | -/235/- | -/342/- | 1.3 | 24 | - |
| This Study | 5/371/1,060 | 320/622/1,040 | 1.7 | 43.2 | 15.5/101.3 |
*calculated from % time. **calculated from min day−1.
Despite relatively high inundation durations, satellite imagery indicates that the mangroves at the study site have persisted for several decades, suggesting long-term tolerance to local hydroperiod conditions.
The relatively long measurement period enabled a monthly analysis to evaluate potential seasonal variations. Table 2 and Figure 9 present the results of the monthly tidal inundation characteristics. It can be observed that the tidal inundation varies throughout the duration of the measurements, with higher inundation times (min event-1, min day-1 and overall percentage) during summer months (July, August and September) and lower during spring (April) and winter (November/December) periods. The number of events per day only varies slightly between 1.5 and 1.8 events per day. The total inundation time ratio between the highest and lowest values is approximately 1.68 (68% increase in inundation time in July compared to April). Mean inundation depths are also larger during the summer months.
Table 1.
Summary of monthly tidal inundation regime analysis.
| Month | Inundation (Min/Mean/Max, min Event−1) | Inundation (Min/Mean/Max, min Day−1) | Inundation (Events Day−1) | Inundation (% time) | Inundation Depth (Mean/max, cm) |
|---|---|---|---|---|---|
| April | 1/291/455 | 320/478/660 | 1.7 | 33.2 | 9.2/77.2 |
| May | 7/364/1,025 | 440/638/995 | 1.7 | 44.3 | 15.2/93.3 |
| June | 15/348/560 | 385/624/905 | 1.8 | 43.3 | 16.2/99.8 |
| July | 19/481/1,060 | 460/804/1,040 | 1.7 | 55.8 | 22.6/101.3 |
| August | 11/405/940 | 520/675/880 | 1.6 | 46.9 | 16.7/80.4 |
| September | 16/414/895 | 485/678/885 | 1.6 | 47.1 | 17.1/82.3 |
| October | 9/395/870 | 470/619/815 | 1.5 | 43.0 | 15.0/83.3 |
| November | 5/323/860 | 355/537/860 | 1.7 | 37.3 | 12.5/87.4 |
| December | 4/314/1,050 | 330/541/1,005 | 1.6 | 37.6 | 13.0/90.1 |
3.2. Numerical Modelling
Time series of water levels were extracted from the hydrodynamic model at five locations across Abu Dhabi (Figure 1). Levels are shown in local Mean Sea Levels at each location. These vary across Abu Dhabi with a maximum range for the selected locations of approximately 10 cm. The probability exceedance curves for the five locations presented in Figure 10 show that the tidal ranges vary across the study area. Location 1, closer to open waters, has a larger tidal range (~1.9 m), whilst locations within shallow areas have a lower range (~1.0 m). This is mainly due to the uneven tidal propagation and distortion across the area caused by complex systems of islands, shoals and channels. However, the 50% exceedance level is similar for all locations.
Figure 6.
Exceedance probability of water levels for each of the five extraction locations.

4. Discussion
4.1. Numerical Modelling
Avicennia marina trees experience different inundation regimes depending on estuarine typology or slope position (Henderson and Glamore, 2024 [23]) and therefore a direct comparison across different regions or even areas within the same region may not be conclusive. Whilst previous studies provide variables related to tidal inundation, some variables are missing and therefore not available for direct comparison purposes of each parameter analyzed in this study. The measured number of inundation events per day, total duration of inundation and inundation depths are in line with existing literature. Beyond total inundation time, the maximum continuous exposure (longest dry spell) may be a critical constraint for sapling establishment in arid environments due to desiccation risk. Longer tidal periods can mitigate soil hypersalinity, whereas longer dry exposures may intensify salt stress via surface crusting. Framing inundation thresholds within this tide–salinity nexus is therefore essential when translating physical thresholds into restoration guidance and shall be assessed in future studies.
Based on the average of the full measurement period, the inundation durations (min per event or min per day) obtained are exceeded when compared to the results of some previous studies which were conducted in other geographical areas with different tidal regimes, presence of rainfall and associated river flow effects, and limited measurement duration (maximum of 1 to 3 months). In Kumbier et al. (2021) [21] although the average inundation durations are lower than those measured in this study, the total inundation duration in some areas is even greater (up to 71% of the time). Henderson and Glamore (2024) [23] also reported total inundation of up to 80%.
It is important to highlight that satellite imagery shows that the mangroves at the project area were already present since the 1980’s. It is therefore expected that the Mean Sea Level was approximately 12 cm lower than present day (assuming a representative long-term rate of sea level rise of 0.3 cm per year for the Arabian Gulf, based on the estimates presented in Al-Subhi and Abdulla, 2021 [50], over a 40-year period) when these were established. Based on this, the overall inundation would be 32.7% (compared to the measured 43.2%).
The findings of the current study are in line with previous studies that found that mangroves generally occur between mean sea level and mean high water (Clarke and Myerscough, 1993 [51]; Henderson and Glamore, 2024 [23]) which indicates the mangroves are inundated less than 50% of the time.
The data was collected for a 9-month period which covered most of the year. It can clearly be observed in Table 2 that during summer months, July to September, inundation periods are larger which corresponds with reported seasonal positive variation of the Mean Sea Level (Hosseinbalam et al., 2007 [37]; Ali et al 2010 [49]; UKHO, 2025 [52]). The inundation times (in min day-1 and overall) increased by around 68% from April to July. Mean inundation depths are also increased during summer due to the increase in mean sea level. The Avicennia marina has previously revealed patterns of adaptive variability correlating with a temperature gradient in Arabian mangrove populations (Friis et al., 2021 [53]).
Hosseinbalam et al., 2007 [37] and Ali et al 2010 [49] estimate that sea level annual variability in the Gulf is ±15 cm based on analysis of long-term tide level records. The seasonal variation inundation times presented in this study agrees well with the results of those studies where an increase of 15 cm in mean sea level during summer results in increased inundation periods.
4.2. Ground Elevation Guidance for Mangrove Development
An analysis was carried out to define the local ground elevation that results in a total inundation period of 38.8% of the time corresponding to the average of the months of April and May, where seasonal variation of MSL in the Arabian Gulf is close to zero (Ali et al., 2010 [49]; Hosseinbalam et al., 2007 [37]). The resulting level is between +0.12 m and +0.14 mMSL across Abu Dhabi based on the site-specific measurements. This consistency suggests that the thresholds derived from our study site are potentially transferable across Abu Dhabi, subject to local geomorphology and hydrological connectivity. This corresponds to the potential suitable ground elevation for mangrove development based on the information collected at a single site. Given the wide range of inundation times reported in existing literature, it is likely that mangroves can survive at different levels than those presented in this study and as observed in the field, mangroves survive within a wider band of elevations. Importantly, this narrow elevation band should be interpreted as a provisional target zone inferred from a healthy reference site and a representative seasonal baseline (April–May). It does not necessarily define the full survival envelope of Avicennia marina across Abu Dhabi. Occurrence outside the target band may reflect stressed persistence, local geomorphic controls (e.g., drainage/connectivity), or site-specific adaptation; distinguishing ‘survival range’ from ‘optimal growth range’ will require coupling elevation–hydroperiod metrics with independent indicators of vegetation condition (e.g., canopy density) in future work.
Because restoration projects must remain effective over decadal time scales, the elevation thresholds derived here should be interpreted within a ‘future proofing’ context: any sustained rise in mean sea level will shift hydroperiod exposure at fixed ground elevations and may therefore alter the suitability band for planting over the project life.
The hydrodynamic model allowed us to extend the single-site findings across the region. Areas inside the Abu Dhabi channels (further away from the open sea) have slightly shorter inundation periods at the optimal elevation than eastern areas (due to larger tidal range or different bathymetry), but overall, the required hydroperiod band is consistent with the field site’s range. Therefore, the values presented above can be adopted at a preliminary stage of restoration projects when site specific data is not yet available.
5. Conclusions
This work presents tidal inundation regimes in a healthy mangrove area in Abu Dhabi, UAE. A combination of field data and a hydrodynamic model was adopted to estimate potential suitable ground elevation for mangrove development in support of conservation and restoration actions.
Data was continuously measured over a relatively long period of 9 months covering multiple neap-spring cycles and seasonal variations of sea level and associated inundation characteristics. The field study established that healthy Avicennia marina in Abu Dhabi, at the study site, endures tidal inundations of approximately 33 to 56% of the time depending on the time of the year, with larger inundation times associated with the summer period.
Because field observations were obtained at a single site, spatial variability in mangrove hydroperiod across Abu Dhabi cannot be fully resolved from observations alone; the regional interpretation therefore relies on the model framework and should be corroborated by additional monitoring locations. A hydrodynamic model was therefore developed and calibrated to evaluate tidal propagation across the area of interest. It was found that the tidal range is attenuated at some of the inner channel areas away from the open sea. However, there are relatively small differences in Mean Sea Level at the various locations within Abu Dhabi. An analysis was carried out to estimate the ground elevation corresponding to the measured inundation periods.
Based on single site observations and regional hydrodynamic modelling, a preliminary elevation target zone (approximately +0.12 to +0.14 m relative to local MSL) is proposed as an initial screening guide. Given coastline heterogeneity (e.g., sheltered lagoons vs. exposed channels) and potential interannual sea level variability, these thresholds should be treated as a baseline that requires multi-site and multi-year validation before being applied as a uniform rule for the full Abu Dhabi coastline. This can be adopted as an initial estimate at early stages of restoration/conservation projects when site-specific data is not yet available.
From an implementation perspective, it is rarely feasible to achieve centimetric elevation control over large restoration footprints using conventional construction equipment. We therefore recommend using the derived elevation as a target accompanied by an explicit tolerance (buffer) band to support constructability and uncertainty management. In practice, the buffer should be refined per project based on survey/control capability, expected consolidation, and local hydrological connectivity. Accordingly, we present the +0.12 to +0.14 m MSL range as a preliminary target that should be applied with an engineered tolerance and verified through monitoring of establishment outcomes.
Furthermore, because restoration projects must remain effective over decadal time scales, the elevation thresholds derived here should be interpreted within a ‘future proofing’ context: any sustained rise in mean sea level will shift hydroperiod exposure at fixed ground elevations and may therefore alter the suitability band for planting over the project life
The study included measurements at a single site. It is known that mangroves thrive in different conditions and therefore additional data at other healthy mangrove sites will be required to further validate the findings of this study. Whilst this study is limited to the adequacy of ground elevation, it is important to highlight that adequate hydrological conditions, including the presence of tidal channels, are also met for successful development of mangroves. Additionally, other physiochemical parameters such as temperature, salinity, and soil composition shall also be collected to provide a broader understanding of healthy mangrove sites.
By explicitly linking tidal inundation regimes to ground elevation suitability, this study provides a practical framework for integrating hydrodynamic evidence into mangrove restoration planning in arid, micro-tidal environments.
Author Contributions
F. Vieira: Funding acquisition, Conceptualization, Methodology, Investigation, Visualization, Formal Analysis, Writing - original draft. T. Johnson: Funding acquisition, Investigation, Formal Analysis, Writing – Review & Editing. M. Payne: Methodology, Visualization, Formal Analysis, Writing - original draft. J. Burt: Funding acquisition, Investigation, Writing – Review & Editing. G. Cavalcante: Funding acquisition, Conceptualization, Methodology, Investigation, Writing – Review & Editing.
Funding
This work was funded by Geosyntec Consultants (grant number TAC24-205). G.H. Cavalcante thanks CNPq (National Council for Scientific and Technological Development) for the research grant number 306370/2023-9. This research was also supported by grant XR016 to Mubadala ACCESS from the Mubadala Foundation, and their support is greatly appreciated.
Data Availability Statement
Dataset available on request from the authors.
Acknowledgments
The authors acknowledge the outstanding support of Muballa Arabian Center for Climate and Environmental Sciences for providing the logistics support for the fieldwork activities. The anonymous reviewers of the first versions of this publication are kindly acknowledged for their comments. The authors also acknowledge the Environment Agency - Abu Dhabi, for granting research permits to conduct this study.
Conflicts of Interest
The authors declare no conflicts of interest.
Abbreviations
The following abbreviations are used in this manuscript:
| MHW | Mean high Water |
| MLW | Mean Low Water |
| MSL | MSL |
| UAE | United Arab Emirates |
References
- Friis, G.; Killilea, M.E. Mangrove Ecosystems of the United Arab Emirates. In A Natural History of the Emirates; Burt, J.A., Ed.; Springer: Cham, 2024. [Google Scholar] [CrossRef]
- Alongi, D.M. Carbon cycling and storage in mangrove forests. Annu. Rev. Mar. Sci. 2014, 6, 195–219. [Google Scholar] [CrossRef]
- Elwin, A.; Bukoski, J.J.; Jintana, V.; Robinson, E.J.Z.; Clark, J.M. Preservation and recovery of mangrove ecosystem carbon stocks in abandoned shrimp ponds. Sci. Rep. 2019, 9, 18275. [Google Scholar] [CrossRef] [PubMed]
- Alongi, D.M. Present state and future of the world’s mangrove forests. Env. Conserv. 2002, 29, 331–349. [Google Scholar] [CrossRef]
- Spalding, M.; Kainuma, M.; Collins, L. World Atlas of Mangroves, 2010, 1st ed.; Taylor and Francis: London, UK.
- Howari, F.M.; Jordan, B.R.; Bouhouche, N.; Wyllie-Echeverria, S. Field and Remote-Sensing Assessment of Mangrove Forests and Seagrass Beds in the Northwestern Part of the United Arab Emirates. J. Coast. Res. 2009, 25, 48–56. [Google Scholar] [CrossRef]
- Friis, G.; Smith, E.G.; Lovelock, C.E.; Ortega, A.; Marshell, A.; Duarte, C.M.; Burt, J.A. Rapid diversification of grey mangroves (Avicennia marina) driven by geographic isolation and extreme environmental conditions in the Arabian Peninsula. Mol. Ecol. 2024, e17260. [Google Scholar] [CrossRef]
- Saenger, P.; Blasco, F. The mangrove resources of the UAE with particular emphasis on those of Abu Dhabi Emirate. In Proceedings of the 2nd Arab International Conference and Exhibition on Environmental Biotechnology in Abu Dhabi Coastal Habitats (Abu Dhabi, UAE, 2000; pp. 58–69. [Google Scholar]
- Burt, J.A.; Bartholomew, A. Towards more sustainable coastal development in the Arabian Gulf: Opportunities for ecological engineering in an urbanised seascape. Mar. Pollut. Bull. 2019, 142, 93–102. [Google Scholar] [CrossRef]
- Mohan, M.; Dutta Roy, A.; Montenegro, J.F.; Watt, M.S.; Burt, J.A.; Shapiro, A.; Ouerfelli, D.; Daniel, R.; de-Miguel, S.; Ali, T.; et al. Mangrove forest regeneration age map and drivers of restoration success in Gulf Cooperation Council countries from satellite imagery. Remote Sens. Appl. Soc. Environ. 2024, 36, 101345. [Google Scholar] [CrossRef]
- Friess, D.A. Mangrove rehabilitation along urban coastlines: A Singapore case study. Reg. Stud. Mar. Sci. 2017, Volume 16, 279–289. [Google Scholar] [CrossRef]
- EAD (Environmental Agency of Abu Dhabi) Marine Protected Areas. 2025. Available online: https://edp.ead.ae.
- Crase, B.; Liedloff, A.; Vesk, P.A.; Burgman, M.A.; Wintle, B.A. Hydroperiod is the main driver of the spatial pattern of dominance in mangrove communities. Glob. Ecol. Biogeogr. 2013, 22, 806–817. [Google Scholar] [CrossRef]
- Al-Khayat, J.A.; Alatalo, J.M. Relationship Between Tree Size, Sediment Mud Content, Oxygen Levels, and Pneumatophore Abundance in the Mangrove Tree Species Avicennia marina (Forssk.) Vierh. J. Mar. Sci. Eng. 2021, 9(1), 100. [Google Scholar] [CrossRef]
- Su, B.-Y.; Wang, Y.-S.; Sun, C.-C. Response adaptive mechanisms of three mangrove (Avicennia marina, Aegiceras corniculatum, and Bruguiera gymnorrhiza) plants to waterlogging stress revealed by transcriptome analysis. Front. Mar. Sci. 2022, 9. [Google Scholar] [CrossRef]
- Adams, J.B.; Human, L.R.D. Investigation into the mortality of mangroves at St. Lucia Estuary. South Afr. J. Bot. 2016, 107, 121–128. [Google Scholar] [CrossRef]
- Scholander, P.F.; van Dam, L.; Scholander, S.I. Gas exchange in the roots of mangroves. Am. J. Bot. 1955, 42(1), 92–98. [Google Scholar] [CrossRef]
- Dutta-Roy, A.; Mohan, M.; Hendy, I.; AlMealla, R.; Watt, M.S.; Burt, J.A.; Torres-Florez, J.P.; Almansoori, A.; Alzahlawi, N.; Abdullah, M.; et al. Optimizing mangrove afforestation site selection in gulf cooperation council nations using remote sensing and machine learning. Sci. Total Environ. 2025, 988, 179805. [Google Scholar] [CrossRef] [PubMed]
- Wodehouse, D.C.J.; Rayment, M.B. Mangrove area and propagule number planting targets produce sub-optimal rehabilitation and afforestation outcomes. Estuar. Coast. Shelf Sci. 2019, 222, 91–102. [Google Scholar] [CrossRef]
- Rogers, K.; Lymburner, L.; Salum, R.; Brooke, B.P.; Woodroffe, C.D. Mapping of mangrove extent and zonation using high and low tide composites of Landsat data. Hydrobiologia 2017, 803, 49–68. [Google Scholar] [CrossRef]
- Kumbier, K.; Hughes, M.G.; Rogers, K.; Woodroffe, C.D. Inundation characteristics of mangrove and saltmarsh in micro-tidal estuaries. Estuar. Coast Shelf Sci. 2021, 261, 107553. [Google Scholar] [CrossRef]
- Sahana, M.; Areendran, G.; Sajjad, H. Assessment of suitable habitat of mangrove species for prioritizing restoration in coastal ecosystem of Sundarnam biosphere reserve. India Sci. Rep. 2022, 12, 20997. [Google Scholar] [CrossRef]
- Henderson, B.; Glamore, W. Mangrove extent reflects estuarine typology and lifecycle events. Estuar Coast Shelf Sci. 2024, 304, 108813. [Google Scholar] [CrossRef]
- Erftemeijer, P.L.A.; Hamerlynck, O. Die-Back of the mangrove Heritiera littoralis Dryand in the Rufiji Delta (Tanzania) following El Nino floods. J. Coast. Res. 2005, 42, 228–235. [Google Scholar]
- Samson, M.S.; Rollon, R.N. Growth performance of planted mangroves in the Philippines: Revisiting forest management strategies. Ambio 2008, 37, 234–240. [Google Scholar] [CrossRef]
- Lee, S.Y.; Hamilton, S.; Barbier, E.B.; Primavera, J.; Iii, R.R.L. Better restoration policies are needed to conserve mangrove ecosystems. Nat. Ecol. Evol. 2019. [Google Scholar] [CrossRef]
- Friess, D.A.; Gatt, Y.M.; Ahmad, R.; Brown, B.M.; Sidik, F.; Wodehouse, D. Achieving ambitious mangrove restoration targets will need a transdisciplinary and evidence-informed approach. One Earth 2022, 5, 456–460. [Google Scholar] [CrossRef]
- Van Loon, A.F.; Dijksma, R.; van Mensvoort, M.E.F. Hydrological classification in mangrove areas: A case study in Can Gio. Vietnam. Aquat. Bot. 2007, 87, 80–82. [Google Scholar] [CrossRef]
- Watson, J.G. Mangrove Forests of the Malay Peninsula, 6. In Malayan For. Rec.; 1928. [Google Scholar]
- Primavera, J.H.; Esteban, J.M.A. A review of mangrove rehabilitation in the Philippines: Successes, failures and future prospects. Wetl. Ecol. Manag. 2008, 16, 345–358. [Google Scholar] [CrossRef]
- Kodikara, K.A.S.; Mukherjee, N.; Jayatissa, L.P.; Dahdouh-Guebas, F.; Koedam, N. Have mangrove restoration projects worked? An in-depth study in Sri Lanka. Restor. Ecol. 2017, 25(Issue 5), 705–716. [Google Scholar] [CrossRef]
- Erftemeijer, P.L.A.; Agastian, T.; Yamamoto, H.; Cambridge, M.L.; Hoekstra, R.; Toms, G.; Ito, S. Mangrove planting on dredged material: Three decades of nature-based coastal defence along a causeway in the Arabian Gulf. Mar. Freshw. Res. 2020, 71(9), 1062–1072. [Google Scholar] [CrossRef]
- Van Loon, A.F.; Te Brake, B.; Van Huijgevoort, M.H.J.; Dijksma, R. Hydrological classification, a practical tool for mangrove restoration. PLoS ONE 2016, 11, 1–26. [Google Scholar] [CrossRef] [PubMed]
- Basyuni, M.; Amelia, R.; Sryanto, D.; Susetya, I.E.; Bimantara, Y. Empowerment of Abandoned Ponds for Sustainable Mangrove Rehabilitation Activities in Percut Sei Tuan, Deli Serdang, Indonesia. J. Sylva Indones. 2022, Vol. 05(02), 137–147. [Google Scholar] [CrossRef]
- Erftemeijer, P.; Ito, S.; Yamamoto, H. Creating mangrove habitat for shoreline protection: Working with Nature in the Arabian Gulf. Terra Et. Aqua 2021, 162, 16–27. [Google Scholar]
- Sidik, F.; Basyuni, M.; Pradisty, N.A.; Hanintyo, R.; Widagti, N.; Priyono, B.; Amelia, R.; Macklin, P.; Surana, N.; Slamet, B. Hydrological suitability for mangrove species in restored mangroves in abandoned ponds. Aquat. Bot. 2025, 199, 103873. [Google Scholar] [CrossRef]
- Hosseinibalam, F.; Hassanzadeh, S.; Kiasatpour, A. Interannual variability and seasonal contribution of thermal expansion to sea level in the Persian Gulf. Deep-Sea Res. Part I 2007, 54, 1474–1485. [Google Scholar] [CrossRef]
- Lachkar, Z.; Mehari, M.; Lévy, M.; Paparella, F.; Burt, J.A. Recent expansion and intensification of hypoxia in the Arabian Gulf and its drivers. Front. Mar. Sci. 2022, 9. [Google Scholar] [CrossRef]
- Bunt, J.S. Mangrove Zonation: An Examination of Data from Seventeen Riverine Estuaries in Tropical Australia. Ann. Bot. 1996, 78, 333–341. [Google Scholar] [CrossRef]
- Hughes, M.G.; Rogers, K.; Wen, L. Saline wetland extents and tidal inundation regimes on a micro-tidal coast, New South Wales, Australia. Estuar. Coast Shelf Sci. 2019. [Google Scholar] [CrossRef]
- Rondon, M.; Ewane, E.B.; Abdullah, M.M.; Watt, M.S.; Blanton, A.; Abulibdeh, A.; Burt, J.A.; Rogers, K.; Ali, T.; Reef, R.; et al. Remote sensing-based assessment of mangrove ecosystems in the Gulf Cooperation Council countries: A systematic review [Systematic Review]. Front. Mar. Sci. 2023, 10. [Google Scholar] [CrossRef]
- Environment Agency - Abu Dhabi (EAD), the Ministry of Climate Change and Environment and Emirate Nature - WWF, 2024, Mangrove Restoration Guidelines for the United Arab Emirates.
- Campos, E.J.D.; Gordon, A.L.; Kjerfve, B.; Vieira, F.; Cavalcante, G. Freshwater budget in the Persian (Arabian) Gulf and exchanges at the Strait of Hormuz. PLoS ONE 2020, 15(5), e0233090. [Google Scholar] [CrossRef]
- Walters, K. The Persian Gulf Region, a climatological study. Technical report, 1990; United States Air Force: Asheville, NC. [Google Scholar]
- Patlakas, P.; Stathopoulos, C.; Flocas, H.; Kalogeri, C.; Kallos, G. Regional climatic features of the Arabian Peninsula. Atmos 2019, 10(4), 220. [Google Scholar] [CrossRef]
- Daquan, G.; Peng, Z.; Jingyi, M.; Panagiotis, V.; George, K.; Hamed, A.; Ibrahim, H. Seasonal variation and fundamental characteristics of baroclinic tides in the Arabian Gulf. Front. Mar. Sci. 2024, 11, 2296–7745. [Google Scholar] [CrossRef]
- Hervouet, J.-M. Hydrodynamics of free surface flows: Modelling with the finite element method; John Wiley & Sons: Chichester, 2007. [Google Scholar]
- Sultan, S.A.R.; Ahmad, F.; Elghribi, N.M.; Al-Subhi, A.M. An analysis of Arabian Gulf monthly mean sea level, 1995. Cont. Shelf Res. 1995, Vol. 15(No. 11/12), 1471–1482. [Google Scholar] [CrossRef]
- Ali, Q.; Hawkes, P.; Denamiel, C. The Seasonal Variation of Mean Sea Level in the Arabian Gulf. 2nd International Conference on Coastal Zone Engineering Management (Arabian Coast), Muscat, Oman, November 1-3, 2010, ISSN 2219-3596. [Google Scholar]
- Al-Subhi, A.M.; Abdulla, C.P. Sea-Level Variability in the Arabian Gulf in Comparison with Global Oceans. Remote Sens. 2021, 13(22), 4524. [Google Scholar] [CrossRef]
- Clarke, P.J.; Myerscough, P.J. The intertidal distribution of the grey mangrove (Avicennia marina) in southeastern Australia: The effects of physical conditions, interspecific competition, and predation on propagule establishment and survival. Aust. J. Ecol. 1993, 18, 307–315. [Google Scholar] [CrossRef]
- United Kingdom Hydrographic Office (UKHO). Admiralty Tide Tables – Indian Ocean, NP203. 2025; Volume 3. [Google Scholar]
- Friis, G.; Vizueta, J.; Smith, E.G.; Nelson, D.R.; Khraiwesh, B.; Qudeimat, E.; Salehi-Ashtiani, K.; Ortega, A.; Marshell, A.; Duarte, C.M.; et al. A high-quality genome assembly and annotation of the gray mangrove, Avicennia marina. G3 Genes|Genomes|Genetics 2021, 11(1). [Google Scholar] [CrossRef]
Disclaimer/Publisher’s Note: The statements, opinions and data contained in all publications are solely those of the individual author(s) and contributor(s) and not of MDPI and/or the editor(s). MDPI and/or the editor(s) disclaim responsibility for any injury to people or property resulting from any ideas, methods, instructions or products referred to in the content. |
© 2026 by the authors. Licensee MDPI, Basel, Switzerland. This article is an open access article distributed under the terms and conditions of the Creative Commons Attribution (CC BY) license.
Copyright: This open access article is published under a Creative Commons CC BY 4.0 license, which permit the free download, distribution, and reuse, provided that the author and preprint are cited in any reuse.


