Submitted:
20 April 2026
Posted:
27 April 2026
You are already at the latest version
Abstract
This study aimed to map the cerebrospinal fluid (CSF) molecular landscape across distinct stages of tuberculosis progression and to identify multi-omics signatures associated with tuberculous meningitis (TBM). Integrated proteomic and metabolomic profiling of CSF from 17 patients representing three disease stages: pulmonary tuberculosis (TB), hematogenous disseminated tuberculosis (HDTB), and disseminated tuberculosis with concomitant tuberculous meningitis (HDTB+TBM) were performed. Quantitative proteomics and non-targeted metabolomics were combined with pathway enrichment and network-based analyses to delineate stage-specific molecular alterations. CSF multi-omics profiling revealed modest molecular changes between TB and HDTB, but a marked and coordinated remodeling during the transition from HDTB to TBM. Compared with the HDTB+TBM group, the TB group exhibited 546 upregulated and 410 downregulated proteins, together with 80 differentially abundant metabolites. Integrated analyses converged on glycolysis/gluconeogenesis, pentose phosphate metabolism, and extensive O- and N-glycan biosynthesis pathways, indicating coupled metabolic and glycosylation rewiring during meningeal involvement. Six proteins (ENO2, LDHB, GALNT7, MAN1C1, PGD, and B4GALT1) emerged as a biologically coherent signature distinguishing TBM from non-meningeal tuberculosis. This study maps the molecular trajectory from tuberculosis to disseminated disease and tuberculous meningitis, identifying TBM as a distinct neuro-immune-metabolic state and providing a framework for mechanism-informed biomarker development.
Keywords:
cerebrospinal fluid
; tuberculous meningitis
; proteomics
; metabolomics
1. Introduction
Tuberculosis (TB) remains a major global health burden, with an estimated 10.8 million new cases and approximately 1.25 million deaths worldwide in 2024, according to the World Health Organization [1]. Beyond pulmonary infection, Mycobacterium tuberculosis can disseminate hematogenously to extrapulmonary sites, including the central nervous system, leading to tuberculous meningitis (TBM), the most severe and life-threatening form of tuberculosis [2]. TBM is characterized by rapid clinical deterioration, profound neurological injury, and high mortality, particularly among individuals co-infected with HIV, in whom mortality rates may approach 50% [3].Despite its clinical importance, TBM remains difficult to diagnose at an early stage [4,5]. Clinical manifestations are heterogeneous and vary across age groups, often overlapping with other infectious and inflammatory neurological disorders [6]. Conventional cerebrospinal fluid (CSF)-based diagnostic approaches, including acid-fast staining and culture, suffer from low sensitivity and long turnaround times. Molecular assays such as Xpert MTB/RIF Ultra have improved detection sensitivity but cannot reliably exclude TBM when results are negative and remain limited by cost and accessibility [7]. As a result, TBM diagnosis often relies on a combination of imperfect tests, contributing to delayed treatment and poor outcomes. These challenges highlight a fundamental gap: current diagnostic strategies largely focus on detecting established TBM rather than understanding or identifying the molecular transitions that precede meningeal involvement.
Recent advances in omics technologies offer new opportunities to address this gap. Proteomics enables systematic quantification of protein abundance and pathway-level alterations, providing a powerful approach for biomarker discovery and mechanistic insight. Although proteomic analysis of CSF has historically been challenging due to low protein concentrations and a wide dynamic range, improvements in automated sample preparation and high-resolution mass spectrometry have made large-scale, quantitative CSF proteomics increasingly feasible. In parallel, metabolomics captures downstream metabolic states that reflect host-pathogen interactions, immune activation, and tissue injury. Compared with nuclear magnetic resonance-based methods, mass spectrometry-based metabolomics offers superior sensitivity and coverage, allowing detection of diverse metabolites within a single analysis [8,9,10].
Previous studies have applied proteomic or metabolomic approaches to TBM, primarily through comparisons between TBM patients and healthy or non-infectious controls [11,12,13,14]. Proteomic studies using isotope-labeling relative and absolute quantification techniques (iTRAQ)-based strategies have identified individual candidate biomarkers, such as apolipoprotein B (ApoB), with potential diagnostic value [15,16]. Metabolomic investigations have revealed alterations in amino acids, lipids, carbohydrates, and nucleosides, and highlighted pathways such as tryptophan metabolism that correlate with TBM severity and prognosis [11,17]. While these studies provide valuable insights, they largely treat TBM as a discrete disease state and do not capture the dynamic molecular changes that accompany progression from pulmonary tuberculosis to disseminated disease and eventual meningeal involvement.
Metabolomics has also been applied to identify biomarkers for diseases such as Alzheimer’s disease [18], Parkinson’s disease [19], and epilepsy [20], and it has provided deeper insights into potential metabolites for TBM [21,22,23]. For example, tryptophan levels in the cerebrospinal fluid of TBM patients have been shown to correlate with prognosis, indicating that tryptophan metabolism plays an important role in the pathogenesis of TBM [24]. Other studies have identified various amino acids, carbohydrates, lipids, and nucleosides as potential biomarkers for diagnosing this disease and understanding its pathogenesis [25].
In this study, we performed integrated proteomic and metabolomic profiling of CSF from patients spanning three clinically defined stages of tuberculosis: pulmonary TB, hematogenous disseminated TB (HDTB), and disseminated TB with concomitant TBM. By combining quantitative multi-omics analysis with pathway enrichment and network-based integration, we aimed to map the molecular continuum from tuberculosis to disseminated disease and tuberculous meningitis. This approach provides insight into the neuro-immune-metabolic remodeling associated with meningeal involvement and identifies candidate multi-omics signatures with potential diagnostic and mechanistic relevance.
2. Materials and Methods
2.1. Participants and Cerebrospinal Fluid Collection
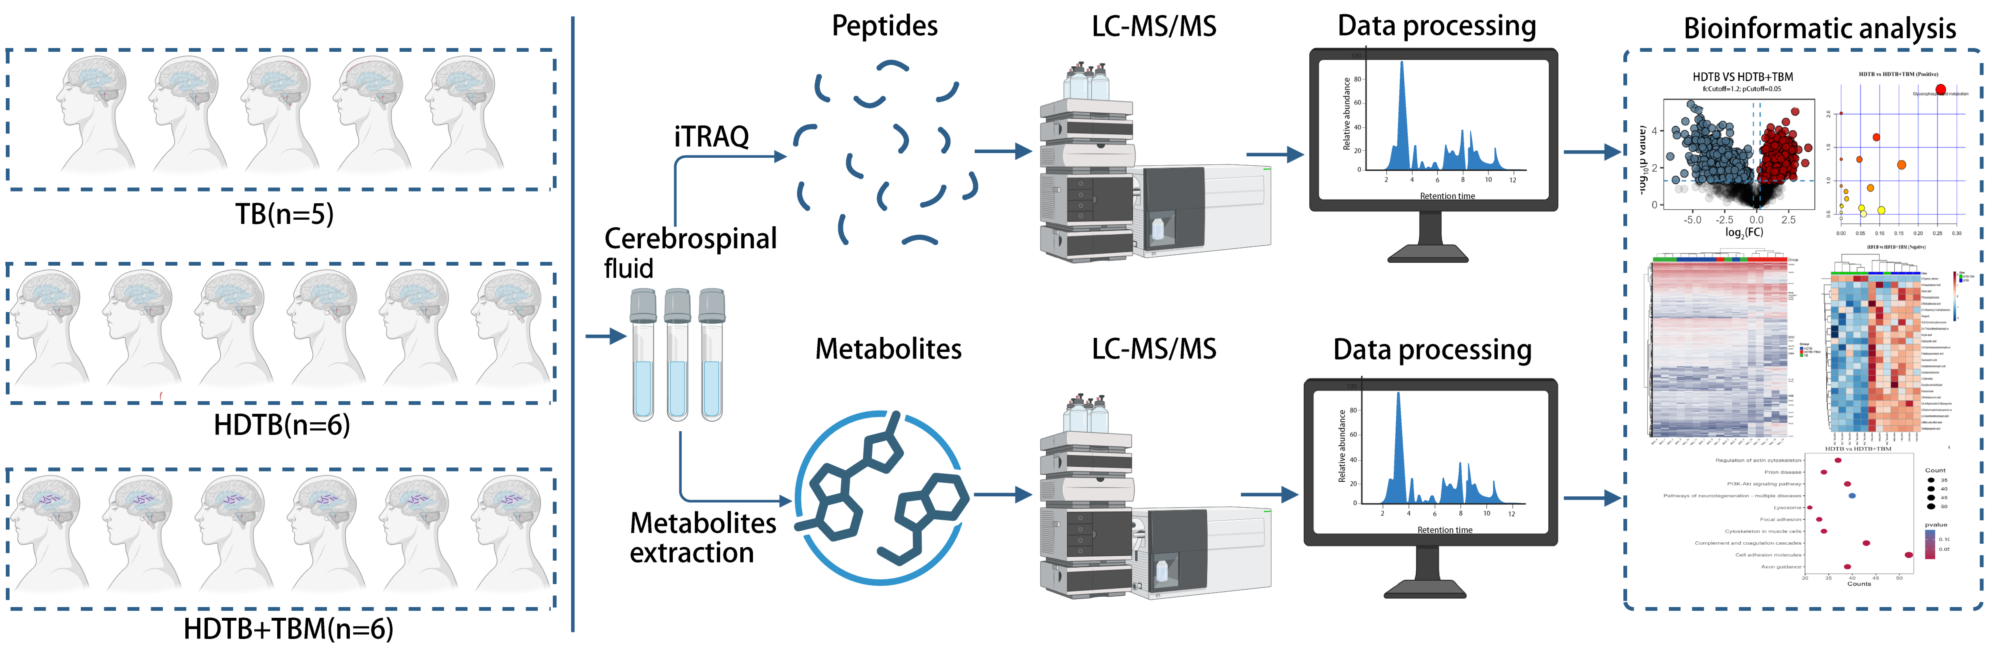
We included three groups of patients: 5 with pulmonary tuberculosis (TB group), 6 with hematogenous disseminated tuberculosis (HDTB group), and 6 with hematogenous disseminated tuberculosis with concomitant tuberculous meningitis (HDTB+TBM group) (Table 1). All samples were obtained from patients who underwent lumbar puncture at the Third People’s Hospital of Shenzhen between July 2022 and September 2024. This study was approved by the ethics committee of the Third People’s Hospital of Shenzhen (Approval No. 2022-200-02), and written informed consent was obtained from all participants. All procedures related to cerebrospinal fluid collection followed the principles of the Declaration of Helsinki. Cerebrospinal Fluid Collection: Cerebrospinal fluid samples were collected by lumbar puncture, divided into 200 µL aliquots, and stored at -80 °C until further analysis. Samples were heated at 95 °C for 5 minutes before shipment.
2.2. Proteomics Analysis
Samples were centrifuged at 1000 rpm for 10 minutes. A 200 µL aliquot of cerebrospinal fluid from each sample was added to 2× SDT buffer. The mixture was centrifuged at 40,000×g for 10 minutes, followed by incubation at 95 °C for 5 minutes. Protein concentration was measured using the Pierce™ BCA Protein Assay Kit. Proteins were digested using the filter-aided sample preparation (FASP) method with 10 kDa centrifugal filter units. The proteins were processed with 8 M urea and 150 mM Tris-HCl (pH 8.0), alkylated with 50 mM iodoacetamide, and digested with trypsin at 37 °C for 12 hours. The resulting peptides were labeled with 8-plex iTRAQ reagents and analyzed by liquid chromatography-tandem mass spectrometry (LC-MS/MS). Data were processed using the MASCOT engine 2.2 (Matrix Science). Proteins with p values <0.05 and fold changes (FC) >1.2 were selected for further analysis. GO annotations for differentially expressed proteins were performed using the Gene Ontology database(GO, http://www.geneontology.org/). The analysis of biological processes, cellular components, and molecular functions in GO was performed using the OmicsBean tool (http:// www.omicsbean.cn/). Pathway enrichment analysis was conducted using the Kyoto Encyclopedia of Genes and Genomes (KEGG, http://www.genome.jp/kegg/) and Reactome pathways (https://reactome.org/). Additionally, a protein-protein interaction (PPI) network was calculated by querying and analyzing the interaction gene/protein database (STRING).
2.3. Non-Targeted Metabolomics Analysis
A 400 µL aliquot of cerebrospinal fluid was mixed with 800 µL methanol, vortexed, and then centrifuged at 14,000×g for 15 minutes at 4 °C. The supernatant was lyophilized and dissolved in 100 µL 20% methanol solution before analysis by non-targeted LC-MS. The ionization source operates in both positive and negative ion modes. Positive ion mode analysis is conducted using the Heated Electrospray Ionization (HESI) source in the positive mode, while negative ion mode analysis is performed using the HESI source in the negative mode.The raw data files generated by LC-MS were subjected to batch preprocessing, chromatographicpeak extraction, calibration, and quantification. The resulting preliminary data included m/z ratios, peak retention times, and peak intensities, which were analyzed using the Human Metabolome Database (HMDB, http://www.hmdb.ca), Metlin (https://metlin.scripps.edu) and LipidMaps (http://www.lipidmaps.org).
2.4. Integrated Analysis
Integrated analysis was performed using the Pathway Analysis module of MetaboAnalyst 6.0. The differential proteins’ Uniprot IDs and the differential metabolites’ HMDB IDs, along with their fold changes, were input to assess the potential importance of individual molecules (i.e., nodes) based on their position in the network. Enrichment analysis was conducted using the hypergeometric test, with degree centrality chosen as the topological measure, and combine queries were used as the integration method. Additionally, the p-value reflects the likelihood of input molecules appearing in shared pathways based on random probability, with the calculation formula: [p score = -log10 (p value)].
2.4. Statistical Analysis
Statistical analysis was performed using GraphPad Prism 7.0 (GraphPad Software). Data are expressed as mean ± standard error of the mean (SEM). Unpaired t-tests were used to analyze the differences in metabolomics and proteomics between the TB group and HDTB group, the HDTB group and HDTB+TBM group, as well as the TB group and HDTB+TBM group. Chi-square tests were applied for gender analysis. Differentially expressed proteins (DEPs) were selected based on a |log2FC| value greater than 0.263 and a p-value less than 0.05. Differential metabolites (DEMs) were selected based on a |log2FC| value greater than 1 and a p-value less than 0.05. Principal component analysis (PCA) and partial least squares discriminant analysis (PLS-DA) were used to analyze the differential metabolites between groups. All data on differential abundance metabolites were analyzed using the SIMCA-P+ 13.0 software package.
3. Results
3.1. SubsectionCSF Proteomic Profiling Reveals Stage-Dependent Molecular Remodeling During Tuberculosis Progression
To delineate molecular alterations across distinct stages of tuberculosis progression, we performed quantitative proteomic and metabolomic analyses of cerebrospinal fluid (CSF) from 17 patients, including pulmonary tuberculosis (TB, n = 5), hematogenous disseminated tuberculosis (HDTB, n = 6), and disseminated tuberculosis with concomitant tuberculous meningitis (HDTB+TBM, n = 6). Differential expression was defined by a fold change (FC) > 1.2 and a p value < 0.05. Proteomic analysis identified a total of 2,085 non-redundant proteins across all CSF samples (Table S1). Pairwise comparisons revealed stage-dependent differences in the magnitude and complexity of proteomic remodeling. Relative to the TB group, the HDTB group exhibited only modest changes, with 22 upregulated and 20 downregulated proteins (Figure 1A), indicating limited proteomic perturbation associated with hematogenous dissemination alone. In contrast, comparison between the HDTB and HDTB+TBM groups identified 589 upregulated and 498 downregulated proteins (Figure 1B), reflecting a pronounced reorganization of the CSF proteome accompanying meningeal involvement. Consistently, comparison of the TB and HDTB+TBM groups revealed extensive proteomic differences, with 545 proteins upregulated and 407 proteins downregulated in HDTB+TBM (Figure 1C). Overlap analysis identified a small subset of proteins exhibiting concordant upregulation or downregulation across all three groups (Figure 1D), suggesting shared molecular responses, whereas the majority of differentially expressed proteins were stage specific. Hierarchical clustering of dysregulated proteins demonstrated clear separation among TB, HDTB, and HDTB+TBM samples, highlighting distinct CSF proteomic states associated with progressive tuberculosis and tuberculous meningitis (Figure 1E).
3.2. Functional Enrichment and Network Analyses Link TBM-Associated Proteomic Changes to Neuro-Immune and Vascular Pathways
To characterize the biological significance of stage-specific proteomic alterations, we performed Gene Ontology (GO), Kyoto Encyclopedia of Genes and Genomes (KEGG), and Reactome pathway enrichment analyses. Across all comparisons, differentially expressed proteins were enriched in 907 biological process (BP), 160 cellular component (CC), and 155 molecular function (MF) terms (Tables S2-S4).
In the TB versus HDTB comparison, enrichment analysis of 22 upregulated and 20 downregulated proteins revealed relatively restricted functional involvement. These proteins were primarily associated with muscle system processes, fluid regulation, and extracellular matrix organization (Figure 2A). KEGG and Reactome analyses indicated enrichment in ECM-receptor interaction and renin secretion pathways (Figure 2D, G; Tables S5, S8), consistent with limited systemic effects during early dissemination.
In contrast, comparison between HDTB and HDTB+TBM uncovered extensive functional enrichment. Differentially expressed proteins were strongly associated with axonogenesis, chemotaxis, and regulation of neurodevelopment at the BP level; extracellular matrix, vesicle lumen, and secretory granule lumen at the CC level; and glycosaminoglycan binding, enzyme inhibitor activity, and carbohydrate binding at the MF level (Figure 2B). KEGG and Reactome analyses converged on pathways related to cell adhesion molecules, complement and coagulation cascades, axon guidance, innate immune responses, and neutrophil degranulation (Figure 2E, H; Tables S6, S9).
Similarly, TB versus HDTB+TBM comparisons revealed enrichment of proteins involved in axonogenesis, neuronal projection development, and neurodevelopmental regulation (Figure 2C), with KEGG and Reactome analyses highlighting axon guidance, innate immune signaling, and neuroinflammatory pathways (Figure 2F, I; Tables S7, S10). Collectively, these findings indicate that meningeal involvement is associated with coordinated neuro-immune-vascular remodeling in the CSF proteome.
Protein-protein interaction (PPI) network analysis further supported this concept. PPI networks constructed for TB-HDTB, HDTB-HDTB+TBM, and TB-HDTB+TBM comparisons identified 42, 24,544, and 19,794 significant nodes, respectively (Figure 3A-C; Tables S11-S13), underscoring the dramatic expansion of molecular interaction networks accompanying TBM.
3.3. CSF Metabolomic Profiling Highlights Metabolic Reprogramming During Transition to TBM
To complement proteomic findings, we performed non-targeted metabolomic profiling of CSF samples in both positive and negative ion modes. Consistent with proteomic results, metabolomic alterations were modest between TB and HDTB but markedly amplified in comparisons involving TBM. In the HDTB versus HDTB+TBM comparison, 23 upregulated and 15 downregulated metabolites were identified in negative ion mode, while 31 upregulated and 43 downregulated metabolites were detected in positive ion mode (Figure 4A; Tables S14-S15). Hierarchical clustering and partial least squares discriminant analysis (PLS-DA) demonstrated clear group separation (Figure 4B, C). Pathway enrichment analysis revealed predominant involvement of glycerophospholipid metabolism and β-alanine metabolism (Figure 4D; Tables S16-S17).
Similarly, comparison between TB and HDTB+TBM identified 18 upregulated and 10 downregulated metabolites in negative ion mode, and 16 upregulated and 36 downregulated metabolites in positive ion mode (Figure 5A; Tables S18-S19). Hierarchical clustering based on the differentially abundant metabolites demonstrated a clear separation between TB and HDTB+TBM samples, indicating that meningeal involvement is accompanied by a distinct CSF metabolic state (Figure 5B). Consistently, supervised multivariate modeling further supported this discrimination: PLS-DA/OPLS-DA score plots showed non-overlapping group clustering between TB and HDTB+TBM in both ionization modes, suggesting coordinated metabolic remodeling associated with TBM rather than inter-individual variability alone (Figure 5C). Pathway enrichment analysis of these dysregulated metabolites revealed predominant involvement of glycerophospholipid metabolism, together with pathways linked to neuroinflammatory and energy-reprogramming processes, including tryptophan metabolism, ketone body synthesis and degradation, and butyrate metabolism (Figure 5D; Tables S20-S21). Collectively, these findings indicate that the transition from pulmonary tuberculosis to TBM is accompanied by broad perturbations in membrane lipid remodeling and bioenergetic pathways within the CSF metabolic compartment. By contrast, TB versus HDTB comparisons revealed only a small number of dysregulated metabolites across ion modes and a more limited pathway signal, with enrichment primarily associated with purine metabolism (Figure S1; Tables S22-S24), further supporting a restricted metabolic shift during early hematogenous dissemination in the absence of meningeal involvement.
3.4. Integrated Multi-Omics Analysis Identifies Coordinated Metabolic and Glycosylation Rewiring During Meningeal Involvement
To define convergent molecular pathways underlying tuberculosis progression, we performed integrated proteomic-metabolomic analysis using MetaboAnalyst. In the TB versus HDTB comparison, 38 proteins and 14 metabolites were differentially expressed, with integrated pathways primarily related to mucin-type O-glycan biosynthesis, mannose-type O-glycan biosynthesis, and carbohydrate metabolism (Figure 6A; Table S25). In contrast, integrated analysis of HDTB versus HDTB+TBM identified 1,091 proteins and 112 metabolites, converging on glycolysis/gluconeogenesis, the pentose phosphate pathway, glutathione metabolism, and extensive O- and N-glycan biosynthesis pathways (Figure 6B; Table S26). Similar pathway convergence was observed in the TB versus HDTB+TBM comparison, involving 956 proteins and 80 metabolites (Figure 6C; Table S27). Notably, six proteins—ENO2, LDHB, GALNT7, MAN1C1, PGD, and B4GALT1—emerged as a coherent molecular signature distinguishing TBM from non-meningeal tuberculosis. These proteins collectively link neuronal injury, energy metabolism, and protein glycosylation, consistent with the integrated pathway-level remodeling observed during meningeal involvement.
4. Discussion
Mycobacterium tuberculosis primarily infects the lungs, but it can disseminate to other tissues and organs. Among all TB cases, approximately 10% affect the central nervous system, with tuberculous meningitis (TBM) being the most severe form of central nervous system tuberculosis [26], TBM remains a major cause of mortality and long-term neurological disability worldwide [27,28]. Although TBM is generally regarded as a consequence of hematogenous dissemination [29,30], the molecular events that distinguish uncomplicated dissemination from successful central nervous system invasion have remained largely undefined. Most prior studies have approached TBM as a static disease entity, focusing on comparisons between TBM and non-infected or non-meningitic controls [31,32,33,34]. Currently, no single diagnostic method can definitively diagnose TBM; therefore, simultaneous CSF microscopy, bacterial culture, and molecular testing are required for diagnosis [35,36]. In contrast, the present study adopts a trajectory-based framework, integrating cerebrospinal fluid (CSF) proteomics and metabolomics across three clinically defined stages—pulmonary TB, hematogenous disseminated TB (HDTB), and disseminated TB with concomitant TBM—to map the molecular transitions underlying disease progression.
A central and consistent finding across all analytic layers is that molecular remodeling of the CSF is not continuous across tuberculosis stages [37,38,39]. Both proteomic and metabolomic analyses demonstrate that pulmonary TB and HDTB share largely similar CSF molecular profiles, with only modest numbers of differentially expressed proteins (22 upregulated and 20 downregulated) and metabolites primarily linked to purine metabolism. This relative molecular stability persists despite systemic dissemination, suggesting that hematogenous spread alone does not substantially perturb the CSF microenvironment.
In striking contrast, the transition from HDTB to TBM is accompanied by an abrupt and large-scale reorganization of the CSF proteome and metabolome. More than 1,000 proteins and over 100 metabolites were differentially expressed in this comparison, a pattern mirrored in the TB versus HDTB+TBM contrast. Hierarchical clustering, volcano plots, and multivariate modeling consistently demonstrate clear group separation only when TBM is present (Figure 2, Figure 5 and Figure 6), indicating that meningeal involvement constitutes a biological inflection point rather than the quantitative culmination of systemic inflammation.
This observation has important conceptual implications. Clinically, many patients with disseminated TB never develop TBM, and our data provide molecular support for this phenomenon by suggesting that TBM requires additional, discrete host–pathogen interactions that fundamentally reprogram the CSF milieu.
Functional enrichment and network analyses reveal that TBM-associated proteomic changes are dominated by pathways related to neurodevelopment, axonogenesis, immune cell trafficking, and extracellular matrix (ECM) remodeling. Proteins involved in axon guidance, neuronal projection development, and neurodevelopmental regulation are prominently enriched in both HDTB vs. HDTB+TBM and TB vs. HDTB+TBM comparisons. These findings align with the well-documented neuronal injury, infarction, and long-term cognitive sequelae observed in TBM patients [40,41,42,43].
At the same time, enrichment of complement and coagulation cascades, neutrophil degranulation, and innate immune pathways highlights the vascular and inflammatory dimensions of TBM pathogenesis. The ECM emerges as a central cellular component across multiple comparisons, consistent with blood–brain barrier disruption, leukocyte transmigration, and altered CSF dynamics. The dramatic expansion of protein–protein interaction networks in TBM further underscores that these changes reflect systems-level reorganization, rather than isolated pathway activation.
Importantly, these neuro–immune–vascular signatures are largely absent in the TB vs. HDTB comparison, reinforcing the conclusion that TBM represents a qualitatively distinct molecular state within the tuberculosis disease spectrum.
Metabolomic profiling independently supports the concept of TBM as a distinct CSF state. Comparisons involving TBM reveal extensive alterations in glycerophospholipid metabolism, tryptophan metabolism, ketone body synthesis and degradation, and butyrate metabolism. Glycerophospholipid metabolism, a key determinant of membrane structure and signaling, likely reflects widespread membrane remodeling associated with immune cell infiltration, neuronal injury, and barrier dysfunction [44,45,46].
Alterations in tryptophan metabolism are particularly noteworthy given its established role in immune regulation and neuroinflammation. Shifts in ketone body and butyrate metabolism suggest altered bioenergetic states within the CNS, potentially reflecting increased metabolic demands imposed by inflammation and neuronal stress [47,48,49]. Together, these findings indicate that TBM is associated with profound metabolic rewiring of the CSF compartment, rather than nonspecific metabolic spillover from systemic infection. By contrast, early dissemination without meningeal involvement produces only limited metabolic perturbations, again highlighting the specificity of TBM-associated changes.
One of the most compelling insights from this study emerges from integrated proteomic–metabolomic analyses. Across comparisons involving TBM, convergent pathways consistently include glycolysis/gluconeogenesis, the pentose phosphate pathway, and extensive O- and N-glycan biosynthesis. This convergence suggests tight coupling between energy metabolism and protein glycosylation during meningeal involvement [50]. The pentose phosphate pathway supplies reducing equivalents and nucleotide precursors, supporting both oxidative stress responses and biosynthetic demands [51,52]. Concurrent activation of glycosylation pathways may reflect increased requirements for cell–cell interaction, immune receptor signaling, and ECM remodeling. Glycosylation is known to modulate immune recognition, leukocyte adhesion, and vascular permeability—processes central to TBM pathology [53,54,55]. Thus, the integrated multi-omics results support a model in which metabolic reprogramming fuels glycosylation-dependent immune and structural remodeling within the CNS.
Within this integrated framework, six proteins—ENO2, LDHB, GALNT7, MAN1C1, PGD, and B4GALT1—emerge as a coherent molecular signature distinguishing TBM from non-meningeal tuberculosis. Rather than representing unrelated biomarkers, these proteins span complementary functional domains. ENO2 reflects neuronal injury and glycolytic flux [56]; LDHB and PGD link energy metabolism to redox balance [57,58]; GALNT7, MAN1C1, and B4GALT1 represent key nodes within O- and N-glycan biosynthesis [59,60,61].
This convergence supports the biological plausibility of the signature and suggests that TBM diagnosis may benefit from multi-marker panels capturing interconnected biological processes, rather than reliance on single inflammatory markers. Notably, ENO2 has been implicated previously in CNS injury contexts [62,63], further reinforcing its relevance to TBM-associated neurodegeneration.
Clinically, the findings of this study suggest that TBM should be viewed not merely as disseminated TB within the CNS, but as a distinct neuro–immune–metabolic state. This perspective may help explain the limitations of current diagnostic approaches, which largely target pathogen detection rather than host-response dynamics.
The sample size is modest, reflecting the challenges of CSF acquisition and the cost of multi-omics analyses. In addition, comparisons with other infectious meningitides were not performed, and future studies will be required to assess the specificity of the identified signatures. Longitudinal sampling and validation in larger, multi-center cohorts will be essential to translate these findings into clinically actionable diagnostic tools.
5. Conclusions
This study provides a systems-level map of CSF molecular changes across tuberculosis progression. By integrating proteomics and metabolomics, we demonstrate that TBM represents a discrete molecular transition characterized by coordinated neuro–immune–metabolic remodeling. These findings advance our understanding of TBM pathogenesis and provide a conceptual and analytical framework for mechanism-informed biomarker development and future translational research
Author Contributions
Conceptualization, Q. M. and M. F.; methodology, X. Z. and X. W.; software, J. Z.; validation, Z. M., S. L. and P. C.; formal analysis, Q. M.; investigation, X. Z.; resources, S. L.; data curation, X. Z.; writing—original draft preparation, X. Z. and X. W.; writing—review and editing, Q. M.; visualization, X. Z.; supervision, Q. M. and M. F.; project administration, Q. M.; funding acquisition, Q. M. and M. F. All authors have read and agreed to the published version of the manuscript.
Funding
This research was funded by the Shenzhen Third People’s Hospital Scientific Research Project (25260G1003, China), Shenzhen Natural Science Foundation (JCYJ20240813152608011, JCYJ20250604143959019, China), Shenzhen Science and Technology Program (JSGGZD20220822095200001).
Institutional Review Board Statement
This study was approved by the ethics committee of the Third People’s Hospital of Shenzhen (Approval No. 2022-200-02), and written informed consent was obtained from all participants. All procedures related to cerebrospinal fluid collection followed the principles of the Declaration of Helsinki.
Informed Consent Statement
Informed consent was obtained from all subjects involved in the study.
Data Availability Statement
The original contributions presented in this study are included in the article/Supplementary Materials. Further enquiries can be directed to the corresponding author.
Conflicts of Interest
The authors declare no conflicts of interest.
Abbreviations
| CSF | Cerebrospinal fluid |
| TBM | Tuberculous meningitis |
| TB | Tuberculosis |
| HDTB | Hematogenous disseminated tuberculosis |
| iTRAQ | Isotope-labeling relative and absolute quantification techniques |
| ApoB | Apolipoprotein B |
| FASP | Filter-aided sample preparation |
| LC-MS/MS | Liquid chromatography-tandem mass spectrometry |
| FC | Fold changes |
| GO | Gene Ontology |
| KEGG | Kyoto Encyclopedia of Genes and Genomes |
| HESI | Heated Electrospray Ionization |
| SEM | Standard error of the mean |
| DEPs | Differentially expressed proteins |
| DEMs | Differential metabolites |
| PLS-DA | Partial least squares discriminant analysis |
| BP | Biological process |
| CC | Cellular component |
| MF | Molecular function |
| PPI | Protein-protein interaction |
References
- Goletti, D.; Meintjes, G.; Andrade, B.B.; Zumla, A.; Shan Lee, S. Insights from the 2024 WHO Global Tuberculosis Report - More Comprehensive Action, Innovation, and Investments required for achieving WHO End TB goals. Int. J. Infect. Dis. 2025, 150, 107325. [Google Scholar] [CrossRef]
- Mehta, K.; Balazki, P.; van der Graaf, P.H.; Guo, T.; van Hasselt, J.G.C. Predictions of Bedaquiline Central Nervous System Exposure in Patients with Tuberculosis Meningitis Using Physiologically based Pharmacokinetic Modeling. Clin. Pharmacokinet. 2024, 63, 657–68. [Google Scholar] [CrossRef] [PubMed]
- Wilkinson, R.J.; Rohlwink, U.; Misra, U.K.; van Crevel, R.; Mai, N.T.H.; Dooley, K.E.; et al. Tuberculous meningitis. Nat. Rev. Neurol. 2017, 13, 581–98. [Google Scholar] [CrossRef]
- Mason, S.; Reinecke, C.J.; Solomons, R. Cerebrospinal Fluid Amino Acid Profiling of Pediatric Cases with Tuberculous Meningitis. Front Neurosci. 2017, 11, 534. [Google Scholar] [CrossRef] [PubMed]
- Niu, M.; Bai, Z.; Dong, L.; Zheng, W.; Wang, X.; Dong, N.; et al. A Novel Diagnostic Prediction Model for Distinguishing Between Tuberculous and Cryptococcal Meningitis. Clin. Med. Res. 2024, 22, 197–205. [Google Scholar] [CrossRef]
- Barreras, P.; Stern, B.J. Clinical features and diagnosis of neurosarcoidosis - review article. J. Neuroimmunol. 2022, 368, 577871. [Google Scholar] [CrossRef]
- Basu, S.; Chakraborty, S. A Comprehensive Review of the Diagnostics for Pediatric Tuberculosis Based on Assay Time, Ease of Operation, and Performance. Microorganisms 2025, 13. [Google Scholar] [CrossRef]
- Boudry, F.; Durand, F.; Goossens, C. Metabolomics Signatures of a Respiratory Tract Infection During an Altitude Training Camp in Elite Rowers. Metabolites 2025, 15. [Google Scholar] [CrossRef]
- Ganna, A.; Salihovic, S.; Sundstrom, J.; Broeckling, C.D.; Hedman, A.K.; Magnusson, P.K.; et al. Large-scale metabolomic profiling identifies novel biomarkers for incident coronary heart disease. PLoS Genet 2014, 10, e1004801. [Google Scholar] [CrossRef] [PubMed]
- Liesenfeld, D.B.; Habermann, N.; Owen, R.W.; Scalbert, A.; Ulrich, C.M. Review of mass spectrometry-based metabolomics in cancer research. Cancer Epidemiol. Biomark. Prev. 2013, 22, 2182–201. [Google Scholar] [CrossRef]
- Dai, Y.N.; Huang, H.J.; Song, W.Y.; Tong, Y.X.; Yang, D.H.; Wang, M.S.; et al. Identification of potential metabolic biomarkers of cerebrospinal fluids that differentiate tuberculous meningitis from other types of meningitis by a metabolomics study. Oncotarget 2017, 8, 100095–112. [Google Scholar] [CrossRef]
- Mu, J.; Yang, Y.; Chen, J.; Cheng, K.; Li, Q.; Wei, Y.; et al. Elevated host lipid metabolism revealed by iTRAQ-based quantitative proteomic analysis of cerebrospinal fluid of tuberculous meningitis patients. Biochem Biophys. Res. Commun. 2015, 466, 689–95. [Google Scholar] [CrossRef]
- Samuel, V.; Solomons, R.; Mason, S. Targeted metabolomics investigation of metabolic markers of Mycobacterium tuberculosis in the cerebrospinal fluid of paediatric patients with tuberculous meningitis. PLoS ONE 2024, 19, e0314854. [Google Scholar] [CrossRef] [PubMed]
- Yang, Y.; Mu, J.; Chen, G.; Zhan, Y.; Zhong, J.; Wei, Y.; et al. iTRAQ-based quantitative proteomic analysis of cerebrospinal fluid reveals NELL2 as a potential diagnostic biomarker of tuberculous meningitis. Int. J. Mol. Med. 2015, 35, 1323–32. [Google Scholar] [CrossRef] [PubMed]
- Huang, M.; Ding, Z.; Li, W.; Chen, W.; Du, Y.; Jia, H.; et al. Identification of protein biomarkers in host cerebrospinal fluid for differential diagnosis of tuberculous meningitis and other meningitis. Front Neurol. 2022, 13, 886040. [Google Scholar] [CrossRef]
- Ou, Q.; Liu, X.; Cheng, X. An iTRAQ approach to quantitative proteome analysis of cerebrospinal fluid from patients with tuberculous meningitis. Biosci. Trends 2013, 7, 186–92. [Google Scholar] [CrossRef] [PubMed]
- Mason, S.; Solomons, R. CSF Metabolomics of Tuberculous Meningitis: A Review. Metabolites 2021, 11. [Google Scholar] [CrossRef]
- Enche Ady, C.N.A.; Lim, S.M.; Teh, L.K.; Salleh, M.Z.; Chin, A.V.; Tan, M.P.; et al. Metabolomic-guided discovery of Alzheimer’s disease biomarkers from body fluid. J. Neurosci. Res. 2017, 95, 2005–24. [Google Scholar] [CrossRef]
- Kim, S.G.; Hwang, J.S.; George, N.P.; Jang, Y.E.; Kwon, M.; Lee, S.S.; et al. Integrative Metabolome and Proteome Analysis of Cerebrospinal Fluid in Parkinson’s Disease. Int. J. Mol. Sci. 2024, 25. [Google Scholar] [CrossRef]
- Niu, D.; Sun, P.; Zhang, F.; Song, F. Metabonomic analysis of cerebrospinal fluid in epilepsy. Ann. Transl. Med. 2022, 10, 449. [Google Scholar] [CrossRef]
- Ardiansyah, E.; Avila-Pacheco, J.; Nhat, L.T.H.; Dian, S.; Vinh, D.N.; Hai, H.T.; et al. Tryptophan metabolism determines outcome in tuberculous meningitis: a targeted metabolomic analysis. Elife 2023, 12. [Google Scholar] [CrossRef]
- Shi, Y.; Zhang, C.; Pan, S.; Chen, Y.; Miao, X.; He, G.; et al. The diagnosis of tuberculous meningitis: advancements in new technologies and machine learning algorithms. Front Microbiol. 2023, 14, 1290746. [Google Scholar] [CrossRef]
- Zhang, P.; Zhang, W.; Lang, Y.; Qu, Y.; Chu, F.; Chen, J.; et al. Mass spectrometry-based metabolomics for tuberculosis meningitis. Clin. Chim. Acta 2018, 483, 57–63. [Google Scholar] [CrossRef] [PubMed]
- Cresswell, F.V.; Davis, A.G.; Sharma, K.; Basu Roy, R.; Ganiem, A.R.; Kagimu, E.; et al. Recent Developments in Tuberculous Meningitis Pathogenesis and Diagnostics. Wellcome Open. Res. 2019, 4, 164. [Google Scholar] [CrossRef] [PubMed]
- Machida, N.; Arai, T.; Noguchi, K.; Oki, Y. [Change of incidence of antinuclear antibodies in serum of NOD mouse with aging]. Jikken Dobutsu 1989, 38, 345–7. [Google Scholar] [PubMed]
- Ratinam, J.; Mishra, A.K.; Muthuram, A.J.; Miraclin, A.; Chandy, G.M.; Vanjare, H.A.; et al. Role of cerebrospinal fluid C-reactive protein in tuberculous meningitis. Int. J. Mycobacteriol 2020, 9, 422–8. [Google Scholar]
- Nacarapa, E.; Munyangaju, I.; Osorio, D.; Ramos-Rincon, J.M. Predictors of Tuberculous Meningitis Mortality Among Persons with HIV in Mozambique. Trop. Med. Infect. Dis. 2025, 10. [Google Scholar] [CrossRef]
- Nasiri, M.J.; Lutfy, K.; Venketaraman, V. Challenges of Multidrug-Resistant Tuberculosis Meningitis: Current Treatments and the Role of Glutathione as an Adjunct Therapy. Vaccines 2024, 12. [Google Scholar] [CrossRef]
- Galimi, R. Extrapulmonary tuberculosis: tuberculous meningitis new developments. Eur. Rev. Med. Pharmacol. Sci. 2011, 15, 365–86. [Google Scholar]
- Smith, S.; Anderson, S.; Ballermann, B.J.; Brenner, B.M. Role of atrial natriuretic peptide in adaptation of sodium excretion with reduced renal mass. J. Clin. Invest 1986, 77, 1395–8. [Google Scholar] [CrossRef]
- Hu, X.; Liao, S.; Bai, H.; Wu, L.; Wang, M.; Wu, Q.; et al. Integrating exosomal microRNAs and electronic health data improved tuberculosis diagnosis. EBioMedicine 2019, 40, 564–73. [Google Scholar] [CrossRef] [PubMed]
- Nuwagira, E.; Huppler Hullsiek, K.; Jjunju, S.; Rutakingirwa, M.; Kasibante, J.; Tadeo, K.K.; et al. Diagnostic and Prognostic Value of Cerebrospinal Fluid Lactate and Glucose in HIV-Associated Tuberculosis Meningitis. Microbiol. Spectr. 2022, 10, e0161822. [Google Scholar] [CrossRef]
- Pan, L.; Liu, F.; Zhang, J.; Li, J.; Jia, H.; Huang, M.; et al. Genome-Wide miRNA Analysis Identifies Potential Biomarkers in Distinguishing Tuberculous and Viral Meningitis. Front Cell. Infect. Microbiol. 2019, 9, 323. [Google Scholar] [CrossRef] [PubMed]
- Wei, J.; Zhu, L.; Jian, B.; Yu, Y.; Hu, B.; Guo, L.; et al. Proteomic profiling of cerebrospinal fluid uncovers distinctive pathophysiological changes and potential biomarkers in pediatric tubercular meningitis. Front Cell. Infect. Microbiol. 2025, 15, 1662783. [Google Scholar] [CrossRef] [PubMed]
- Lin, F. Tuberculous meningitis diagnosis and treatment: classic approaches and high-throughput pathways. Front Immunol. 2024, 15, 1543009. [Google Scholar] [CrossRef]
- Manyelo, C.M.; Solomons, R.S.; Walzl, G.; Chegou, N.N. Tuberculous Meningitis: Pathogenesis, Immune Responses, Diagnostic Challenges, and the Potential of Biomarker-Based Approaches. J. Clin. Microbiol. 2021, 59. [Google Scholar] [CrossRef]
- Chen, H.L.; Lu, C.H.; Chang, C.D.; Chen, P.C.; Chen, M.H.; Hsu, N.W.; et al. Structural deficits and cognitive impairment in tuberculous meningitis. BMC Infect. Dis. 2015, 15, 279. [Google Scholar] [CrossRef]
- Jansson, D.; Wang, M.; Thomas, R.G.; Erickson, M.A.; Peskind, E.R.; Li, G.; et al. Markers of Cerebrovascular Injury, Inflammation, and Plasma Lipids Are Associated with Alzheimer’s Disease Cerebrospinal Fluid Biomarkers in Cognitively Normal Persons. J. Alzheimers Dis. 2022, 86, 813–26. [Google Scholar] [CrossRef]
- Kalita, J.; Misra, U.K.; Ranjan, P. Predictors of long-term neurological sequelae of tuberculous meningitis: a multivariate analysis. Eur. J. Neurol. 2007, 14, 33–7. [Google Scholar] [CrossRef]
- Davis, A.G.; Nightingale, S.; Springer, P.E.; Solomons, R.; Arenivas, A.; Wilkinson, R.J.; et al. Neurocognitive and functional impairment in adult and paediatric tuberculous meningitis. Wellcome Open. Res. 2019, 4, 178. [Google Scholar] [CrossRef]
- Kim, J.; Erice, C.; Rohlwink, U.K.; Tucker, E.W. Infections in the Developing Brain: The Role of the Neuro-Immune Axis. Front Neurol. 2022, 13, 805786. [Google Scholar] [CrossRef]
- Ma, Q.; Chen, J.; Kong, X.; Zeng, Y.; Chen, Z.; Liu, H.; et al. Interactions between CNS and immune cells in tuberculous meningitis. Front Immunol. 2024, 15, 1326859. [Google Scholar] [CrossRef] [PubMed]
- Yang, Z.R.; Zhang, L.F.; Zhou, B.T.; Shi, X.C.; Cao, W.; Fan, H.W.; et al. Clinical features and influencing factors of long-term prognosis in patients with tuberculous meningitis. Zhonghua Nei Ke Za Zhi 2022, 61, 764–70. [Google Scholar]
- Hachem, M.; Nacir, H. Emerging Role of Phospholipids and Lysophospholipids for Improving Brain Docosahexaenoic Acid as Potential Preventive and Therapeutic Strategies for Neurological Diseases. Int. J. Mol. Sci. 2022, 23. [Google Scholar] [CrossRef] [PubMed]
- Sarkar, C.; Lipinski, M.M. Glycerophospholipid dysregulation after traumatic brain injury. Neurochem Int. 2024, 175, 105701. [Google Scholar] [CrossRef] [PubMed]
- Yu, R.K.; Ariga, T. The role of glycosphingolipids in neurological disorders. Mechanisms of immune action. Ann. N Y Acad. Sci. 1998, 845, 285–306. [Google Scholar] [CrossRef]
- Baranano, K.W.; Hartman, A.L. The ketogenic diet: uses in epilepsy and other neurologic illnesses. Curr. Treat. Options Neurol. 2008, 10, 410–9. [Google Scholar] [CrossRef]
- Mattson, M.P. Lifelong brain health is a lifelong challenge: from evolutionary principles to empirical evidence. Ageing Res. Rev. 2015, 20, 37–45. [Google Scholar] [CrossRef]
- Murugaiyah, V.; Mattson, M.P. Neurohormetic phytochemicals: An evolutionary-bioenergetic perspective. Neurochem Int. 2015, 89, 271–80. [Google Scholar] [CrossRef]
- Zawislak, A.; Jakimowicz, P.; McCubrey, J.A.; Rakus, D. Neuron-derived transthyretin modulates astrocytic glycolysis in hormone-independent manner. Oncotarget 2017, 8, 106625–38. [Google Scholar] [CrossRef]
- Riaz, M.; Ali, Q.; Yan, L. Calcium-L-aspartate nanoparticles mitigate Boron toxicity in rice seedlings by modulating physiological, antioxidant, and cell wall mechanisms. Sci. Rep. 2025, 15, 42439. [Google Scholar] [CrossRef]
- Wu, X.; Zhang, G.; Zhang, W.; Zhou, J.; Cong, H.; Yang, G.; et al. Rumen microbiota helps Tibetan sheep obtain energy more efficiently to survive in the extreme environment of the Qinghai-Tibet Plateau. Front Microbiol. 2024, 15, 1431063. [Google Scholar] [CrossRef]
- Borsig, L.; Wolf, M.J.; Roblek, M.; Lorentzen, A.; Heikenwalder, M. Inflammatory chemokines and metastasis--tracing the accessory. Oncogene 2014, 33, 3217–24. [Google Scholar] [CrossRef]
- Davis, A.G.; Rohlwink, U.K.; Proust, A.; Figaji, A.A.; Wilkinson, R.J. The pathogenesis of tuberculous meningitis. J. Leukoc. Biol. 2019, 105, 267–80. [Google Scholar] [CrossRef]
- Isaiah, S.; Loots, D.T.; Solomons, R.; van der Kuip, M.; Tutu Van Furth, A.M.; Mason, S. Overview of Brain-to-Gut Axis Exposed to Chronic CNS Bacterial Infection(s) and a Predictive Urinary Metabolic Profile of a Brain Infected by Mycobacterium tuberculosis. Front Neurosci. 2020, 14, 296. [Google Scholar] [CrossRef]
- Deng, Q.; Ji, Y.; Liu, J.; Wen, T. Lipid reprogramming and ferroptosis crosstalk in clear cell renal cell carcinoma: metabolic vulnerabilities and therapeutic targeting. Mol. Cancer 2025, 24, 236. [Google Scholar] [CrossRef]
- Billatos, E.; Vick, J.L.; Lenburg, M.E.; Spira, A.E. The Airway Transcriptome as a Biomarker for Early Lung Cancer Detection. Clin. Cancer Res. 2018, 24, 2984–92. [Google Scholar] [CrossRef] [PubMed]
- Zhao, L.; Deng, H.; Zhang, J.; Zamboni, N.; Yang, H.; Gao, Y.; et al. Lactate dehydrogenase B noncanonically promotes ferroptosis defense in KRAS-driven lung cancer. Cell. Death Differ. 2025, 32, 632–45. [Google Scholar] [CrossRef] [PubMed]
- Dalal, K.; Yang, W.; Tian, E.; Chernish, A.; McCluggage, P.; Lara, A.J.; et al. In vivo mapping of the mouse Galnt3-specific O-glycoproteome. J. Biol. Chem. 2024, 300, 107628. [Google Scholar] [CrossRef] [PubMed]
- Sharapov, S.Z.; Timoshchuk, A.N.; Aulchenko, Y.S. Genetic control of N-glycosylation of human blood plasma proteins. Vavilovskii Zhurnal Genet Sel. 2023, 27, 224–39. [Google Scholar] [CrossRef]
- Vojta, A.; Samarzija, I.; Bockor, L.; Zoldos, V. Glyco-genes change expression in cancer through aberrant methylation. Biochim Biophys. Acta 2016, 1860, 1776–85. [Google Scholar] [CrossRef]
- Al-Habash, I.H.; Alshaeb, A.M.; Srpanova, V.B.; Alempijevic, D.; Keckarevic-Markovic, M.; Concato, M.; et al. Integrating Forensic Autopsies with Proteomic Profiling for Suicide Risk Assessment: A Comprehensive Review of Literature. Curr. Neuropharmacol. 2025, 23, 1393–404. [Google Scholar] [CrossRef]
- Wang, M.; Li, W.; Hao, J.; Gonzales, A., 3rd; Zhao, Z.; Flores, R.S.; et al. Molecularly cleavable bioinks facilitate high-performance digital light processing-based bioprinting of functional volumetric soft tissues. Nat. Commun. 2022, 13, 3317. [Google Scholar] [CrossRef]
Figure 1.
Differentially expressed proteins (DEPs) were analyzed among the TB, HDTB, and HDTB+TBM groups. Volcano plots depicting DEPs between paired comparisons are presented for TB vs. HDTB (A), HDTB vs. HDTB+TBM (B), and TB vs. HDTB+TBM (C). (D) Venn diagram illustrating the overlap of differentially regulated proteins across comparisons. (E) A heatmap-based hierarchical clustering analysis of DEPs across the three groups was performed, in which color intensity reflects relative expression levels; the color bar is displayed on a log2-transformed scale.

Figure 2.
Functional enrichment analyses were performed for differentially expressed proteins (DEPs) among the TB, HDTB, and HDTB+TBM groups. (A) The top 10 enriched Gene Ontology (GO) terms for biological process (BP), cellular component (CC), and molecular function (MF) in TB vs. HDTB. (B) The top 10 enriched GO BP, CC, and MF terms in HDTB vs. HDTB+TBM. (C) The top 10 enriched GO BP, CC, and MF terms in TB vs. HDTB+TBM. (D) KEGG pathway enrichment bubble plot for TB vs. HDTB. (E) KEGG pathway enrichment bubble plot for HDTB vs. HDTB+TBM. (F) KEGG pathway enrichment bubble plot for TB vs. HDTB+TBM. (G) The top 10 Reactome pathway terms in TB vs. HDTB. (H) The top 10 Reactome pathway terms in HDTB vs. HDTB+TBM. (I) The top 10 Reactome pathway terms in TB vs. HDTB+TBM. Dot size indicates the protein count, and color denotes statistical significance ( p value).

Figure 3.
Protein-protein interaction (PPI) analysis was performed for the differentially expressed proteins (DEPs). PPI networks were constructed for TB vs. HDTB (A), HDTB vs. HDTB+TBM (B), and TB vs. HDTB+TBM (C). All proteins are represented as circular nodes.
Figure 3.
Protein-protein interaction (PPI) analysis was performed for the differentially expressed proteins (DEPs). PPI networks were constructed for TB vs. HDTB (A), HDTB vs. HDTB+TBM (B), and TB vs. HDTB+TBM (C). All proteins are represented as circular nodes.

Figure 4.
Metabolomic profiling of differential metabolites (DEMs) between the HDTB and HDTB+TBM groups (positive and negative ion modes).Volcano plots (A) and hierarchical clustering heatmaps (B) depict the DEMs between the HDTB and HDTB+TBM groups acquired under negative (Negative) and positive (Positive) ionization modes. (C) Orthogonal partial least squares discriminant analysis (OPLS-DA) was performed based on the DEMs to discriminate between the HDTB and HDTB+TBM groups, with the results shown separately for the negative and positive ion modes. (D) KEGG pathway enrichment analysis of the DEMs between the HDTB and HDTB+TBM groups was conducted, with enrichment results presented separately for the negative and positive ion modes.

Figure 5.
Metabolomic analysis of differential metabolites (DEMs) between the TB and HDTB+TBM groups (positive and negative ion modes). Volcano plots (A) and hierarchical clustering heatmaps (B) illustrate the DEMs between the TB and HDTB+TBM groups acquired under negative (Negative) and positive (Positive) ionization modes. (C) Orthogonal partial least squares discriminant analysis (OPLS-DA) was conducted based on the DEMs to distinguish the TB and HDTB+TBM groups, with results presented separately for the negative and positive ion modes. (D) KEGG pathway enrichment analysis of the DEMs between the TB and HDTB+TBM groups was performed, and the enrichment results are shown separately for the negative and positive ion modes.

Figure 6.
Integrated metabolomic and proteomic analyses among the TB, HDTB, and HDTB+TBM groups. (A) Integrated metabolomic-proteomic analysis comparing the TB and HDTB groups. (B) Integrated metabolomic-proteomic analysis comparing the HDTB and HDTB+TBM groups. (C) Integrated metabolomic-proteomic analysis comparing the TB and HDTB+TBM groups.


Table 1.
Participant information for proteomic and metabolomic analyses.
| Variable | TB (n=5) | HDTB (n=6) | HDTB+TBM (n=6) | P Valuea | P Valueb |
|---|---|---|---|---|---|
| Age, y, mean ± SEM | 45.40±4.82 | 33.33±5.60 | 36.20±7.57 | 0.336c | 0.145c |
| BMI | 20.90±1.56 | 16.04±0.6 | 23.08±2.63 | 0.527c | 0.270c |
| Sex, female, No. (%) | 1 (20.00) | 2 (33.33) | 1 (16.67) | 0.887d | 0.621d |
| Blood routine | |||||
| WBC (109 /L), mean ± SEM | 6.76±0.84 | 6.22±0.84 | 7.14±1.11 | 0.814c | 0.666c |
| CRP ( mg/L), mean ± SEM | 18.63±12.59 | 61.79±20.07 | 21.85±6.46 | 0.805c | 0.117c |
| PCT (%),mean±SEM | 0.26±0.03 | 0.29±0.04 | 0.26±0.02 | 0.970c | 0.479c |
| CEA ( ng/mL), mean ± SEM | 3.02±0.93 | 1.73±0.41 | 1.36±0.22 | 0.039c | 0.249c |
| ESR (mm/h) , mean ± SEM | 32.2±9.68 | 43±26.26 | 55.5±11.79 | 0.195c | 0.685c |
| Cerebrospinal fluid biochemistry | |||||
| MTP-C(g/L), mean ± SEM | 0.29±0.02 | 0.26±0.08 | 0.74±0.19 | 0.047c | 0.730c |
| GLU-C (mmol/L), mean ± SEM | 4.10±0.90 | 2.90±0.10 | 2.15±0.30 | 0.039c | 0.175c |
| CL-C(mmol/L), mean ± SEM | 124.30±1.59 | 120.00±2.42 | 121.2±2.01 | 0.288c | 0.187c |
| ADA-C(u/L), mean ± SEM | 0.36±0.12 | 0.57±0.12 | 3.09±0.57 | 0.003c | 0.243c |
Abbreviations: TB, tuberculosis; HDTB, hematogenous disseminated tuberculosis; HDTB+TBM, hematogenous disseminated tuberculosis with tuberculous meningitis; BMI, body mass index; WBC, white blood cells; CRP, C-reactive protein; PCT, procalcitonin; CEA, carcinoembryonic antigen; ESR, erythrocyte sedimentation rate; MTP-C, Cerebrospinal fluid micrototal protein; GLU-C, Cerebrospinal fluid glucose; CL-C, Cerebrospinal fluid chlorinum; ADA-C, Cerebrospinal fluid Adenosine deaminase. aP values compare the TB vs. HDTB+TBM. Bold indicates P < 0.05. bP values compare the TB vs. HDTB . Bold indicates P < 0.05. C Unpaired t-tests. dChi-square tests.
Disclaimer/Publisher’s Note: The statements, opinions and data contained in all publications are solely those of the individual author(s) and contributor(s) and not of MDPI and/or the editor(s). MDPI and/or the editor(s) disclaim responsibility for any injury to people or property resulting from any ideas, methods, instructions or products referred to in the content. |
© 2026 by the authors. Licensee MDPI, Basel, Switzerland. This article is an open access article distributed under the terms and conditions of the Creative Commons Attribution (CC BY) license.
Copyright: This open access article is published under a Creative Commons CC BY 4.0 license, which permit the free download, distribution, and reuse, provided that the author and preprint are cited in any reuse.


