

Submitted:
23 April 2026
Posted:
24 April 2026
You are already at the latest version
Abstract
Urban areas are increasingly affected by geological and climate-driven processes that influence their safety, functionality, and long-term resilience. Conventional sustainability indicators mainly focus on anthropogenic impacts on the environment, while the role of subsurface conditions and physical processes shaping urban vulnerability remains underrepresented. To address this gap, the Urban Geo-climate Footprint (UGF) introduces an inverse perspective, assessing how geological and climatic factors exert pressure on urban systems. The methodology is based on the breakdown of geological effects into five drivers, Geology, Deep Geological Processes, Surface Processes, Exogenous and Climatic Processes, and Subsurface Anthropogenic Pressure. These drivers, in the derived tool, are articulated into 22 parameters evaluated from public datasets and expert judgment. These parameters are combined into a synthetic, standardised, reproducible and comparable index, the UGF Score Index (UGF-SI), ranging from 0 to 500 which enables direct comparison across cities and contexts. The application to 21 Italian cities highlights distinct spatial patterns, dominant drivers, and groups of cities facing similar geo-climatic challenges. The UGF framework represents a significant advancement in urban geoscience, supporting urban planning, risk awareness, and climate adaptation strategies by enhancing the understanding of subsurface-related pressures and promoting informed decision-making.
Keywords:
urban geology
; climate change
; urban subsurface
; urban resilience
; geological hazards
; urban geo-climate footprint
; UGF
1. Introduction
Urban areas are complex systems whose development, functionality, and resilience are strongly conditioned by geological, geomorphological, and climatic factors [1,2]. While urban sustainability assessments increasingly rely on indicators such as carbon or water footprints, these approaches primarily quantify anthropogenic pressures on the environment [3]. Conversely, the influence of subsurface conditions and physical processes on urban vulnerability remains underrepresented and often fragmented across sectoral analyses, thereby limiting the development of integrated planning strategies [4,5].
The Urban Geo-climate Footprint (UGF) methodology was developed to address this gap by providing a structured and operational framework that evaluates how geological and climatic processes influence urban systems. Rather than functioning as a multi-risk assessment tool, UGF aims to raise awareness of subsurface-related pressures and to support decision-makers, planners, and non-expert stakeholders in understanding geo-climatic constraints that affect cities [6].
This work presents the UGF methodology and provides a detailed description of its application to 21 Italian regional capital cities (Figure 1). The analysis was conducted between 2025 and 2026 by researchers at the Geological Survey of Italy (ISPRA – Italian Institute for Environmental Protection and Research) in collaboration with local expert geologists from universities, municipalities, and private practice.
Italy’s Geological Framework
Italy exhibits a highly complex geological framework resulting from the convergence between the African and Eurasian plates, which led to the formation of the Apennines and the Alps [7]. This structural configuration has not only shaped the country’s physical landscape but has also profoundly influenced, throughout history, the distribution and development of urban settlements. Mountain chains have acted both as natural barriers and corridors, conditioning trade routes, defensive strategies, and cultural interactions.
The Apennines display complex geological structures characterised by a wide variety of lithologies (limestone, shale, and sandstone) reflecting intense tectonic activity [8]. This diversity has directly affected settlement patterns: for instance, limestone-dominated areas are often associated with karst phenomena and limited surface water availability, historically constraining urban growth and water supply systems. In the southern sector (Calabria and northeastern Sicily), the geological domain is more crystalline, with similar formations also dominating in Sardinia. These conditions have generally favoured more fragmented settlement systems, often adapted to less fertile soils.
In the Alps, compressional tectonics generated large recumbent folds (nappes) and major thrust systems derived from the former Alpine Tethys, which were pushed northward and stacked over one another [9]. Crystalline basement rocks, exposed in the highest central regions, form iconic peaks such as Mont Blanc and the Matterhorn, while sedimentary sequences dominate the southern and southeastern margins, including the well-known Dolomites. This geological setting has strongly influenced human occupation: glacially carved valleys and structurally controlled corridors have hosted settlements and transportation networks, whereas steeper and more unstable areas have remained sparsely populated. Alternating with these major reliefs, and particularly along coastal sectors, are plains of varying thickness and extent. Among them, the Po Plain stands out for both its size and hydrogeological importance. The fertility of its alluvial soils and the abundance of groundwater resources [10,11,12] have supported dense populations since antiquity and enabled the development of major urban centres, making it still today one of the country’s primary economic cores.
Another key feature of Italy’s geological framework is the presence of active volcanoes, including Mount Vesuvius and the Phlegraean Fields near Napoli, as well as Mount Etna and the Aeolian Islands in Sicily, which are expressions of the peninsula’s active tectonics [13]. These volcanic systems have had a lasting impact on both landscape and human life: while posing significant natural hazards that continue to influence urban planning and risk management, they have also produced highly fertile soils [14], fostering agriculture and sustaining the growth of important settlements.
Geographical Context of Italian Regional Capitals
The geographical diversity of the Italian peninsula has historically acted as both a constraint and a catalyst for urban development, shaping settlement patterns that reflect centuries of adaptive responses to landscape, climate, and socio-political change. During the medieval period, the widespread preference for elevated terrain, particularly along the Apennine chain and its foothills, reflected the strategic priority of defence over agricultural productivity, giving rise to compact hilltop settlements whose spatial organisation remains visible in many contemporary urban centres. In contrast, the alluvial plains and river terraces of major drainage systems such as the Po, Arno, and Tiber provided fertile and stable ground that favoured the growth of early urban settlements, whose demographic and territorial expansion depended closely on the agricultural potential of the surrounding lowland areas.
The principal Italian cities analysed in this work (Figure 1) can be grouped into geographical contexts, each of which reflects not only a distinct altitudinal range but also a specific set of geomorphological conditions, landform associations, and associated natural processes, in response to which human communities developed and applied distinct strategies of adaptation and landscape modification. This framework was developed drawing inspiration from the approach proposed by [15], whose work demonstrates the fundamental role of the underlying geology in shaping urban morphology and settlement dynamics. Four principal contexts have been identified, as outlined below (Figure 2):
i. Coastal cities occupy on low-relief terrain at or near the shoreline. Their urban development has been shaped by the interaction between marine, fluvial, and anthropogenic processes. Characteristic features include beach ridges, coastal plains, deltas, lagoons, and cliffed coasts. Human intervention has historically involved port construction, land reclamation, and coastal defence work.
ii. Lowland cities are situated on alluvial plains or river terraces, typically within major river basins. These settings are underlain by sedimentary deposits ranging from fine to coarse grain sizes, with significant variability both laterally and vertically, low relief, and a dense hydrological network. Fluvial dynamics, including flooding, channel migration, and subsidence, have strongly influenced urban form and infrastructure development.
iii. Upland cities developed on hills or ridges, primarily within the Apennine system. This category encompasses a variety of geomorphological contexts, including structural ridges, erosional hills, and valley-side slopes. Gravitational processes, landsliding, and linear erosion are the dominant active processes. Historically, elevated positioning offered defensive and microclimatic advantages that guided settlement choices over agricultural or hydraulic considerations.
iv. Intermontane cities are located within enclosed mountain basins or confined valley floors, typically within the Alpine or highest Apennine systems. Their geomorphological setting is characterised by glacial and fluvioglacial landform associations, steep bounding valley sides, and active mass movement and alluvial fan processes. Urban development in these contexts has been strongly constrained by topographic confinement, constrained urban footprint, and significant natural hazard exposure.
Nevertheless, cities have frequently developed within complex geographical systems, in which multiple simple systems overlap and interact. Representative examples include Genova, situated within a coastal setting in which ridge morphology must also be considered, and Firenze, whose location along the Arno River valley floor is equally influenced by the surrounding hill system. The inherent complexity of such settings highlights the limitations of purely qualitative geographical classification. To address this, the UGF methodology provides a more comprehensive and quantitative framework for characterising the geo-climatic conditions of each urban centre, as described in the following sections. Table 1 presents a comprehensive classification scheme for the Italian regional capital cities.
2. Materials and Methods
The Urban Geo-climate Footprint (UGF) method assesses the influence of geological and climatic conditions on urban areas through a novel semi-quantitative, driver-based methodology described in previous works [16,17,18] and synthetised in Figure 3. The approach systematically evaluates pressures exerted by subsurface characteristics and physical processes on urban infrastructure, safety, and territorial planning.
The UGF framework is organised around five main drivers, each representing a coherent set of phenomena capable of exerting pressure on urban systems :
- Geology (GEO) – This driver describes the physical structure of the urban area, including physiography, unconsolidated deposits and bedrock, groundwater presence and interaction with urbanization, and anthropogenic fill materials.
- Deep Geological Processes (DEE) – This driver includes phenomena linked to deep Earth processes, such as seismic hazard, tsunami hazard, volcanic eruptions, natural gas emissions, and natural sinkholes.
- Surface Processes (SUP) – This driver encompasses surface-related hazards, including landslides, floods, subsidence, and coastal hazards.
- Exogenous and Climatic Processes (EXO) – This driver addresses climate-driven pressures such as changes in extreme rainfall, drought risk, and projected sea-level rise.
- Subsurface Anthropogenic Pressure (SAP) – Although not strictly natural, this driver accounts for anthropogenic pressures on the subsurface, including soil sealing, contaminated sites, groundwater stress, and abandoned underground cavities.
Together, these drivers provide an integrated and multiscale representation of geo-climatic pressures acting on cities. The five drivers are articulated into 22 parameters, calculated using three different approaches:
- Quantitative parameters, derived from measurements or numerical models;
- Fixed-value parameters, based on expert classifications or thematic maps;
- Percentage-based parameters, calculated as proportions of the urban area.
Each parameter is normalised to a score between 0 and 100, where higher values indicate greater geological complexity and/or potential criticality. The normalization procedure ensures comparability across different urban contexts and geographical settings. Most parameters rely on publicly available datasets at national, European, or global scales, while selected parameters are based on expert judgement and local geological knowledge.
For the Italian case study, national datasets were used for parameters related to surface and subsurface geology, seismic hazard, gas emissions, sinkhole susceptibility, landslide and flood hazards, coastal hazard, soil consumption, and contaminated sites.
Each parameter is weighted according to three main criteria:
- Spatial extent of the phenomenon, with widespread processes (e.g., subsidence, floods) weighted more heavily than localised ones (e.g., isolated landslides);
- Nature of the process, distinguishing between sudden events (shocks), such as earthquakes or volcanic eruptions, and gradual processes (stresses), such as soil consumption or coastal erosion;
- Historical impact, considering documented events that caused damage, injuries, or fatalities.
These criteria ensure that the index reflects both physical characteristics and historical evidence of impact grounding the UGF-SI in empirical evidence rather than theoretical hazard alone.
The combination of parameter scores produces the UGF Score Index (UGF-SI), a dimensionless value ranging from 0 to 500, obtained by summing the normalised scores of the five drivers (each with a maximum theoretical value of 100) this additive structure ensures transparency and reproducibility, allowing users to trace the contribution of each driver to final score. Based on UGF-SI, cities are classified into four classes:
- UGF-1: low complexity
- UGF-2: moderate complexity
- UGF-3: high complexity
- UGF-4: very high complexity
In addition to UGF-SI, cities are classified according to the pair of drivers with the highest scores, enabling the identification of groups of cities characterised by similar geo-climatic conditions and challenges.
The UGF methodology also includes complementary indices:
- Geohazard Index, aggregating all parameters related to geological hazards;
- Shock–Stress Ratio, indicating the dominance of sudden versus gradual processes;
- SAP Index, highlighting anthropogenic pressure on the subsurface;
- Geo-Benefits Index, a semi-qualitative assessment of geological resources, including geo-heritage, groundwater productivity, and shallow geothermal potential.
Geo-benefits do not influence the UGF-SI but contribute to a broader understanding of urban geo-climatic contexts and represent a distinctive feature of the UGF that acknowledges the positive role of geological resources in urban systems. Due to the aim of this work to highlight the pressures on the Italian cities, the Geo-Benefits results are not presented and discussed here.
The methodology is implemented through a freely available Microsoft Excel tool composed of multiple worksheets, including a glossary and user guide. The core worksheet, UGF Basic, hosts parameter input and index calculation. The analysis must be conducted by expert users (e.g., geologists or technical professionals) and can follow three increasing levels of detail: bibliographic analysis, expert local analysis, and peer-reviewed analysis.
The main output is the City Geo Factsheet, a concise and visual summary designed for non-expert users. For this work it has been used the UGF tool release 10.2 (available at the ISPRA website [19].
3. Results
The application of the UGF methodology to 21 Italian regional capitals, (Table 2 and Figure 4) reveals a wide spectrum of geo-climatic complexity. Cities range from low-complexity contexts (UGF-1), such as Trento and Campobasso, to very high complexity (UGF-4), represented by Napoli and Genova.
The distribution of UGF classes highlights the combined influence of geological structure, climate exposure, and anthropogenic pressure. Higher UGF-SI values are typically associated with the simultaneous presence of deep processes, surface hazards, climate-driven pressures, and intensive subsurface use confirming that geo-climatic complexity is rarely driven by a single factor but rather by the convergence of multiple pressures.
3.1. Spatial Patterns and Dominant Drivers
A latitudinal trend emerges, with UGF-SI generally increasing southward. This pattern reflects the stronger influence of seismicity, volcanism, coastal dynamics, and Mediterranean climate stressors in southern Italy. Coastal cities tend to exhibit higher SUP and EXO scores, while large metropolitan areas show elevated SAP values highlighting the distinct geo-climatic footprints associated with different urban typologies.
The GEO driver remains consistently significant across cities, reflecting Italy’s high geocomplexity in terms of recent depositional settings or ancient sedimentary sequences affected by tectonics.. Also SUP driver is significant in the analysed cities. The averagely greater contribution of GEO and SUP drivers is also clearly visible in Figure 5, where each city is represented through a 2D vector-based projection of normalised driver scores. Specifically, for each city the four drivers were first normalised and then projected onto orthogonal axes by computing the difference between opposing components (SUP–EXO for the x-axis and GEO–DEE for the y-axis), so that each point reflects the relative dominance of the four drivers. The average driver importance is shown by the same radar graph shape that is used in the results of the UGF tool.
The Geohazard Index closely follows SUP and DEE drivers, confirming their crucial contribution in urban geological risk.
Based on dominant driver pairs, four groups of cities are identified (Figure 6):
- GEO–SUP, characterised by strong interaction between geological complexity and surface processes;
- GEO–EXO, dominated by geological complexity and climate-driven pressures;
- GEO–DEE, marked by the influence of seismic and volcanic processes;
- EXO–SUP, dominated by climate and surface dynamics.
This classification supports comparative analysis and facilitates the exchange of good practices among cities facing similar challenges.
4. Discussion
The application of the UGF to the 21 Italian regional capitals provides a rich and articulated overview of the geological and climatic variability of the Italian territory. The selection of these cities, representative of the country’s main geographical, climatic, and structural differences, made it possible to test the methodology across the different geographical contexts listed in the introduction chapter, ranging from Alpine systems to coastal areas, and extending to the volcanic regions of southern Italy.
The results (Figure 4, Table 2) show a very broad spectrum of conditions, with cities such as Trento and Bolzano exhibiting minimal levels of geological-climatic complexity and pressure (UGF class 1), and cities such as Genova and Napoli classified as UGF-4 due to a unique combination of strong exposure to surface and anthropogenic processes in the former, and seismicity, active volcanism, and anthropogenic subsidence phenomena in the latter.
The distribution of UGF classes is as follows:
- UGF-4: 2 cities (Genova, Napoli)
- UGF-3: 8 cities (Firenze, Ancona, Perugia, L’Aquila, Roma, Bari, Catanzaro, Palermo)
- UGF-2: 9 cities (Aosta, Trieste, Milano, Venezia, Torino, Bologna, Campobasso, Potenza, Cagliari)
- UGF-1: 2 cities (Bolzano, Trento)
As expected from the functioning of the UGF methodology, cities with higher UGF-SI values are often influenced by the simultaneous interaction of multiple factors: deep processes (e.g., seismicity or volcanism), surface processes (e.g., landslides, floods, or subsidence), climatic factors (e.g., extreme rainfall, drought), and strong anthropogenic pressures (e.g., land consumption, soil sealing, subsurface pollution). In the case of Napoli, the DEE driver dominates the framework with exceptionally high scores, reflecting the presence of the active volcanic complexes of the Flaegrean Fields and Mount Vesuvius, as well as high levels of seismicity and geological complexity (GEO). Conversely, Venice represents a case of vulnerability linked primarily to SUP drivers, but also to EXO factors: natural and anthropogenic subsidence, sea-level rise, recurrent flooding, and a complex geological setting (GEO), with a delicate interaction between the lagoon system and coastal morphology.
It is important to emphasize that UGF class values do not represent a “ranking” of cities in terms of being more “unfortunate” due to geological-climatic pressures. Rather, they constitute a tool for raising awareness of potential critical issues, which are often already appropriately addressed and mitigated by relevant authorities, but are not always widely perceived.
Analysis of the drivers reveals a geographical differentiation highlighted in Figure 4, which presents cities in order of decreasing latitude. With a few exceptions, it is evident that UGF-SI values generally increase moving southward. This reflects the combined effect of several factors: on the one hand, the peninsular sector of the country is more influenced by marine-related dynamics; on the other hand, the contribution of deep processes becomes more evident due to higher seismic activity along the Apennines and the presence of active volcanic districts in southern Italy. Furthermore, due to Italy’s geographical position extending into the central Mediterranean, exposure to climate change effects (such as desertification) is greater compared to other continental European countries, with the Mediterranean recognised as a climate change hotspot, as recently confirmed by international studies [20]. Evidence of this can also be observed in the quantification of EXO driver scores, which show a slight increase in southern Italian cities, with some exceptions. Additionally, certain parameters of the SUP driver (such as landslides, floods, and coastal dynamics) are influenced by climate change and contribute to increasing scores across Italian cities.
At lower latitudes, cities located closer to the Apennine chain tend to exhibit higher DEE values, particularly due to seismicity, active volcanism, and, in some coastal cases, potential exposure to tsunamis. Coastal cities generally display relatively higher SUP and EXO scores due to coastal erosion, storm surges, and sea-level rise.
One driver that shows relative consistency across cities (with some exceptions) is GEO, reflecting the overall geological complexity of the country.
Large cities predictably exhibit high SAP scores, mainly associated with significant land consumption, soil and groundwater pollution, and, in some cases, unmanaged underground cavities that may compromise surface stability. This driver sometimes contributes significantly to the total UGF-SI, as observed in cities such as Genova, Ancona, Bari, Napoli, and Palermo.
Another element visible in the results graph is the black line representing the Geohazard Index, which, as expected, is fairly proportional to the two drivers most strongly associated with geological hazards: SUP and DEE.
Looking at four groups of cities presented in the results (Figure 5), it should be noted that this classification is not “absolute” but relative. As previously described, the methodology identifies only the two drivers with the highest scores relative to the others, and the group is defined based on this pair. This system is highly effective when differences between drivers are substantial but less representative when the remaining driver values differ only slightly from the top two. For this reason, the classification reported in individual city sheets (see Supplementary Material) also includes the four highest-scoring parameters, allowing for the representation of specific critical issues regardless of the assigned group. An example is the city of L’Aquila (UGF3 – UGF-SI 238): its group classification is GEO–SUP, yet its highest individual parameter is seismic hazard. This is because, although the seismic hazard parameter has a very high score, the absence of other contributing deep processes (DEE) results in a relatively moderate overall DEE value (32.3 out of 100).
As follows, the comments on the four identified city clusters:
• GEO–SUP: the largest group, with 14 cities, characterised by a strong interaction between geological complexity and surface processes. As previously noted, due to the overall geological complexity of Italy, the GEO driver is relatively consistent and significant across cities, making it one of the two dominant drivers in three out of four groups identified. Moreover, some GEO parameters relate to the lithological nature of the substratum, assigning higher weight—and thus higher scores—to alluvial deposits, which often characterize the subsurface of cities historically developed along riverbanks. Surface processes (SUP) are also a constant in Italian cities, often for the same reasons, but also due to coastal phenomena affecting 5 of the 13 cities in this group, as well as landslides and subsidence. Comparing this cluster with the geographical contexts listed in the introduction, all the Lowland and Intermontane cities are included here. This is probably due to the general relationships with the water courses (Lowland cities) and the in common reliefs energy and significant natural hazard exposure (Intermontane cities).
• GEO–EXO: 3 cities, characterised by geological complexity and exogenous processes. This group includes Campobasso, Potenza, and Cagliari, which differ in typology and geographical location but all fall within UGF class 2. A common feature in terms of the EXO driver is susceptibility to drought events, rated as “medium-high” in all three cities. Since these cities generally have low UGF-SI values, the contributing parameters are of moderate importance. In Cagliari, a coastal city, potential sea-level rise also plays a significant role.
• GEO–DEE: 3 cities, characterised by geological complexity and deep processes. Only three cities fall into this group, including Napoli, which currently has not only the highest UGF-SI value nationally (359) but also at the European level. The other cities are Palermo (UGF-SI 265) and Trieste (UGF-SI 162). This group clearly illustrates the difference between UGF-SI score classes and UGF classification based on the relative importance of drivers. Although belonging to the same group, these cities fall into three different UGF classes. The concentration of deep processes in Napoli represents a unique case at national, European, and even global scale. Palermo shows DEE-related criticalities linked to seismic hazard, potential tsunamis, and possible natural sinkholes due to carbonate substrata in some areas. Trieste exhibits relatively high seismic hazard due to its proximity to active Alpine structures and past significant events; however, in the absence of other major criticalities and with geological complexity comparable to other cities, its overall UGF-SI remains relatively low. A common feature among all three cities is the presence of anthropogenic underground cavities that may lead to surface subsidence.
• EXO–SUP: 1 city, characterised by exogenous and surface processes. The only city in this group is Bari (UGF-SI 255). Flood hazards and historically significant events, together with coastal dynamics, contribute substantially to the SUP driver score, while exposure to drought episodes and projected sea-level rise account for the relatively high EXO score. Although not exhibiting particularly high values in other natural drivers, Bari shows a high level of anthropogenic pressure on the subsurface, which contributes to increasing its overall UGF-SI.
Looking at Figure 7a the clear latitudinal gradient in the UGF Score Index across Italian cities is visible, with values generally increasing toward lower latitudes (i.e., moving from Northern to Southern Italy), consistent with the pattern previously discussed in the manuscript. This trend suggests a growing prevalence of geological and geo-climatic criticalities, such as slope instability, seismic exposure, and climate-related stressors, in southern urban contexts. When this pattern is compared with the GDP per capita of the corresponding provinces of the considered cities [21], an inverse relationship emerges (negative correlation). The linear trend of GDP shows a general decrease along the same North–South gradient, opposing the upward trend of the UGF Score Index. In other words, higher UGF values, indicating greater environmental and geological vulnerability, are associated with relative lower levels of economic output. This spatial association is consistent with findings from regional geo-hazard assessments showing that geological risk and economic development are significantly and spatially correlated, albeit in different geographic contexts [22]. These two variables (UGF-SI and GDP per capita) were also analysed through a scatter plot correlation graph (Figure 7b) and the Pearson’s correlation coefficient to assess the linear correlation between them.
The analysis showed a moderate-to-strong negative correlation (r = -0.671), which was highly significant (p-value = 0.0009; p < 0.001). As a control analysis, Spearman’s correlation (non-parametric) was used, which confirms and reinforces Pearson’s result, suggesting that the relationship is robust and does not depend on assumptions of normality (ρ = -0.718, p-value = 0.0002). As for the linear regression (R² = 0.45), this indicates that GDP per capita explains 45% of the variance in the UGF index. This negative correlation has several important implications. First, it suggests that geophysical and climatic constraints may play a non-negligible role in shaping regional economic disparities, potentially limiting infrastructure resilience, investment attractiveness, and long-term development capacity in more vulnerable areas as already highlighted by several authors [23,24]. Second, the coexistence of higher risk and lower economic resources in southern regions may exacerbate systemic fragility, reducing the ability of local administrations to effectively mitigate or adapt to environmental hazards, as already well documented in the literature [25,26,27]. The bidirectional relationship between disasters and inequality, whereby hazard-prone areas tend to remain economically disadvantaged through a self-reinforcing cycle, further compounds territorial disparities [28].
Finally, these findings point to the need for targeted policy interventions that integrate risk reduction with economic development strategies, prioritizing investments in resilience, land management, and climate adaptation in areas where vulnerability and economic disadvantage overlap most strongly.
4.1. Limitations
Notwithstanding the interesting results, it is important to highlight that the UGF methodology has some limitations. Analyses are conducted at the municipal administrative scale, which may include uninhabited areas. The methodology does not replace multi-risk assessments, and some parameters rely on European or global datasets.
5. Conclusions
The Urban Geo-climate Footprint (UGF) provides a novel and communicative framework for assessing how geological and climatic conditions influence urban systems.
The UGF methodology provides insights that are often overlooked by traditional urban indicators. By focusing on subsurface conditions and physical processes, UGF supports strategic planning, climate adaptation, and risk awareness. Importantly, UGF classes do not represent a ranking of “unfortunate” cities but rather a diagnostic tool that highlights priorities and context-specific challenges.
By shifting the analytical focus from environmental impacts generated by cities to the pressures exerted by subsurface and physical processes on urban environments, the methodology fills a critical gap in urban sustainability and resilience assessments.
The application to Italian cities demonstrates the ability of the UGF to capture spatial variability, identify dominant geo-climatic drivers, and group cities according to shared challenges rather than absolute levels of risk. This makes the UGF particularly suitable as a decision-support and awareness-raising tool for urban planners, local authorities, and non-expert stakeholders.
Although the methodology does not replace detailed multi-risk analyses, it offers a complementary perspective that emphasizes the strategic role of subsurface conditions as a primary urban infrastructure. The UGF framework is transferable to different geographical contexts, provided that appropriate datasets and expert knowledge are available. Its integration into urban regeneration, climate adaptation, and long-term planning strategies can foster more resilient and geologically informed cities.
Supplementary Materials
The following supporting information can be downloaded at: Preprints.org, Figure 3, UGF Tool release 10.2, The 21 city geo factsheets of the analysed cities which references quoting are listed as follows [29,30,31,32,33,34,35,36,37,38,39,40,41,42,43,44,45,46,47,48,49,50,51,52,53], following the cities’ order.
Author Contributions
“Conceptualization, methodology, validation, data curation, all the authors; writing—original draft preparation, Francesco La Vigna and Saverio Romeo; writing—review and editing, all the authors.; supervision, Francesco La Vigna; project administration, Francesco La Vigna. All authors have read and agreed to the published version of the manuscript.
Funding
This research received no external funding
Data Availability Statement
Data presented in this study are available on the article and Supplementary Materials, and at the UGF website http://ugf.isprambiente.it/ together with the City Geo Factsheets and the UGF tool. The current release of the tool is the 10.2; the tool is periodically updated and therefore, its release can change in the future.
Acknowledgments
The authors are grateful to the following colleagues who collaborated to the cities’ analyses and review: Chiara D’Ambrogi, Rossella Maria Gafà, Serena Giacomelli, Giuditta Radeff (ISPRA); Maurizio Polemio (CNR IRPI); Mauro De Vito (INGV); Catia Di Nisio (Ordine dei geologi dell’Abruzzo); Fabio Procopio (Ordine dei geologi della Calabria); Claudio Morelli (Provincia autonoma di Bolzano); Mauro Zambotto (Provincia autonoma di Trento); Giovanni Luise (Regione Sardegna); Giuseppe Corrado e Fabio Olita (Università degli Studi della Basilicata); Federico Raspini (Università degli Studi di Firenze); Francesco Faccini (Università degli Studi di Genova); Laura Melelli (Università degli Studi di Perugia); Chiara Cappadonia (Università degli Studi di Palermo); Francesco Seitone e Gabriella Forno (Università degli Studi di Torino); Carlo Esposito (Università degli Studi La Sapienza - CERI); Corrado Alberto Sigfrido Camera (Università degli studi di Milano); Paolo Fabbri (Università degli Studi di Padova); Luca Zini (Università degli Studi di Trieste); Davide Fronzi (Università Politecnica delle Marche).
Conflicts of Interest
The authors declare no conflicts of interest.
Abbreviations
The following abbreviations are used in this manuscript:
| UGEG | Urban Geology Expert Group of EuroGeoSurveys |
| UGF | Urban Geo-climate Footprint |
| UGF-SI | UGF Score Index |
| GEO | Geological pressure driver |
| DEE | Deep processes driver |
| SUP | Superficial processes driver |
| EXO | Exogenous and climatic processes driver |
| SAP | Subsoil anthropic pressure |
| GDP | Gross Domestic Product |
References
- Bricker, S.; Jelenek, J.; Van der Keur, P.; La Vigna, F.; O’Connor, S.; Ryzynski, G.; Smith, M.; Schokker, J.; Venvik, G. Geoscience for Cities: Delivering Europe’s Sustainable Urban Future. Sustainability 2024, 16, 2559. [Google Scholar] [CrossRef]
- Bathrellos, G. D. An overview in urban geology and urban geomorphology. Bulletin of the Geological Society of Greece 2007, 40(3), 1354–1364. [Google Scholar] [CrossRef]
- Laurent, A.; Olsen, S.I.; Hauschild, M.Z. Limitations of Carbon Footprint as Indicator of Environmental Sustainability. Environ. Sci. Technol. 2012, 46(7), 4100–4108. [Google Scholar] [CrossRef]
- Makana, L.O.; Jefferson, I.; Hunt, D.V.L.; Rogers, C.D.F. Assessment of the future resilience of sustainable urban sub-surface environments. Tunnelling and Underground Space Technology 2016, Volume 55, 21–31. [Google Scholar] [CrossRef]
- Hunt, D.V.L.; Makana, L.O.; Jefferson, I.; Rogers, C.D.F. Liveable cities and urban underground space. Tunnelling and Underground Space Technology 2016, 55, 8–20. [Google Scholar] [CrossRef]
- Hollis, J.; Pizzocolo, F.; La Vigna, F.; Piessens, K.; Tulstrup, J. Progress and ambitions of the European Geological Survey Organisations in delivering harmonised subsurface data as the basis for informed energy transition policy. European Geologist 2023, 56. [Google Scholar] [CrossRef]
- Servizio Geologico d’Italia – ISPRA, Compagnoni B., Galluzzo F., Bonomo R., Capotorti F., D’Ambrogi C., Di Stefano R., Graziano R., Martarelli L., Pampaloni M. L., Pantaloni M., Ricci V., Tacchia D., Masella G., Pannuti V., Ventura R., Vitale V. (Eds.). Carta geologica d’Italia alla scala 1:1.000.000. S.EL.CA., Firenze 2011.
- Vai, F.; Martini, I. P. (Eds.). Anatomy of an orogen: the Apennines and adjacent Mediterranean basins. Springer 2013.
- Stampfli, G.M.; Borel, G.D. The TRANSMED Transects in Space and Time: Constraints on the Paleotectonic Evolution of the Mediterranean Domain. In Cavazza W, Roure F, Spakman W, Stampfli GM, Ziegler P (Eds.). The TRANSMED Atlas: the Mediterranean Region from Crust to Mantle. Springer Verlag 2004. ISBN 978-3-540-22181-4.
- Beretta, G.P.; La Vigna, F.; Camera, C.A.S.; Gafà, R.M.; Citrini, A.; Martarelli, L.; Monti, G.M.; Roma, M.; Silvi, A.; Vitale, V.; Fiori, C.; Masetti, M.; Pascarella, F.; Proietti, R.; Lo Faro, S.; Congi, M.P.; Gerardi, M.; Tersigni, S.; Baldoni, T.; Ramberti, S.; Barbato, G.; Mercogliano, P.; Giugliano, G. Carta Idrogeologica d’Italia alla scala 1:500.000 - 4 Fogli, Note integrative e tabelle online - Hydrogeological Map of Italy 1:500.000 scale. 4 Sheets, Supplementary Notes and online tables; ISPRA - Dipartimento per il Servizio Geologico d’Italia - Geological Survey of Italy: Roma, 2025. [Google Scholar]
- La Vigna, F.; Alberti, L.; Da Pelo, S.; Ducci, D.; Fabbri, P.; Gargini, A.; Lasagna, M.; Pappalardo, G.; Polemio, M.; Rusi, S. Exploring the aquifers shaping Italy’s sub-urban landscape. Acque Sotterranee - Italian Journal of Groundwater 2024, 13(3), 43–66. [Google Scholar] [CrossRef]
- La Vigna F., Camera, C.A.S., Beretta G.P., Gafà R.M., Roma M., Citrini A., Martarelli L., Monti G.M., Silvi A., Vitale V., Fiori C., Masetti M., Pascarella F., Proietti R., Lo Faro S., Congi M.P., Gerardi M., Tersigni S., Baldoni T., Ramberti S., Barbato G., Mercogliano P. Groundwater of Italy. Journal of Maps (submitted.
- Santacroce, R.; Cristofolini, R.; Volpe, L.L.; Orsi, G.; Rosi, M. Italian active volcanoes. Episodes 2003, 26, 227–234. [Google Scholar] [CrossRef]
- Branca, S.; Cinquegrani, A.; Cioni, R.; Conte, A.M.; Conticelli, S.; De Astis, G.; de Vita, S.; Di Vito, M.A.; Donato, P.; Forni, F.; Francalanci, L.; Gaeta, M.; Giaccio, B.; Giordano GGiuffrida, M.; Isaia, R.; Lucchi, F.; Marra, F.; Massaro, S.; Nicotra, E.; Palladino, D.M.; Perinelli, C.; Petrosino, P.; Pistolesi, M.; Sepulveda-Birke, J.P.; Sottili, G.; Romagnoli, C.; Rotolo, S.; Sulpizio, R.; Tranne, C.A.; Viccaro, M. The italian quaternary volcanism. Alpine and Mediterranean Quaternary 2023, 36, 221–284.
- Pica, A.; Lämmle, L.; Burnelli, M.; Del Monte, M.; Donadio, C.; Faccini, F.; Lazzari, M.; Mandarino, A.; Melelli, L.; Perez Filho, A. Urban Geomorphology Methods and Applications as a Guideline for Understanding the City Environment. Land 2024, 13, 907. [Google Scholar] [CrossRef]
- Lentini, A.; Benjumea, B.; Bricker, S.; Chiessi, V.; Devleeschouwer, X.; Galve, J.P.; Giordano, G.; Guarino, P.M.; Kearsey, T.; Leoni, G.; Pizzino, L.; Puzzilli, L.M.; La Vigna, F. Clustering urban areas by a geological point of view: The Urban Geo Footprint tool. EGU General Assembly 2022. [Google Scholar] [CrossRef]
- Lentini, A.; Galve, J.P.; Benjumea, B.; Bricker, S.; Devleeschouwer, X.; Guarino, P.M.; Kearsey, T.; Leoni, G.; Puzzilli, L.M.; Romeo, S.; Venvik, G.; La Vigna, F. The Urban Geo-climate Footprint approach: Enhancing urban resilience through improved geological conceptualisation. Cities 2024, 145, 105287. [Google Scholar] [CrossRef]
- La Vigna, F.; Lentini, A.; Galve, J.P.; Benjumea, B.; Bricker, S.; Devleeschouwer, X.; Guarino, P.M.; Kearsey, T.; Leoni, G.; Puzzilli, L.M.; Romeo, S.; Venvik, G. Decoding the urban geo-puzzle: Navigating geological issues and global challenges through the lens of the Urban Geo-climate Footprint. EGU General Assembly 2024. [Google Scholar] [CrossRef]
- ISPRA – Urban Geo-climate Footprint web page. Available online: http://ugf.isprambiente.it/ (accessed on 31 March 2026).
- Reale, M.; et al. Acidification, deoxygenation, and nutrient and biomass declines in a warming Mediterranean Sea. Biogeosciences 2022, 19, 4035–4065. [Google Scholar] [CrossRef]
- ISTAT - Stima preliminare del Pil - IV trimestre 2025 – Valore Aggiunto - Available online: URL. Available online: https://www.istat.it/comunicato-stampa/stima-preliminare-del-pil-iv-trimestre-2025/ (accessed on 31 March 2026).
- Tang, B.; Ren, H.; Qiu, J.; Miao, C.; Chen, Y. Evaluation of geo-hazard risks in the Pearl River Delta based on geographic information system and weighted informativeness approach. Front. Environ. Sci. 2024, 12, 1406386. [Google Scholar] [CrossRef]
- Bodenstein, M.; Scaramucci, M. On the GDP effects of severe physical hazards. Eur. Econ. Rev. 2025, 175, 105019. [Google Scholar] [CrossRef]
- Daher, N. Is growth at risk from natural disasters? Evidence from quantile local projections. Ecol. Econ. 2026, 243, 108933. [Google Scholar] [CrossRef]
- Le, A.H.; Park, D.; Beirne, J.; Uddin, G.S. How does disaster risk impact fiscal sustainability and inequality? Econ. Modell. 2025, 151, 107220. [Google Scholar] [CrossRef]
- Jia, Y.; Jia, S.; Pang, R. Measurement and impact analysis of social vulnerability to geological disasters in Guizhou Province, China. Sci. Rep. 2024, 14, 25098. [Google Scholar] [CrossRef]
- Han, Y.; Jia, H.; Xu, C.; Bockarjova, M.; van Westen, C.; Lombardo, L. Unveiling spatial inequalities: Exploring county-level disaster damages and social vulnerability on public disaster assistance in contiguous US. J. Environ. Manag. 2024, 351, 119690. [Google Scholar] [CrossRef]
- Cappelli, F.; Costantini, V.; Consoli, D. The trap of climate change-induced “natural” disasters and inequality. Glob. Environ. Change 2021, 70, 102329. [Google Scholar] [CrossRef]
- La Vigna, F. Review: Urban groundwater issues and resource management, and their roles in the resilience of cities. Hydrogeology Journal 2022. [Google Scholar] [CrossRef]
- Brandner, R.; Gruber, A.; Morelli, C.; Mair, V. Field trip 1. Pulses of Neotethys rifting in the Permomesozoic of the Dolomites. Geo Australasia 2016, 13, 7–70. [Google Scholar]
- Avanzini, M.; Bargossi, G.M.; Borsato, A.; Selli, L. Note Illustrative della Carta Geologica d’Italia alla scala 1:50.000, F. 60 Trento; ISPRA - Serv. Geol. d’It.: Roma, 2010. [Google Scholar] [CrossRef]
- Gianotti, F.; Forno, M. G. Il Quaternario della Conca di Aosta nell’ambito del modellamento glaciale del bacino della Dora Baltea. Geologia dell'Ambiente 2017, 2 (suppl), 12–17. [Google Scholar]
- De Luca, D. A.; Masciocco, L.; Capodaglio, P.; Caviglia, C.; Lasagna, M. Idrogeologia della Piana di Aosta (Valle d'Aosta). Geologia dell'Ambiente 2017, 22–26. [Google Scholar]
- Busetti, M.; Zgur, F.; Romeo, R.; Sormani, L.; Pettenati, F. Caratteristiche geologico-strutturali del Golfo di Trieste. Contributi al Meeting Marino. Progetto CARG. Cartografia geologica delle aree marine, Roma 25-26 ottobre 2012; pp. 65–70. [Google Scholar]
- Francani, V.; Piccin, A.; Credali, M.; Berra, F.; Battaglia, D.; Gattinoni, P.; Rigamonti, I.; Rosselli, S. Note Illustrative della Carta Geologica d’Italia alla scala 1:50.000, F. 118 Milano; ISPRA - Serv. Geol. d’It.: Roma, 2016. [Google Scholar] [CrossRef]
- Zezza, F. The sedimentary structure of Upper Pleistocene–Holocene deposits in Venice and its effects on the stability of the historic centre. Rendiconti Lincei 2010, 21 (Suppl 1), 211–227. [Google Scholar] [CrossRef]
- Piana, F.; Fioraso, G.; Irace, A.; Mosca, P.; D’atri, A.; Barale, L.; Vigna, G. B. Geology of Piemonte region (NW Italy, Alps–Apennines interference zone). Journal of Maps 2017, 13(2), 395–405. [Google Scholar] [CrossRef]
- Irace, A.; Marcelli, I.; Fioraso, G.; Festa, A.; Catanzariti, R.; Raco, B.; Doveri, M. Subsurface geology of the Torino metropolitan area (Westernmost Po Plain, NW Italy). Journal of Maps 2024, 20(1), 2391963. [Google Scholar] [CrossRef]
- Giacomelli, S.; Zuccarini, A.; Amorosi, A.; Bruno, L.; Di Paola, G.; Martini, A.; Berti, M. 3D geological modelling of the Bologna urban area (Italy). Engineering Geology 2023, 324, 107242. [Google Scholar] [CrossRef]
- Paliaga, G.; Luino, F.; Turconi, L.; Faccini, F. Inventory of geo-hydrological phenomena in Genova municipality (NW Italy). Journal of Maps 2019, 15(2), 28–37. [Google Scholar] [CrossRef]
- Brandolini, P.; Firpo, M.; Marini, M.; Piccazzo, M.; Ramella, A.; Terranova, R. Osservazioni preliminari sull'evoluzione quaternaria dell'area del Porto Vecchio di Genova. Alpine and Mediterranean Quaternary 1996, 9(1), 375–380. [Google Scholar]
- Coli, M.; Ripepe, M.; Lacanna, G.; Iandelli, N.; Tanganelli, M.; Baglione, M.; D’Intinosante, V.; Daniele Giomarelli, D.; Positano, P.; Bordoni, G.; Tanini, C.; Paggetti, G.; Ciarleglio, L. La microzonazione sismica e le analisi delle condizioni limite per l’emergenza del Comune di Firenze. Regione Toscana, Direzione Ambiente ed Energia, Settore Sismica, Comune di Firenze. Università degli Studi di Firenze 2022. [Google Scholar]
- Cello, G.; Coppola, L. Modalità e stili deformativi nell’area anconetana. Studi Geologici Camerti 1989, 11, 37–47. [Google Scholar]
- Melelli, L.; Silvani, F.; Ercoli, M.; Pauselli, C.; Tosi, G.; Radicioni, F. Urban geology for the enhancement of the hypogean geosites: The Perugia underground (Central Italy). Geoheritage 2021, 13(1), 18. [Google Scholar] [CrossRef]
- Gruppo di Lavoro MS–AQ Microzonazione sismica per la ricostruzione dell’area aquilana. Regione Abruzzo – Dipartimento della Protezione Civile 2010, L’Aquila, 3 vol. e Cd-rom.
- Donati, S.; Cifelli, F.; Funiciello, R. Indagini macrosismiche ad alta densità per lo studio del risentimento sismico nella città di Roma. SELCA, Firenze, 2008. [Google Scholar]
- MS-CB Studi di Microzonazione sismica della Regione Molise. Provincia di Campobasso – Regiona molise . 2006. Available online: https://www.regione.molise.it/flex/cm/pages/ServeBLOB.php/L/IT/IDPagina/381.
- Pieri, P.; Sabato, L.; Spalluto, L.; Tropeano, M. Carta geologica dell’area urbana di Bari in scala 1:25.000; Edizioni LAC: Firenze, 2009. [Google Scholar]
- Isaia, R.; Iannuzzi, E.; Sbrana, A.; Marianelli, P.; Donadio, C.; Conforti, A.; D’Argenio, B. Note Illustrative della Carta Geologica d’Italia alla scala 1:50.000, F. 446-447 Napoli; ISPRA - Serv. Geol. d’It.: Roma, 2018. [Google Scholar] [CrossRef]
- Pescatore, T.; Di Nocera, S.; Matano, F. Note Illustrative della Carta Geologica d’Italia alla scala 1:50.000, F. 470 Potenza; ISPRA - Serv. Geol. d’It.: Roma, 2012. [Google Scholar] [CrossRef]
- Carmignani, L.; Oggiano, G.; Barca, S.; Conti, P.; Salvadori, I.; Eltrudis, A.; Funedda, A.; Pasci, S. () - Geologia della Sardegna. Note illustrative della Carta Geologica in scala 1:200.000. Mem. Descr. Carta Geol. It 2001, LX, 283. [Google Scholar]
- Procopio, F.; Marabini, S. Peculiarità paleomorfologiche dell’acrocoro su cui poggia il centro storico di Catanzaro. In Geologia delle Grandi Aree Urbane; 1997. [Google Scholar]
- Cappadonia, C.; Di Maggio, C.; Agate M. Agnesi, V. Geomorphology of the urban area of Palermo (Italy). Journal of Maps 2020, 16(2), 274–284. [Google Scholar] [CrossRef]
Figure 1.
Location of the analysed cities.
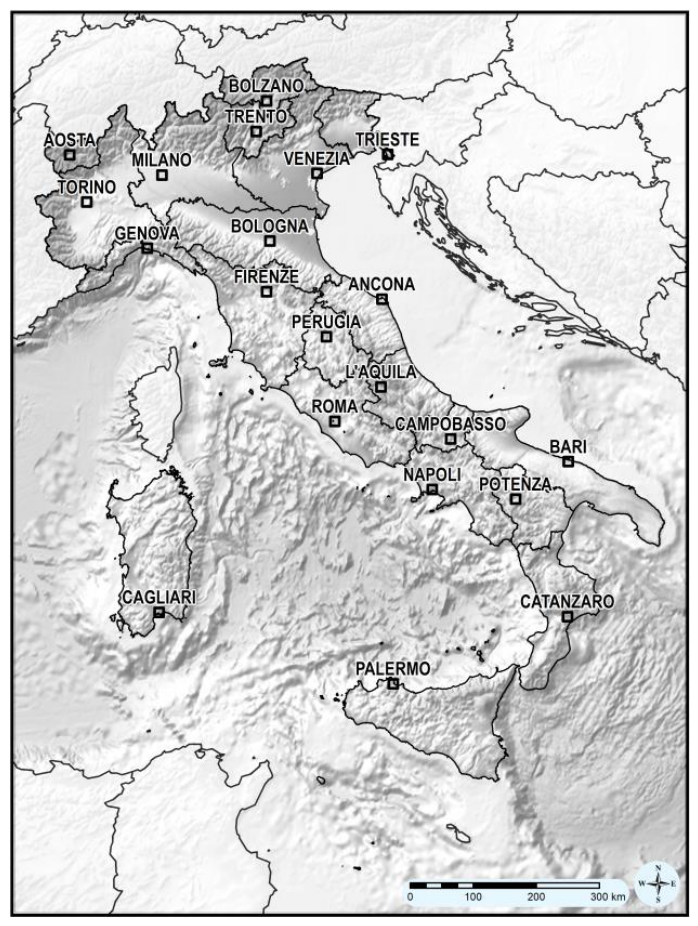
Figure 2.
Schematic classification of urban settlement in four distinct geomorphological contexts: a) Coastal cities, b) Lowland cities, c) Upland cities, d) Intermontane cities.
Figure 2.
Schematic classification of urban settlement in four distinct geomorphological contexts: a) Coastal cities, b) Lowland cities, c) Upland cities, d) Intermontane cities.
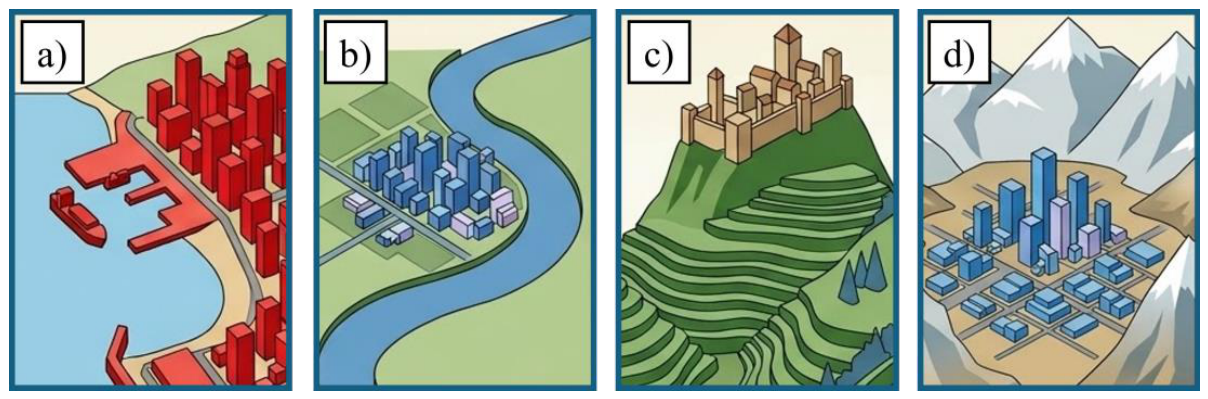
Figure 3.
UGF concept and methodological framework and its fitting inside the UGF tool. The UGF integrates five geo-climatic drivers into a semi-quantitative index (UGF-SI; 0-500) to classify urban areas by geo-climatic complexity.
Figure 3.
UGF concept and methodological framework and its fitting inside the UGF tool. The UGF integrates five geo-climatic drivers into a semi-quantitative index (UGF-SI; 0-500) to classify urban areas by geo-climatic complexity.
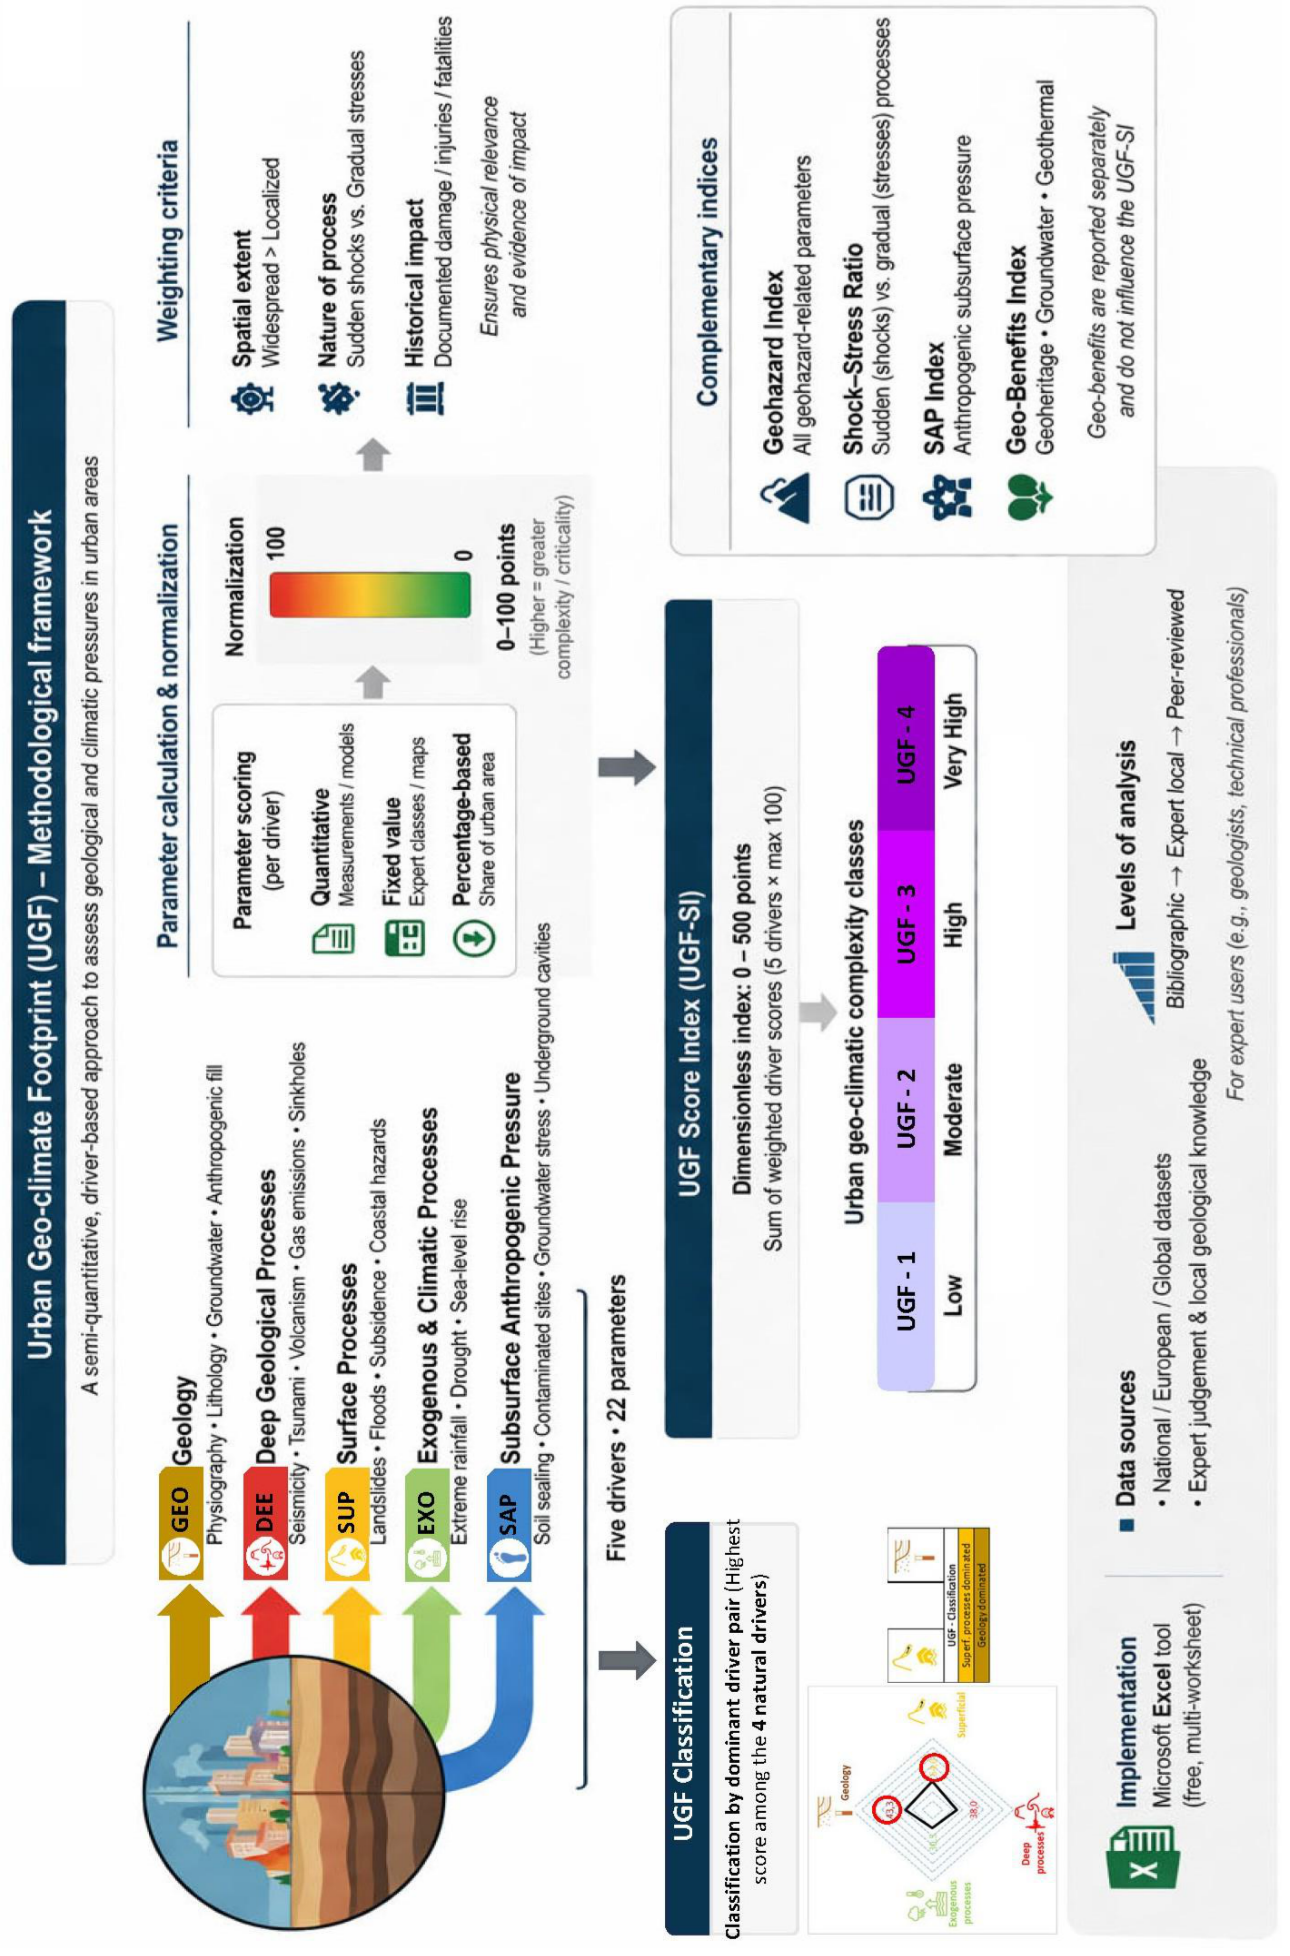
Figure 4.
UGF analysis results on the 21 Italian regional capital cities.
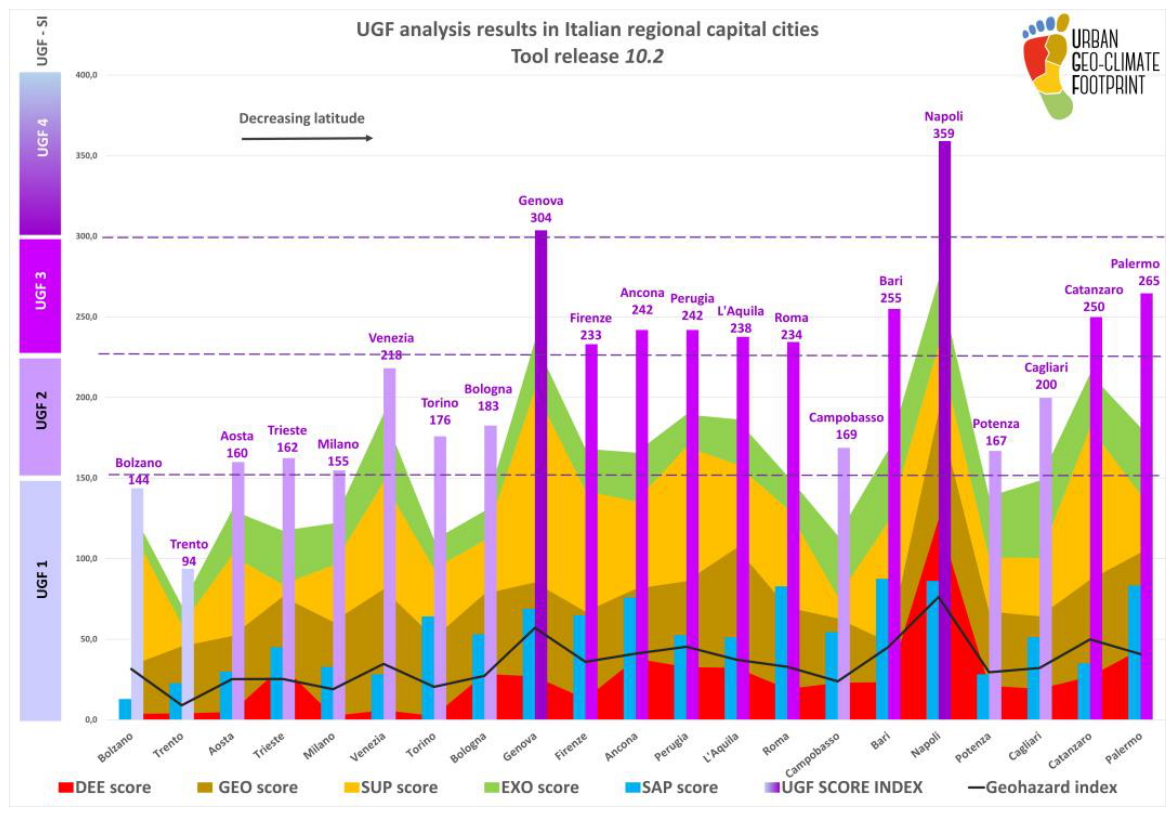
Figure 5.
2D vector-based projection of normalised driver scores for the analysed cities. Each point reflects the relative dominance of the four drivers, computed as differences between opposing components (SUP–EXO and GEO–DEE). The radar diagram shows the average driver importance across all cities.3.2. City Group Classification.
Figure 5.
2D vector-based projection of normalised driver scores for the analysed cities. Each point reflects the relative dominance of the four drivers, computed as differences between opposing components (SUP–EXO and GEO–DEE). The radar diagram shows the average driver importance across all cities.3.2. City Group Classification.
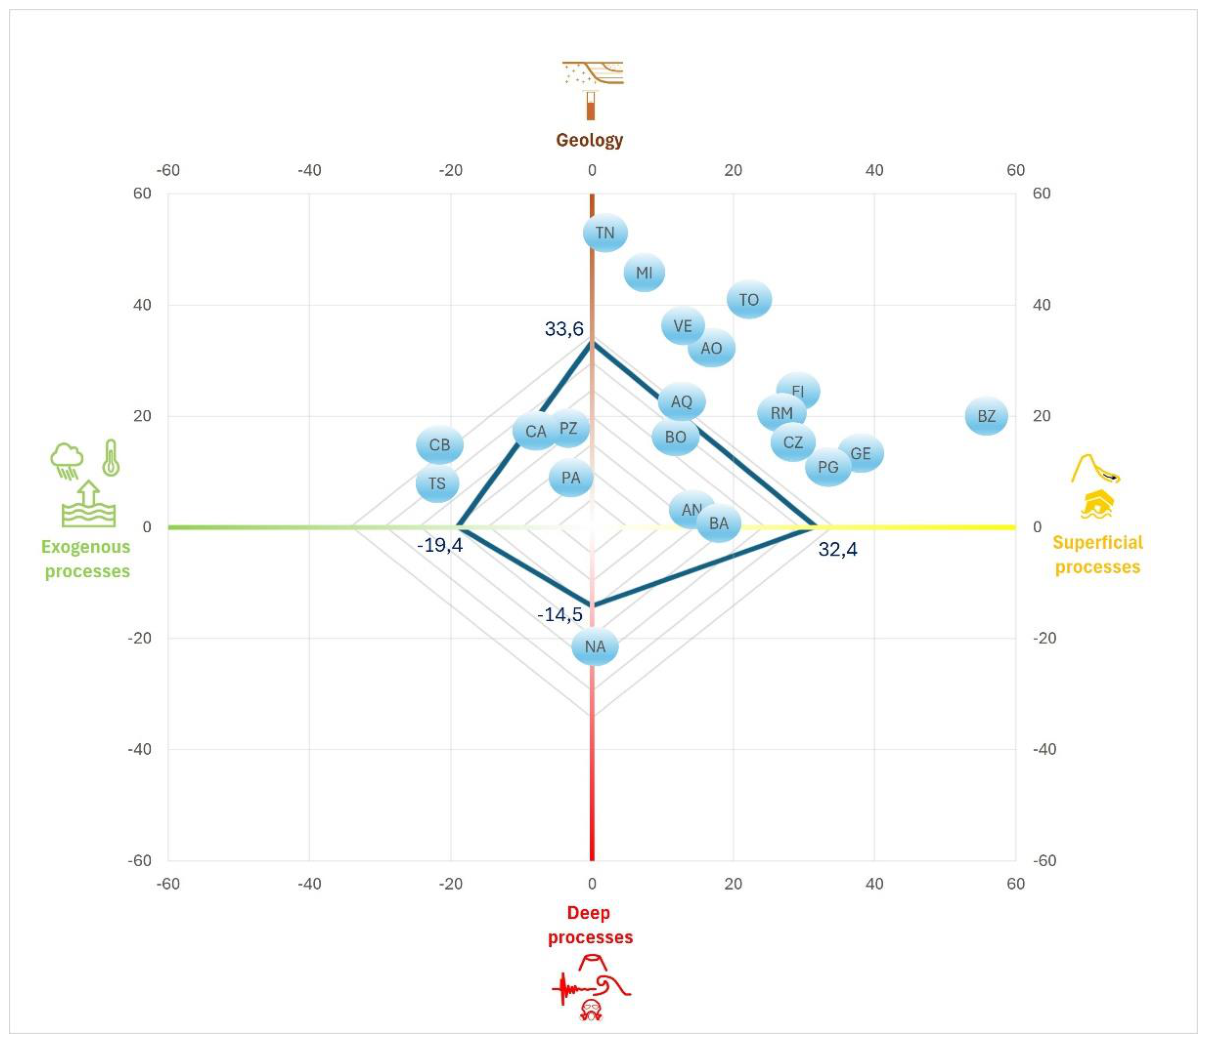
Figure 6.
UGF city clusters. Cities’ indicators are shown with only the pair of major resulting drivers determining the 4 groups. Cities’ acronyms are listed in Table 2.
Figure 6.
UGF city clusters. Cities’ indicators are shown with only the pair of major resulting drivers determining the 4 groups. Cities’ acronyms are listed in Table 2.
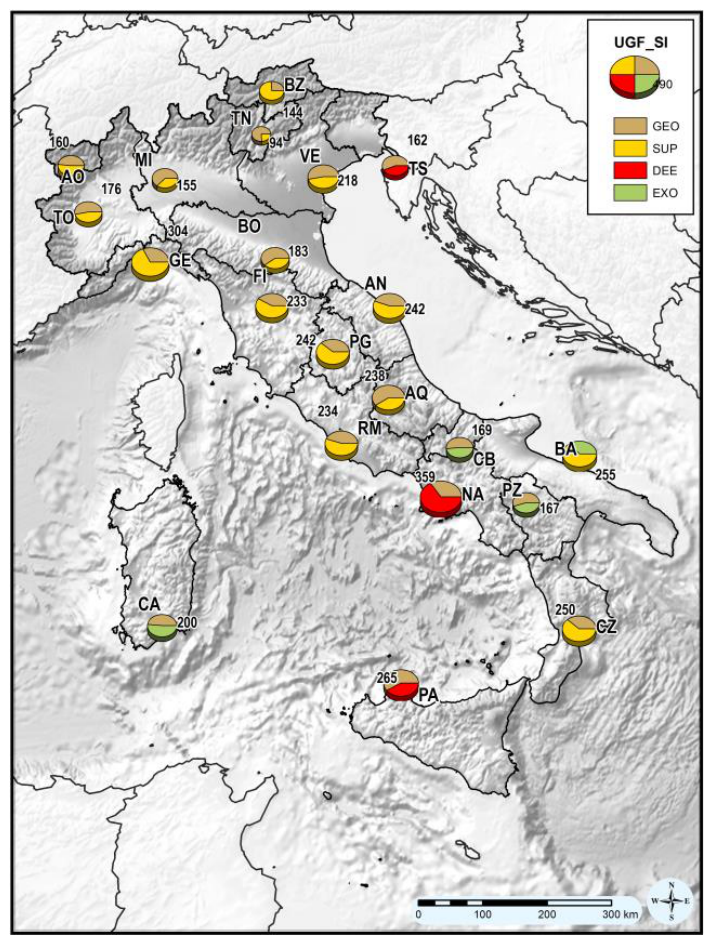
Figure 7.
a) Graph showing the UGF-SI variation vs the average GDP per capita of the relative provinces of the 21 capital cities; b) scatter plot correlation graph of UGF-SI vs GDP per capita (cities are reported as acronyms and coloured per UGF classes).
Figure 7.
a) Graph showing the UGF-SI variation vs the average GDP per capita of the relative provinces of the 21 capital cities; b) scatter plot correlation graph of UGF-SI vs GDP per capita (cities are reported as acronyms and coloured per UGF classes).
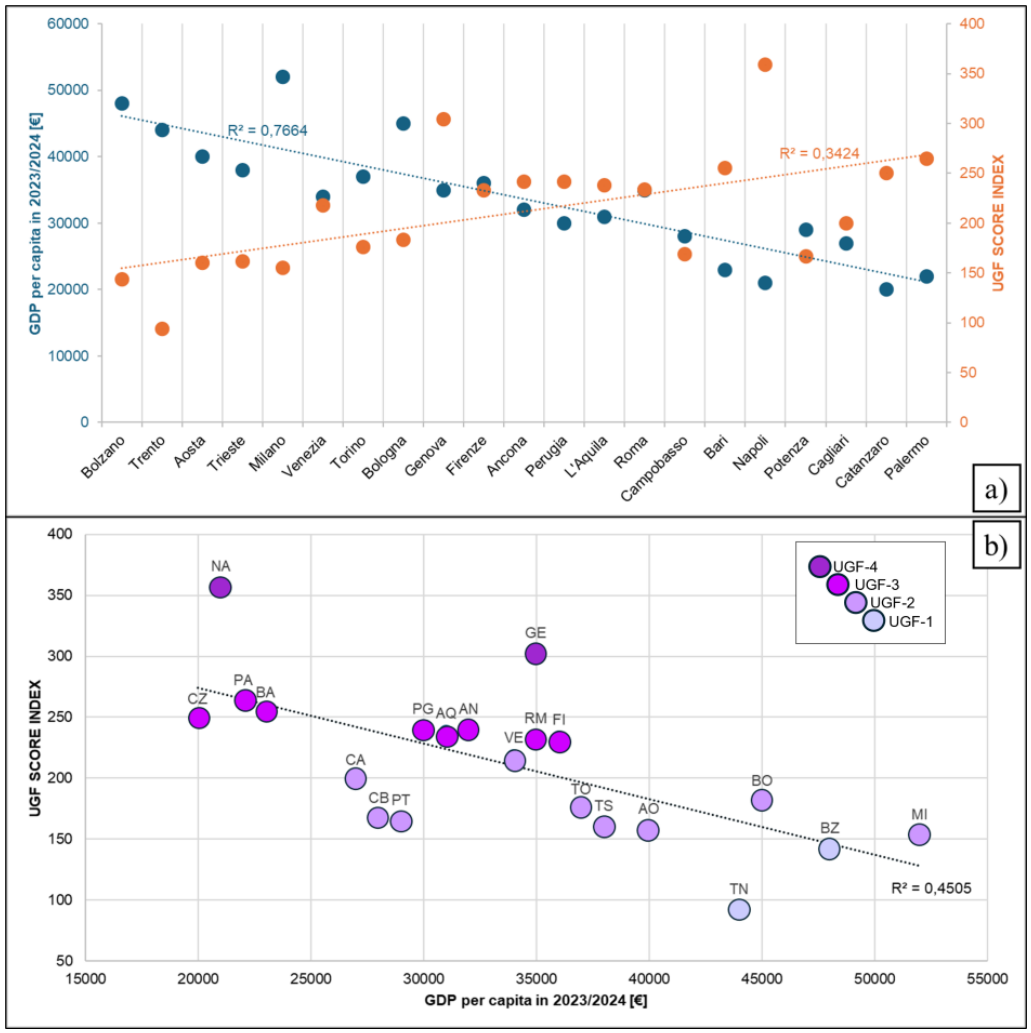

Table 1.
Synthesis of the geographical setting of each Italian regional capital city.
| Geographical setting | Cities |
| Coastal cities | Ancona (AN) [Adriatic coast] Bari (BA) [Adriatic low coast] Cagliari (CA) [Gulf of Cagliari] Genova (GE) [Ligurian steep coast] Napoli (NA) [Gulf of Napoli] Palermo (PA) [Tyrrhenian coast] Trieste (TS) [Gulf of Trieste] Venezia (VE) [Venetian lagoon] |
| Lowland cities | Bologna (BO) [Reno plain] Milano (MI) [Po plain] Roma (RM) [Tiber plain] Torino (TO) [Po plain] Firenze (FI) [Arno river valley] |
| Upland cities | Campobasso (CB) [Southern Apennine ridge] Catanzaro (CZ) [Southern Apennine ridge] Perugia (PG) [Tiber valley hilltop] Potenza (PT) [Southern Apennine ridge] |
| Intermontane cities | Aosta (AO) [Aosta valley] Bolzano (BZ) [Adige-Isarco river confluence] L'Aquila (AQ) [Gran Sasso intermontane basin] Trento (TN) [Adige river valley] |
Table 2.
Data results of the UGF analysis of the 21 Italian regional capitals (see also Figure 4)
Table 2.
Data results of the UGF analysis of the 21 Italian regional capitals (see also Figure 4)
| City | Inhabitants | GEO Score | SUP Score | DEE Score | EXO Score | SAP Score | UGF SI | UGF CLASS | Geohazard index | UGF CLASSIFICATION |
| Bolzano (BZ) | 106177 | 30,0 | 85,0 | 3,8 | 12,0 | 12,9 | 144 | UGF -1 | 32 | SUP-GEO |
| Trento (TN) | 119122 | 41,7 | 13,3 | 4,0 | 12,0 | 22,7 | 94 | UGF -1 | 9 | GEO-SUP |
| Aosta (AO) | 33176 | 47,0 | 50,0 | 5,0 | 28,0 | 29,9 | 160 | UGF -2 | 25 | SUP-GEO |
| Trieste (TS) | 200630 | 42,8 | 7,7 | 33,5 | 33,4 | 45,0 | 162 | UGF -2 | 25 | GEO-DEE |
| Milano (MI) | 1372355 | 58,3 | 35,0 | 2,5 | 26,0 | 32,9 | 155 | UGF -2 | 19 | GEO-SUP |
| Venezia (VE) | 256083 | 75,0 | 66,7 | 6,0 | 42,3 | 28,3 | 218 | UGF -2 | 35 | GEO-SUP |
| Torino (TO) | 857917 | 48,3 | 42,9 | 2,5 | 18,0 | 64,2 | 176 | UGF -2 | 21 | GEO-SUP |
| Bologna (BO) | 391484 | 49,7 | 33,3 | 28,5 | 18,0 | 53,1 | 183 | UGF -2 | 27 | GEO-SUP |
| Genova (GE) | 562422 | 58,3 | 119,4 | 27,0 | 30,1 | 68,9 | 304 | UGF -4 | 57 | SUP-GEO |
| Firenze (FI) | 367150 | 54,2 | 75,0 | 13,0 | 26,0 | 64,9 | 233 | UGF -3 | 36 | SUP-GEO |
| Ancona (AN) | 99377 | 43,3 | 54,0 | 38,0 | 30,5 | 76,1 | 242 | UGF -3 | 41 | SUP-GEO |
| Perugia (PG) | 162099 | 53,3 | 83,3 | 32,8 | 20,0 | 52,4 | 242 | UGF -3 | 45 | SUP-GEO |
| L'Aquila (AQ) | 69560 | 74,5 | 51,7 | 32,3 | 28,0 | 51,2 | 238 | UGF -3 | 37 | GEO-SUP |
| Roma (RM) | 2873000 | 50,5 | 61,3 | 19,3 | 20,6 | 82,9 | 234 | UGF -3 | 33 | SUP-GEO |
| Campobasso (CB) | 47261 | 40,0 | 13,3 | 23,0 | 38,0 | 54,4 | 169 | UGF -2 | 24 | GEO-EXO |
| Bari (BA) | 315625 | 24,8 | 74,5 | 23,5 | 44,5 | 87,6 | 255 | UGF -3 | 45 | SUP-EXO |
| Napoli (NA) | 940940 | 66,2 | 41,7 | 124,5 | 40,5 | 86,2 | 359 | UGF -4 | 76 | DEE-GEO |
| Potenza (PZ) | 65770 | 46,0 | 33,3 | 21,3 | 38,0 | 28,2 | 167 | UGF -2 | 29 | GEO-EXO |
| Cagliari (CA) | 149974 | 45,0 | 36,2 | 19,3 | 48,0 | 51,3 | 200 | UGF -2 | 32 | EXO-GEO |
| Catanzaro (CZ) | 83247 | 60,0 | 94,4 | 27,0 | 33,3 | 35,1 | 250 | UGF -3 | 50 | SUP-GEO |
| Palermo (PA) | 3995 | 60,0 | 36,1 | 43,8 | 41,5 | 83,2 | 265 | UGF -3 | 41 | GEO-DEE |
Disclaimer/Publisher’s Note: The statements, opinions and data contained in all publications are solely those of the individual author(s) and contributor(s) and not of MDPI and/or the editor(s). MDPI and/or the editor(s) disclaim responsibility for any injury to people or property resulting from any ideas, methods, instructions or products referred to in the content. |
© 2026 by the authors. Licensee MDPI, Basel, Switzerland. This article is an open access article distributed under the terms and conditions of the Creative Commons Attribution (CC BY) license (http://creativecommons.org/licenses/by/4.0/).
Copyright: This open access article is published under a Creative Commons CC BY 4.0 license, which permit the free download, distribution, and reuse, provided that the author and preprint are cited in any reuse.


