

Submitted:
23 April 2026
Posted:
23 April 2026
You are already at the latest version
Abstract
Side-scan sonar is a critical instrument for underwater cultural heritage preservation, as it allows large-scale detection of shipwrecks in turbid waters where optical methods fail. However, the automated segmentation of these targets remains a significant challenge, as severe speckle noise and complex seabed reverberations often obscure the distinct geometric features of submerge structures. To address this challenge, this paper proposes SW-Net, which utilizes a multi-scale input strategy and a novel Directional Filter Bank to inject physical priors into the feature extraction process. Furthermore, by coupling this with a Directional Attention Mechanism, the network dynamically modulates structural features to accurately segment targets despite intensity inversions and speckle noise. As demonstrated by the experimental results on the AI4Shipwrecks dataset, the SW-Net outperforms five state-of-the-art architectures, achieving the highest intersection over union of 39.26% and F1-score of 56.38%. In addition, the model exhibits superior robustness against complex seabed interference while maintaining the lowest computational complexity of 4.01 million parameters among the evaluated methods. Taken together, the SW-Net is proposed to offer a practical solution for shipwreck detection on resource-constrained autonomous underwater vehicles.
Keywords:
marine archaeology
; side-scan sonar imagery
; image segmentation
; shipwreck detection
; directional filter bank
1. Introduction
Oceans hide a treasure trove of heritage such as shipwrecks, but they are in danger due to looting, the exploitation of marine resources, climate disruption, and pollution [1]. The United Nations Educational, Scientific and Cultural Organization (UNESCO) proposed the 2001 Convention on the Protection of the Underwater Cultural Heritage safeguard submerged cultural resources and ensure their preservation [2]. However, current mapping and characterization of the seabed remain significantly less comprehensive than that of terrestrial landscapes [4]. The seabed information deficit can lead to critical issues, such as navigation hazards arising from uncharted obstructions and the inadvertent destruction of unmapped historical sites during trawling or construction [5]. The contradiction between the increasing demand for offshore expansion and the constraints of underwater environmental protection is becoming increasingly apparent [6]. Therefore, an efficient and reliable target segmentation method is needed, as it can help to acquire information on the distribution of shipwrecks, examine their preservation status, and support restoration and protection efforts.
Shipwreck segmentation faces multiple challenges, such as missed segmentation and false segmentation due to blurred outlines or complex seabed backgrounds [7,8]. At present, there are two main ways of obtaining shipwreck data. One is through manual investigation, which is generally carried out by professional divers or manned submersibles [9]. This approach takes heavy workloads, poses severe safety risks due to pressure and decompression sickness, has depth limitations, and cannot survey vast areas of the ocean floor in real time. Therefore, it is imperative that modern technologies be used efficiently to fulfill the demands of monitoring risks to shipwrecks [10]. The other is through optical or acoustic remote sensing technology [11]. Optical remote sensing image is outstanding in performing high-resolution visual inspection at close range. But in the beginning, the cost is very high, and underwater optical images are often degraded by turbidity, light attenuation, and scattering, thus it is hard to use this to detect and surveil shipwrecks over large-scale turbid waters [12]. In recent years, side-scan sonar (SSS), as an acoustic remote sensing technology mounted on autonomous underwater vehicles (AUVs) or tow fish, has been widely applied in the fields of marine archaeology, pipeline inspection [13], military mine countermeasures[14], and disaster search and rescue, in light of its acoustic imaging capabilities, wide swath coverage, and ability to penetrate dark or turbid waters [15,16]. In addition, it can be used and customized freely according to different operating frequencies and tow heights. Therefore, it is preferable to allow the SSS-equipped platform to perform image acquisition and data collection in the target sea area, thereby enabling the acquisition of higher-quality acoustic data, which will facilitate the subsequent identification of the required shipwreck features.
Despite the efficient data acquisition capabilities of SSS, the automatic interpretation of these acoustic images remains a formidable bottleneck. Compared with optical photography, SSS imagery is fundamentally generated by the interplay of echo intensity and time-of-flight, resulting in data that are plagued by severe multiplicative speckle noise, geometric distortions [17], and uneven grayscale [18]. For instance, in complex seabed environments, the acoustic return from a corroded shipwreck hull is often indistinguishable from that of large rock formations or sand ripples due to low contrast and signal scattering. Furthermore, targets are frequently obscured by acoustic shadows or sediment accumulation [19], making boundary delineation notoriously difficult. Traditional segmentation algorithms based on thresholding or clustering, such as K-means or Markov random fields [20], often fail in these scenarios because they cannot accurately delineate objects in underwater sonar images characterized by complex textural dependencies in the sonar data [21]. Similarly, standard deep learning models designed for terrestrial optical imagery, such as the vanilla U-Net [22] or fully convolutional network (FCN) [23], still struggle to capture high-frequency edge details in the presence of heavy speckle noise. Recent studies have shown that applying these generic networks directly to SSS data often results in fragmented segmentation masks, in which the continuous structure of a wreck is broken into disjointed blobs, thereby losing critical structural integrity [24].
To address these persistent obstacles in underwater acoustic perception, a novel deep learning framework tailored for shipwreck segmentation is presented in this study. Recognizing that standard optical-based networks often struggle with the distinct geometric characteristics and scale variations of sonar targets, a specialized encoder-decoder architecture, designated as SW-Net, where SW stand for shipwrecks, is constructed to refine feature fusion and bridge the semantic gap between encoding and decoding stages. The primary contributions of this research are summarized as follows:
- (1)
- A specialized encoder-decoder architecture, designated as SW-Net, is constructed to address the distinct geometric characteristics and scale variations of shipwreck targets. This framework is built upon a U-Net-like backbone but is distinguished by a multi-scale input processing module and a sophisticated feature refinement strategy within the skip connections. Instead of a direct transfer of features, a two-step enhancement approach is employed to bridge the semantic gap between the encoder and decoder. By fusing high-level semantic context with fine-grained spatial details, the network is enabled to simultaneously accommodate varying target scales and capture the irregular boundaries inherent to underwater structures.
- (2)
- A directional filter bank (DFB) is proposed to inject physical prior knowledge into the feature extraction process, thereby mitigating the impact of heavy speckle noise. Built upon the theory of steerable filters, this module utilizes fixed, mathematically defined Gaussian derivative kernels rather than randomly initialized weights. Visual information is decomposed into specific directional components by synthesizing edge filters at arbitrary orientations. Consequently, robust edge features are extracted and meaningful structural boundaries are effectively distinguished from acoustic shadows and background reverberation, providing a stable initialization for subsequent learning stages.
- (3)
- A directional attention mechanism (DAM) is developed to explicitly capture orientation-specific information and dynamically weigh the importance of different structural directions. Compared with standard convolutions that treat all spatial directions uniformly, DAM aggregates directional descriptors derived from the DFB to highlight relevant structural features. A channel-wise gating strategy is further integrated to modulate the fused features, ensuring that the network focuses on the most discriminative orientations. Through DAM, the representation of complex shipwreck morphologies is significantly enhanced, allowing for the precise identification of targets despite intensity inversions or complex seabed textures.
2. Related Work
2.1. Semantic Segmentation of Side-Scan Sonar Imagery
Semantic segmentation of SSS imagery presents a formidable challenge in marine exploration, primarily attributable to the inherent acoustic characteristics of the sensor, such as severe speckle noise, intensity inhomogeneity, and extreme class imbalance between small targets and the vast seabed background [25,26]. Driven by the operational necessity for deployment on AUVs, earlier architectural paradigms prioritized computational efficiency [27]; notably, RT-Seg [28] and ECNet [25] employed lightweight, depth-wise separable convolutions to enable real-time processing rates.
However, owing to the limitations of standard convolutional neural networks (CNNs) [29,30] in capturing global context, the field has recently witnessed a shift towards hybrid architectures. In response to this limitation, recent state-of-the-art models, such as CGF-U-Net [31] and SonarNet [32], have incorporated Transformer blocks to enhance global feature extraction. Similarly, the cross-scale feature interaction network (CSFINet) [33] addresses feature loss through multiscale interaction. Nevertheless, despite these advancements, a critical limitation remains: these models largely treat spatial features isotropically. As has been observed in similar synthetic aperture radar (SAR) tasks, man-made targets exhibit distinct geometric properties, such as straight edges and regular shapes, that distinguish them from natural backgrounds [34,35,36]. In contrast, current SSS models often fail to explicitly leverage these geometric priors, treating the random texture of the seabed and the structured edges of a wreck with the same convolutional logic, which leads to boundary blurring under low-contrast conditions.
2.2. Attention Mechanisms in Computer Vision
Attention mechanisms have been introduced to enhance the representational power of CNNs by enabling networks to focus on informative features while suppressing irrelevant ones [37,38]. General attention modules typically operate across channel and spatial dimensions. The Squeeze-and-Excitation block pioneered channel attention by explicitly modelling inter-channel dependencies [39], while the convolutional block attention module (CBAM) integrated spatial attention to guide the network on what to look at and where to look [40].
However, a significant misalignment arises when applying these generic mechanisms to shipwreck segmentation, as off-the-shelf computer vision models often struggle with domain-specific patterns. In response to this, fine-tuning is effective in improving CNN transferability and can provide remarkable accuracy that outperforms previous state-of-the-art methods [41]. Nevertheless, standard attention modules [39,40] are largely orientation-agnostic. These modules tend to enhance features driven by activation intensity while lacking explicit mechanisms to model spatial alignment. As a result, in sonar imagery, strong echoes may come from either irregular rock formations or man-made hulls, so relying only on intensity-based attention is not enough. These methods therefore struggle to capture orientation-related features, such as linearity and continuity, that help distinguish structural edges from background reverberation.
2.3. Directional Feature Learning
Directionality is a fundamental attribute of visual perception and is essential for distinguishing the regular geometric structures of man-made objects from natural backgrounds [42]. While early computer vision explicitly modelled orientation through hand-crafted descriptors [43], most modern deep learning frameworks rely on the implicit learning of orientation-sensitive features via convolutional kernels, rather than explicit orientation encoding [22,23,44]. To mitigate the inefficiency arising from learning multiple transformed instances of the same feature, recent research has increasingly focused on transformation-equivariant network designs [45,46]. However, these methods often incur a heavy computational burden, making them unsuitable for real-time AUV applications.
In the realm of attention mechanisms, methods such as coordinate attention [47] and large selective kernel (LSK) networks [48] have begun to explore dynamic spatial context. Yet, few mechanisms are specifically optimized to enhance the sharp, linear edges characteristic of targets in noisy environments. Drawing inspiration from shape-constrained segmentation in SAR imagery [49], where prior geometric knowledge is incorporated to overcome noise, there is a clear need for a lightweight mechanism that explicitly perceives features along critical directions. This need motivates the design of our Directional Perception Attention Module, which aims to distinguish structural anomalies from the fractal-like speckle noise of the seabed without the overhead of full rotational equivariance.
3. Method
The overall network architecture of the proposed SW-Net is illustrated in Figure 1. Constructed upon a U-Net-like backbone, the SW-Net is specifically engineered to address the distinct geometric characteristics of shipwreck targets in SSS imagery. The network follows an encoder–decoder design paradigm, facilitating the simultaneous extraction of high-level semantic context and the preservation of low-level spatial details. To accommodate the varying scales of underwater targets, a multi-scale input processing module is employed at the initial stage. The input image is processed in parallel by multiple convolutional branches, each configured with distinct kernel sizes and dilation rates. These multi-scale features are subsequently concatenated and fused to form a rich initial feature representation.
The encoder path consists of five hierarchical stages, where downsampling is performed via max-pooling operations to progressively expand the receptive field and abstract semantic features. A distinguishing improvement of the SW-Net is the sophisticated refinement applied to the features within the skip connections. Compared with the standard U-Net architectures that directly transfer encoder features to the decoder, the proposed model introduces a two-step enhancement strategy to bridge the semantic gap. Feature maps from the encoder are first processed by the directional attention mechanism, as detailed in Section 3.3, to explicitly highlight orientation-specific structural information and suppress noise.
Following the directional attention, the features are further processed by an offset convolution module proposed by [52]. The offset convolution is designed to capture geometric deformations and irregular boundaries inherent to shipwreck structures. As shown in Figure 2 and Figure 3, the SW-Net contains four parallel convolutional branches with asymmetric padding in four directions: left-up(LU), left-down(LD), right-up(RU), and right-down(RD). The features produced by these branches are then concatenated and fused, allowing the network to adaptively perceive the targets from different geometric perspectives. In the decoder, the feature maps are gradually upsampled to restore the spatial resolution. These upsampled features are concatenated with the corresponding refined features from the offset convolution modules. The fusion strategy ensures that the semantic strength of the deep features is effectively combined with the fine-grained structural details preserved by the directional enhancements. Finally, a 11 convolution layer followed by a Sigmoid activation function is utilized to generate the final pixel-wise segmentation probability map.
3.2. Directional Filter Bank
Although SSS imagery are difficult for semantic segmentation because of heavy speckle noise, targets such as shipwrecks often show clear geometric structures. These structures usually form strong edges between bright echoes and acoustic shadows. Standard CNNs initialize kernels randomly, meaning they lack structured feature extraction capabilities at the start. To address the limitation, the DFB is proposed, as shown in Figure 3. By injecting physical prior knowledge into the network, this module extracts robust edge features using fixed, mathematically defined filters.
The DFB is built upon the theory of steerable filters. The first derivative of a Gaussian function is utilized as the core kernel. The Gaussian component smooths out speckle noise [51,52], while the derivative operation acts as an edge detector [53]. A standard 2D Gaussian function with a scale is defined as:
where and represent the pixel coordinates, and represents the kernel size of the Gaussian function.
Based on function (1) and (2), two basis filters are generated. These correspond to the derivatives in the horizontal and vertical directions. They represent the fundamental components of any edge:
A key advantage of this approach is computational efficiency. Physical rotation of the input image or expensive interpolation is not required. Instead, an edge filter at an arbitrary orientation is synthesized linearly. It is formed by a weighted combination of the two basis filters. The steering formula is defined as:
In the implementation, a bank of filters is generated. These filters cover discrete orientations uniformly distributed from to . The weights are registered as non-trainable buffers in the model. They remain fixed during the training process, providing a stable feature extraction mechanism. Normalization is also applied to each kernel. The mean is subtracted to ensure a zero sum which causes that the filter response approximate to zero in flat or homogeneous regions. As a result, the module extracts significant structural as directional responses.
During the forward pass, the input feature map of shape (C, H, W) is processed by the DFB. The filter bank is applied to every channel of the input independently using grouped convolutions. For each input channel, directional response maps are produced. The final output is a 4D tensor of shape (C, K, H, W). This representation decomposes the visual information into specific directional components. Consequently, subsequent attention mechanisms are enabled to identify exactly which direction contains the most relevant structural information.
3.3. Directional Attention Mechanism
To enhance feature representation by explicitly capturing orientation-specific information, the directional attention mechanism is proposed, as shown in Figure 4. Compared with standard convolutions, which treat spatial directions uniformly, this module dynamically aggregates features from multiple orientations based on their saliency and modulates them with global context.
is a matrix with shape (B, C, H, W) and denoted as the input feature map. First, the input is processed by a DFB to yield directional responses with shape (B, C, K, H, W), where represents the number of orientation channels.
To determine the importance of each direction, the absolute magnitude of the responses, , is computed to ensure robustness against intensity inversions. Then global average pooling is applied across the spatial dimensions (H, W) to obtain a descriptor . The descriptor for the -th batch, -th channel, and -th direction is calculated as:
Subsequently, the attention weights are derived by applying a softmax function along the directional dimension :
These weights are used to aggregate the original signed directional responses . The weighted sum produces a directionally fused feature map .
To further refine the features, a channel-wise gating mechanism conditioned on the original input is introduced. The gate is a lightweight bottleneck architecture to capture channel dependencies with controlled complexity. Specifically, the channel dimension is compressed by a reduction ratio and then expanded back to , followed by a Sigmoid activation to generate a feature map. The intermediate channel size is defined as:
The aggregated features are modulated by this gate. Finally, the module utilizes a residual connection. The modulated features are fused with the original input through a 11 convolution and normalization, ensuring stable gradient propagation.
4. Experiments and Results
This section presents the dataset, experimental details, ablation results, and comparative results.
4.1. Dataset Preparation
The raw SSS imagery used in this study is sourced from the open-access AI4Shipwrecks dataset [54]. To prepare high-quality inputs suitable for deep learning models processing, the original full sonar images from different survey sites were first converted into grayscale and preprocessed Gaussian filter [55]. After that, the images were segmented into standardized samples. The size of each sample is set to 1024 × 1024 pixels. Any segment smaller than this size was padded with zeros to create a complete grayscale image as a sample. For the corresponding label masks, shipwreck pixels were assigned a value of 1, while background pixels, or non-shipwreck pixels, were assigned a value of 0.
The proportion of shipwreck pixels in the raw SSS imagery is extremely low. Even within images containing shipwrecks, the target pixels occupy an average of only 0.8% of the total area. This severe class imbalance hinders the model’s ability to effectively capture sparse target features. To address this issue, a targeted cleaning strategy was implemented for the training set, with images containing only flat, featureless seabed or the nadir gap directly beneath the sonar manually excluded. The theoretical basis for this operation is that conventional background features are already sufficiently represented in the backgrounds of images containing shipwreck targets. Pure background images lack discriminative feature information and constitute data redundancy. Eliminating these samples prevents the model from overfitting to the background. This significantly enhances the learning efficiency regarding critical shipwreck features. To ensure sample diversity during evaluation, all images in the test set were retained. In the end, 1,532 training samples were obtained from 14 survey sites, while the test set comprises 1,722 samples derived from a separate set of 15 survey sites.
4.2. Experimental Details
All experiments were run on four NVIDIA RTX A6000 GPUs. The models were implemented in PyTorch 1.13.1 on Ubuntu 20.04 operating system with CUDA 11.7 support. The Adam optimizer was used for training with a learning rate of 0.001, and the batch size was 4 in all experiments.
4.3. Metrics
To quantitatively compare SW-Net with other models, an evaluation framework based on pixel-level classification accuracy is employed. The evaluation is based on the confusion matrix, which classifies each pixel prediction into four categories: True Positive (TP), False Positive (FP), True Negative (TN), and False Negative (FN). TP represents pixels correctly identified as part of the shipwreck target. FP represents background pixels, e.g., seabed, rocks, or water column, incorrectly classified as shipwreck. TN represents background pixels correctly identified as background. FN represents actual shipwreck pixels that the model failed to detect.
Based on these fundamental components, intersection over union (IoU) and F1-score are used to evaluate the segmentation quality. IoU is a standard metric in semantic segmentation that measures the overlap between the predicted segmentation mask and the ground truth mask. It is calculated as the ratio of the area of intersection to the area of the union of the predicted and ground truth regions. The formula of IoU is defined as:
The F1-score is similar to IoU, ranging from 0 to 1, with 1 indicating perfect overlap. It is often preferred when the data are imbalanced, which is common in sonar imagery because shipwreck targets occupy a much smaller area than the surrounding seabed background. By doubling the weight of TP, the F1-score provides a sensitive measure of how well the model captures the specific target features. The calculation of F1-score is given by:
In the following experiments results, both IoU and F1-score are utilized to ensure a comprehensive evaluation. While IoU provides a robust measure of overall geometric alignment, F1-score offers insight into the model’s precision and sensitivity regarding the target structure.
4.4. Performance Comparison
To validate the effectiveness of the proposed SW-Net for automated shipwreck detection, this section presents a performance evaluation combining both quantitative metrics and qualitative visual analysis. The SW-Net is benchmarked against five established segmentation architectures—U-Net [22], SegNet [44], Attention U-Net [50], UNet++ [51], and MDOAU-Net [52]—to assess its capability in handling low-contrast SSS imagery. The evaluation first focuses on statistical performance indicators, specifically IoU and F1-score, to quantify the segmentation precision and recall. Subsequently, the analysis is extended to a visual inspection of segmentation results across various marine environments. This includes scenarios characterized by different degrees of target integrity, seabed reverberation, sediment occlusion, and blind zone interference, providing an assessment of the model’s robustness and generalization ability in practical underwater archaeological surveys.
4.4.1. Metrics Comparison
A quantitative comparison between SW-Net and five other mainstream models—U-Net, SegNet, Attention U-Net, UNet++, and MDOAU-Net—is presented in Table 1. In short, the proposed SW-Net achieves the best overall performance, with the highest IoU of 39.26% and an F1-score of 56.38%. Compared with SegNet and the original U-Net in particular, the SW-Net appears to handle the complex outlines of shipwreck targets more effectively in low-contrast SSS imagery.
A closer look at the confusion matrix shows that the main strength of the SW-Net is its ability to maintain a better balance between sensitivity and precision. Although the standard U-Net detects many true positives, it also produces serious over-segmentation, with more than 1 million false positive pixels. This suggests that the U-Net has difficulty to distinguishing real shipwreck structures from seabed reverberations. By contrast, the SW-Net not only achieves a higher count of true positives but also reduces the false positives to 711,455. Compared with U-Net, this is about a 29.21% reduction in misclassified background pixels, highlighting the proposed model’s stronger robustness against noise and its ability to generate cleaner and more accurate segmentation boundaries.
Furthermore, the SW-Net outperforms advanced U-Net variants, including Attention U-Net, UNet++, and MDOAU-Net. Although the UNet++ and the Attention U-Net show marginal improvements over the baseline, they fail to suppress false detections as effectively as the proposed method. The closest competitor, MDOAU-Net, exhibits a strong ability to reduce noise with a low false positive rate. However, the SW-Net still outdo it by maximizing true positives while maintaining the lowest false positive count among all compared models. These results confirm that the SW-Net provides the most effective balance of precision and recall. For the purposes of this study, it stands out as the most dependable tool for automated shipwreck detection.
4.4.2. Visualization Results Comparison
Based on the comparison of the six sets of experimental images, as shown in Figure 5, a qualitative analysis of the visualization results is presented. This analysis encompasses various seabed environments, ranging from clear targets to complex backgrounds, and extending to scenarios involving occlusion and blind zone interference.
First, scenarios are analyzed where the shipwrecks exhibit relatively clear acoustic features and are not buried. Taking images Barge_No_1_15_6 and WH_Gilbert_01_0 as examples, the structures in these samples are reasonably intact. When processing the Barge sample, the SW-Net demonstrated superior completeness, accurately outlining the overall contour of the shipwreck. Conversely, masks generated by other models often exhibited fragmentation or gaps within the shipwreck’s interior. In the WH_Gilbert sample, although most models successfully detected the target’s presence, the MDOAU-Net, the UNet++, the SegNet, and the U-Net all suffered from over-segmentation, erroneously identifying non-shipwreck areas as targets. While the Attention U-Net identified the outer contour reasonably well, it lacked the internal detail captured by the SW-Net. The SW-Net accurately captured textural changes within the shipwreck, thereby avoiding missed detections caused by structural complexity.
Secondly, the robustness of the models is examined in complex backgrounds, particularly when the seabed contains rocky interference with acoustic features similar to shipwrecks. In image Barge_No_1_15_14, the target consists of two extremely small debris fragments, one of which is a partially buried bow. In this scenario, the MDOAU-Net failed completely and could not recognize the target. While the SegNet and the U-Net detected potential targets, they failed to accurately segment the contours and missed parts of the wreckage. Furthermore, the UNet++ and the Attention U-Net struggled to distinguish interference, mistaking surrounding rocks for the shipwreck. Only the SW-Net successfully excluded the rocks and accurately pinpointed the shipwreck’s location. A similar phenomenon occurred in Corsican_06_2, where the hull is damaged and lying on its side. The MDOAU-Net and the SegNet missed the target again, whereas the SW-Net provided the most complete contour recovery. However, it is worth noting that due to the high textural similarity between the rocks and the wreck, all models, including SW-Net, misclassified some large rocks as shipwreck parts, indicating that this specific scenario remains challenging.
Finally, extreme cases involving sediment occlusion and targets located in the nadir gap are analyzed. In Corsair_03_1, where half of the shipwreck is buried by sand, segmentation is extremely difficult. The SegNet failed to identify the target, and while Attention U-Net, MDOAU-Net, and U-Net detected the shipwreck, they could not reconstruct its shape. Under these occluded conditions, the UNet++ and the SW-Net performed best, with SW-Net still yielding a relatively complete contour. Regarding large shipwrecks located in the nadir gap, such as the Lucinda_van_Valkenburg series, i.e., samples 17_9 and 18_8, all models exhibited varying degrees of structural omission. However, a horizontal comparison shows that SW-Net had the fewest omissions and preserved the main structure of the shipwreck to the greatest extent. Although the SW-Net misclassified some noise or sand within the blind zone as shipwreck parts, this error is acceptable. Since the Nadir Gap is a fixed geometric region in sonar imagery, specific false positives generated within this area can be easily corrected through post-processing techniques. Therefore, taken as a whole, the SW-Net demonstrated optimal segmentation performance across various complex operating conditions.
4.5. Ablation Experiments
To systematically evaluate the contribution of each component, four distinct model variants were constructed. The standard U-Net is utilized as the baseline model, where standard skip connections are employed to concatenate encoder and decoder features. Subsequently, the OU-Net variant was created by replacing these standard skip connections with Offset Convolutions. This modification was aimed at testing the capability of deformable operations to handle the irregular shapes of shipwrecks.
Building upon the OU-Net, the MDOAU-Net was developed by introducing two significant enhancements. A multi-scale feature fusion module was added to capture context at various resolutions. Additionally, a standard Attention Mechanism was incorporated to process the input logits before they are passed to the offset convolution layers. Finally, the proposed SW-Net was established as the ultimate architecture. While the multi-scale fusion from MDOAU-Net is retained, the attention strategy is refined in this model. Specifically, the vanilla attention mechanism is replaced by an Offset Convolution with a direct attention module. This design choice is intended to more effectively guide the deformable sampling process.
The analysis begins by examining the transition from the baseline U-Net to the OU-Net configuration, as detailed in Table 2. The substitution of standard skip connections with Offset Convolution initially precipitated a notable decline in performance metrics. Specifically, the IoU decreased from 36.73% to 26.11%. Although the number of false positives was reduced drastically from approximately 1.0 million to 0.42 million, this improvement was offset by a sharp reduction in true positives and a concurrent increase in false negatives. These results indicate that while Offset Convolution possesses the capacity to attenuate noise, its unguided application results in severe under-segmentation, thereby causing the model to fail in capturing significant portions of the target structure.
Subsequent improvements were observed with the MDOAU-Net architecture, which incorporated the multi-scale feature fusion module alongside a standard attention mechanism. This integration effectively reversed the performance degradation observed in the OU-Net. The IoU recovered to 37.66%, thereby surpassing the original U-Net baseline. A critical observation is that the MDOAU-Net achieved this enhanced accuracy while maintaining a significantly lower count of false positives compared to the baseline, recording 783,477 against 1,004,965. This evidence suggests that the synergy between multi-scale context and attention mechanisms empowers the model to discriminate between the shipwreck and the background with greater efficacy, even though the true positive count remained marginally lower than that of the baseline.
The proposed model SW-Net, delivered the best overall results. After replacing the conventional attention mechanism with the offset convolution and direct attention module, the model reached an IoU of 39.26% and an F1-score of 56.38%. Its effectiveness is also reflected in the detailed evaluation metrics, which reveals that the SW-Net produced the highest number of true positives at 1,753,903 among all evaluated models. This metric signifies a heightened sensitivity to shipwreck pixels. At the same time, the SW-Net maintained a low false positive rate of 711,455, which is markedly lower than that of the U-Net baseline. The results indicate that the Direct Attention Module helps guide offset convolution so that the network can pay closer attention to shipwreck structures without losing important spatial details. This allows SW-Net to better balance missed detections and false alarms, resulting in more accurate and reliable segmentation.
4.6. Sensitive Analysis
This section analyzes the impact of key hyperparameters on the performance of the proposed SW-Net. Comparative experiments were conducted to determine the optimal settings for three specific parameters which are the Gaussian kernel size, the directional dimension, and the channel reduction ratio. The following analysis evaluates how variations in these parameters influence segmentation accuracy, focusing on the trade-off between feature preservation and noise suppression to identify the most effective configuration for shipwreck detection.
4.6.1. Sensitive of Kernel Size
The kernel size sensitivity analysis shows clear differences in how SW-Net extracts features and performs segmentation. The results presented in Table 3 indicate that the model with a kernel size of 5 produced the highest number of true positives, reaching 1,782,542 pixels. However, this stronger sensitivity also led to the highest number of false positives, with 960,153 pixels incorrectly identified, indicating that the model was too aggressive at this scale and tended to over-segment background noise as shipwreck targets. When the kernel size was increased to 7, this problem was reduced noticeably. False positives dropped by about 26%, while the true positive count remained similar at 1,753,903 pixels. This better balance between precision and recall gave the model its best overall performance, with the highest IoU of 39.26% and an F1-score of 56.38%.
At the boundaries of the tested kernel size range, the model exhibited markedly more conservative tendencies. Specifically, the largest kernel size of 11 produced the fewest true positives of all settings, suggesting that an overly large receptive field may weaken the local details needed for accurate target recognition. Similarly, the smallest kernel size of 3 achieved a low false positive rate but failed to capture the full extent of the target as well as the medium-sized kernels. In addition, the performance fluctuation can be observed at a kernel size of 9, where the IoU fell to its minimum of 36.10%, underscores that the relationship between receptive field size and segmentation accuracy is not linear. Overall, the experimental results indicate that a kernel size of 7 achieves superior performance, as it offers the strongest balance between detecting shipwreck targets and limiting the false alarms that are more common with smaller kernels.
4.6.2. Sensitive of Directional Dimension
The sensitivity analysis concerning the directional dimension parameter elucidates a complex trade-off between segmentation recall and precision. The detailed examination of the confusion matrix metrics presented in Table 4 reveals that the model configured with 4 directional dimensions generated the highest volume of true positives at 1,886,790 pixels. However, this configuration also produced the maximum number of false positives at 1,264,845 pixels, which suggests that the model adopts an overly confident and aggressive prediction strategy at this dimensionality that prioritizes the retrieval of potential target pixels at the cost of introducing significant background noise. Consequently, despite achieving the highest F1-score of 56.79% due to the sheer volume of detected targets, the overall structural accuracy as measured by the IoU declined to 37.73%.
Moreover, the configuration utilizing 2 directional dimensions demonstrated a more conservative and precise behavior. The setting achieved the highest IoU of 39.33% by effectively suppressing false positives to 647,541 pixels, which is nearly half the error rate observed in the 4-dimension model. Furthermore, increasing the dimensionality to 16 resulted in the poorest performance across most metrics, yielding the lowest true positive count of 1,564,955 and the minimum F1-score of 53.48%. This significant drop indicates that an intermediate increase in directional dimensions may excessively constrain the feature space and lead to the loss of valid target details. Ultimately, while the 4-dimension model offers the greatest capacity for target detection, the 2-dimension configuration provides the optimal balance for accurate segmentation by minimizing misclassification errors.
4.6.3. Sensitive of Channel Reduction Ratio
The analysis of the channel reduction ratio shows that a moderate reduction factor gives the best trade-off between feature representation and segmentation performance. In particular, the model with a reduction ratio of 4 achieved the best overall results in Table 5, with the highest IoU of 39.26% and the highest F1-score of 56.38%. This setting also produced the largest number of true positives, reaching 1,753,903 pixels. These results suggest that reducing the channel dimension by a factor of 4 can retain important spatial information while removing unnecessary feature redundancy.
In contrast, a reduction ratio of 1 gave weaker results, with the lowest IoU of 37.65% and the highest false positive count of 849,909 pixels. This indicates that without any channel reduction, the model may retain too much noise in the feature maps, which reduces segmentation precision. When the reduction ratio was increased to 16, the model became much more conservative. Although this high reduction ratio minimized false positives to the lowest observed value of 505,176 pixels, it simultaneously caused a significant drop in true positives to 1,632,441 pixels and increased false negatives to 2,103,690 pixels. This pattern implies that too much channel reduction can remove important fine details needed to detect subtle shipwreck structures. Therefore, a reduction ratio of 4 is identified as the best setting, as it provides a better balance between accurate target detection and suppression of background errors.
4.6.4. Summary of Sensitivity Analysis
The comprehensive sensitivity analyses conducted on the window size, the number of heads, and the channel reduction ratio collectively elucidate the influence of hyperparameter configuration on the network’s predictive capability. It is observed that variations in these structural parameters lead to discernible fluctuations in segmentation metrics, which indicates that specific configurations are necessary to maximize the trade-off between feature aggregation and computational efficiency. However, a broader evaluation of these experimental outcomes reveals the inherent robustness of the proposed architecture. Although changing the parameter settings affects the exact numerical results, the performance of the SW-Net remains consistently high. Even under less optimal settings, the segmentation accuracy achieved by the proposed model generally exceeds that of the baseline models used for comparison. This consistent advantage suggests that the core architectural design of SW-Net provides a resilient foundation for semantic segmentation tasks that is not overly dependent on precise hyperparameter tuning.
4.7. Parameter Scale Comparation
Based on the comparison of model parameter size and computational speed, the results show that the SW-Net achieves a better balance between efficiency and performance than the other models. As listed in Table 6, the traditional U-Net, SegNet, and Attention U-Net all require relatively high computational cost. Among them, the Attention U-Net has the heaviest computational burden with 34.88 million parameters and 266.23G floating point operations, followed by the U-Net with 31.04 million parameters and 218.65G floating point operations. While the SegNet lowers the computation to 160.22G floating point operations, it still has a large parameter count of 29.44 million.
A significant improvement in efficiency is observed with the UNet++, which drastically reduces the parameter count to 9.16 million and the computational cost to 139.46G floating point operations, all while maintaining a competitive IoU of 36.82%. Further optimization is evident in the MDOAU-Net, which lowers the parameters to 4.09 million and the operations to 59.48G floating point operations, achieving an IoU of 37.66%.
However, the most optimal results are delivered by the SW-Net. This model requires the fewest resources, utilizing only 4.01 million parameters and 41.45G floating point operations. Despite being the most lightweight and computationally efficient architecture among those tested, the SW-Net simultaneously attains the highest segmentation accuracy with an IoU of 39.26%. These findings indicate that the SW-Net effectively minimizes model complexity and computational demand without compromising segmentation performance, making it highly suitable for applications where computational resources are limited.
5. Discussion
The central hypothesis of this study was that man-made underwater targets, specifically shipwrecks, possess distinct geometric directionalities that distinguish them from the fractal-like, isotropic texture of the natural seabed. The experimental results strongly validate this hypothesis. Standard CNN architectures, such as the U-Net [22] and the SegNet [44], utilize randomly initialized kernels that treat all spatial directions uniformly. Consequently, our comparison shows that these models struggle to differentiate between the high-frequency speckle noise of the seabed and the structural edges of shipwrecks, leading to a high number of false positives, exceeding one million pixels for U-Net.
Previous studies in sonar segmentation have generally bifurcated into two paradigms: lightweight convolutional models prioritizing real-time AUV navigation, such as the RT-Seg [28] and the ECNet [25], and heavy, context-aware models incorporating Transformers or complex attention mechanisms, such as the SonarNet [32] and the CSFINet [33]. The former often sacrifice fine-grained detail for speed, while the latter incur computational costs that can be prohibitive for edge deployment.
The results obtained in this study show that a task-oriented network design can better handle the inherent challenges of SSS imagery than generic segmentation models [56]. From the perspective of previous studies, most of deep learning–based approaches for sonar target detection have focused on improving feature aggregation [54,57] or introducing attention mechanisms to reduce noise; however, directional information is often handled only indirectly or treated as isotropic. The performance of the SW-Net suggests that explicitly modelling directional priors—consistent with the physical imaging characteristics of SSS—is important for distinguishing man-made structures from complex seabed backgrounds. This finding supports the hypothesis that embedding physically meaningful constraints into network design can improve feature discriminability without depending only on increased model depth or parameter count.
The results indicate that lightweight models can match or even outperform more complex approaches when their internal feature processing is carefully aligned with domain-specific characteristics. Compared with recently proposed transformer-based or heavily parameterised models for sonar segmentation, the SW-Net demonstrates that higher accuracy does not have to come from extensive global context modelling at the expense of computational efficiency. This balance is particularly important for remote sensing tasks involving AUVs, where onboard processing capability and energy use are tightly limited. As such, the findings add to an ongoing discussion within the remote sensing community regarding the trade-off between model complexity and practical deployment in real survey environments.
The SW-Net challenges this trade-off by demonstrating that high-level feature extraction does not strictly require deeper layers or self-attention blocks. By utilizing non-trainable Gaussian derivative filters, the burden of learning edge detection was effectively offloaded from the optimization process. This resulted in a model with only 4.01 million parameters—significantly fewer than the 31.04 million of the baseline U-Net and the 34.88 million of the Attention U-Net—while simultaneously achieving state-of-the-art accuracy with a 56.38% F1-score. This implies that for specific domain tasks like sonar interpretation, integrating signal processing theory such as steerable filters into deep learning is a more efficient pathway than blindly increasing model depth.
The experimental results show that the SW-Net strikes a better balance between segmentation accuracy and computational efficiency compared to current state-of-the-art models. Conventional CNN-based methods, such as U-Net and SegNet, often struggle with the speckle noise and uneven intensity in SSS imagery. By contrast, the SW-Net, by enforcing a directional prior through the DFB, achieved a substantial reduction in background noise misclassification. Traditional convolutional layers rely on random initialization to learn features, which often leads to the overfitting of high-frequency speckle noise in the early training stages. By incorporating fixed Gaussian derivative kernels, the SW-Net forces the network to focus on geometric regularities—specifically the straight lines and sharp angles characteristic of man-made shipwrecks—rather than the fractal-like texture of the natural seabed. This aligns with the visual perception principle that directionality is a key discriminator for artificial targets in noisy environments. However, a closer look at the ablation study provides a clearer understanding of how this improvement comes about. The ‘OU-Net’ variant, which employed deformable (offset) convolutions without directional guidance, suffered a catastrophic performance drop, with IoU falling to 26.11%. This suggests that while shipwreck shapes are irregular, providing the network with unconstrained geometric flexibility (via offset convolutions) leads to degenerate solutions where the model fails to latch onto meaningful boundaries. Without the guidance of the Directional Attention Mechanism, the offset convolution lacks the necessary cues to focus on structural boundaries, leading to unconstrained sampling and under-segmentation. The success of the full SW-Net confirms that directional priors act as a necessary constraint, guiding the deformable modules to focus on valid structural edges. It is the synergy between explicit directional extraction and adaptive deformation that enables the SW-Net to capture the irregular and often fragmented morphology of shipwrecks. This finding refines the understanding of deformable convolutions in sonar analysis and shows that they require explicit spatial attention to function effectively in low signal-to-noise ratio (SNR) environments.
A notable advantage of the SW-Net is its lightweight architecture. In the domain of underwater robotics, computational resources are often severely constrained. Compared with the Attention U-Net, which relies on computationally expensive attention blocks, or Transformer-based approaches that require heavy matrix multiplications, the SW-Net utilizes non-trainable filter banks and efficient channel reduction strategies. This design choice reduces the parameter count to approximately 4.01 million—significantly lower than the 31.04 million required by the baseline U-Net—while simultaneously improving the IoU by 2.52%. This reduction in computational overhead renders the SW-Net highly suitable for deployment on edge computing devices embedded in AUVs, facilitating real-time onboard processing.
In the application context, the efficiency of the SW-Net has potential implications for the “Blue Economy” and marine archaeology. Reliable automated detection of shipwrecks can significantly reduce the reliance on manual interpretation by experts, thereby improving survey efficiency and enabling large-scale analysis of sonar datasets. The current standard for shipwreck search involves post-processing data after the survey vessel returns to port, which causes delays between detection and verification. The extremely low computational cost of the proposed framework indicates feasibility for deployment on embedded hardware within AUVs. This would enable “search-and-inspect” missions where an AUV detects a target in real-time and immediately alters its trajectory to capture high-resolution optical verification, drastically reducing the cost and complexity of underwater heritage protection.
Despite these advancements, qualitative analysis reveals certain limitations. As observed in the Corsican samples, the model occasionally generates false positives in areas containing large rock formations. This misclassification arises because such rocks exhibit high acoustic reflectivity and geometric shadows similar to those of shipwrecks. Although the SW-Net suppresses background noise more effectively than competing models, distinguishing between natural, rock-like mimics and varying degrees of shipwreck debris remains a challenge solely based on single-frequency acoustic intensity. Furthermore, while the model performs robustly under sediment occlusion, extremely fragmented targets with weak acoustic returns may still suffer from minor structural omissions.
Future research should therefore look beyond single-modality segmentation. One promising direction is to combine SSS with bathymetric data or magnetometer readings, which can provide information on physical volume or metallic properties to help distinguish real targets from rock-like features. In addition, making use of the temporal consistency in sonar data may improve robustness against short-term noise, supporting more reliable detection in fully autonomous underwater archaeological surveys.
Overall, the results indicate that incorporating physical and geometric priors into deep learning models is a useful direction for improving the interpretation of acoustic remote sensing data.
6. Conclusions
This study introduces SW-Net, a deep learning framework designed for the automated detection and segmentation of shipwrecks in SSS imagery, and evaluates its performance through a series of experiments. To address common challenges such as heavy speckle noise, target deformation, and severe class imbalance, a tailored encoder-decoder architecture was proposed to bridge the gap between signal processing priors and deep feature learning.
The core contribution of this work is the combined use of a non-trainable DFB and a learnable Offset Convolution module. By incorporating physical knowledge of edge direction into the feature extraction, the model becomes more responsive to man-made structures while reducing interference from seabed reverberation. Based on experiments conducted on the AI4Shipwrecks dataset, SW-Net outperformed five other recent models, achieving an F1-score of 56.38% and an IoU of 39.26%, thereby reaching a state-of-the-art level. Notably, it required relatively low computational cost, making it both efficient and environmentally friendly. The results also show that designing a tailored framework like DFB could help balance computational effectiveness and efficiency, which makes it suitable for practical underwater detection and cultural heritage preservation. Overall, this work contributes to current image segmentation research, especially in the field of shipwreck detection.
Besides, the findings show that embedding geometric constraints into deep networks effectively tackles the challenges of low-contrast sonar data. Future work may proceed in two main directions. One is adapting the model for deployment on embedded systems to evaluate its performance under real-time survey conditions. The other is exploring multi-modal approaches, such as combining bathymetric data or multi-frequency sonar imagery, to better distinguish shipwrecks from complex geological features.
Author Contributions
Conceptualization, J.D. and J.H.; methodology, J.D.; software, J.D.; validation, J.D.; formal analysis, J.D.; investigation, J.D.; resources, J.D.; data curation, J.D.; writing—original draft preparation, J.D.; writing—review and editing, J.D. and J.H.; visualization, J.D.; supervision, J.H.; project administration, J.H.; funding acquisition, J.H. All authors have read and agreed to the published version of the manuscript.
Funding
This research was supported by funding from the National Natural Science Foundation of China (grant 52478049).
Institutional Review Board Statement
Not applicable.
Informed Consent Statement
Not applicable.
Data Availability Statement
The data presented in this study are openly available in Baidu Net disk at https://pan.baidu.com/s/1Z6itXnX4mlcVmmGl40_Drg?pwd=8dfn.
Conflicts of Interest
The authors declare no conflicts of interest.
Abbreviations
The following abbreviations are used in this manuscript:
| SSS | Side-scan sonar |
| AUV | Autonomous underwater vehicle |
| DFB | Directional filter bank |
| IoU | Intersection over union |
References
- Perez-Alvaro, E. Climate change and underwater cultural heritage: Impacts and challenges. J. Cult. Herit. 2016, 21, 842–848. [CrossRef]
- Nishikawa, C. Underwater cultural heritage in Asia Pacific and the UNESCO Convention on the Protection of the Underwater Cultural Heritage. Int. J. Asia-Pac. Stud. 2021, 17(2), 15–38. [CrossRef]
- Rai, N.; Sehgal, A.; Sambyal, D.; Julka, J.M.; Yadav, S.; Mishra, S.; Jaiswal, K. Marine bioresources and blue economy. In Biotechnological Innovations for Sustainable Biodiversity and Development; CRC Press: Boca Raton, FL, USA, 2025; pp. 160–173.
- Mayer, L.; Roach, J.A. The quest to completely map the world’s oceans in support of understanding marine biodiversity and the regulatory barriers we have created. In Marine Biodiversity of Areas beyond National Jurisdiction; Nordquist, M.H., Long, R., Eds.; Brill Nijhoff: Leiden, The Netherlands, 2021; pp. 149–166. [CrossRef]
- Majcher, J.; Quinn, R.; Andersen, G.N.; Gregory, D. Wreck Sites as Systems Disrupted by Trawling. In Threats to Our Ocean Heritage: Bottom Trawling; Jarvis, C., Ed.; Springer: Cham, Switzerland, 2024. [CrossRef]
- Horn, S.; Buck, B.H.; Amann, R.; Boteler, B.; Gee, K.; Goseberg, N.; Halbach, M.; Heins, A.; Heubel, K.; Kannen, A.; Kraft, D.; Lemmen, C.; Peters, K.; Schendel, A.; Schlurmann, T.; Schrum, C.; Schupp, P.J.; Stelzenmüller, V.; Sidorenko, V.; Wilhelmsen, U.; Wiltshire, K.H. Towards a Strategy for Offshore Installations to Enhance the Environmental Status of Coastal Seas: Multi-Use Concepts for Ecosystem Restoration. Mar. Policy 2025, 182, 106893. [CrossRef]
- Xie, B.; Zhang, H.; Wang, W. Side-Scan Sonar Image Classification Based on Joint Image Deblurring–Denoising and Pre-Trained Feature Fusion Attention Network. Electronics 2025, 14, 1287. [CrossRef]
- Cao, F.; Zeng, Y.; Yu, Z. Research on Multi-Scale Ship Target Detection Methods Under Complex Backgrounds. In Proceedings of the 2025 IEEE 2nd International Conference on Deep Learning and Computer Vision (DLCV), Jinan, China, 6–8 June 2025. [CrossRef]
- Li, A.Q.; Coskun, A.; Doherty, S.M.; Ghasemlou, S.; Jagtap, A.S.; Modasshir, M.; Rahman, S.; Singh, A.; Xanthidis, M.; O’Kane, J.M.; Rekleitis, I. Vision-Based Shipwreck Mapping: On Evaluating Features Quality and Open Source State Estimation Packages. In Proceedings of OCEANS 2016 MTS/IEEE Monterey, Monterey, CA, USA, 19–23 September 2016. [CrossRef]
- Field, S.; Kuijt, I.; Lash, R.; Burke, T. Monitoring Irish Coastal Heritage Destruction: A Case Study from Inishark, Co. Galway, Ireland. Remote Sens. 2025, 17, 2709. [CrossRef]
- Quinn, R. Acoustic Remote Sensing in Maritime Archaeology. In The Oxford Handbook of Maritime Archaeology; Ford, B., Hamilton, D.L., Catsambis, A., Eds.; Oxford University Press: New York, NY, USA, 2012; pp. 68–89. [CrossRef]
- Zhao, Q.; Wu, Y.; Yuan, Y. Progress of Ship Detection and Recognition Methods in Optical Remote Sensing Images. Acta Aeronaut. Astronaut. Sin. 2024, 45(8), 029025. [CrossRef]
- Wei, M.; Yu, Y.; Du, X.; Song, Y.; Dong, L.; Zhou, Q.; Wang, L.; Zhang, L.; Wang, Y. Automated Detection of Submarine Pipelines in the Yellow River Estuary: A Deep Learning Approach for Side-Scan Sonar Data in Dynamic Deltaic Systems. Front. Earth Sci. 2025, 13, 1596238. [CrossRef]
- Huebner, C.S. Evaluation of Side-Scan Sonar Performance for the Detection of Naval Mines. Proc. SPIE 2018, 10794, 107940J. [CrossRef]
- Salsabila, A.S.; Manik, H.M.; Mulyadi, D.S. Side Scan Sonar Data Quantification for Seabed Classification in Yos Sudarso Bay, Jayapura. IOP Conf. Ser. Earth Environ. Sci. 2023, 1251, 012016. [CrossRef]
- Grządziel, A. The Impact of Side-Scan Sonar Resolution and Acoustic Shadow Phenomenon on the Quality of Sonar Imagery and Data Interpretation Capabilities. Remote Sens. 2023, 15, 5599. [CrossRef]
- Zieja, M.; Wawrzyński, W.; Tomaszewska, J.; Sigiel, N. A Method for the Interpretation of Sonar Data Recorded during Autonomous Underwater Vehicle Missions. Pol. Marit. Res. 2022, 29(3), 176–186. [CrossRef]
- Cui, X.; Li, M.; Li, J.; Jiang, B.; Li, L.; Li, S. Side-Scan Sonar Submarine Pipeline Image Enhancement Incorporating Gamma Correction and Blurring Algorithms. IEEJ Trans. Electron. Inf. Syst. 2025, 145, 83–92. [CrossRef]
- Amanda, S.; Hariyanto, I.H.; Santoso, I.A. Comprehend Analysis of Surface and Subsurface Sediment Distribution Using Underwater Acoustic Instruments. IOP Conf. Ser. Earth Environ. Sci. 2024, 1418, 012065. [CrossRef]
- Wu, T.; Xia, P.; Liu, X.; Lei, B. TS-MRF Sonar Image Segmentation Based on the Levels Feature Information. Proc. SPIE 2015, 9811, 98110N. [CrossRef]
- Chen, Z.; Wang, Y.; Tian, W.; Liu, J.; Zhou, Y.; Shen, J. Underwater Sonar Image Segmentation Combining Pixel-Level and Region-Level Information. Comput. Electr. Eng. 2022, 100, 107853. [CrossRef]
- Ronneberger, O.; Fischer, P.; Brox, T. U-Net: Convolutional Networks for Biomedical Image Segmentation. In Medical Image Computing and Computer-Assisted Intervention – MICCAI 2015; Navab, N., Hornegger, J., Wells, W., Frangi, A., Eds.; Springer: Cham, Switzerland, 2015; Volume 9351, pp. 234–241. [CrossRef]
- Long, J.; Shelhamer, E.; Darrell, T. Fully Convolutional Networks for Semantic Segmentation. In Proceedings of the 2015 IEEE Conference on Computer Vision and Pattern Recognition (CVPR), Boston, MA, USA, 7–12 June 2015, pp. 3431–3440. [CrossRef]
- Motylinski, M.; Plater, A.J.; Higham, J.E. Computer Vision Methods for Side Scan Sonar Imagery. Meas. Sci. Technol. 2025, 36, 015435. [CrossRef]
- Wu, M.; Wang, Q.; Rigall, E.; Li, K.; Zhu, W.; He, B.; Yan, T. ECNet: Efficient Convolutional Networks for Side Scan Sonar Image Segmentation. Sensors 2019, 19, 2009. [CrossRef]
- Wang, Z.; Zhang, S.; Gross, L.; Zhang, C.; Wang, B. Fused Adaptive Receptive Field Mechanism and Dynamic Multiscale Dilated Convolution for Side-Scan Sonar Image Segmentation. IEEE Trans. Geosci. Remote Sens. 2022, 60, 5116817. [CrossRef]
- Gao, S.; Guo, W.; Xu, G.; Liu, B.; Sun, Y.; Yuan, B. A lightweight YOLO network using temporal features for high-resolution sonar segmentation. Front. Mar. Sci. 2025, 12, 1581794. [CrossRef]
- Wang, Q.; Wu, M.; Yu, F.; Feng, C.; Li, K.; Zhu, Y.; Rigall, E.; He, B. RT-Seg: A Real-Time Semantic Segmentation Network for Side-Scan Sonar Images. Sensors 2019, 19, 1985. [CrossRef]
- LeCun, Y.; Boser, B.; Denker, J.S.; Henderson, D.; Howard, R.E.; Hubbard, W.; Jackel, L.D. Backpropagation Applied to Handwritten Zip Code Recognition. Neural Comput. 1989, 1(4), 541–551. [CrossRef]
- LeCun, Y.; Bengio, Y. Convolutional networks for images, speech, and time series. In The Handbook of Brain Theory and Neural Networks; Arbib, M.A., Ed.; MIT Press: Cambridge, MA, USA, 1998; pp. 255–258. [CrossRef]
- Sun, Y.; Zheng, H.; Zhang, G.; Ren, J.; Shu, G. CGF-Unet: Semantic Segmentation of Sidescan Sonar Based on Unet Combined With Global Features. IEEE J. Ocean. Eng. 2024, 49, 963–975. [CrossRef]
- Lei, J.; Wang, H.; Fan, L.; Gu, Q.; Rong, S.; Zhang, H. SonarNet: Global Feature-Based Hybrid Attention Network for Side-Scan Sonar Image Segmentation. Remote Sens. 2025, 17, 2450. [CrossRef]
- Wang, Z.; You, Z.; Xu, N.; Wang, B.; Huang, D.-S. Cross-Scale Feature Interaction Network for Semantic Segmentation in Side-Scan Sonar Images. IEEE J. Sel. Top. Appl. Earth Obs. Remote Sens. 2025, 18, 5928–5948. [CrossRef]
- Yue, X.; Teng, F.; Lin, Y.; Hong, W. A Man-Made Target Extraction Method Based on Scattering Characteristics Using Multiaspect SAR Data. IEEE J. Sel. Top. Appl. Earth Obs. Remote Sens. 2021, 14, 11699–11712. [CrossRef]
- Teng, F.; Lin, Y.; Wang, Y.; Shen, W.; Feng, S.; Hong, W. Multi-Angular SAR Statistical Properties Analysis and Man-Made Target Detection. In Proceedings of the IGARSS 2020—2020 IEEE International Geoscience and Remote Sensing Symposium, Waikoloa, HI, USA, 26 September–2 October 2020; pp. 782–785. [CrossRef]
- Wu, J.; Chen, Y.; Dai, D.; Chen, S.; Wang, X. Clustering-Based Geometrical Structure Retrieval of Man-Made Target in SAR Images. IEEE Geosci. Remote Sens. Lett. 2017, 14, 279–283. [CrossRef]
- Vaswani, A.; Shazeer, N.; Parmar, N.; Uszkoreit, J.; Jones, L.; Gomez, A.N.; Kaiser, Ł.; Polosukhin, I. Attention is all you need. In Proceedings of the 31st International Conference on Neural Information Processing Systems (NIPS’17), Long Beach, CA, USA, 4–9 December 2017; pp. 6000–6010. [CrossRef]
- Niu, Z.; Zhong, G.; Yu, H. A review on the attention mechanism of deep learning. Neurocomputing 2021, 452, 48–62. [CrossRef]
- Hu, J.; Shen, L.; Sun, G. Squeeze-and-Excitation Networks. In Proceedings of the 2018 IEEE/CVF Conference on Computer Vision and Pattern Recognition (CVPR), Salt Lake City, UT, USA, 18–23 June 2018; pp. 7132–7141. [CrossRef]
- Woo, S.; Park, J.; Lee, J.-Y.; Kweon, I.S. CBAM: Convolutional Block Attention Module. In Proceedings of the European Conference on Computer Vision (ECCV), Munich, Germany, 8–14 September 2018; pp. 3–19. [CrossRef]
- Hu, F.; Tong, X.; Xia, G.-S.; Zhang, L. Delving into deep representations for remote sensing image retrieval. In Proceedings of the 2016 IEEE 13th International Conference on Signal Processing (ICSP), Chengdu, China, 6–10 November 2016; pp. 198–203. [CrossRef]
- Karim, A.K.M.R.; Proulx, M.J.; Likova, L.T. Anticlockwise or Clockwise? A Dynamic Perception-Action-Laterality Model for Directionality Bias in Visuospatial Functioning. Neurosci. Biobehav. Rev. 2016, 68, 669–693. [CrossRef]
- Remondino, F.; Menna, F.; Morelli, L. Evaluating Hand-Crafted and Learning-Based Features for Photogrammetric Applications. Int. Arch. Photogramm. Remote Sens. Spat. Inf. Sci. 2021, XLIII-B2-2021, 549–556. [CrossRef]
- Badrinarayanan, V.; Kendall, A.; Cipolla, R. SegNet: A Deep Convolutional Encoder-Decoder Architecture for Image Segmentation. IEEE Trans. Pattern Anal. Mach. Intell. 2017, 39, 2481–2495. [CrossRef]
- Khetan, N.; Arora, T.; Rehman, S.u.; Gupta, D.K. Implicitly Rotation Equivariant Neural Networks. In Proceedings of the 48th IEEE International Conference on Acoustics, Speech and Signal Processing (ICASSP 2023), Rhodes, Greece, 4–10 June 2023. [CrossRef]
- Qi, G.J.; Zhang, L.; Chen, C.W.; Tian, Q. AVT: Unsupervised Learning of Transformation Equivariant Representations by Autoencoding Variational Transformations. In Proceedings of the 2019 IEEE/CVF International Conference on Computer Vision (ICCV), Seoul, Republic of Korea, 27 October–2 November 2019; pp. 8129–8138. [CrossRef]
- Hou, Q.; Zhou, D.; Feng, J. Coordinate Attention for Efficient Mobile Network Design. In Proceedings of the 2021 IEEE/CVF Conference on Computer Vision and Pattern Recognition (CVPR), Nashville, TN, USA, 20–25 June 2021; pp. 13713–13722. [CrossRef]
- Li, Y.; Hou, Q.; Zheng, Z.; Cheng, M.-M.; Yang, J.; Li, X. Large Selective Kernel Network for Remote Sensing Object Detection. In Proceedings of the 2023 IEEE/CVF International Conference on Computer Vision (ICCV), Paris, France, 1–6 October 2023; pp. 16748–16759. [CrossRef]
- Zhang, Y.; Wang, C.; Chen, J.; Wang, F. Shape-Constrained Method of Remote Sensing Monitoring of Marine Raft Aquaculture Areas on Multitemporal Synthetic Sentinel-1 Imagery. Remote Sens. 2022, 14, 1249. [CrossRef]
- Oktay, O.; Schlemper, J.; Le Folgoc, L.; Lee, M.J.; Heinrich, M.P.; Misawa, K.; Mori, K.; McDonagh, S.G.; Hammerla, N.Y.; Kainz, B.; et al. Attention U-Net: Learning Where to Look for the Pancreas. arXiv 2018, arXiv:1804.03999. [CrossRef]
- Zhou, Z.; Rahman Siddiquee, M.M.; Tajbakhsh, N.; Liang, J. UNet++: A Nested U-Net Architecture for Medical Image Segmentation. In Deep Learning in Medical Image Analysis and Multimodal Learning for Clinical Decision Support; Stoyanov, D.; et al., Eds.; Springer: Cham, Switzerland, 2018; Volume 11045, pp. 3–11. [CrossRef]
- Wang, J.; Fan, J.; and Wang, J. MDOAU-Net: A Lightweight and Robust Deep Learning Model for SAR Image Segmentation in Aquaculture Raft Monitoring. IEEE Geoscience and Remote Sensing Letters, vol. 19, pp. 1-5, 2022. [CrossRef]
- Khorbotly, S.; Hassan, F. A Modified Approximation of 2D Gaussian Smoothing Filters for Fixed-Point Platforms. In Proceedings of the 2011 IEEE 43rd Southeastern Symposium on System Theory (SSST), Auburn, AL, USA, 14–16 March 2011; pp. 151–159. [CrossRef]
- Sethuraman, A.V.; Sheppard, A.; Bagoren, O.; Pinnow, C.; Anderson, J.; Havens, T.C.; Skinner, K.A. Machine Learning for Shipwreck Segmentation from Side Scan Sonar Imagery: Dataset and Benchmark. Int. J. Robot. Res. 2025, 44, 341–354. [CrossRef]
- Zhang, J.; Zhao, Z. Optimized Gaussian Filter Motion Image Background Processing. In Proceedings of the 2022 IEEE International Conference on Advances in Electrical Engineering and Computer Applications (AEECA), Dalian, China, 20–21 August 2022; pp. 633–636. [CrossRef]
- Bruggeman, J.F.E.; Stockman, K.; De Kooning, J.D.M. Edge Detection with Machine Vision Using Derivative of Gaussian Filters with q-Gaussian Kernels. In Proceedings of the 2025 11th International Conference on Mechatronics and Robotics Engineering (ICMRE), Lille, France, 24–26 February 2025; pp. 1–6. [CrossRef]
- Abu, A.; Diamant, R. Feature Set for Classification of Man-Made Underwater Objects in Optical and SAS Data. IEEE Sens. J. 2022, 22(6), 6027–6041. [CrossRef]
- Jia, H.; Yu, X.; Zhou, T. Intelligent Sensing and Tracking Algorithm for Small Targets in Forward-Looking Sonar Images. J. Harbin Eng. Univ. 2025, 46, 129–137. [CrossRef]
- Liu, S.; Jian, J.; Tang, J. A Novel Sonar Image Target Detection Model Based on Fast Large Kernel Attention Network. In Proceedings of the Fourth International Conference on Image Processing and Intelligent Control (IPIC 2024), Kuala Lumpur, Malaysia, 10–12 May 2024; Du, K., Zain, A.M., Eds.; SPIE: Bellingham, WA, USA, 2024; Volume 13250, p. 132501L. [CrossRef]
Figure 1.
Framework of the SW-Net.
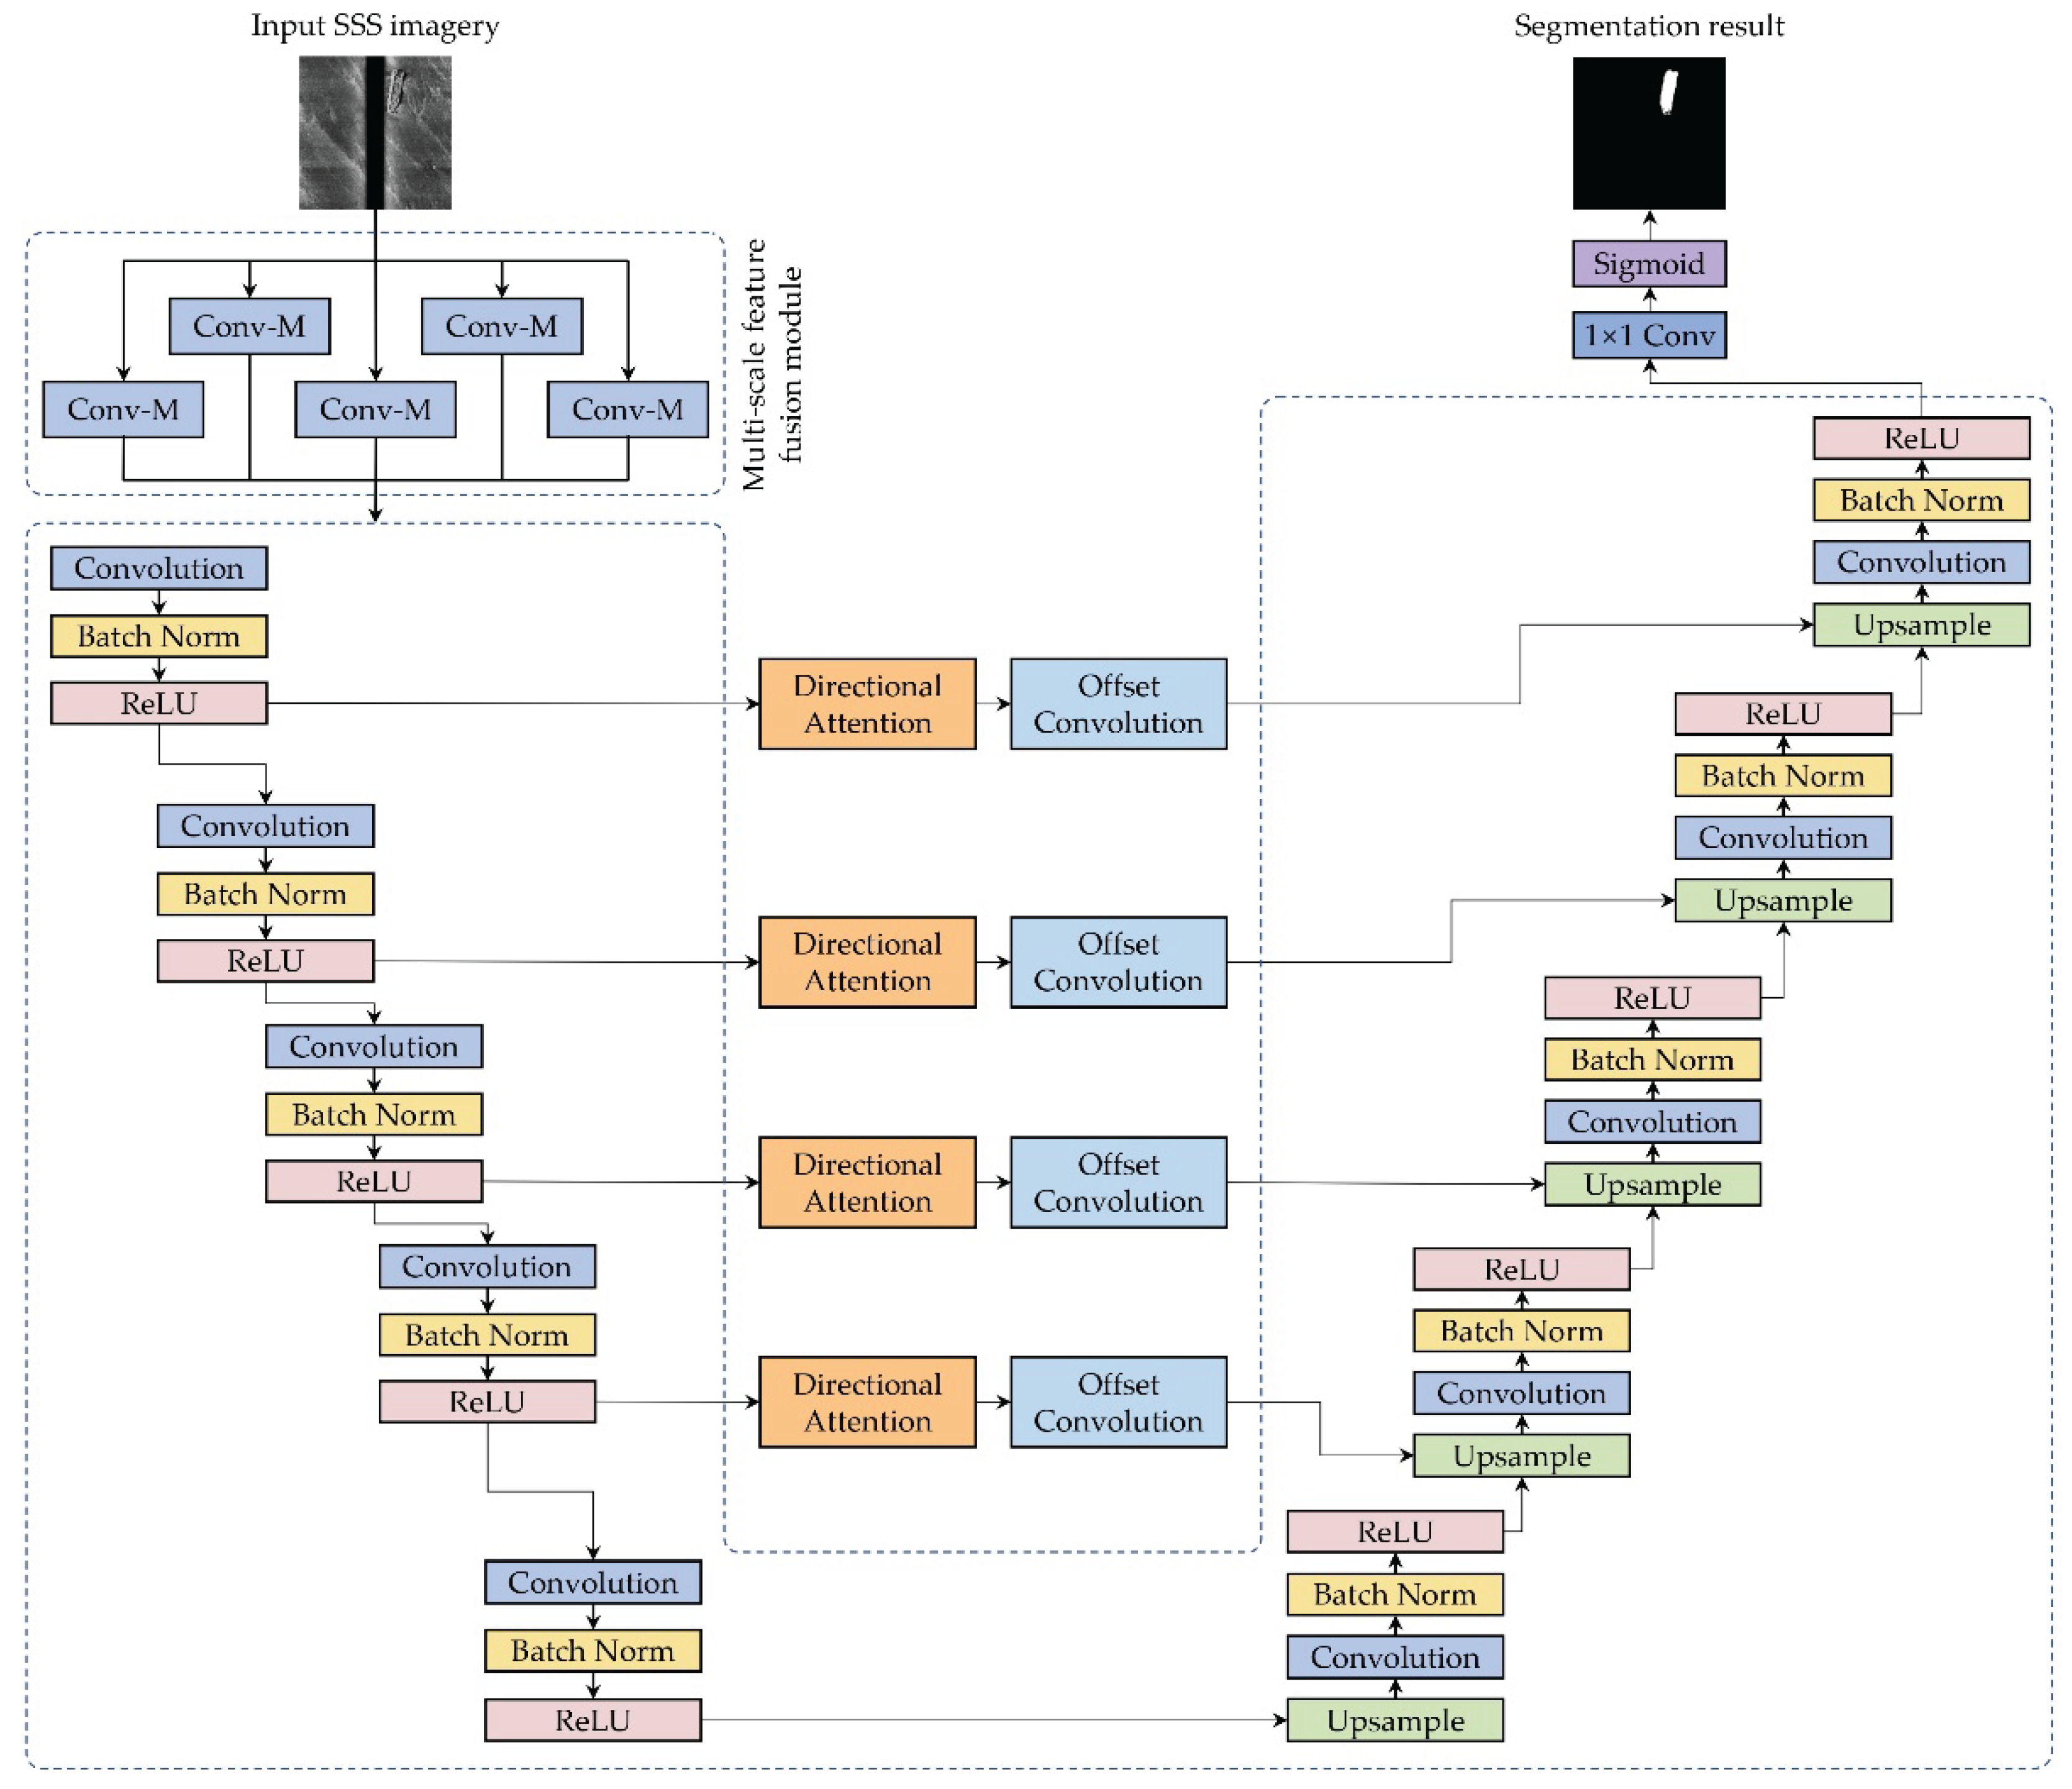
Figure 2.
Structure of the offset convolution.
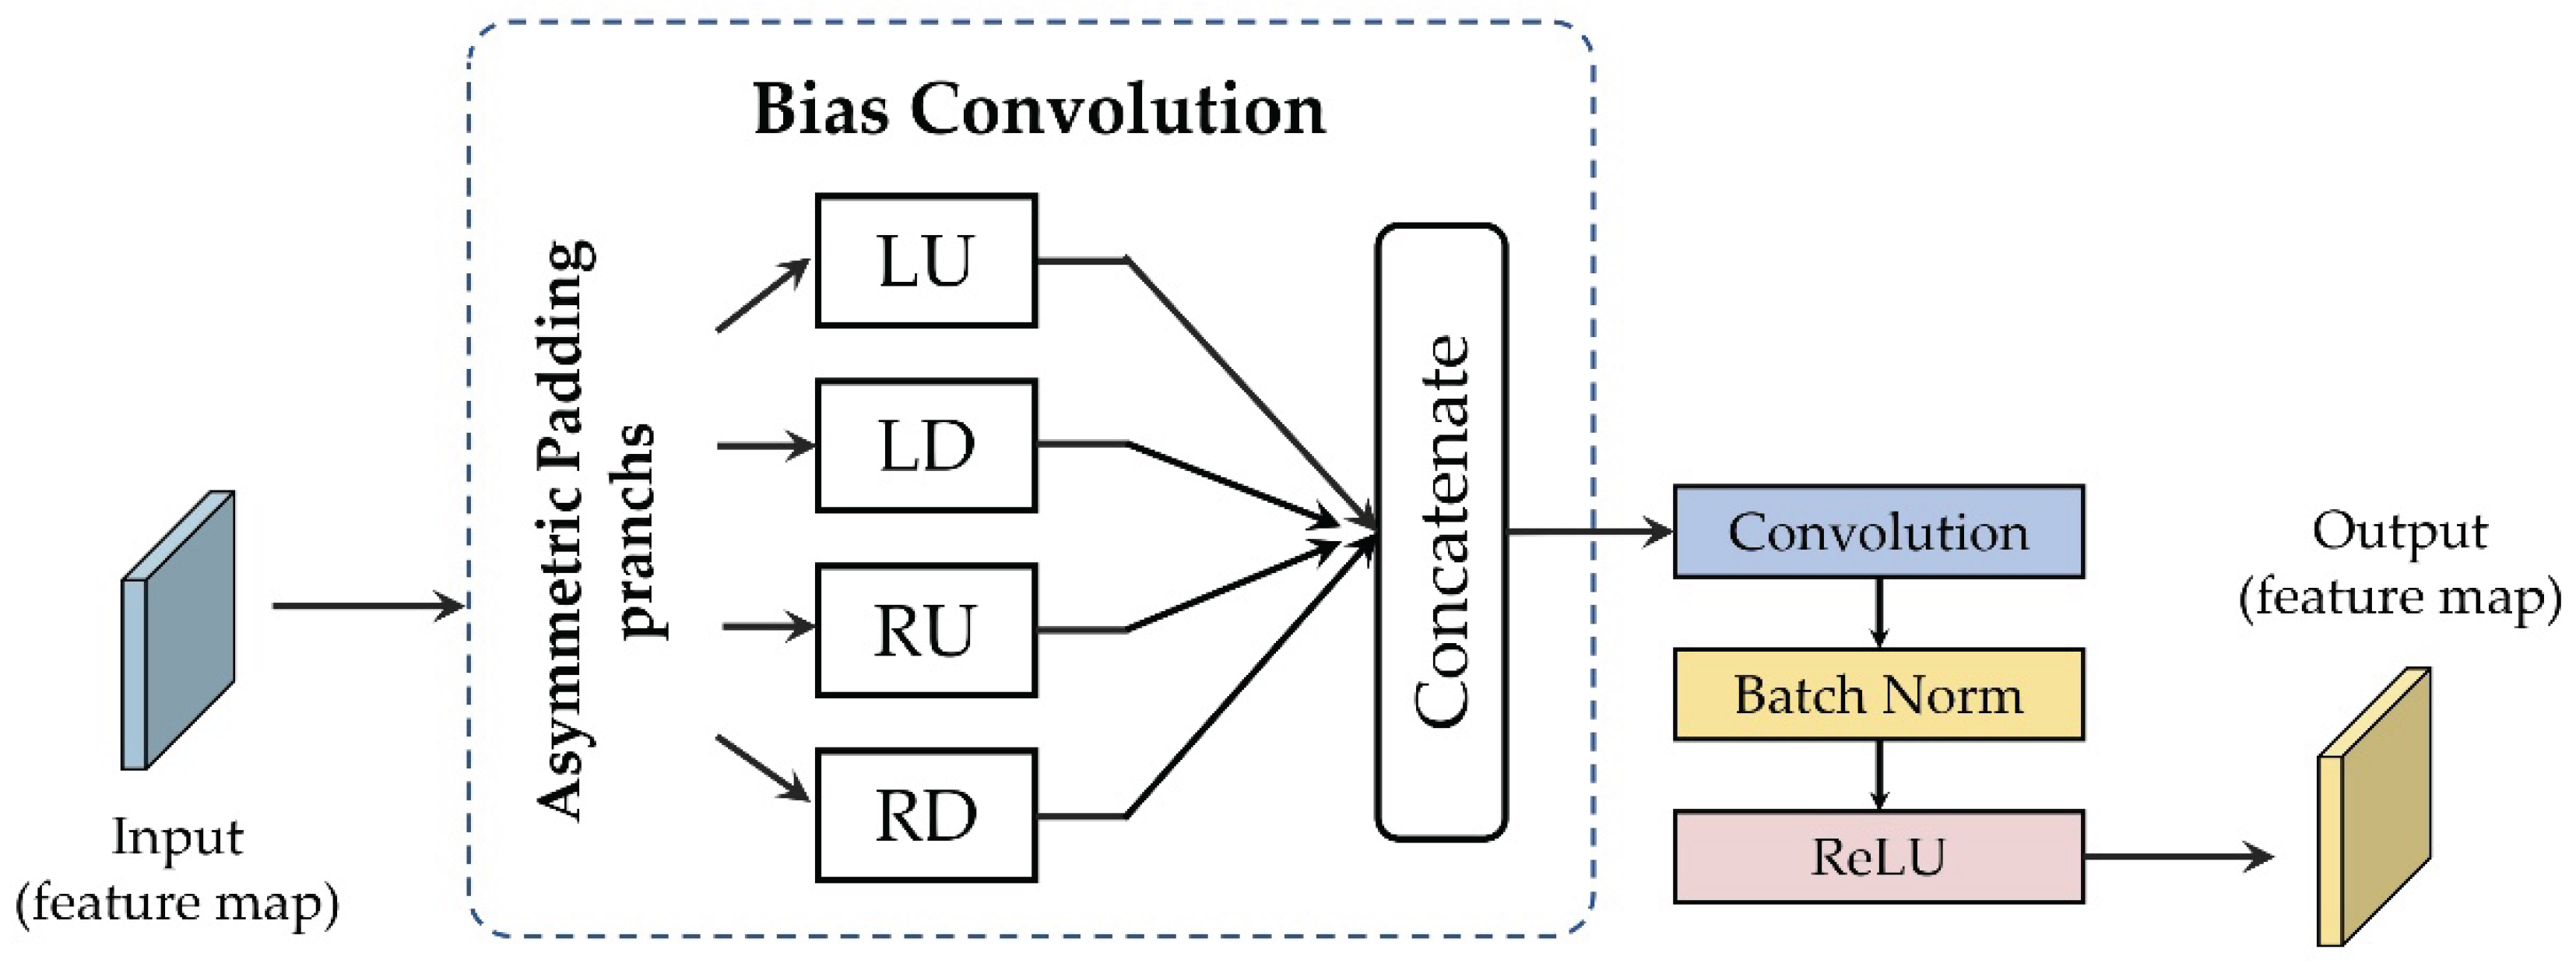
Figure 3.
The structure of the directional filter bank.
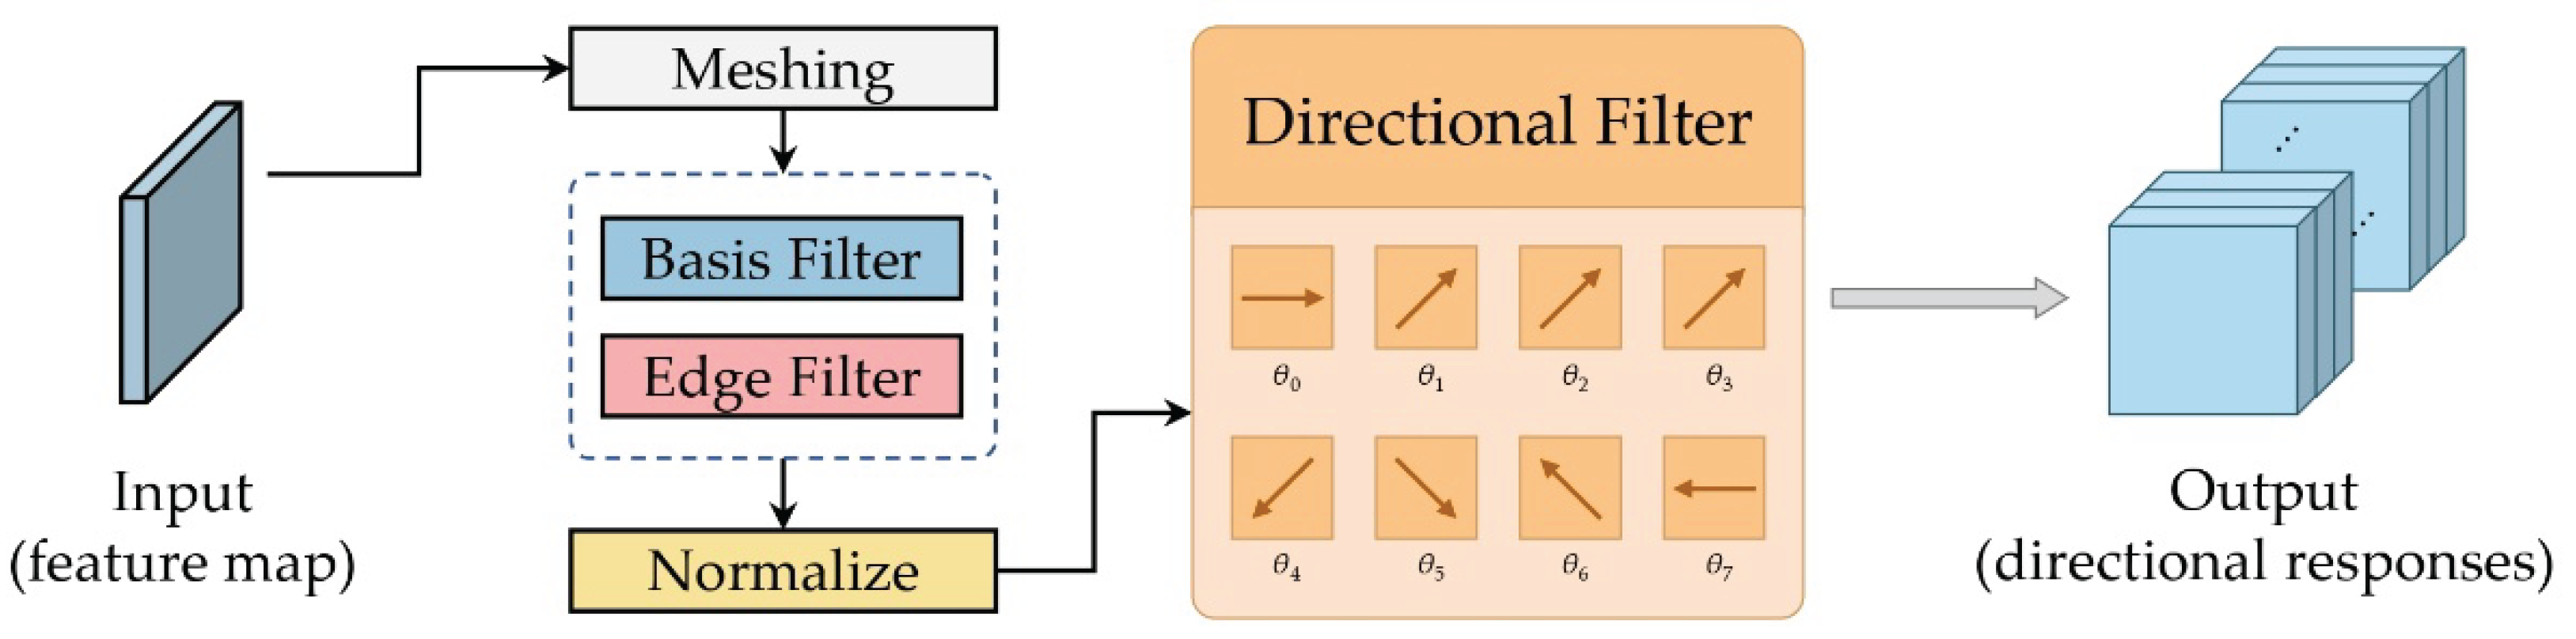
Figure 4.
The structure of the directional attention mechanism.
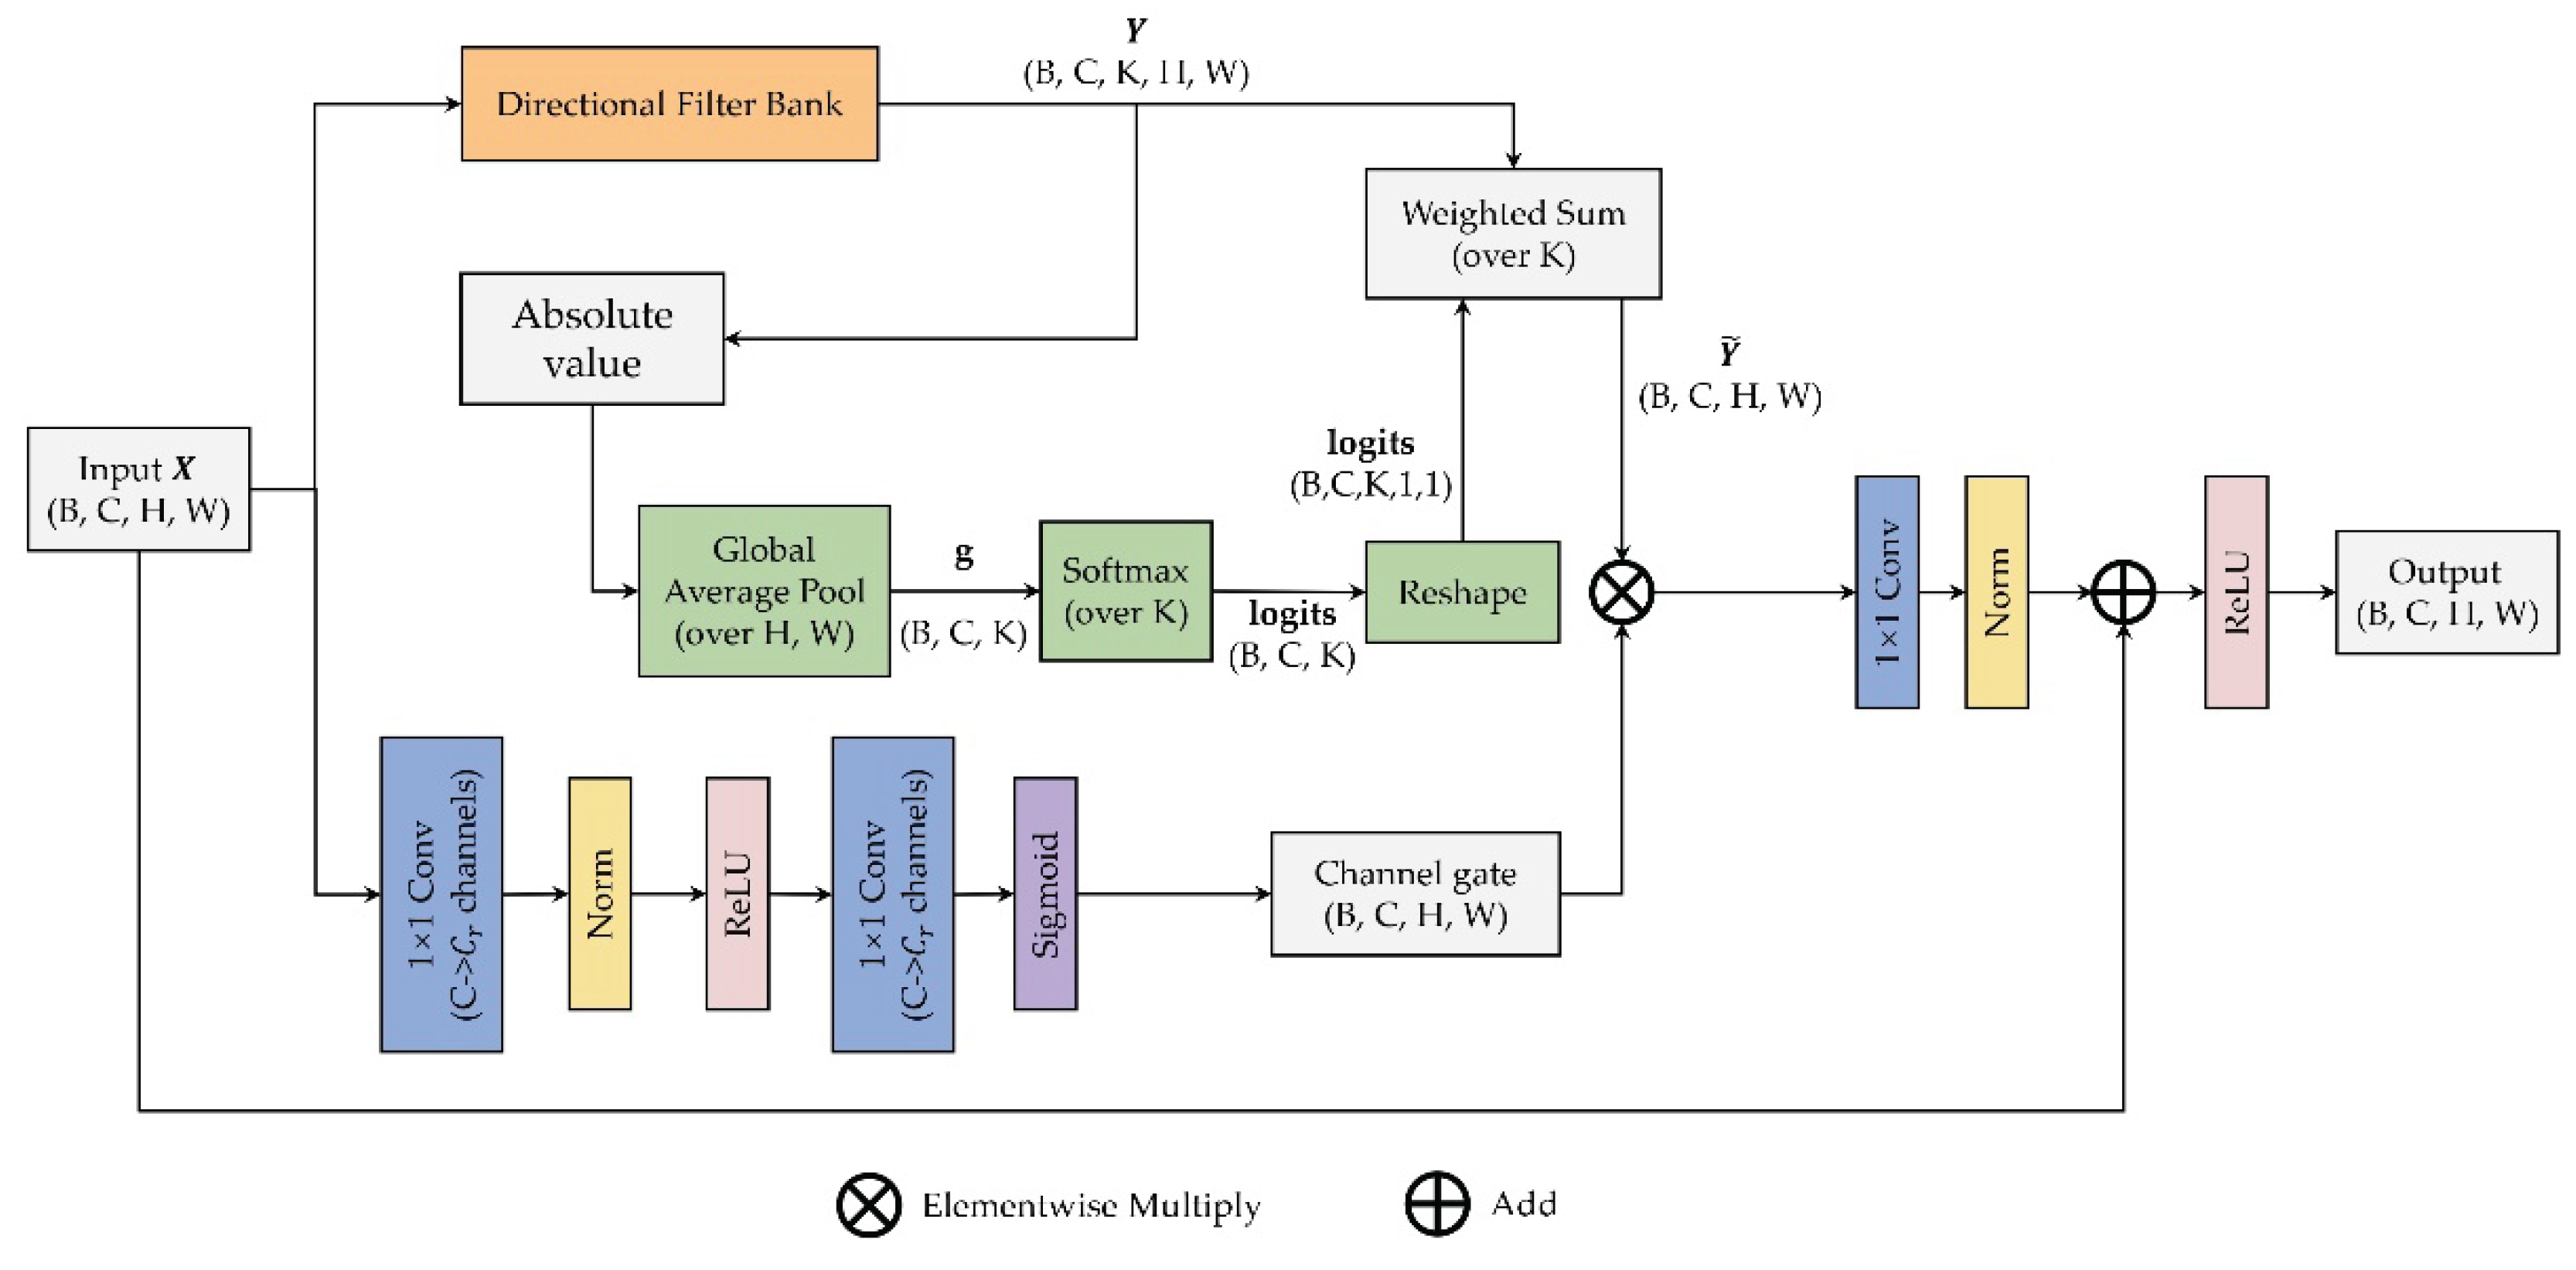
Figure 5.
Segmentation results of different models.
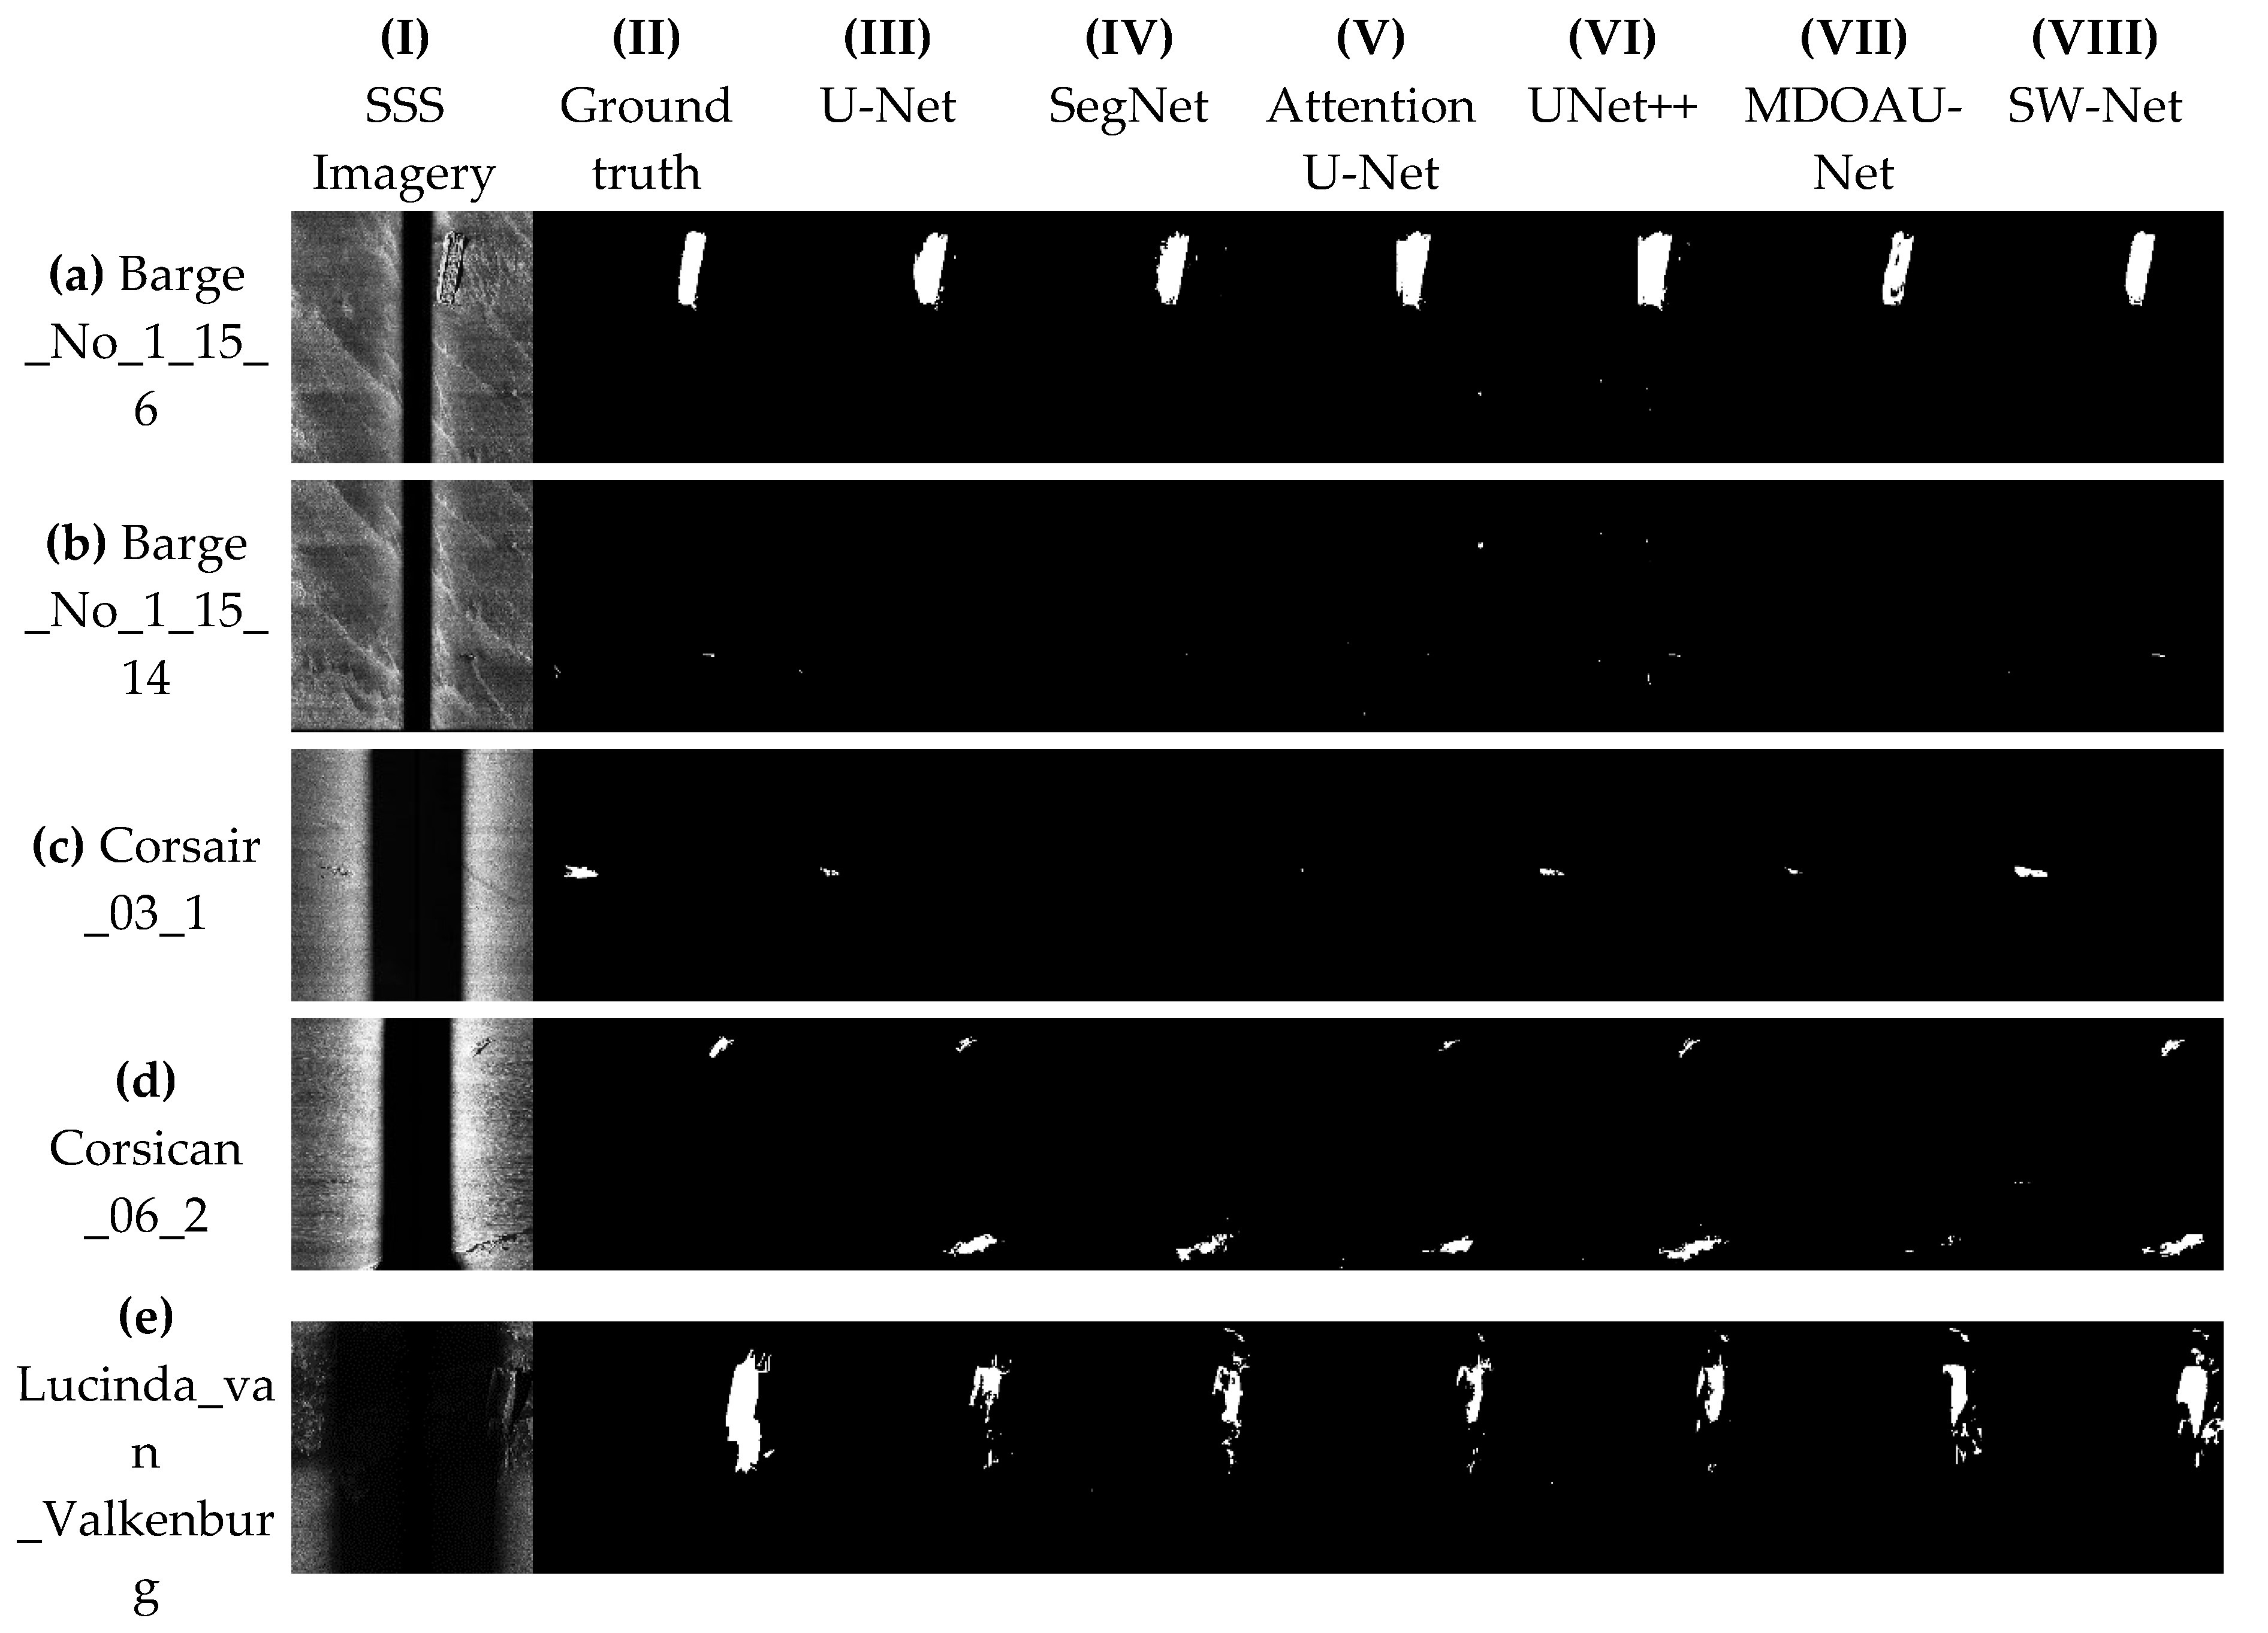
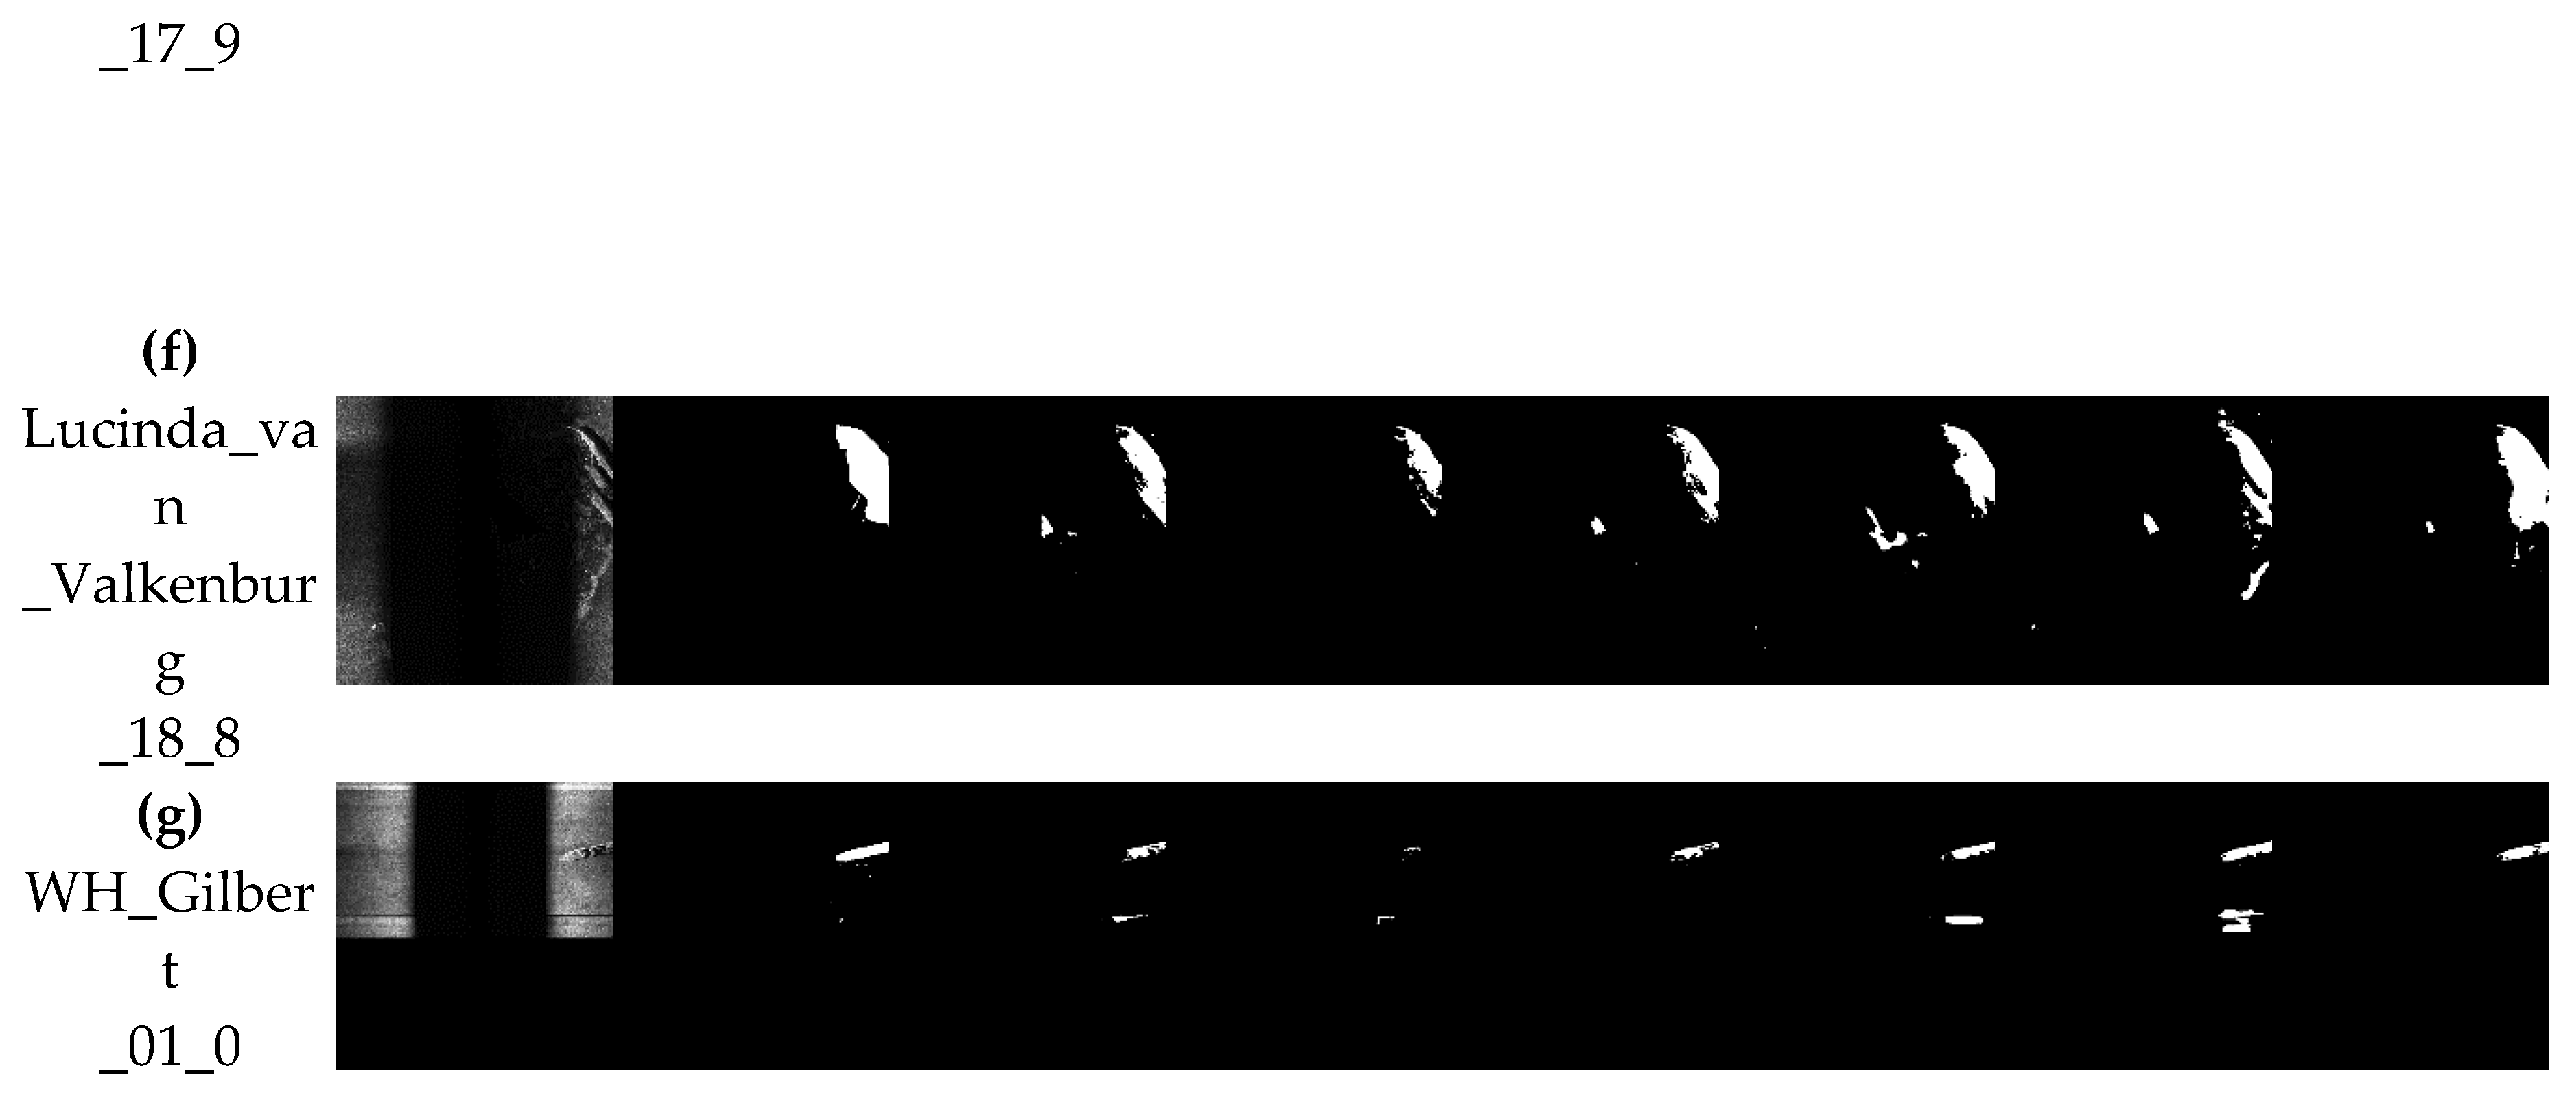

Table 1.
Quantitative comparison of different segmentation models on the shipwreck SSS dataset.
| Model | IoU↑ | F1-score↑ | TP↑ | TN↑ | FP↓ | FN↓ |
|---|---|---|---|---|---|---|
| U-Net | 36.73% | 53.73% | 1,749,082 | 446,650,872 | 1,004,965 | 2,007,049 |
| SegNet | 34.93% | 49.34% | 1,435,003 | 447,030,398 | 625,439 | 2,321,128 |
| Attention U-Net | 36.30% | 53.27% | 1,662,634 | 446,832,855 | 822,982 | 2,093,497 |
| UNet++ | 36.82% | 53.83% | 1,746,732 | 446,669,089 | 986,748 | 2,009,399 |
| MDOAU-Net | 37.66% | 54.71% | 1,709,802 | 446,872,360 | 783,477 | 2,046,329 |
| SW-Net | 39.26% | 56.38% | 1,753,903 | 446,944,382 | 711,455 | 2,002,228 |
↑ indicates higher is better and ↓ indicates lower is better.
Table 2.
Ablation study on the effects of different modules on segmentation performance.
| Model | IoU↑ | F1-score↑ | TP↑ | TN↑ | FP↓ | FN↓ |
|---|---|---|---|---|---|---|
| U-Net | 36.73% | 53.73% | 1,749,082 | 446,650,872 | 1,004,965 | 2,007,049 |
| OU-Net | 26.11% | 41.41% | 1,092,845 | 447,227,575 | 428,262 | 2,663,286 |
| MDOAU-Net | 37.66% | 54.71% | 1,709,802 | 446,872,360 | 783,477 | 2,046,329 |
| SW-Net | 39.26% | 56.38% | 1,753,903 | 446,944,382 | 711,455 | 2,002,228 |
↑ indicates higher is better and ↓ indicates lower is better.
Table 3.
Comparison of model performance with varying kernel sizes.
| Kernel Size | IoU↑ | F1-score↑ | TP↑ | TN↑ | FP↓ | FN↓ |
|---|---|---|---|---|---|---|
| 3 | 38.34% | 55.43% | 1,617,925 | 447,192,406 | 483,431 | 2,118,206 |
| 5 | 37.96% | 55.02% | 1,782,542 | 446,715,684 | 960,153 | 1,953,589 |
| 7 | 39.26% | 56.38% | 1,753,903 | 446,944,382 | 711,455 | 2,002,228 |
| 9 | 36.10% | 53.05% | 1,608,874 | 446,955,581 | 720,256 | 2,127,257 |
| 11 | 38.02% | 55.10% | 1,596,984 | 447,211,975 | 463,862 | 2,139,147 |
↑ indicates higher is better and ↓ indicates lower is better.
Table 4.
Comparison of different directional dimensions on segmentation performance.
| Directional Dimension |
IoU↑ | F1-score↑ | TP↑ | TN↑ | FP↓ | FN↓ |
|---|---|---|---|---|---|---|
| 2 | 39.33% | 56.46% | 1,724,250 | 447,028,296 | 647,541 | 2,011,881 |
| 4 | 37.73% | 56.79% | 1,886,790 | 446,410,992 | 1,264,845 | 1,849,341 |
| 8 | 39.26% | 56.38% | 1,753,903 | 446,944,382 | 711,455 | 2,002,228 |
| 16 | 36.50% | 53.48% | 1,564,955 | 447,124,208 | 551,628 | 2,171,176 |
| 32 | 39.14% | 56.25% | 1,757,756 | 446,920,534 | 755,303 | 1,978,375 |
↑ indicates higher is better and ↓ indicates lower is better.
Table 5.
Comparison of different channel reduction ratios on segmentation performance.
| Channel Reduction Ratio | IoU↑ | F1-score↑ | TP↑ | TN↑ | FP↓ | FN↓ |
|---|---|---|---|---|---|---|
| 1 | 37.65% | 54.70% | 1,726,648 | 446,825,928 | 849,909 | 2,009,483 |
| 4 | 39.26% | 56.38% | 1,753,903 | 446,944,382 | 711,455 | 2,002,228 |
| 16 | 38.49% | 55.58% | 1,632,441 | 447,170,661 | 505,176 | 2,103,690 |
↑ indicates higher is better and ↓ indicates lower is better.
Table 6.
Quantitative comparison of segmentation performance, parameter scale, and computational cost across different network architectures.
Table 6.
Quantitative comparison of segmentation performance, parameter scale, and computational cost across different network architectures.
| Model | IoU↑ | Number of parameters(M)↓ | FLOPs(G)↓ |
|---|---|---|---|
| U-Net | 36.73% | 31.04 | 218.65 |
| SegNet | 34.93% | 29.44 | 160.22 |
| Attention U-Net | 36.30% | 34.88 | 266.23 |
| UNet++ | 36.82% | 9.16 | 139.46 |
| MDOAU-Net | 37.66% | 4.09 | 59.48 |
| SW-Net | 39.26% | 4.01 | 41.45 |
↑ indicates higher is better and ↓ indicates lower is better.
Disclaimer/Publisher’s Note: The statements, opinions and data contained in all publications are solely those of the individual author(s) and contributor(s) and not of MDPI and/or the editor(s). MDPI and/or the editor(s) disclaim responsibility for any injury to people or property resulting from any ideas, methods, instructions or products referred to in the content. |
© 2026 by the authors. Licensee MDPI, Basel, Switzerland. This article is an open access article distributed under the terms and conditions of the Creative Commons Attribution (CC BY) license (http://creativecommons.org/licenses/by/4.0/).
Copyright: This open access article is published under a Creative Commons CC BY 4.0 license, which permit the free download, distribution, and reuse, provided that the author and preprint are cited in any reuse.