Submitted:
18 April 2026
Posted:
20 April 2026
You are already at the latest version
Preprints on COVID-19 and SARS-CoV-2
Abstract
Background: Risk factors for severe COVID 19 and in hospital mortality are well described, but it remains unclear whether the same factors predict mortality after hospital discharge. Distinguishing risk profiles across clinical phases may improve patient management and follow up strategies.
Methods: We conducted a retrospective observational cohort study of 595 adults hospitalized with PCR‑confirmed SARS-CoV-2 infection in Portugal (September and November 2020). The primary outcome was all‑cause mortality during hospitalization and up to 120 days post-discharge. Secondary outcomes included intensive care unit (ICU) admission, maximum disease severity (WHO Clinical Progression Scale), oxygen supplementation, and length of stay. Univariate and multivariable regression analyses were performed.
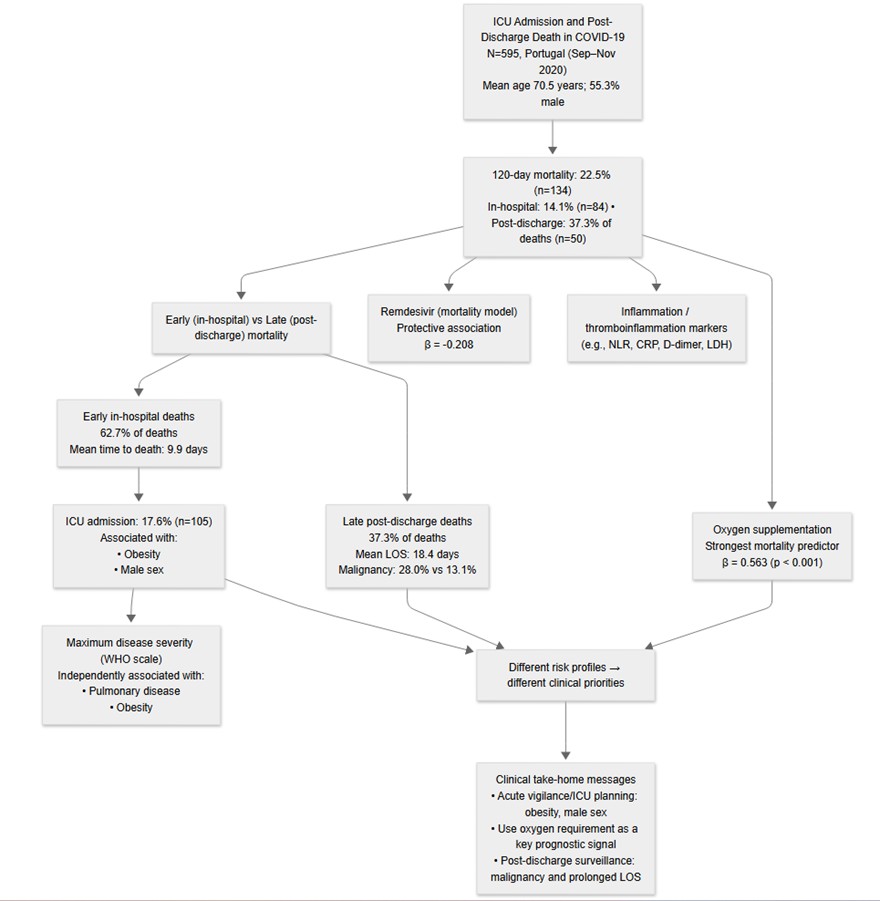
Results: Overall mortality was 22.5%, rising from 14.1% in-hospital to 22.5% at 120‑day follow‑up (p < 0.001), with 37.3% of deaths occurring post-discharge. ICU admission was required in 17.6% of patients and was significantly associated with obesity (OR = 2.12, 95% CI: 1.39–3.23, p < 0.001) and male sex (OR = 1.78, 95% CI: 1.14–2.78, p = 0.010) in univariate analysis. In contrast, post‑discharge mortality was associated with longer hospital stay (18.4 vs. 9.9 days, p < 0.001) and a higher prevalence of malignancy (28.0% vs. 13.1%, p = 0.032), but not with ICU admission. In multivariable analysis, oxygen supplementation was the strongest predictor of mortality (β = 0.563, p < 0.001). Only pulmonary diseases and obesity were independently associated with maximum disease severity.
Conclusions: Risk factors for acute COVID‑19 severity differ from those for late mortality. These findings support a phase‑specific approach to risk stratification, suggesting that patients with obesity are at increased risk of early respiratory deterioration, while patients with malignancy may benefit from closer post discharge follow up regardless of ICU admission status.
Keywords:
COVID-19
; ICU admission
; post-discharge mortality
; risk factors
; oxygen supplementation
; obesity
; malignancy
; prognostic biomarkers
; SARS-CoV-2
1. Introduction
Coronavirus disease 2019 (COVID-19), caused by severe acute respiratory syndrome coronavirus 2 (SARS-CoV-2), was first identified in late 2019 and rapidly evolved into a global pandemic [1,2]. Early clinical and epidemiological reports described a wide spectrum of disease severity and highlighted the substantial burden of morbidity and mortality associated with COVID-19 worldwide [3,4].
Since the early phases of the pandemic, numerous studies have identified demographic and clinical factors associated with severe disease, intensive care unit (ICU) admission, and in-hospital mortality. Advanced age, male sex, obesity, and multiple comorbidities have consistently been linked to worse in-hospital outcomes across diverse healthcare settings [5,6,7,8]. These findings have informed risk stratification, decision-making, and resource allocation during acute hospitalization.
Several prognostic models and risk scores have subsequently been developed to predict disease severity and mortality in hospitalized patients with COVID-19 [9,10,11]. However, systematic reviews have raised concerns regarding heterogeneity, bias, and limited external validity among many proposed models, underscoring the challenges of prognostic research during a rapidly evolving pandemic [11,12].
As survival following hospitalization for COVID-19 improved, attention increasingly shifted toward outcomes occurring after hospital-discharge. Post-acute and long-term sequelae of COVID-19, including persistent symptoms and increased cardiovascular risk, have been increasingly recognized [13,14]. Nevertheless, most studies have focused either on acute in-hospital outcomes or on selected post-acute populations, limiting the ability to directly compare risk factors across different phases of disease within the same cohort.
Pathophysiological studies have demonstrated that severe COVID-19 is characterized by marked inflammatory responses, endothelial injury, and immunothrombotic dysregulation, with biomarkers of inflammation and thrombosis strongly associated with disease severity and poor in-hospital outcomes [15,16,17,18]. However, their relationship with late post-discharge mortality remains less well defined.
In parallel, the widespread implementation of vaccination campaigns and the emergence of new viral variants have altered the epidemiology and clinical course of COVID-19 over time [19,20]. As healthcare systems transition from emergency response toward long-term disease management, there is an increasing need to better characterize phase-specific risk profiles to inform both inpatient care and post-discharge follow-up strategies [21].
Therefore, the aim of the present study was to evaluate risk factors associated with acute disease severity, ICU admission, and mortality during hospitalization and up to 120 days after discharge in a retrospective cohort of patients hospitalized with SARS-CoV-2 infection. By distinguishing predictors of acute versus late outcomes within the same population, this study seeks to inform phase-specific risk assessment across the continuum of COVID-19 care.
2. Materials and Methods
2.1. Study Design and Patients
We conducted a retrospective observational cohort study of all consecutive adults (≥18 years) hospitalized with PCR-confirmed COVID-19 at the Santo António University Hospital Center, Portugal, during the second wave of the pandemic (September 1 to November 30, 2020). Cases were identified via the hospital's Epic electronic health records (EHR) system. A confirmed COVID-19 case was defined by the presence of ICD-10 code U07.1 and a positive RT-PCR test for SARS-CoV-2 from a respiratory specimen during hospitalization. Inclusion criteria were: (1) age ≥18 years, (2) hospitalization during the study period, and (3) meeting the confirmed COVID-19 case definition. The exclusion criterion was >30% missing clinical data in the EHR. The study was approved by the hospital's Scientific Board, Ethics Committee and Data Protection Officer (Reference: 2021.236 [188-DEFI/196-CE]), with anonymized data handling in compliance with data protection legislation and a waiver of informed consent. This study is reported following the Strengthening the Reporting of Observational Studies in Epidemiology (STROBE) [22] guidelines for cohort studies. The completed STROBE checklist is provided as Supplementary Material: Supplementary File S1: STROBE Checklist.
2.2. Baseline Demographic and Clinical Variables
Demographic, clinical, treatment, and outcome data were extracted from EHR. Variables included age, sex, comorbidities [obesity (Body Mass Index ≥30), pulmonary, cardiac, hypertension, dyslipidemia, type 2 diabetes, renal, oncological, hematological, and other (including auto-immune, neurodegenerative diseases, and conditions in immunosuppression)], symptoms at admission, and admission laboratory values (complete blood count, neutrophil-to-lymphocyte ratio (NLR), renal and liver function tests, CRP, ferritin, fibrinogen, D-dimer). Treatments recorded were dexamethasone, remdesivir, and enoxaparin (categorized as prophylactic or therapeutic). Ventilatory support was categorized from supplemental oxygen to invasive mechanical ventilation. Clinical parameters also obtained included date of hospital admission, hospital admission department and transfers, intensive care unit (ICU) admission date, discharge date, date of death, length of stay (LOS), time between diagnosis and hospitalization, symptoms at admission, complications during hospitalization, and progress after discharge.
2.3. WHO Ordinal Scale and Severity Definitions
Maximum COVID-19 severity during hospitalization was assessed using the 9-point WHO Clinical Progression Scale (0 = uninfected; 1-8 = increasing severity of illness, with 8 = death) [23]. For each patient, we recorded the highest (worst) score attained at any point during the hospital stay. This ordinal variable served as a key outcome measure to characterize the peak clinical burden of the disease.
2.4. Outcomes
The primary prognostic outcome was all-cause mortality recorded during hospitalization and 120 days after discharge. Secondary prognostic outcomes were LOS (duration of hospitalization in the ICU and medical ward), the need for ventilatory treatment, and the existence of COVID-19 symptoms. Patients still hospitalized at data extraction were excluded from mortality and LOS calculations (Figure S1) .
2.5. Statistical Analysis
Descriptive statistical analyses were performed to summarize all variables. For categorical data, frequencies and percentages (%) were reported. For continuous variables with normal distribution, means (M) and standard deviations (SD) were calculated, while for non-normally distributed continuous variables, medians (Mdn) and interquartile ranges (IQR) were used. Inferential analyses included bivariate comparisons using Student's t-test for normally distributed continuous variables that met assumptions of normality (Shapiro-Wilk p > 0.05) and homogeneity of variance (Levene's p > 0.05), with results reported as t(df), p-value, and Cohen's d for effect size interpretation (cutoffs: 0.2 = small, 0.5 = medium, 0.8 = large). For continuous variables violating parametric assumptions, the Mann-Whitney U test was employed, with reporting of U statistic, z-score, p-value, and rank-biserial correlation r effect size (cutoffs: 0.1 = small, 0.3 = medium, 0.5 = large). Categorical variables were compared using Chi-square tests (χ²(df), p-value) when expected cell frequencies exceeded 5, otherwise Fisher's exact test was applied, with Cramér's V effect size reported (cutoffs: 0.1 = small, 0.3 = medium, 0.5 = large).
Comparison between in-hospital and 120-day mortality was performed using McNemar's test for paired proportions. Statistical significance was set at p < 0.05 for all tests. Regression analysis included linear regression for continuous outcomes (e.g., LOS), reporting unstandardized (B) and standardized (β) coefficients with 95% confidence intervals, p-values, overall model F(df), p-value, and adjusted R² after verifying linearity, multicollinearity (VIF < 5 cutoff), and residual assumptions. Moderation analysis tested interaction effects (e.g., ICU transfer moderating oxygen-hospitalization relationship) using Hayes' PROCESS macro or hierarchical regression, reporting interaction coefficients (B), p-values, ΔR² for interaction terms, and simple slopes analysis at ±1 SD of the moderator. Analyses were performed using SPSS Statistics (Version 28.0, IBM Corp., Armonk, NY, USA), with effect sizes reported for clinical interpretation and missing data addressed via appropriate methods (multiple imputation). Missing data across laboratory variables ranged from 0% to 35%, with the highest missingness observed for ferritin (35.0%, n=208) and D-dimer (29.4%, n=175). Complete case analysis and multiple imputation (5 imputations, 10 iterations) yielded comparable results, supporting a missing-at-random assumption. Patients with missing data did not differ significantly from those with complete data in terms of age, sex, or mortality status (p > 0.05 for all comparisons). Owing to the large quantity of data generated in this study, we have focused on presenting statistically significant outcomes. Non-significant results are included only when they provide meaningful context for the interpretation of the findings. No additional sensitivity analyses were performed.
3. Results
3.1. Cohort Demographic and Clinical Characteristics
Between September 1 and November 30, 2020, a total of 595 adults were admitted to the hospital with SARS-CoV-2 infection or acquired the infection during hospitalization. The sample was predominantly male (55.3%) with a mean age of 70.45 years (SD = 15.26). Most patients (96.1%) were admitted to a medical ward, with 17.6% (n=105) subsequently requiring ICU transfer. ICU admission was significantly associated with obesity (OR: 2.12, 95% CI 1.39–3.23; p < 0.001), male sex (OR: 1.78, 95% CI 1.14–2.78; p = 0.010), and mortality (OR: 3.21, 95% CI 2.05–5.02; p < 0.001) (Figure 1). No significant associations were observed for other comorbidities (Supplementary Table 1). The mean interval between SARS-CoV-2 infection diagnosis and hospital admission was 2.97 days (SD = 3.82; range, 0–22), and the mean LOS was 12.09 days (SD = 11.50; range, 1–121). Comorbidities were prevalent: hypertension (62.4%), dyslipidemia (48.7%), cardiac pathology (41.0%), type 2 diabetes (34.3%), obesity (32.9%), pulmonary (28.4%); renal (21.8%), hematologic (10.6%) and oncological (other than hematologic) (10.1%). Other comorbidities were present in 65.5% of the population. Most patients (72.8%) were symptomatic, and 78.2% required some form of oxygen supplementation. Almost a quarter of the studied sample (21.8%) did not need ventilatory support; but about half of the sample (49.2%) received oxygen therapy by cannula; 10.3% required oxygen therapy with a high-output mask, 7.2% underwent invasive mechanical ventilation; 5.9% required continuous positive airway pressure or bilevel positive airway pressure, and, finally, 5.5% received oxygen therapy through high-flow cannulas. Therapeutic interventions included remdesivir (33.9%), dexamethasone (64.7%), and enoxaparin (89.9%), predominantly in prophylactic doses (68.4%).
By November 30, 2020, 84 patients (14.1%) had died during hospitalization. Mortality increased significantly to 134 patients (22.5%) by March 2021 (120-day follow-up), representing an absolute increase of 8.4% (McNemar's test, χ2=48.02, p<0.001). The clinical severity trajectory differed significantly between patients who died during hospitalization (in 2020) and those who died post-discharge (till March 2021). Among patients who died, a significant association between the timing of death and COVID-19 severity distribution was verified (χ² (5) = 43.63, p < .001). The proportion of patients who reached the maximum score of 8 on the ordinal severity scale was significantly higher in the group that died during hospitalization (77/84, 91.7%) compared to the group that died after discharge (20/50, 40.0%).
Deceased patients were significantly older than survivors (M = 79.00, SD = 11.66 vs. M = 67.96, SD = 15.30; t (279.289) = -8.946; p < 0.001; d = -0.76). LOS did not differ significantly between groups (deceased: M = 11.82, SD = 11.57), although the interval between diagnosis and admission was longer among those who died (M = 3.14, SD = 3.77 vs. M = 2.37, SD = 3.94; t (593) = 2.074; p = 0.038; d = 0.20).
3.2. Group Comparisons
3.2.1. Mortality
Non-survivors presented with statistically significant elevations in neutrophils count, NLR, plasma levels of glucose, urea, alkaline phosphatase (ALP), lactate dehydrogenase (LDH), CRP, and D-dimer, alongside lower hemoglobin values (Table 1). Mortality rates were disproportionately higher among patients with oncological, cardiac, renal, and other comorbidities (Table 1).
| Comorbidity |
Without Comorbidity n (%) |
With Comorbidity n (%) |
N | X² | df | p-value | Φ | |
| Cardiac | Alive | 292 (63.3%) | 169 (36.7%) | 461 | 16.004 | 1 | <0.001 | 0.164 |
| Dead | 59 (44.0%) | 75 (56.0%) | 134 | |||||
| Renal | Alive | 372 (80.7%) | 89 (19.3%) | 461 | 7.752 | 1 | 0.009 | 0.114 |
| Dead | 93 (69.4%) | 41 (30.6%) | 134 | |||||
| Oncological | Alive | 426 (92.4%) | 35 (7.6%) | 461 | 14.018 | 1 | <0.001 | 0.153 |
| Dead | 109 (81.3%) | 25 (18.7%) | 134 | |||||
| Other | Alive | 169 (36.7%) | 292 (63.3%) | 461 | 4.410 | 1 | 0.036 | 0.086 |
| Dead | 36 (26.9%) | 98 (73.1%) | 134 | |||||
| Legend - N = frequencies; M = mean; SD = standard deviation; t = t-test; df = degrees of freedom; p = p-value; Cohen’s d = size effect; ALT = alanine aminotransferase; AST = aspartate transaminase; ALP = alkaline phosphatase; LDH = lactate dehydrogenase; CRP = C-reactive protein; NLR= neutrophil-to-lymphocyte ratio. X² = Chi-Squared test value; df = degrees of freedom; Φ = Phi coefficient (effect size). Significant p-values are in bold. | ||||||||
The administration of remdesivir or dexamethasone showed no significant association with mortality outcomes in univariate analysis. The clinical profile differed significantly between the cohort administered remdesivir and the counterpart. The remdesivir group was marked by a heightened inflammatory response and cellular injury, while patients in the non-remdesivir group showed significantly higher renal and hepatic impairment, suggesting treatment decisions were influenced by disease severity and comorbidities (Supplementary Table 2). Indeed, patients who received remdesivir had a significantly higher baseline disease severity on the 8-point ordinal scale. The results indicated a statistically significant difference in the distribution of severity scores between the two groups (U = 32,450, p < .001). An inspection of the mean ranks suggested that patients who received remdesivir had significantly higher (more severe) scores (Mean Rank = 342.1) compared to those who did not receive the drug (Mean Rank = 264.8). Enoxaparin was administered less frequently to deceased patients (18.8%) than survivors (71.1%) [χ² (1) = 7.652; p = 0.006; Φ = -0.113]. However, among recipients, a therapeutic dosing regimen was more frequent in the deceased group (41.7% vs. 18.1%) [χ² (1) = 27.021; p < 0.001; Φ = 0.226].
To analyze all-cause mortality (deaths up to 120 days post-discharge), we compared two groups: patients who died during hospitalization and those who died between November 2020 and March 2021 after discharge. The in-hospital mortality group showed a significantly shorter mean time from hospital admission to death in comparison with the post-discharge mortality group (M=9.86, SD=8.05 vs M=18.41, SD=13.68 days, respectively) [t (67.73) = -3.992, p <.001; Cohen's d = -0.817 (95% CI: -1.181, -0.450)]. Moreover, patients who died during hospitalization presented a lower prevalence of oncological comorbidity (13.1% vs. 28.0%) [χ² (1) = 4.588; p = 0.032; Φ = 0.185] in comparison with post-discharge mortality group.
3.2.2. Oxygen Supplementation
Patients requiring oxygen had significantly higher hemoglobin values, neutrophils count, NLR, plasma level of glucose, LDH, CRP, and ferritin, and lower ALP (Table 2). Pulmonary comorbidities, obesity, and diabetes were more prevalent in this group (Table 2). Oxygen-supplemented patients were more likely to receive remdesivir [χ² (1) = 63.833; p < 0.001; Φ = 0.328], dexamethasone [χ² (1) = 217.986; p < 0.001; Φ = 0.605], and enoxaparin [χ² (1) = 42.949; p < 0.001; Φ = 0.269].
| Comorbidity | O2 Suppl. |
Without Comorbidity n (%) |
With Comorbidity n (%) |
Total | X² | df | p-value | Φ |
| Pulmonary | No | 107 (82.3%) | 23 (17.7%) | 130 | 9.384 | 1 | 0.002 | 0.126 |
| Yes | 319 (68.6%) | 146 (31.4%) | 465 | |||||
| Obesity | No | 100 (76.9%) | 30 (23.1%) | 130 | 7.327 | 1 | 0.007 | 0.111 |
| Yes | 299 (64.3%) | 166 (35.7%) | 465 | |||||
| Diabetes | No | 95 (73.1%) | 35 (26.9%) | 130 | 4.002 | 1 | 0.045 | 0.082 |
| Yes | 296 (63.7%) | 169 (36.3%) | 465 | |||||
| Legend. N = frequencies; M = mean; SD = standard deviation; t = t-test; df = degrees of freedom; p = p-value; Cohen’s d = size effect; ALP = alkaline phosphatase; LDH = lactate dehydrogenase; CRP = C-reactive protein; NLR= neutrophil-to-lymphocyte ratio. X² = Chi-Squared test value; df = degrees of freedom; Φ = Phi coefficient (effect size). | ||||||||
3.2.3. Length of Stay (LOS)
LOS correlated negatively with hemoglobin (r = -0.118; p = 0.004) and positively with NLR (r = 0.080; p = 0.050) and platelets count (r = 0.091; p = 0.027). Hospitalization duration was longer for patients with dyslipidemia [t(592) = -2.904, p = 0.004, d = -0.238], obesity [t(281.006) = -2.240, p = 0.024, d = -0.224], renal [t(147.697) = -2.620, p < 0.001, d = -0.366], hematologic [t(65.041) = -2.595, p = 0.006, d = -0.617] and other [t(592) = -2.305, p = 0.022, d = -0.199] comorbidities. Patients receiving enoxaparin had longer stays [t (592) = -2.248, p = 0.025, d = -0.302], particularly those on a therapeutic regimen (M = 16.49, SD = 15.69) versus prophylactic (M = 11.23, SD = 10.16) [t (149.591) = -3.466, p < 0.001, d = -0.452].
LOS analysis revealed significant differences by mortality outcome (F=9.37, p<0.001). Post-hoc analysis delineated two distinct patterns: patients who died during the initial hospitalization phase had the shortest length of stay (M=9.9 days, SD=8.0), which was not significantly different from survivors (M=11.8 days, SD= 11.5; p=0.435). In contrast, patients who died by the 120-day follow-up had a markedly prolonged hospitalization (M= 18.4 days, SD= 13.7), which was significantly longer than both survivors (mean difference +6.6 days, p<0.001) and early in-hospital decedents (mean difference +8.6 days, p<0.001).
3.2.4. Symptomatology
Symptomatic patients had higher values of AST, CRP and lower concentration of total bilirubin. They were more likely to receive oxygen supplementation, dexamethasone, and enoxaparin (Supplementary Table 3).
3.3. Correlations
The pattern of correlations reinforced key clinical relationships. Mortality showed significant positive correlations with several comorbidities (cardiac, renal, oncological) and biomarkers of inflammation (CRP, NLR), cellular injury (LDH), and organ dysfunction (creatinine, urea). Notably, mortality correlated strongly with the need for oxygen supplementation (ρ = 0.360) and therapeutic enoxaparin regimen (ρ = 0.226), while correlating negatively with enoxaparin intake itself (Supplementary Table 4). Oxygen supplementation was positively correlated with inflammatory markers (CRP, NLR, ferritin) and with the intake of COVID-19 therapies (remdesivir, dexamethasone, enoxaparin) as detailed in Supplementary Table 5.
The strongest positive correlation of disease severity, as measured by the WHO ordinal scale, was with all-cause mortality (ρ = 0.510, p < 0.001, N = 595). We compared the proportion of patients who reached the maximum score of 8 on the COVID-19 ordinal severity scale between survivors and non-survivors. As expected, none of the 461 survivors had a severity score of 8. In contrast, a substantial majority of non-survivors (97/134, 72.4%) reached this maximum score. The difference in proportions was -72.4 percentage points (95% Confidence Interval [-79.4%, -64.3%] using the Agresti-Caffo method). This difference was highly statistically significant (Wald Z = -18.74, p < .001). Severity was strongly associated with markers of systemic inflammation, including CRP (ρ = 0.384, p < 0.001) and ferritin (ρ = 0.234, p < 0.001), and with cellular injury as indicated by LDH (ρ = 0.334, p < 0.001). A pattern of immune dysregulation was evident, with severity showing a strong positive correlation with NLR (ρ = 0.299, p < 0.001) and neutrophil count (ρ = 0.181, p < 0.001), and a significant negative correlation with absolute lymphocyte count (ρ = -0.267, p < 0.001). Moderate correlations were observed with hypercoagulability markers (D-dimer: ρ = 0.132, p = 0.007), hepatic involvement (aspartate transaminase (AST): ρ = 0.146, p < 0.001) and established demographic risk factors (age: ρ = 0.133, p = 0.001; weight: ρ = 0.288, p < 0.001). Creatinine showed a significant but weak positive correlation (ρ = 0.098, p = 0.017) with disease severity. Among all comorbidities analyzed, only pulmonary disease and obesity were independently associated with a higher maximum disease severity score (Figure 2).
LOS was found to be associated with hypertension (ρ = 0.107; p = 0.009), dyslipidemia (ρ = 0.162; p < 0.001), renal (ρ = 0.123; p = 0.003), hematologic (ρ = 0.136; p < 0.001) and other (ρ = 0.135; p < 0.001) comorbidities; with plasma level of urea (ρ = 0.120; p = 0.004), ventilatory supplementation (ρ = 0.253; p < 0.001), remdesivir (ρ = 0.152; p < 0.001), enoxaparin (ρ = 0.136; p < 0.001), and enoxaparin regimen (ρ = 0.224; p < 0.001).
The results of the independent samples t-tests for all comorbidities are summarized visually in Figure 2. The forest plot displays the standardized mean difference (Cohen's d) with 95% confidence intervals for each condition. As shown, only two comparisons yielded statistically significant effects: participants with pulmonary disease (Cohen's d = -0.19, 95% CI [-0.37, -0.01]) and obesity (Cohen's d = -0.22, 95% CI [-0.39, -0.05]) scored higher on the ordinal scale than their counterparts without these conditions.
3.4. Regressions
Hierarchical regression analyses (Figure 3, Supplementary Tables 5-8) identified key predictors for clinical outcomes. For mortality, the final model (R² = .362, p < .001) revealed oxygen supplementation as the strongest positive predictor (β = .563), with remdesivir as a significant negative predictor (β = -.208). The addition of biochemical markers (∆R² = .107, p < .001) to a non-significant ward-only model had previously identified AST (β = .456, p < .001) and ALT (β = -.373, p < .001) as strong predictors. For other outcomes, models explained 64.8% of the variance in oxygen supplementation (key predictors: ICU transfer, dexamethasone, enoxaparin regimen), 19.7% for length of stay (LOS) (key predictors: ICU transfer, hematological comorbidities), and 14.8% for symptoms (key predictor: oxygen supplementation).
3.5. Moderation Analysis
A positive correlation was found between LOS and oxygen supplementation invasiveness (ρ = 0.308; p < 0.001). A linear regression showed a significant moderating effect of ICU transfer status on this relationship (R² = 0.132, F (3, 590) = 29.83, p < 0.001). The interaction was significant (B = 2.68, t = 3.67, p = 0.003), indicating the positive relationship between oxygen supplementation and LOS was stronger for patients transferred to the ICU.
4. Discussion
This study provides a comprehensive analysis of risk factors associated with acute severity, ICU admission, and post-discharge mortality in a cohort of hospitalized COVID-19 patients. Our findings reveal a clear dissociation between predictors of in-hospital outcomes and those associated with late mortality, underscoring the need for a phase-specific approach to risk stratification and patient management.
The overall mortality rate in our cohort was 22.5%, with more than one-third of deaths occurring after hospital discharge. This highlights that survival to discharge does not equate to recovery, as vulnerability persists beyond the acute phase, particularly in patients with malignancy, underscoring the importance of post-acute surveillance. ICU admission was strongly associated with obesity and male sex, consistent with previous reports linking these factors to early respiratory deterioration [5,6,7]. Previous studies have demonstrated that advanced age, male sex, and obesity are consistently linked to worse in-hospital outcomes across diverse healthcare settings [5,6,7]. In contrast, post-discharge mortality was independently associated with prolonged hospital stay and the presence of malignancy, but not with ICU admission. These findings suggest that while obesity and male sex are critical for predicting acute deterioration, malignancy is a key determinant of late adverse outcomes, regardless of ICU care.
Two mortality phases were identified, each associated with distinct patient characteristics. During the acute phase, obesity and male sex were associated with ICU admission, whereas late post-discharge mortality was specifically associated with malignancy, independent of ICU admission status. Length of stay further delineated these patterns: patients who died during hospitalization had the shortest stay (9.9 days), consistent with rapid clinical deterioration, whereas patients who died post-discharge had markedly prolonged hospitalization (18.4 days), suggesting that length of stay may have prognostic value beyond the acute phase. From a clinical perspective, this dissociation highlights the need to distinguish predictors of acute respiratory failure from predictors of late adverse outcomes when planning inpatient care and post-discharge follow-up.
The substantial proportion of deaths occurring after hospital discharge (37.3% of all deaths) underscores an important gap in the current understanding of COVID-19 outcomes. A longitudinal study has demonstrated persistently elevated mortality risk among hospitalized COVID-19 patients extending into the third year after infection [24], suggesting that the late mortality observed in our cohort likely represents the early phase of a prolonged vulnerability trajectory.
As expected, the laboratory profiles differentiating survivors from non-survivors reflected a systemic inflammatory and thromboinflammatory phenotype, characterized by elevated neutrophil counts, neutrophil to lymphocyte ratio (NLR), C reactive protein (CRP), D-dimer, lactate dehydrogenase (LDH), and markers of renal dysfunction in non-survivors [15,16,17,18,25]. These biomarkers have practical utility, as CRP and D-dimer are routinely available in most hospital settings, including resource-limited environments [17,18]. The strong correlation between the WHO ordinal scale and mortality supports its continued use as a standardized prognostic tool [23,26]. Its strongest correlates, markers of inflammation (CRP, ferritin) and cellular injury (LDH), reflect the immune dysregulation that characterizes progression to organ failure [27]. The associations with elevated D-dimer and aspartate transaminase (AST) further link higher severity scores to thromboinflammatory state and hepatic involvement [5,17,28], while the weaker association with creatinine plasma levels suggests that renal dysfunction may not be a primary driver of the peak clinical severity. This biomarker specificity indicates that the WHO ordinal scale predominantly mirrors the acute hyperinflammatory and thromboinflammatory burden of hospitalized COVID-19 patients.
In line with the findings of Wajdowicz et al. (2026) [29], the need for oxygen supplementation (ventilatory support) was the strongest independent predictor of mortality in multivariable analysis. Hypoxemia therefore represents a key clinical signal of impending respiratory failure and overall disease burden, consistent with previous reports linking oxygen requirements to disease severity in hospitalized COVID-19 patients [5,28]. This observation aligns with the established inflammatory and thromboinflammatory pathophysiology of severe SARS-CoV-2 infection, characterized by endothelial injury, coagulation abnormalities, and multi-organ involvement [15,16,17].
Although cardiac, renal, and oncological comorbidities were associated with mortality in bivariate analyses, only pulmonary conditions and obesity independently predicted maximum disease severity. These findings suggest that these conditions may accelerate early pathophysiological processes, potentially through direct respiratory compromise [30] and metabolic-inflammatory dysregulation [31]. Indeed, obesity, an inflammatory disease [32], was associated with a more than two-fold increase in the odds of ICU admission, according to previous works linking obesity to hyperinflammatory responses in COVID-19 [31,33]. Clinically, this finding supports prioritizing early respiratory monitoring and timely escalation of care in hospitalized patients with obesity. The absence of independent associations for hypertension and diabetes with disease severity may reflect the widespread pharmacological management of these conditions [34].
In contrast, malignancy emerged as a key determinant of late post-discharge mortality, independent of ICU admission. Previous studies from Northern Portugal have reported increased mortality among cancer patients with SARS-CoV-2 infection [35], while pandemic-related disruptions in cancer screening and more advanced disease presentation have also been documented [36]. A recent Portuguese ICU study across six pandemic waves identified hematologic malignancy as a predictor of late ICU mortality [37] but did not capture deaths occurring after discharge. While Santos et al. [38] demonstrated that pre-ICU comorbidities collectively predict post-ICU mortality, our findings refine this observation by identifying malignancy as a specific predictor of post-discharge death. Potential mechanisms include thromboembolic complications, secondary infections, and disease progression following treatment disruption. By disaggregating comorbidities according to their role across the disease trajectory, our study addresses the need for targeted risk stratification and responds to calls for focused research on post-discharge outcomes [38].
Treatment effects in this observational cohort must be interpreted in the context of confounding by indication [39]. After adjustment for disease severity and biochemical profile, remdesivir was associated with improved survival, despite being preferentially administered to sicker patients. Enoxaparin use demonstrated a complex pattern consistent with severity-driven treatment allocation. The observed survival advantage associated with symptomatic presentation likely reflects diagnostic pathways during the study period, whereby asymptomatic infections were often detected through universal inpatient screening, identifying inherently more vulnerable patients with probable nosocomial infection [40].
Taken together, our findings demonstrate that COVID-19 mortality risk evolves across distinct temporal phases, with inflammatory and respiratory mechanisms predominating during hospitalization, while comorbidity-related vulnerability drives late post-discharge outcomes. This has important implications for clinical care and pandemic preparedness, as risk stratification models should differentiate predictors of acute deterioration from predictors of post-discharge mortality. Hospital-based surveillance alone may substantially underestimate COVID-19-related mortality, and preparedness strategies should incorporate structured, risk-based post-discharge monitoring, particularly for patients with malignancy and other conditions conferring sustained vulnerability. These findings may be especially informative in settings with low vaccination coverage or limited access to advanced therapeutics, where intrinsic determinants of disease severity and mortality remain clinically relevant.
Limitations and Future Directions
This study has several strengths, including longitudinal follow-up through 120 days after discharge, comprehensive clinical and laboratory characterization, and the use of a pre-vaccine cohort providing a baseline understanding of disease determinants unmodified by vaccine-induced immunity. Limitations include the single-center observational design, which may limit generalizability, evolving treatment protocols during the study period; and heterogeneity in circulating viral clades [41]. The study period (September–November 2020) preceded widespread vaccination and the emergence of Variants of Concern, therefore, the findings reflect the intrinsic pathogenicity of early SARS-CoV-2 lineages rather than contemporary disease patterns. The use of the maximum WHO ordinal scale score precludes analysis of baseline severity. In addition, late deaths after discharge may reflect progression of underlying comorbidities rather than direct effects of acute infection. Finally, treatment allocation was not randomized, and residual confounding by unmeasured factors such as frailty and functional status cannot be excluded and should be considered when interpreting post-discharge outcomes.
Future studies should validate these phase-specific risk profiles in multicenter and contemporary cohorts, including vaccinated patients and infections with emerging SARS-CoV-2 variants. Longer post-discharge follow-up is needed to clarify the mechanisms and duration of late mortality, particularly among patients with malignancy. Integrating measures of frailty, functional status, and post-acute biomarkers may further refine late risk prediction. Interventional studies are warranted to determine whether targeted, risk-based post-discharge follow-up can reduce late mortality.
Conclusions
This study shows that risk factors associated with acute COVID-19 severity and ICU admission differ from those associated with mortality after hospital discharge. Obesity and male sex were linked to acute deterioration requiring ICU care, whereas malignancy was associated with late post-discharge mortality, independent of ICU admission. With more than one-third of deaths occurring after discharge, these findings support a phase-specific approach to risk stratification that extends beyond hospitalization. Differentiating inpatient and post-discharge risk profiles may improve continuity of care and reduce late mortality in hospitalized patients with SARS-CoV-2 infection.
Supplementary Materials
The following supporting information can be downloaded at the website of this paper posted on Preprints.org. S1 File. STROBE Checklist. Completed STROBE checklist for cohort studies. S2 File. Supplementary Material. Supplementary Tables 1–8 containing additional analyses and Figure S1 representing the flow diagram of study participants. S3 File. Graphical Abstract. Visual summary of key findings.
Author Contributions
Conceptualization: Fernanda Leite, Ângela Leite; Methodology: Fernanda Leite; Software: Sara Ferreira, Carina Brito; Validation: Fernanda Leite, André Santos Silva; Formal analysis: Fernanda Leite, Ângela Leite; Investigation: Fernanda Leite, André Santos Silva, Sara Ferreira, Carina Brito; Resources: Fernanda Leite; Data curation: Fernanda Leite, Ângela Leite; Writing – original draft: Fernanda Leite, Ângela Leite; Writing – review & editing: Fernanda Leite, André Santos Silva, Sara Ferreira, Carina Brito, Ângela Leite; Supervision: Ângela Leite; Project administration: Fernanda Leite, Ângela Leite; Funding acquisition: N/A.
Funding
This research received no external funding.
Data Availability Statement
The datasets generated and analyzed during the current study are not publicly available due to patient privacy restrictions (anonymized data cannot fully guarantee re-identification risk). However, de-identified aggregate data and statistical code are available from the corresponding author (Fernanda Leite, fjleite@med.up.pt) upon reasonable request, subject to approval from the Institutional Review Board of Santo António University Hospital Center.
Acknowledgments
During the preparation of this manuscript, the authors used ChatGPT (OpenAI; GPT-4) for language editing and clarity improvement. All content was reviewed and approved by the authors, who take full responsibility for the manuscript.
Competing Interests
The authors declare that no competing interests exist.
Ethics Approval
This study was performed in line with the principles of the Declaration of Helsinki. Approval was granted by the Scientific Board, Ethics Committee and Data Protection Officer of Santo António University Hospital Center, Porto, Portugal, on 25 October 2021 [Reference: 2021.236 (188-DEFI/196-CE)]. The ethical committee granted a waiver of informed consent as the study involved analysis of existing, de-identified patient data, posed no more than minimal risk, and could not practically be carried out without the waiver.
References
- Zhu, N.; Zhang, D.; Wang, W.; et al. A novel coronavirus from patients with pneumonia in China, 2019. N. Engl. J. Med. 2020, 382, 727–733. [Google Scholar] [CrossRef]
- Huang, C.; Wang, Y.; Li, X.; et al. Clinical features of patients infected with 2019 novel coronavirus in Wuhan, China. Lancet 2020, 395, 497–506. [Google Scholar] [CrossRef]
- Wu, Z.; McGoogan, J.M. Characteristics of and important lessons from the coronavirus disease 2019 (COVID-19) outbreak in China. JAMA 2020, 323, 1239–1242. [Google Scholar] [CrossRef]
- World Health Organization. Global excess deaths associated with COVID-19, January 2020–December 2021; World Health Organization: Geneva, Switzerland, 2021; Available online: https://www.who.int/data/stories/global-excess-deaths-associated-with-covid-19-january-2020-december-2021 (accessed on 14 April 2026).
- Zhou, F.; Yu, T.; Du, R.; et al. Clinical course and risk factors for mortality of adult inpatients with COVID-19 in Wuhan, China: A retrospective cohort study. Lancet 2020, 395, 1054–1062. [Google Scholar] [CrossRef] [PubMed]
- Docherty, A.B.; Harrison, E.M.; Green, C.A.; et al. Features of 20,133 UK patients in hospital with COVID-19. BMJ 2020, 369, m1985. [Google Scholar] [CrossRef]
- Williamson, E.J.; Walker, A.J.; Bhaskaran, K.; et al. Factors associated with COVID-19-related death using OpenSAFELY. Nature 2020, 584, 430–436. [Google Scholar] [CrossRef] [PubMed]
- Knights, H.; Mayor, N.; Millar, K.; et al. Characteristics and outcomes of patients with COVID-19 at a district general hospital in Surrey, UK. Clin. Med. 2020, 20, e148–e153. [Google Scholar] [CrossRef]
- Knight, S.R.; Ho, A.; Pius, R.; et al. Risk stratification of patients admitted to hospital with COVID-19 using the 4C Mortality Score. BMJ 2020, 370, m3339. [Google Scholar] [CrossRef]
- Liang, W.; Liang, H.; Ou, L.; et al. Development and validation of a clinical risk score to predict critical illness in hospitalized COVID-19 patients. JAMA Intern. Med. 2020, 180, 1081–1089. [Google Scholar] [CrossRef]
- Wynants, L.; Van Calster, B.; Collins, G.S.; et al. Prediction models for diagnosis and prognosis of COVID-19 infection. BMJ 2020, 369, m1328. [Google Scholar] [CrossRef] [PubMed]
- Wolkewitz, M.; Puljak, L. Methodological challenges of analysing COVID-19 data during the pandemic. BMC Med. Res. Methodol. 2020, 20, 81. [Google Scholar] [CrossRef]
- Nalbandian, A.; Sehgal, K.; Gupta, A.; et al. Post-acute COVID-19 syndrome. Nat. Med. 2021, 27, 601–615. [Google Scholar] [CrossRef]
- Xie, Y.; Xu, E.; Bowe, B.; Al-Aly, Z. Long-term cardiovascular outcomes of COVID-19. Nat. Med. 2022, 28, 583–590. [Google Scholar] [CrossRef] [PubMed]
- Bradley, B.T.; Maioli, H.; Johnston, R.; et al. Histopathology and ultrastructural findings of fatal COVID-19 infections. Lancet 2020, 396, 320–332. [Google Scholar] [CrossRef] [PubMed]
- Wichmann, D.; Sperhake, J.P.; Lütgehetmann, M.; et al. Autopsy findings and venous thromboembolism in patients with COVID-19. Ann. Intern. Med. 2020, 173, 268–277. [Google Scholar] [CrossRef]
- Tang, N.; Li, D.; Wang, X.; Sun, Z. Abnormal coagulation parameters and poor prognosis in COVID-19. J. Thromb. Haemost. 2020, 18, 844–847. [Google Scholar] [CrossRef]
- Smilowitz, N.R.; Kunichoff, D.; Garshick, M.; et al. C-reactive protein and clinical outcomes in COVID-19. Eur. Heart J. 2021, 42, 2270–2279. [Google Scholar] [CrossRef]
- Feikin, D.R.; Higdon, M.M.; Abu-Raddad, L.J.; et al. Duration of effectiveness of vaccines against SARS-CoV-2 infection and COVID-19 disease: Results of a systematic review and meta-regression. Lancet 2022, 399, 924–944. [Google Scholar] [CrossRef] [PubMed]
- Goldberg, Y.; Mandel, M.; Bar-On, Y.M.; et al. Waning immunity after the BNT162b2 vaccine in Israel. N. Engl. J. Med. 2021, 385, e85. [Google Scholar] [CrossRef]
- World Health Organization. From Emergency Response to Long-Term COVID-19 Disease Management: Sustaining Gains Made during the COVID-19 Pandemic; World Health Organization: Geneva, Switzerland, 2023; Available online: https://www.who.int/publications/i/item/WHO-WHE-SPP-2023.1 (accessed on 10 April 2026).
- von Elm, E.; Altman, D.G.; Egger, M.; Pocock, S.J.; Gøtzsche, P.C.; Vandenbroucke, J.P.; STROBE Initiative. The Strengthening the Reporting of Observational Studies in Epidemiology (STROBE) statement: Guidelines for reporting observational studies. BMJ 2007, 335, 806–808. [Google Scholar] [CrossRef]
- WHO Working Group on the Clinical Characterisation and Management of COVID-19 Infection. A minimal common outcome measure set for COVID-19 clinical research. Lancet Infect. Dis. 2020, 20, e192–e197. [CrossRef]
- Cai, M.; Xie, Y.; Topol, E.J.; Al-Aly, Z. Three-year outcomes of post-acute sequelae of COVID-19. Nat. Med. 2024, 30, 1564–1573. [Google Scholar] [CrossRef]
- Wiwattanakul, S.; Taweerutchana, R.; Khuancharee, K.; et al. Biochemical and hematological predictors of mortality in Thai patients with COVID-19. Med. Sci. 2025, 13, 281. [Google Scholar] [CrossRef] [PubMed]
- Rubio-Rivas, M.; Corbella, X.; Guillén, N.; et al. WHO ordinal scale and inflammation risk categories in COVID-19: Comparative study of the severity scales. J. Gen. Intern. Med. 2022, 37, 1980–1987. [Google Scholar] [CrossRef] [PubMed]
- Yang, O.O. The immunopathogenesis of SARS-CoV-2 infection: Overview of lessons learned in the first 5 years. J. Immunol. 2025, 214, 1095–1104. [Google Scholar] [CrossRef]
- Wang, D.; Hu, B.; Hu, C.; et al. Clinical characteristics of 138 hospitalized patients with 2019 novel coronavirus–infected pneumonia in Wuhan, China. JAMA 2020, 323, 1061–1069. [Google Scholar] [CrossRef]
- Wajdowicz, M.; Dobrowolska, K.; Brzdęk, K.; et al. Predictors of severe outcomes in COVID-19: Evidence from real-world multicenter retrospective study (2020–2024). J. Clin. Med. 2026, 15, 1207. [Google Scholar] [CrossRef]
- Leung, J.M.; Yang, C.X.; Tam, A.; et al. ACE-2 expression in the small airway epithelia of smokers and COPD patients: Implications for COVID-19. Eur. Respir. J. 2020, 55, 2000688. [Google Scholar] [CrossRef]
- Korakas, E.; Ikonomidis, I.; Kousathana, F.; et al. Obesity and COVID-19: Immune and metabolic derangement as a possible link to adverse clinical outcomes. Am. J. Physiol. Endocrinol. Metab. 2020, 319, E105–E109. [Google Scholar] [CrossRef] [PubMed]
- Leite, F.; Ribeiro, L. Dopaminergic pathways in obesity-associated inflammation. J. Neuroimmune Pharmacol. 2020, 15, 93–113. [Google Scholar] [CrossRef]
- Simonnet, A.; Chetboun, M.; Poissy, J.; et al. High prevalence of obesity in severe acute respiratory syndrome coronavirus-2 (SARS-CoV-2) requiring invasive mechanical ventilation. Obesity 2020, 28, 1195–1199. [Google Scholar] [CrossRef]
- Jackson, S.L.; Wood, J.; Dahl, A.; et al. Association between hypertension and diabetes control and COVID-19 severity: National Patient-Centered Clinical Research Network, United States, March 2020 to February 2022. J. Am. Heart Assoc. 2023, 12, e030240. [Google Scholar] [CrossRef] [PubMed]
- Taveira-Barbosa, J.; Pereira, E.; Lopes, J.; et al. Characteristics and mortality of patients with cancer diagnosed with SARS-CoV-2 in Northern Portugal. Anticancer Res. 2025, 45, 1749–1760. [Google Scholar] [CrossRef]
- Mendes, D.; Figueiredo, D.; Alves, C.; et al. Impact of the COVID-19 pandemic on cancer screenings in Portugal. Cancer Epidemiol. 2024, 88, 102496. [Google Scholar] [CrossRef]
- von Rekowski, C.P.; Pinto, I.; Fonseca, T.A.H.; et al. Analysis of six consecutive waves of ICU-admitted COVID-19 patients: Key findings and insights from a Portuguese population. Geroscience 2025, 47, 2399–2422. [Google Scholar] [CrossRef]
- Santos, M.M.S.; Pereira, I.J.; Cuboia, N.; et al. Predictors of early and long-term mortality after ICU discharge in critically ill COVID-19 patients: A prospective cohort study. PLOS ONE 2023, 18, e0293883. [Google Scholar] [CrossRef]
- Salas, M.; Hofman, A.; Stricker, B.H. Confounding by indication: An example of variation in the use of epidemiologic terminology. Am. J. Epidemiol. 1999, 149, 981–983. [Google Scholar] [CrossRef] [PubMed]
- White, E.; Baik, M.K.; Zahir, S.F.; et al. Management and outcomes of children hospitalised with COVID-19 including incidental and nosocomial infections in Australia 2020–2023: A national surveillance study. J. Clin. Virol. 2025, 179, 105824. [Google Scholar] [CrossRef] [PubMed]
- Instituto Nacional de Saúde Doutor Ricardo Jorge. Genomic epidemiology of novel coronavirus in Portugal from March 1st 2020 up to March 31st, 2021; INSA: Lisbon, Portugal, 2021; Available online: https://insaflu.insa.pt/ncov/F-Mar2020-Mar2021 (accessed on 17 April 2026).
Figure 1.
ICU admission rates by comorbidity and patient characteristics. Bars represent the percentage of patients admitted to the intensive care unit (ICU) among those with (dark gray) and without (light gray) each condition. Error bars indicate 95% confidence intervals. Statistically significant differences (p < 0.05) between groups are denoted by asterisks (*). Obesity, male sex, and mortality at 120-day follow-up were significantly associated with higher ICU transfer rates, whereas no significant differences were observed for pulmonary, cardiac, hypertensive, dyslipidemic, diabetic, renal, hematological, oncological, or other comorbidities.

Figure 2.
Forest plot of standardized mean differences (Cohen’s d) with 95% confidence intervals comparing WHO ordinal scale maximum severity scores between participants with and without each comorbidity.
Figure 2.
Forest plot of standardized mean differences (Cohen’s d) with 95% confidence intervals comparing WHO ordinal scale maximum severity scores between participants with and without each comorbidity.

Figure 3.
Forest plot of predictors of COVID-19 clinical outcomes. The figure shows standardized regression coefficients (β) with 95% confidence intervals from final multivariable models (Supplementary Tables 5–8). Predictors are grouped by outcome (mortality, oxygen supplementation, length of stay [LOS], and symptomatology). Positive β values indicate increased risk. R² values represent the variance explained by each model. Abbreviations: LDH, lactate dehydrogenase; ALT, alanine aminotransferase; AST, aspartate aminotransferase.


Table 1.
Differences in Biochemical Markers and Comorbidities Between Outcome Groups (Alive vs. Dead).
Table 1.
Differences in Biochemical Markers and Comorbidities Between Outcome Groups (Alive vs. Dead).
| Group | N | M | SD | t | df | p | Cohen's d | |
|
Neutrophils x103/µL |
Alive | 461 | 5.39 | 3.08 | -2.189 | 178.301 | 0.030 | -0.249 |
| Dead | 132 | 6.21 | 3.98 | |||||
| NLR | Alive | 461 | 5.96 | 4.79 | -2.910 | 161.757 | 0.004 | -0.367 |
| Dead | 132 | 8.00 | 7.62 | |||||
|
Hemoglobin (g/dL) |
Alive | 461 | 12.92 | 1.90 | 2.294 | 187.495 | 0.023 | 0.249 |
| Dead | 132 | 12.42 | 2.26 | |||||
|
Urea (mg/dL) |
Alive | 461 | 51.10 | 38.18 | -4.139 | 180.664 | <0.001 | -0.249 |
| Dead | 132 | 69.95 | 48.18 | |||||
|
Glucose (mg/dL) |
Alive | 456 | 138.02 | 62.00 | -2.067 | 584 | 0.039 | -0.206 |
| Dead | 130 | 151.65 | 79.70 | |||||
| ALP (U/L) | Alive | 457 | 74.27 | 37.97 | -3.242 | 170.409 | 0.001 | -0.382 |
| Dead | 130 | 90.07 | 51.75 | |||||
| LDH (U/L) | Alive | 452 | 319.84 | 122.62 | -4.185 | 167.695 | <0.001 | -0490 |
| Dead | 126 | 401.75 | 172.40 | |||||
| CRP (mg/L) | Alive | 461 | 86.76 | 69.66 | -2.392 | 591 | 0.017 | -0.236 |
| Dead | 132 | 109.37 | 63.41 | |||||
|
D-dimer (ng/mL) |
Alive | 334 | 864.19 | 883.57 | -2.736 | 103.627 | 0.007 | -0.426 |
| Dead | 86 | 1292.03 | 1378.93 |
Table 2.
Differences in biochemical markers and comorbidities concerning the oxygen supplementation outcome.
Table 2.
Differences in biochemical markers and comorbidities concerning the oxygen supplementation outcome.
| O2 Suppl. | N | M | SD | t | df | p | Cohen's d | |
|
Hemoglobin (g/dL) |
No | 129 | 12.23 | 2.14 | -3.707 | 591 | <0.001 | -0.37 |
| Yes | 464 | 12.96 | 1.93 | |||||
| Neutrophilsx103/µL | No | 129 | 4.59 | 2.80 | -3.858 | 591 | <0.001 | -0.38 |
| Yes | 464 | 5.84 | 3.40 | |||||
| NLR | No | 129 | 3.94 | 2.79 | -8.534 | 456,985 | <0.001 | -0.58 |
| Yes | 464 | 7.10 | 5.98 | |||||
| Glucose (mg/dL) | No | 125 | 124.56 | 50.82 | -3.755 | 263,439 | <0.001 | -0.32 |
| Yes | 461 | 145.51 | 69.51 | |||||
| ALP (U/L) | No | 125 | 84.86 | 37.47 | 2.14 | 585 | 0.033 | 0.22 |
| Yes | 462 | 75.85 | 42.84 | |||||
| LDH (U/L) | No | 124 | 273.54 | 94.48 | -7.183 | 284,221 | <0.001 | -0.59 |
| Yes | 454 | 350.40 | 138.92 | |||||
| CRP (mg/L) | No | 129 | 46.99 | 50.99 | -10.048 | 273,598 | <0.001 | -0.84 |
| Yes | 464 | 102.51 | 69.38 | |||||
| Ferritin (ng/mL) | No | 58 | 972.12 | 1062.51 | -2.432 | 378 | 0.015 | -0.35 |
| Yes | 322 | 1392.73 | 1237.16 |
Disclaimer/Publisher’s Note: The statements, opinions and data contained in all publications are solely those of the individual author(s) and contributor(s) and not of MDPI and/or the editor(s). MDPI and/or the editor(s) disclaim responsibility for any injury to people or property resulting from any ideas, methods, instructions or products referred to in the content. |
© 2026 by the authors. Licensee MDPI, Basel, Switzerland. This article is an open access article distributed under the terms and conditions of the Creative Commons Attribution (CC BY) license (http://creativecommons.org/licenses/by/4.0/).
Copyright: This open access article is published under a Creative Commons CC BY 4.0 license, which permit the free download, distribution, and reuse, provided that the author and preprint are cited in any reuse.


