Submitted:
16 April 2026
Posted:
20 April 2026
You are already at the latest version
Abstract
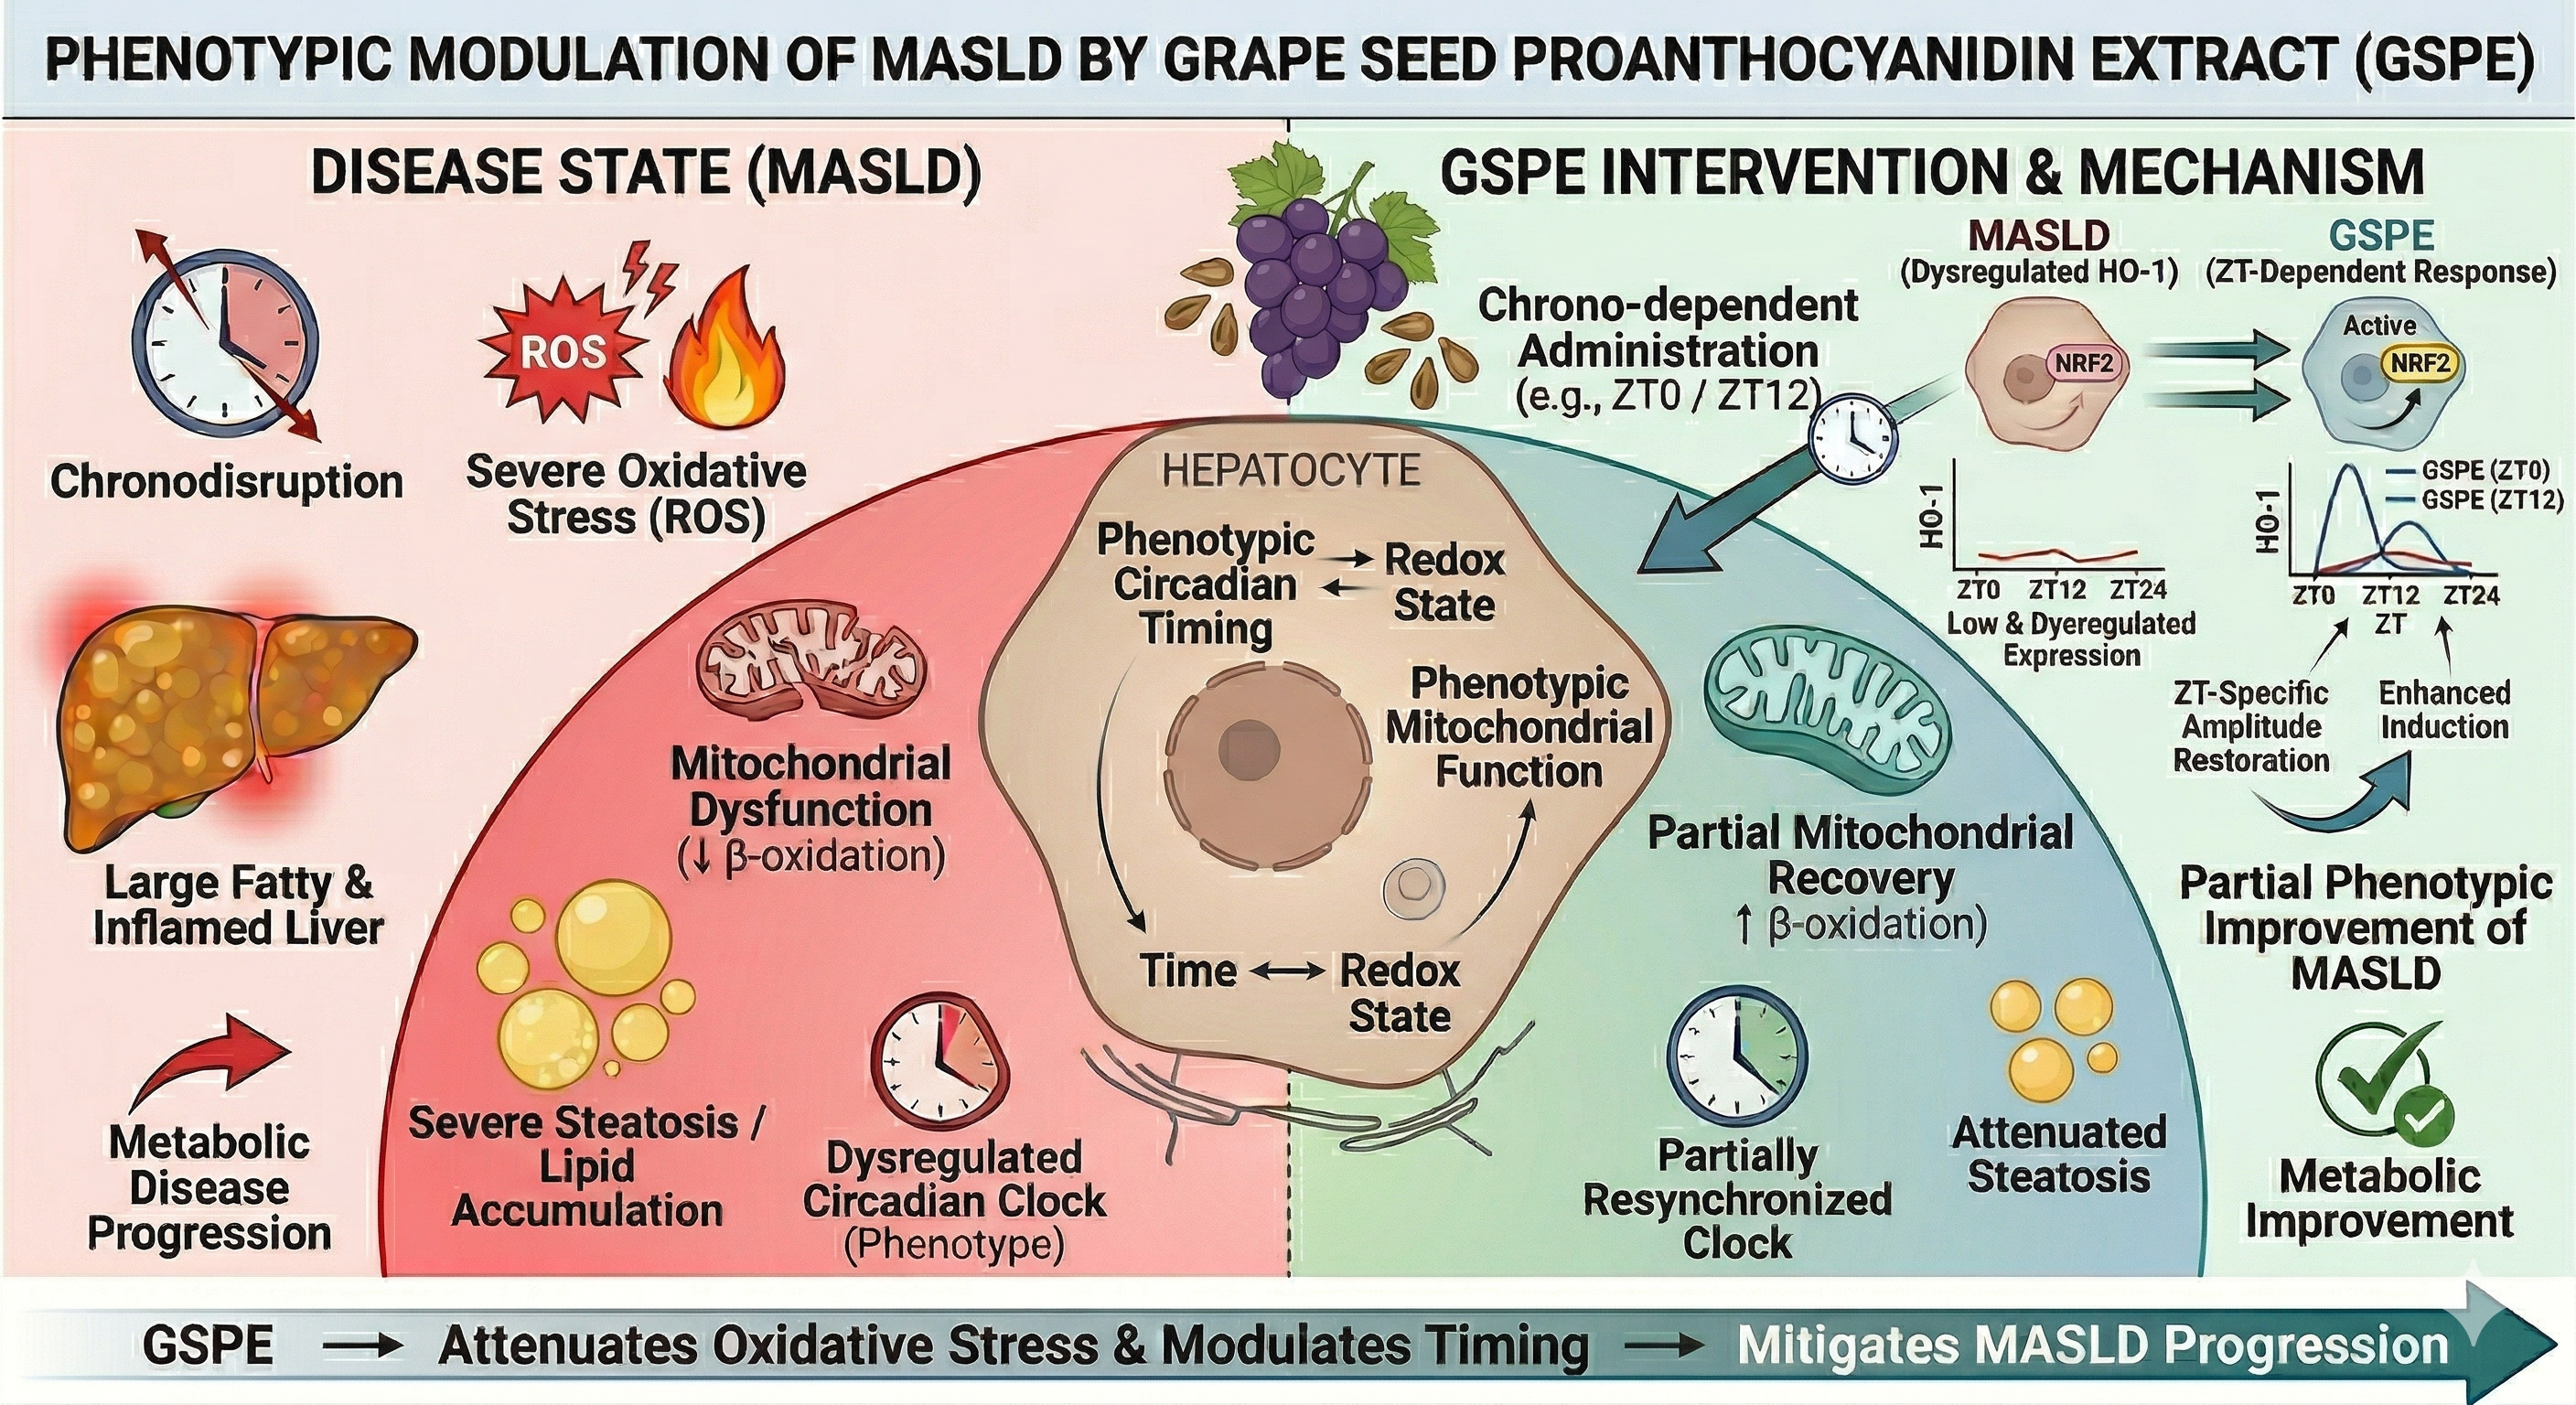
Metabolic dysfunction–associated steatotic liver disease (MASLD) is characterized by impaired metabolic flexibility, oxidative stress, and disruption of the temporal coordination of hepatic processes. Obesogenic diets contribute to this dysfunction by altering redox homeostasis and autophagy, thereby promoting lipid accumulation and cellular stress. In this study, we investigated whether grape seed proanthocyanidin extract (GSPE), a polyphenol-rich compound with antioxidant properties, can modulate these alterations in a time-dependent manner. Male Fischer 344 rats were fed a standard or cafeteria diet and supplemented with GSPE (25 mg/kg) at the onset of the active phase (ZT12). Liver samples were collected across four Zeitgeber times to evaluate circadian-related proteins, autophagy markers, antioxidant responses, lipid content, and metabolomic profiles. Cafeteria feeding disrupts hepatic homeostasis, reducing BMAL1 protein levels, altering the temporal organization of autophagy markers, and impairing redox regulation. GSPE did not restore core clock protein expression but induced a pronounced, time-specific activation of the NRF2/HO-1 axis, with a marked increase in HO-1 at the onset of the active phase. This effect was associated with a metabolic shift toward amino acid–related pathways linked to redox balance. These findings indicate that GSPE enhances antioxidant defenses in a time-dependent manner, improving redox–metabolic coordination under obesogenic conditions.
Keywords:
Metabolic Dysfunction–Associated Steatotic Liver Disease (MASLD)
; cafeteria diet
; Grape Seed Proanthocyanidin Extract (GSPE)
; circadian rhythm
; NRF2/HO-1 axis
; oxidative stress
; autophagy
; endoplasmic reticulum stress
; hepatic metabolomics
; AMPK signaling
1. Introduction
Metabolic dysfunction–associated steatotic liver disease (MASLD) is a highly prevalent metabolic disorder characterized not only by hepatic lipid accumulation but also by profound alterations in metabolic homeostasis. Increasing evidence indicates that MASLD progression is tightly linked to disruption of temporal metabolic organization, whereby nutrient overload and obesogenic diets impair the coordination of circadian, metabolic, and cellular stress-response pathways [1,2]. The hepatic circadian clock orchestrates daily oscillations in lipid metabolism, mitochondrial function, and redox balance, and its disruption contributes to metabolic inflexibility and disease progression [3]. At the molecular level, the core clock component brain and muscle ARNT-like 1 (BMAL1) plays a pivotal role in synchronizing hepatic metabolism with feeding–fasting cycles. Disruption of BMAL1 signaling has been associated with impaired metabolic flexibility, altered lipid handling, and increased susceptibility to hepatic steatosis [4,5]. Beyond metabolic regulation, circadian clocks also coordinate cellular quality-control systems, including autophagy. Hepatic autophagy exhibits circadian rhythmicity, enabling the timely removal of damaged organelles and the recycling of metabolic substrates in accordance with nutrient availability [6]. Disruption of this temporal organization, as observed under obesogenic conditions, may compromise hepatocellular homeostasis. In this regard, autophagy, and particularly lipophagy, plays a central role in hepatic lipid metabolism by facilitating the degradation of lipid droplets and supporting mitochondrial β-oxidation. Impaired autophagic flux has been consistently associated with hepatic steatosis, as defective lipophagy limits triglyceride mobilization and promotes lipid accumulation [7,8]. In parallel, endoplasmic reticulum (ER) stress contributes to metabolic dysfunction through activation of the unfolded protein response (UPR), which becomes maladaptive under chronic nutrient overload and further disrupts proteostasis and lipid metabolism [9]. Closely linked to these processes, oxidative stress represents a key pathological feature connecting nutrient overload with hepatocellular damage. Excessive substrate influx into mitochondria promotes reactive oxygen species (ROS) production, lipid peroxidation, and inflammatory signaling [10]. A central regulator of the cellular antioxidant response is nuclear factor erythroid 2–related factor 2 (NRF2), which controls the expression of cytoprotective genes, including heme oxygenase-1 (HO-1), glutathione-related enzymes, and detoxification pathways [11]. Importantly, NRF2 signaling is functionally interconnected with autophagy through the p62–KEAP1 axis, whereby p62 accumulation promotes NRF2 stabilization and activation, linking proteostasis with antioxidant defenses [12,13]. Emerging evidence further indicates that NRF2 activity is under circadian control. Core clock components such as BMAL1 regulate NRF2-dependent transcription, while NRF2-driven antioxidant responses exhibit time-of-day–dependent oscillations, establishing a bidirectional relationship between circadian timing and redox homeostasis [14,15,16]. Interestingly, circadian misalignment has been shown to impair antioxidant defenses and exacerbate metabolic liver disease, highlighting the importance of temporally coordinated stress responses [17]. In this context, natural bioactive compounds have gained increasing attention as modulators of metabolic and redox homeostasis. Polyphenols, including proanthocyanidins, exert antioxidant, anti-inflammatory, and metabolic regulatory effects through modulation of NRF2 signaling, autophagy, and mitochondrial function [18,19,20]. Grape seed proanthocyanidin extract (GSPE), in particular, has demonstrated hepatoprotective effects, including attenuation of oxidative stress and improvement of lipid metabolism [21]. Importantly, recent studies indicate that GSPE can modulate hepatic circadian regulation and antioxidant responses, suggesting a chrono-modulatory role under metabolic stress conditions [22,23,24]. Despite these advances, how obesogenic diets disrupt the temporal coordination of hepatic circadian, autophagic, and redox pathways, and whether GSPE can restore their integrated regulation, remains incompletely understood. In particular, the temporal dynamics of antioxidant responses, including NRF2 activation and HO-1 expression, have been poorly explored in MASLD. Therefore, in the present study, we investigated the impact of a cafeteria diet (CAF) on the temporal regulation of hepatic circadian signaling, autophagy, redox homeostasis, and metabolism in Fischer 344 rats, and evaluated whether GSPE supplementation can restore the coordinated rhythmicity of these pathways. Special emphasis was placed on the NRF2/HO-1 axis as a potential mechanistic link between circadian regulation and antioxidant defense, providing insight into time-dependent adaptive responses in the liver under obesogenic conditions.
2. Materials and Methods
2.1. Experimental Procedure
Forty-eight 12-week-old male Fischer 344 rats (Janvier, Barcelona, Spain) were placed in pairs at 23ºC, 55% humidity and under a standard photoperiod of 12 hours of light and 12 hours of darkness. After arrival, the rats went through a one-week adaptation period with ad libitum food and drink access, after which, they were randomly assigned to two groups depending on the diet. Thus, 16 rats were fed a standard (STD) diet, whose composition was 20% protein, 8% fat and 72% carbohydrates (Panlab, Barcelona, Spain). While 32 rats were fed a cafeteria (CAF) diet composed of 11% protein, 31% fat and 58% carbohydrates. This CAF diet includes various foods commonly consumed by humans: biscuits with cheese and pâte, bacon, ensaimada (coiled puff pastry) (Hacendado), standard chow, carrots, and milk with a concentration of 22% sugar w/v. These diets were given for 5 weeks. After the fifth week and for 4 weeks, the 16 STD-fed rats received a vehicle (VH) treatment consisting of condensed milk-vehicle diluted in water (1:5 v/v); 16 rats of the CAF group received a treatment with 25 mg/kg GSPE (Les Dérivés Résiniques et Terpéniques, Dax, France) diluted 1/5 in condensed milk, while the other 16 received the VH treatment. The GSPE phenolic profile was characterized by HPLC-ESI-MS/MS (Agilent Technologies, Palo Alto, CA, USA) as detailed in Supplementary Note 1, following the methodology previously described by Margalef et al. [25]. Furthermore, these treatments were given at the beginning of the active phase (8 p.m. or ZT12) through oral administration with a syringe. During the whole experiment body weight and food intake were registered weekly. Finally, after their last treatment dose, rats were fasted for 3h and sacrificed by decapitation at different time points (9 a.m. or ZT1, 3 p.m. or ZT7, 9 p.m. or ZT13 and 3 a.m. or ZT19), thus dividing each group, STD-VH; CAF-VH and CAF-GSPE in 4 additional sub-groups of four rats each, according to the time they were sacrificed. Livers were kept at -80ºC for further research. The totality of animal care and experimental protocols were authorized by the Ethics Review Committee for Animal Experimentation of the Universitat Rovira i Virgili (reference number 9495, 18 September 2019) and handled according to the Directive 86/609EEC of the Council of the European Union and the procedure established by the Department d’Agricultura, Ramaderia i Pesca of the Generalitat de Catalunya. Adapted from [26].
2.2. Western Blot Analysis
For each liver sample, 60 mg of tissue were homogenized in RIPA buffer (50 mM Tris-HCl, 150 mM NaCl, pH 7.4, 1% Tween 20, 0.25% Na-deoxycholate), composed of phenylmethanesulfonyl fluoride (PMSF) (Sigma-Aldrich, Madrid, Spain), phosphatase inhibitor cocktails 2 and 3 (Sigma-Aldrich, Madrid, Spain) and protease inhibitor cocktail (PIC) (Sigma-Aldrich, Madrid, Spain) with TissueLyser LT (QIAgen, Madrid, Spain). Lysates were centrifuged at 20,000 × g for 15 minutes at 4 ºC and the protein concentration was measured using a bicinchoninic acid (BCA) protein assay kit (Thermo Fisher Scientific, Madrid, Spain), according to the supplier’s protocol [27].
Equal amounts of total proteins (50 μg) were separated through electrophoresis on SDS-polyacrylamide gels and transferred to PVDF membranes using the Trans-Blot Turbo system (Bio-Rad). Membranes were then blocked with 5% skim milk (w/v) in TBS 1x Tween (TBST 1x) and incubated overnight at 4 ºC with primary antibodies (dilution 1:1000) against rabbit monoclonal antibody for LC3 (Cell Signaling, Amersham, Cytiva, Barcelona, Spain), mouse monoclonal antibody for Rev-erbα (Santa Cruz Biotechnology, Heidelberg, Germany), rabbit monoclonal antibody for Bmal1 (Cell Signaling, Amersham, Cytiva, Barcelona, Spain), rabbit monoclonal antibody for p62 (Cell Signaling, Amersham, Cytiva, Barcelona, Spain), rabbit monoclonal antibody for total AMPK (Cell Signaling, Amersham, Cytiva, Barcelona, Spain), rabbit monoclonal antibody for total pAMPK (Cell Signaling, Amersham, Cytiva, Barcelona, Spain), mouse monoclonal antibody for HO-1 (Santa Cruz Biotechnology, Heidelberg, Germany), rabbit monoclonal antibody for pNRF2 (#ab76026, Abcam; Cambridge, UK) and mouse monoclonal antibody for β-actin (Thermo Fisher Scientific, Madrid, Spain). After washing membranes were incubated with HRP-conjugated secondary antibodies (dilution 1:2,000). Immunoreactive proteins were visualized using the ECL SelectTM Western Blotting Detection Reagent (Amersham ECL Select, Cytiva, Barcelona, Spain). Digital images were obtained with a G:BOX Chemi XL1.4 (Syngene, Cambridge, UK) and densitometry analysis were evaluated with Image Lab Software version 6.1 (Bio-Rad Laboratories, Hercules, CA, USA). Finally, β-actin densitometry signal was used for normalization [27].
2.3. Gene-Expression Analysis
A fragment of liver tissue of 20-30 mg was mixed with TRIzol® reagent (Thermo Fisher, Madrid, Spain) and homogenated with a Tissue Lyser LT (Qiagen, Madrid, Spain). After centrifugation, the supernatant was collected, and total RNA was extracted including phase separation with chloroform and precipitation with isopropanol. The RNA pellet was resuspended with 60 µL of nuclease-free water (Thermo Fisher, Madrid, Spain). RNA concentration (ng/µL) and purity were determined using a NanoDrop ND-1000 spectrophotometer (Thermo Fisher, Madrid, Spain) [26,28].
To study the gene expression of the liver samples, complementary DNA was produced by reverse transcription reaction of the extracted RNA with a High-Capacity cDNA Reverse Transcription kit (Thermo Fisher, Madrid, Spain). Quantitative polymerase chain reactions (qPCR) of the obtained cDNAs were carried out in 384-well plates in a QuantStudio 5 Real-Time PCR System (Thermo Fischer, Madrid, Spain) using iTaq™ Universal SYBR® Green Supermix (Bio-Rad, Barcelona, Spain). The normalization of the studied liver genes was done with the housekeeping gene peptidylprolyl isomerase A (Ppia). The primers used for each gene were purchased from Biomers.net (Ulm, Germany), specified in Table 1. Finally, the relative expression of each gene was sorted out using the 2-ΔΔCt method, as reported by Schmittgen and Livak [29].
2.4. Metabolomic Analysis
Metabolomic analysis of the 48 rat liver samples was performed at the Centre for Omic Sciences (COS, Tarragona, Spain) using gas chromatography coupled with quadrupole time-of-flight mass spectrometry (GC-qTOF model 7200, Agilent, Santa Clara, CA, USA) as previously described [28,30]. Briefly, liver metabolomic analysis was performed using GC-qTOF following extraction with methanol:water (8:2) containing internal standards. Samples were homogenized, centrifuged, and supernatants were dried prior to derivatization (methoximation and silylation). Derivatized compounds were analyzed using the Fiehn method, with chromatographic separation on an HP5-MS column and helium as carrier gas. Detection was carried out by electron impact ionization (70 eV) in full-scan mode. Metabolites were identified by matching mass spectra and retention times with commercial standards and the Fiehn library (>1400 metabolites). Finally, metabolites were semi-quantified relative to internal standards.
2.5. Liver Lipid Profiling
Hepatic lipids were extracted using the Bligh–Dyer method [29]. Total cholesterol, triacylglycerol (TAG), and total lipid content in the liver were quantified with commercial colorimetric assay kits (QCA, Barcelona, Spain).
2.6. Statistical analysis
Statistical analyses were performed using GraphPad Prism v. 8.0.1 software (GraphPad Software, San Diego, CA, USA), considering p-value < 0.05 as statistically significant. Principal Component Analyses (PCA) were performed using MetaboAnalyst 6.0 (https://www.metaboanalyst.ca/). Additionally, circadian rhythms in gene and protein expression profiles were assessed using the Cosinor-based rhythmometry method which models oscillations and estimates rhythmic parameters. This statistical method models oscillatory patterns and provides rhythmic parameters that describe their characteristics. These include the MESOR (Midline Estimating Statistic of Rhythm), which represents the rhythm-adjusted mean; the amplitude, defined as half the difference between the peak and trough values; and the acrophase, corresponding to the time point at which the peak of the oscillation occurs. Analyses were performed with a Python version 3.7.4 script (v.2018.2.4, JetBrains s.r.o., Prague, Czech Republic) using the CosinorPy package (v.1.1) (Ljubljana, Slovenia) [31]. A circadian rhythm was assumed when the expression model fit a curve with p-value < 0.05. Adapted from [26,28].
3. Results
3.1. CAF Diet Effects on Hepatic Circadian Clock
To assess whether the CAF diet alters hepatic circadian regulation and whether GSPE supplementation can modulate these effects, the protein expression of the core clock components BMAL1 and REV-ERBα was analyzed across four Zeitgeber Times (ZTs). Regarding absolute protein abundance, BMAL1 expression was significantly reduced depending on the intervention, with the CAF-VH group showing lower levels compared to STD-VH rats specifically at ZT19 (Mann–Whitney test, p = 0.0286; Figure 1). GSPE supplementation did not significantly reverse this CAF-induced reduction, although a trend toward partial recovery was observed. In contrast, REV-ERBα protein levels were similar across all diet-treatment groups, showing no statistically significant differences at any ZT (Figure 1).
Beyond absolute protein levels, circadian rhythm analysis confirmed that the CAF diet severely disrupted the temporal organization of these core clock components. While BMAL1 protein lost its rhythmic expression pattern under obesogenic conditions (Table S3), GSPE supplementation failed to fully restore its global oscillatory parameters, showing only a significant amplitude and a shift in acrophase without reaching overall rhythmicity (Supplementary Tables S2 and S3). Similarly, REV-ERBα lacked robust circadian rhythmicity across all experimental groups and its temporal profile remained largely unaffected by either diet or treatment. The detailed statistical parameters for these rhythmic oscillations are provided in Supplementary Note 1.
In summary, these findings indicate that obesogenic feeding is associated with a marked alteration of the central hepatic clock, reflected by reduced BMAL1 protein levels and a disruption of its temporal organization. GSPE supplementation did not fully restore these alterations, suggesting a limited impact on core clock components. This observation provides a framework for interpreting its effects at other regulatory levels, supporting the possibility that GSPE may act through downstream pathways to modulate metabolic and redox responses under obesogenic conditions.
3.2. Effect of the CAF Diet and GSPE Supplementation on the Circadian Regulation of Hepatic Autophagy
To investigate the impact of the CAF diet on hepatic autophagy and the potential modulatory effects of GSPE supplementation, the expression of key autophagic markers, LC3 and p62, at both protein and transcript levels was analyzed. Regarding absolute protein content, no statistically significant differences were observed in the LC3-II/I ratio or p62 protein levels across the diet-treatment groups at any specific ZT according to the Mann–Whitney test (Figure 2).
Despite the lack of significant changes in absolute total protein levels, circadian rhythm analysis revealed that CAF feeding disrupted the temporal rhythmic organization of these key autophagic markers. The LC3-II/I ratio displayed a tendency toward circadian rhythmicity in STD-VH rats (p = 0.050), whereas both CAF-VH and CAF-GSPE groups were completely arrhythmic (p = 0.881 and p = 0.650, respectively). In STD-VH rats, the ratio peaked at ZT4, while in both CAF-fed groups, the peak was shifted to ZT22. For p62, while STD-VH and CAF-VH groups lacked statistically significant rhythmicity (p = 0.461 and p = 0.470, respectively), GSPE supplementation implemented a significant diurnal rhythm in CAF-GSPE livers (p = 0.0146). Peak p62 levels occurred at ZT10 in STD-VH, ZT14 in CAF-VH, and ZT2 in CAF-GSPE livers.
Similarly, at the transcriptional level, Lc3 expression followed a circadian rhythm in STD-VH rats (p = 0.005) but was completely arrhythmic in CAF-VH and CAF-GSPE rats (p = 0.333 and p = 0.110, respectively). Regarding p62, gene expression was significantly downregulated in CAF-VH livers compared to STD-VH specifically at ZT1 (p = 0.0286; Figure 3). Across other time points, p62 transcript levels remained largely unchanged, and GSPE treatment did not induce significant absolute effects. However, circadian analysis of p62 suggested a tendency toward rhythmicity in STD-VH and CAF-GSPE livers (p = 0.077 and p = 0.098, respectively), whereas CAF-VH livers were entirely arrhythmic (p = 0.566). Although GSPE supplementation partially restored specific oscillatory features, recovering significant amplitude and acrophase for p62 and Lc3, several rhythmic parameters remained decoupled from the standard physiological state. Furthermore, Ulk1 gene expression tended to be lower in CAF-VH livers at ZT1 compared to STD-VH (p = 0.0571, Mann–Whitney test), while GSPE supplementation did not significantly alter Ulk1 transcript levels relative to CAF-VH (Figure 3). The detailed statistical parameters for these rhythmic oscillations are provided in Supplementary Note 3.
Overall, the CAF diet was associated with a disruption of the temporal regulation of key autophagy-related markers at both protein and transcript levels. GSPE supplementation partially restored selected oscillatory features, particularly for p62 and LC3, although several rhythmic parameters remained altered compared to STD-VH animals. These observations suggest that obesogenic feeding impairs the temporal coordination of hepatic autophagy, while GSPE may contribute to a partial reorganization of these dynamics. Rather than fully re-establishing physiological rhythmicity, GSPE appears to modulate specific aspects of autophagic regulation, potentially improving the alignment between cellular quality-control processes and metabolic demands under obesogenic conditions.
3.3. CAF Diet Effects on Hepatic Antioxidant Responses (NRF2/HO-1 Axis)
To evaluate whether CAF feeding disrupts hepatic redox regulation and whether GSPE supplementation can modulate these effects, the protein expression of phosphorylated NRF2 (pNRF2) and its downstream target, heme oxygenase-1 (HO-1), was analyzed across four Zeitgeber times (ZTs). Consequently, regarding absolute protein levels, pNRF2 showed a general qualitative increase at ZT13 across all experimental groups; however, no statistically significant differences were observed between diet or treatment conditions (Figure 4A). In contrast, HO-1 protein expression displayed a strong differential response depending on the intervention. Obesogenic feeding in CAF-VH rats altered HO-1 levels compared to STD-VH animals, indicating an impaired antioxidant capacity under metabolic stress. Notably, GSPE supplementation effectively counteracted this impairment by enhancing HO-1 protein expression. This potentiation of antioxidant defenses was particularly pronounced and targeted at ZT13, where HO-1 levels were significantly higher than those observed in untreated CAF-VH rats (Mann–Whitney test, p = 0.0288; Figure 4B).
To further characterize this time-dependent response, a comprehensive circadian rhythm analysis was performed (Supplementary Note 4 and Tables S8–S9). While pNRF2 lacked statistical 24-h rhythmicity across all experimental groups, HO-1 exhibited a significant physiological circadian rhythm in healthy rats (p = 0.010) that was completely abolished by the CAF diet. Importantly, rather than fully restoring the baseline 24-h oscillation, GSPE supplementation induced a highly targeted temporal pattern. It drove a significant amplitude and a distinct acrophase peaking closely to ZT13 (p < 0.001), confirming that the extract exerts a time-specific, chrono-pharmacological enhancement of antioxidant defenses exactly at the onset of the active phase.
3.4. CAF Diet and GSPE Effects on AMPK Activation
Given the central role of AMPK as a master regulator of cellular energy homeostasis and an upstream initiator of autophagy, we evaluated its activation status by measuring the phosphorylated-to-total AMPK (pAMPK/AMPK) ratio across the 24-h cycle (Figure 5). Regarding absolute activation levels, a qualitative dampening of AMPK phosphorylation was observed in the CAF-VH group relative to both healthy controls (STD-VH) and GSPE-treated animals. However, these variations remained modest and did not reach statistical significance at any specific Zeitgeber Time (ZT). Furthermore, circadian rhythm analysis revealed that AMPK activation did not exhibit a statistically robust 24-h oscillatory pattern in any of the experimental conditions (p = 0.692 for STD-VH, p = 0.193 for CAF-VH, and p = 0.529 for CAF-GSPE). Although peak activation ratios were observed at ZT2 in STD-VH, ZT7 in CAF-VH, and ZT6 in CAF-GSPE rats, the high inter-individual variability prevented the detection of a statistically significant rhythmic pattern.
3.5. CAF Diet and GSPE Effects on ER-Stress Related Genes
To evaluate whether the observed metabolic and autophagic disruptions were associated with a global induction of Endoplasmic Reticulum (ER) stress, the transcript levels of key Unfolded Protein Response (UPR) mediators, Chop and Atf6, were analyzed. Interestingly, the absolute expression levels of both markers remained largely stable across the 24-h cycle in all experimental conditions. No statistically significant differences in Chop or Atf6 expression were observed between healthy controls (STD-VH) and CAF-fed animals, nor between the untreated and GSPE-supplemented CAF groups at any specific Zeitgeber Time (Figure 6).
In this regard, the absence of a pronounced diet-induced upregulation in these classical ER-stress genes could be considered as a highly informative finding, because it could suggest that the circadian dysregulation and autophagic impairment driven by the obesogenic diet in this model are not the secondary consequence of a massive, generalized UPR overload. Furthermore, it likely demonstrates that the chrono-pharmacological rescue exerted by GSPE, particularly the targeted enhancement of the HO-1 antioxidant defense, operates through highly specific redox and metabolic pathways, rather than through a broad modulation of the ER-stress response
To further explore potential temporal modulations within the UPR pathway, a detailed circadian rhythm analysis was conducted (Supplementary Note 5 and Tables S10–S11). Consistent with the stable absolute expression levels, robust physiological 24-h rhythmicity for these ER-stress markers was largely absent in both control and CAF-fed animals. While GSPE supplementation induced minor temporal realignments-such as establishing a significant diurnal rhythm for Atf6 (p = 0.049)-neither the obesogenic diet nor the extract provoked major disruptions or global restorations in the rhythmic parameters of this pathway. These chronobiological data reinforce the concept that the metabolic benefits of GSPE are highly targeted. By effectively bypassing the generalized ER-stress machinery, GSPE acts directly on specific downstream antioxidant and autophagic networks to counteract obesogenic damage
3.6. Lipid Liver Profile
A clear CAF effect was observed in the hepatic triglyceride’s levels, cholesterol and total lipids, which were significantly higher in CAF-fed rats compared with those on the standard diet (p = 0.0286). In addition, GSPE supplementation reduced triglycerides (TAG) content in comparison with the CAF group (p = 0.0286) (Table 2). Total cholesterol was also significantly increased in CAF-fed animals compared with STD-fed rats. In contrast, total liver lipids content showed no significant differences among groups.
3.7. Liver Metabolomics Profile
In order to investigate the impact of dietary challenge and GSPE supplementation on hepatic metabolism, we conducted a comprehensive metabolomic analysis and multivariate statistical analysis. This analysis identified and quantified 66 metabolites across all experimental groups.
3.7.1. Global Metabolic Structure and Circadian Organization.
Principal component analysis (PCA) revealed differences in liver metabolite profiles between ZTs in all our diet/treatment groups. Permutational multivariate analysis of variance (PERMANOVA) confirmed significant temporal separation in STD-VH (p = 0.003) and CAF-GSPE (p = 0.021) groups, whereas CAF-fed animals showed a non-significant trend toward clustering (p = 0.066).
Partial Least Squares Discriminant Analysis (PLS-DA) further illustrated these differences (Figure 5). In STD-fed animals, samples clustered clearly according to circadian time (ZT1, ZT7, ZT13, ZT19), reflecting a preserved daily oscillatory organization (Figure 5A). In contrast, CAF feeding resulted in a marked overlap between time points and a loss of distinct temporal clustering (Figure 5B). Notably, GSPE supplementation improved the separation of metabolic profiles by ZT in CAF-fed rats, indicating a partial restoration of the temporal metabolomic structure (Figure 5C).
3.7.2. Identification of Discriminant Metabolites.
PLS-DA identified 18 metabolites with variable importance in projection (VIP) scores ≥ 1.0, indicating major contribution to group separation (Table 11). These metabolites were mainly related to amino acid, the tricarboxylic acid (TCA) cycle, glucose, and lipid metabolism. Among them, glutamine, pyruvic acid and cholesterol showed the highest VIP values in STD-VH, CAF-VH and CAF-GSPE groups, respectively, suggesting strong discriminant power between groups. Table 3 highlights the ranking of metabolites according to VIP scores.
3.7.3. Metabolic Pathway Representation
Discriminant metabolites belonged predominantly to amino acid metabolism (glutamine, serine, ornithine, aspartate, alanine, glutamate, taurine), TCA cycle (α-ketoglutarate, malate, citrate, succinate), glucose metabolism (glucose-6-phosphate, pyruvate, lactate), and lipid metabolism (glycerol-1-phosphate, 3-hydroxybutyric acid, cholesterol), together with xylonic acid (Table 13). Finally, KEGG pathway enrichment analysis, Figure 6 and Table S12, was performed to identify metabolic pathways significantly represented within the metabolite sets associated with each experimental condition. Pathways with a false discovery rate (FDR) < 0.05 were considered statistically significant. In animals fed a standard diet (STD) enrichment analysis revealed a metabolic profile characterized by coordinated activity of amino acid metabolism and central carbon metabolism pathways. The most significantly enriched pathway was arginine biosynthesis (4 hits; FDR = 4.5 × 10⁻⁵), followed by alanine. aspartate and glutamate metabolism (4 hits; FDR = 4.4 × 10⁻⁴) and glyoxylate and dicarboxylate metabolism (4 hits; FDR = 5.1 × 10⁻⁴). Additional significantly enriched pathways included D-amino acid metabolism (3 hits; FDR = 1.0 × 10⁻³). the citrate cycle (TCA cycle) (3 hits; FDR = 2.5 × 10⁻³). pyruvate metabolism (3 hits; FDR = 2.8 × 10⁻³), and glycolysis/gluconeogenesis (3 hits; FDR = 3.2 × 10⁻³). Together, these pathways indicate that under physiological conditions the hepatic metabolite profile reflects a balanced integration of amino acid metabolism and mitochondrial energy pathways.
In contrast, CAF-fed animals displayed a markedly different enrichment pattern dominated by pathways related to central carbon metabolism. The most significantly enriched pathway was the citrate cycle (TCA cycle) (5 hits; FDR = 2.29 × 10⁻⁶), followed by alanine, aspartate and glutamate metabolism (5 hits; FDR = 7.12 × 10⁻⁶). Additional enriched pathways included pyruvate metabolism (3 hits; FDR = 5.55 × 10⁻³), glycolysis/gluconeogenesis (3 hits; FDR = 5.55 × 10⁻³), and glyoxylate and dicarboxylate metabolism (3 hits; FDR = 1.06 × 10⁻²). Butanoate metabolism was also significantly enriched (2 hits; FDR = 4.25 × 10⁻²). Overall, CAF feeding was therefore associated with a metabolomic profile characterized by strong enrichment of glycolysis, pyruvate metabolism and mitochondrial TCA cycle pathways, suggesting increased metabolic flux through central carbon metabolism.
In animals receiving GSPE supplementation, enrichment analysis revealed a metabolic profile distinct from that observed in CAF-fed animals and dominated primarily by pathways related to amino acid metabolism and nitrogen handling. The most significantly enriched pathway was arginine biosynthesis (5 hits; FDR = 5.95 × 10⁻⁷), followed by alanine, aspartate and glutamate metabolism (5 hits; FDR = 1.41 × 10⁻⁵). Other significantly enriched pathways included glyoxylate and dicarboxylate metabolism (4 hits; FDR = 8.44 × 10⁻⁴), D-amino acid metabolism (3 hits; FDR = 1.46 × 10⁻³), the citrate cycle (TCA cycle) (3 hits; FDR = 3.58 × 10⁻³), and nitrogen metabolism (2 hits; FDR = 7.79 × 10⁻³). Additional enriched pathways comprised arginine and proline metabolism, butanoate metabolism, and histidine metabolism (FDR < 0.05).
Comparison of enrichment profiles across experimental groups revealed clear metabolic differences between dietary conditions. While STD animals displayed enrichment of both amino acid metabolism and central carbon pathways, CAF feeding resulted in a pronounced enrichment of glycolysis, pyruvate metabolism and TCA cycle pathways, indicating a shift toward increased substrate flux through central energy metabolism. In contrast, GSPE supplementation shifted the enrichment landscape toward pathways associated with amino acid metabolism and nitrogen handling, including arginine biosynthesis and alanine–aspartate–glutamate metabolism. Notably, several pathways linked to cellular redox and nitrogen metabolism were preferentially represented in GSPE-treated animals. In total, seven pathways were significantly enriched in STD animals, six in CAF animals, and nine in GSPE-treated animals (FDR < 0.05).
Taken together, these findings indicate that CAF feeding promotes a metabolic profile dominated by central carbon metabolism and mitochondrial energy pathways, whereas GSPE supplementation is associated with enrichment of pathways related to amino acid metabolism, nitrogen handling and cellular stress adaptation. These metabolomic signatures provide a metabolic framework consistent with the biochemical and molecular alterations observed in the liver, including changes in antioxidant defenses and stress-response pathways. In particular, the enrichment of amino acid and redox-related metabolic pathways in GSPE-treated animals may contribute to the restoration of hepatic redox homeostasis observed in parallel analyses of antioxidant signaling.
4. Discussion
Metabolic dysfunction-associated steatotic liver disease (MASLD) is increasingly recognized not merely as a disorder of lipid accumulation, but as a systemic disruption of hepatic metabolic homeostasis involving redox imbalance, impaired autophagy, and altered temporal coordination of metabolic processes [1,2]. Recent evidence further supports the notion that obesogenic environments destabilize peripheral circadian oscillators and uncouple metabolic fluxes from physiological daily rhythms, thereby promoting metabolic inflexibility and disease progression [2,3,31]. In line with this, our data indicate that cafeteria (CAF) feeding is associated with a marked disruption of hepatic temporal organization, supporting the concept of chrono-metabolic misalignment under chronic nutrient overload.
At the mechanistic level, this disruption appears to involve alterations at the core molecular clock. BMAL1 plays a central role in coordinating hepatic nutrient utilization with feeding–fasting cycles, mitochondrial function, and redox homeostasis [4,32]. Reduced BMAL1 expression, as observed in VH-CAF-fed rats, has been associated with mitochondrial dysfunction, altered lipid handling, and increased susceptibility to steatosis [32]. This alteration may contribute to downstream disturbances in cellular quality-control systems, particularly autophagy, which is tightly regulated in a time-dependent manner to maintain metabolic balance [33]. Consistent with this, the loss of rhythmicity in LC3 and p62 observed here aligns with previous reports linking obesogenic diets to impaired lipophagy and defective lipid turnover [7,34].
Functionally, these alterations are associated with a metabolic phenotype characterized by accumulation of glycolytic and tricarboxylic acid (TCA) cycle intermediates, suggestive of mitochondrial overload and reduced oxidative capacity [35]. Under these conditions, p62 accumulation would be expected to activate NRF2 through KEAP1 sequestration [12,36], thereby promoting an adaptive antioxidant response. However, the reduced HO-1 expression observed in CAF-fed animals suggests that this compensatory mechanism is impaired, consistent with reports describing NRF2 dysfunction and redox imbalance in chronic metabolic stress [37].
In our study, GSPE contributed to a partial reorganization of these dynamics. Rather than fully re-establishing physiological rhythmicity, GSPE appears to act at downstream metabolic and redox levels, potentially improving the alignment between cellular quality-control processes and metabolic demands under obesogenic conditions. Additionally, GSPE appears to modulate downstream metabolic and redox pathways. Interestingly, the absence of robust diet- or treatment-induced changes in global AMPK activation suggests that the temporal alterations observed in autophagic markers, as well as the effects associated with GSPE, may occur independently of major shifts in this energy sensor. Consequently, GSPE may exert its effects through mechanisms that are not primarily driven by AMPK, but rather through downstream modulation of autophagic and redox pathways under obesogenic conditions.
Importantly, GSPE induced a selective and time-dependent increase in HO-1 expression, particularly at the onset of the active phase. This finding indicates that GSPE counteracts obesogenic-induced oxidative stress not through a constitutive upregulation of the NRF2/HO-1 axis, but through a temporally restricted reinforcement of antioxidant defenses. Such time-specific activation suggests that GSPE enhances redox capacity in a context-dependent manner, aligning antioxidant responses with periods of increased metabolic demand, even in the absence of a full restoration of upstream circadian regulators.
This mechanistic interpretation is further supported by the metabolomic profile observed in GSPE-treated animals. CAF feeding promotes a metabolic phenotype dominated by central carbon metabolism and mitochondrial energy pathways, whereas GSPE supplementation is associated with enrichment of pathways related to amino acid metabolism, nitrogen handling and cellular stress adaptation. This is supported by the observed shift toward amino acid-related metabolic pathways, including glutamine, taurine, and ornithine metabolism, which are known to support glutathione synthesis, mitochondrial function, and redox buffering capacity [21,34,38,39]. These metabolomic signatures provide a metabolic framework consistent with the biochemical and molecular alterations observed in the liver, including changes in antioxidant defenses and stress-response pathways. In particular, the enrichment of amino acid and redox-related metabolic pathways in GSPE-treated animals may contribute to the restoration of hepatic redox homeostasis observed in parallel analyses of antioxidant signaling.
The temporal specificity in GSPE-induced responses is consistent with the emerging concept of polyphenols as modulators of circadian and metabolic pathways, often referred to as “chrononutrients” [40,41]. From a translational perspective, these findings reinforce the importance of timing in nutritional and pharmacological interventions. Aligning bioactive compound administration with circadian phases of metabolic vulnerability may enhance therapeutic efficacy in MASLD [42,43].
Despite limitations related to the use of an animal model and indirect assessment of NRF2 activation, this study provides a framework for future investigations into chrono-nutrition strategies and time-dependent modulation of redox pathways. In conclusion, CAF feeding is associated with a disruption of hepatic chrono-metabolic organization, while GSPE supplementation appears to partially restore redox–metabolic coordination through time-dependent modulation of antioxidant defenses. Rather than acting as a global circadian synchronizer, GSPE may function as a chrono-selective modulator, enhancing specific antioxidant responses, particularly HO-1, at physiologically relevant time windows.
Supplementary Materials
The following supporting information can be downloaded at the website of this paper posted on Preprints.org, Supplementary Note 1: detailed circadian rhythm analysis for BMAL1 and REV-ERBα. Supplementary Note 2: Detailed Circadian Rhythm Analysis for Autophagy-Related Proteins and Genes. Supplementary Note 3: detailed circadian rhythm analysis for the NRF2/HO-1 antioxidant axis. Supplementary Note 4: detailed circadian rhythm analysis for ER-Stress related genes. Table S11. KEGG pathway enrichment analysis based on VIP scores across the experimental groups (STD-VH, CAF-VH, and CAF+GSPE).
Author Contributions
Conceptualization, E.C. and M.M.; methodology, M.Z-U., A.G-G., J.C., J.R.S.-R., J.M.d.B., ; software, J.R.S.-R., and J.M.d.B.; validation, E.C. and M.M.; formal analysis, E.C. and M.M.; investigation, E.C. and M.M.; resources, E.C. and M.M.; data curation, M.Z-U. and A.G-G.; writing—original draft preparation, M.Z-U., E.C. and M.M.; writing—review and editing, M.Z-U., E.C. and M.M.; visualization, J.R.S.-R., J.M.d.B., E.C. and M.M.; supervision, E.C. and M.M.; project administration, E.C. and M.M.,.; funding acquisition, E.C. and M.M.,. All authors have read and agreed to the published version of the manuscript.
Funding
This project was funded by the Spanish Ministry of Science and Innovation MICIU/AEI/10.13039/501100011033 by FEDER, UE (Grant number: PID2023-150028OB-I00). M.Z.U. was the recipient of a grant for the hiring of predoctoral research staff from Universitat Rovira i Virgili-Martí i Franquès (2023PMF-PIPF-38). E.C. and M.M are Serra Húnter Fellows.
Institutional Review Board Statement
All animal care and experimental protocols involving animals were approved by the Ethics Review Committee for Animal Experimentation of the Universitat Rovira i Virgili (reference number 9495, 18 September 2019) and were carried out in accordance with Directive 86/609EEC of the Council of the European Union and the procedure established by the Departament d’Agricultura, Ramaderia i Pesca of the Generalitat de Catalunya.
Informed Consent Statement
Not applicable.
Data Availability Statement
The data presented in this study are available upon request from the corresponding author. The data is not publicly available due to the lack of a platform on which to publish them.
Acknowledgments
The authors thank Niurka Llópiz and Rosa Pastor (Tarragona) for their valuable technical assistance. The authors also used ChatGPT (GPT-5, OpenAI) to support language editing and improve the clarity of the manuscript. All AI-generated content was carefully reviewed and revised by the authors, who take full responsibility for the final version of the article.
Conflicts of Interest
The authors declare no conflict of interest. The funders had no role in the design of the study; in the collection, analyses, or interpretation of data; in the writing of the manuscript; or in the decision to publish the results.
Abbreviations
The following abbreviations are used in this manuscript:
| α-KG | Alpha-ketoglutaric acid |
| AMPK | AMP-activated protein kinase |
| AP-1 | Activator protein 1 |
| ARNT | Aryl hydrocarbon receptor nuclear translocator |
| Atf6 | Activating transcription factor 6 |
| BCA | Bicinchoninic acid |
| BMAL1 | Brain and muscle ARNT-like 1 |
| CAF | Cafeteria diet |
| cDNA | Complementary DNA |
| Chop | C/EBP homologous protein |
| CLOCK | Circadian locomotor output cycles kaput |
| COS | Centre for Omic Sciences |
| CRY | Cryptochrome |
| ECL | Enhanced chemiluminescence |
| ER | Endoplasmic reticulum |
| FDR | False discovery rate |
| FOXO | Forkhead box class O |
| GC-qTOF | Gas chromatography coupled with quadrupole time-of-flight mass spectrometry |
| Grp78 | Glucose-regulated protein 78 |
| GSPE | Grape seed proanthocyanidin extract |
| HO-1 | Heme Oxygenase-1 |
| KEAP1 | Kelch-like ECH-associated protein 1 |
| LC3 | Microtubule-associated protein 1A/1B-light chain 3 |
| LC3-I | Cytosolic form of LC3 |
| LC3-II | Lipidated form of LC3 |
| MASH | Metabolic dysfunction-associated steatohepatitis |
| MASLD | Metabolic dysfunction-associated steatotic liver disease |
| MESOR | Midline estimating statistic of rhythm |
| mTORC1 | Mechanistic target of rapamycin complex 1 |
| NAFLD | Non-alcoholic fatty liver disease |
| NR1D1 | Nuclear receptor subfamily 1 group D member 1 |
| NRF2 | Nuclear factor erythroid 2–related factor 2 |
| p-NRF2 | Phosphorylated Nuclear Factor Erythroid 2-Related Factor 2 |
| PCA | Principal component analysis |
| PER | Period protein |
| PERMANOVA | Permutational multivariate analysis of variance |
| PIC | Protease inhibitor cocktail |
| PLS-DA | Partial least squares discriminant analysis |
| PMSF | Phenylmethanesulfonyl fluoride |
| Ppia | Peptidylprolyl isomerase A |
| p-62 | Ubiquitin-binding protein p62 |
| PVDF | Polyvinylidene difluoride |
| qPCR | Quantitative polymerase chain reaction |
| REV-ERBα | Nuclear receptor subfamily 1 group D member 1 |
| RIPA | Radioimmunoprecipitation assay buffer |
| ROR | Retinoic acid-related orphan receptor |
| ROS | Reactive oxygen species. |
| RT-qPCR | Reverse transcription quantitative polymerase chain reaction |
| SEM | Standard error of the mean |
| SDS | Sodium dodecyl sulfate |
| SQSTM1 | Sequestosome 1 |
| STD | Standard diet |
| TAG | Triacylglycerol |
| TBST | Tris-buffered saline with Tween 20 |
| TCA cycle | Tricarboxylic acid cycle |
| UPR | Unfolded protein response |
| Ulk1 | Unc-51 like autophagy activating kinase 1 |
| VH | Vehicle |
| VIP | Variable importance in projection |
| ZT | Zeitgeber time |
References
- Eslam, M.; Newsome, P.N.; Sarin, S.K.; Anstee, Q.M.; Targher, G.; Romero-Gomez, M.; Zelber-Sagi, S.; Wai-Sun Wong, V.; Dufour, J.F.; Schattenberg, J.M.; et al. A New Definition for Metabolic Dysfunction-Associated Fatty Liver Disease: An International Expert Consensus Statement. J. Hepatol. 2020, 73, 202–209. [Google Scholar] [CrossRef] [PubMed]
- Rinella, M.E.; Lazarus, J. V.; Ratziu, V.; Francque, S.M.; Sanyal, A.J.; Kanwal, F.; Romero, D.; Abdelmalek, M.F.; Anstee, Q.M.; Arab, J.P.; et al. A Multisociety Delphi Consensus Statement on New Fatty Liver Disease Nomenclature. Hepatology 2023, 78, 1966–1986. [Google Scholar] [CrossRef]
- Reinke, H.; Asher, G. Crosstalk between Metabolism and Circadian Clocks. Nat. Rev. Mol. Cell Biol. 2019, 20, 227–241. [Google Scholar] [CrossRef]
- Rudic, R.D.; McNamara, P.; Curtis, A.M.; Boston, R.C.; Panda, S.; Hogenesch, J.B.; FitzGerald, G.A. BMAL1 and CLOCK, Two Essential Components of the Circadian Clock, Are Involved in Glucose Homeostasis. PLoS Biol. 2004, 2, e377. [Google Scholar] [CrossRef]
- Shi, D.; Chen, J.; Wang, J.; Yao, J.; Huang, Y.; Zhang, G.; Bao, Z. Circadian Clock Genes in the Metabolism of Non-Alcoholic Fatty Liver Disease. Front. Physiol. 2019, 10, 423. [Google Scholar] [CrossRef]
- Bai, P.; Cantó, C.; Oudart, H.; Brunyánszki, A.; Cen, Y.; Thomas, C.; Yamamoto, H.; Huber, A.; Kiss, B.; Houtkooper, R.H.; et al. PARP-1 Inhibition Increases Mitochondrial Metabolism through SIRT1 Activation. Cell Metab. 2011, 13, 461–468. [Google Scholar] [CrossRef]
- Singh, R.; Kaushik, S.; Wang, Y.; Xiang, Y.; Novak, I.; Komatsu, M.; Tanaka, K.; Cuervo, A.M.; Czaja, M.J. Autophagy Regulates Lipid Metabolism. Nature 2009, 458, 1131–1135. [Google Scholar] [CrossRef]
- Ueno, T.; Komatsu, M. Autophagy in the Liver: Functions in Health and Disease. Nature Reviews Gastroenterology & Hepatology 2017, 14, 170–184. [Google Scholar] [CrossRef] [PubMed]
- Henkel, A.S. Unfolded Protein Response Sensors in Hepatic Lipid Metabolism and Nonalcoholic Fatty Liver Disease. Semin. Liver Dis. 2018, 38, 320–332. [Google Scholar] [CrossRef] [PubMed]
- Ipsen, D.H.; Lykkesfeldt, J.; Tveden-Nyborg, P. Molecular Mechanisms of Hepatic Lipid Accumulation in Non-Alcoholic Fatty Liver Disease. Cellular and Molecular Life Sciences 2018, 75 75, 3313–3327. [Google Scholar] [CrossRef]
- Cuadrado, A.; Rojo, A.I.; Wells, G.; Hayes, J.D.; Cousin, S.P.; Rumsey, W.L.; Attucks, O.C.; Franklin, S.; Levonen, A.L.; Kensler, T.W.; et al. Therapeutic Targeting of the NRF2 and KEAP1 Partnership in Chronic Diseases. Nature Reviews Drug Discovery 2018, 18:4 18, 295–317. [Google Scholar] [CrossRef] [PubMed]
- Jain, A.; Lamark, T.; Sjøttem, E.; Larsen, K.B.; Awuh, J.A.; Øvervatn, A.; McMahon, M.; Hayes, J.D.; Johansen, T. P62/SQSTM1 Is a Target Gene for Transcription Factor NRF2 and Creates a Positive Feedback Loop by Inducing Antioxidant Response Element-Driven Gene Transcription. Journal of Biological Chemistry 2010, 285, 22576–22591. [Google Scholar] [CrossRef] [PubMed]
- Komatsu, M.; Kurokawa, H.; Waguri, S.; Taguchi, K.; Kobayashi, A.; Ichimura, Y.; Sou, Y.S.; Ueno, I.; Sakamoto, A.; Tong, K.I.; et al. The Selective Autophagy Substrate P62 Activates the Stress Responsive Transcription Factor Nrf2 through Inactivation of Keap1. Nature Cell Biology 2010, 12:3 2010(12), 213–223. [Google Scholar] [CrossRef]
- Wu, L.; Xu, W.; Li, H.; Dong, B.; Geng, H.; Jin, J.; Han, D.; Liu, H.; Zhu, X.; Yang, Y.; et al. Vitamin C Attenuates Oxidative Stress, Inflammation, and Apoptosis Induced by Acute Hypoxia through the Nrf2/Keap1 Signaling Pathway in Gibel Carp (Carassius Gibelio). Antioxidants 2022, Vol. 11 11, 935. [Google Scholar] [CrossRef]
- Pekovic-Vaughan, V.; Gibbs, J.; Yoshitane, H.; Yang, N.; Pathiranage, D.; Guo, B.; Sagami, A.; Taguchi, K.; Bechtold, D.; Loudon, A.; et al. The Circadian Clock Regulates Rhythmic Activation of the NRF2/Glutathione-Mediated Antioxidant Defense Pathway to Modulate Pulmonary Fibrosis. Genes Dev. 2014, 28, 548. [Google Scholar] [CrossRef] [PubMed]
- Miani, M.; Le Naour, J.; Waeckel-Enée, E.; Verma, S. chand; Straube, M.; Emond, P.; Ryffel, B.; van Endert, P.; Sokol, H.; Diana, J. Gut Microbiota-Stimulated Innate Lymphoid Cells Support β-Defensin 14 Expression in Pancreatic Endocrine Cells, Preventing Autoimmune Diabetes. Cell Metab. 2018, 28, 557–572.e6. [Google Scholar] [CrossRef]
- Xu, Y.Q.; Zhang, D.; Jin, T.; Cai, D.J.; Wu, Q.; Lu, Y.; Liu, J.; Klaassen, C.D. Diurnal Variation of Hepatic Antioxidant Gene Expression in Mice. PLoS One 2012, 7, e44237. [Google Scholar] [CrossRef]
- Baselga-Escudero, L.; Bladé, C.; Ribas-Latre, A.; Casanova, E.; Salvadó, M.J.; Arola, L.; Arola-Arnal, A. Grape Seed Proanthocyanidins Repress the Hepatic Lipid Regulators MiR-33 and MiR-122 in Rats. In Mol. Nutr. Food Res.; WGROUP:STRING:PUBLICATION, 2012; Volume 56, pp. 1636–1646. [Google Scholar] [CrossRef]
- Hosseini, H.; Teimouri, M.; Shabani, M.; Koushki, M.; Babaei Khorzoughi, R.; Namvarjah, F.; Izadi, P.; Meshkani, R. Resveratrol Alleviates Non-Alcoholic Fatty Liver Disease through Epigenetic Modification of the Nrf2 Signaling Pathway. Int. J. Biochem. Cell Biol. 2020, 119, 105667. [Google Scholar] [CrossRef]
- Fan, C.; Ling-Hu, A.; Sun, D.; Gao, W.; Zhang, C.; Duan, X.; Li, H.; Tian, W.; Yu, Q.; Ke, Z. Nobiletin Ameliorates Hepatic Lipid Deposition, Oxidative Stress, and Inflammation by Mechanisms That Involve the Nrf2/NF-ΚB Axis in Nonalcoholic Fatty Liver Disease. J. Agric. Food Chem. 2023, 71, 20105–20117. [Google Scholar] [CrossRef]
- Terra, X.; Montagut, G.; Bustos, M.; Llopiz, N.; Ardèvol, A.; Bladé, C.; Fernández-Larrea, J.; Pujadas, G.; Salvadó, J.; Arola, L.; et al. Grape-Seed Procyanidins Prevent Low-Grade Inflammation by Modulating Cytokine Expression in Rats Fed a High-Fat Diet. J. Nutr. Biochem. 2009, 20, 210–218. [Google Scholar] [CrossRef]
- Manocchio, F.; Soliz-Rueda, J.R.; Ribas-Latre, A.; Bravo, F.I.; Arola-Arnal, A.; Suarez, M.; Muguerza, B. Grape Seed Proanthocyanidins Modulate the Hepatic Molecular Clock via MicroRNAs. Mol. Nutr. Food Res. 2022, 66, 2200443. [Google Scholar] [CrossRef]
- Cortés-Espinar, A.J.; Ibarz-Blanch, N.; Soliz-Rueda, J.R.; Calvo, E.; Bravo, F.I.; Mulero, M.; Ávila-Román, J. Abrupt Photoperiod Changes Differentially Modulate Hepatic Antioxidant Response in Healthy and Obese Rats: Effects of Grape Seed Proanthocyanidin Extract (GSPE). Int. J. Mol. Sci. 2023, 24, 17057. [Google Scholar] [CrossRef]
- Rodríguez, R.M.; de Assis, L.V.M.; Calvo, E.; Colom-Pellicer, M.; Quesada-Vázquez, S.; Cruz-Carrión, Á; Escoté, X.; Oster, H.; Aragonès, G.; Mulero, M. Grape-Seed Proanthocyanidin Extract (GSPE) Modulates Diurnal Rhythms of Hepatic Metabolic Genes and Metabolites, and Reduces Lipid Deposition in Cafeteria-Fed Rats in a Time-of-Day-Dependent Manner. Mol. Nutr. Food Res. 2024, 68, 2400554. [Google Scholar] [CrossRef] [PubMed]
- Cortés-Espinar, A.J.; Ibarz-Blanch, N.; Soliz-Rueda, J.R.; Bonafos, B.; Feillet-Coudray, C.; Casas, F.; Bravo, F.I.; Calvo, E.; Ávila-Román, J.; Mulero, M. Rhythm and ROS: Hepatic Chronotherapeutic Features of Grape Seed Proanthocyanidin Extract Treatment in Cafeteria Diet-Fed Rats. Antioxidants 2023, 12, 1606. [Google Scholar] [CrossRef]
- Hernandez-Baixauli, J.; Chomiciute, G.; Tracey, H.; Mora, I.; Cortés-Espinar, A.J.; Ávila-Román, J.; Abasolo, N.; Palacios-Jordan, H.; Foguet-Romero, E.; Suñol, D.; et al. Exploring Metabolic and Gut Microbiome Responses to Paraquat Administration in Male Wistar Rats: Implications for Oxidative Stress. Antioxidants 2024, 13, 67. [Google Scholar] [CrossRef] [PubMed]
- Rodríguez, R.M.; Cortés-Espinar, A.J.; Soliz-Rueda, J.R.; Feillet-Coudray, C.; Casas, F.; Colom-Pellicer, M.; Aragonès, G.; Avila-Román, J.; Muguerza, B.; Mulero, M.; et al. Time-of-Day Circadian Modulation of Grape-Seed Procyanidin Extract (GSPE) in Hepatic Mitochondrial Dynamics in Cafeteria-Diet-Induced Obese Rats. Nutrients 2022, 14, 774. [Google Scholar] [CrossRef]
- Livak, K.J.; Schmittgen, T.D. Analysis of Relative Gene Expression Data Using Real-Time Quantitative PCR and the 2−ΔΔCT Method. Methods 2001, 25, 402–408. [Google Scholar] [CrossRef]
- Cajka, T.; Fiehn, O. Toward Merging Untargeted and Targeted Methods in Mass Spectrometry-Based Metabolomics and Lipidomics. Anal. Chem. 2015, 88, 524–545. [Google Scholar] [CrossRef] [PubMed]
- Moškon, M. CosinorPy: A Python Package for Cosinor-Based Rhythmometry. BMC Bioinformatics 2020, 21, 1–12. [Google Scholar] [CrossRef]
- Montagner, A.; Korecka, A.; Polizzi, A.; Lippi, Y.; Blum, Y.; Canlet, C.; Tremblay-Franco, M.; Gautier-Stein, A.; Burcelin, R.; Yen, Y.C.; et al. Hepatic Circadian Clock Oscillators and Nuclear Receptors Integrate Microbiome-Derived Signals. Scientific Reports 2016, 6:1 2016(6), 20127. [Google Scholar] [CrossRef]
- Jacobi, D.; Liu, S.; Burkewitz, K.; Kory, N.; Knudsen, N.H.; Alexander, R.K.; Unluturk, U.; Li, X.; Kong, X.; Hyde, A.L.; et al. Hepatic Bmal1 Regulates Rhythmic Mitochondrial Dynamics and Promotes Metabolic Fitness. Cell Metab. 2015, 22, 709–720. [Google Scholar] [CrossRef]
- Ma, D.; Panda, S.; Lin, J.D. Temporal Orchestration of Circadian Autophagy Rhythm by C/EBPβ. EMBO J. 2011, 30, 4642. [Google Scholar] [CrossRef] [PubMed]
- Ma, X.; Ye, Y.; Sun, J.; Ji, J.; Wang, J.S.; Sun, X. Coexposure of Cyclopiazonic Acid with Aflatoxin B1 Involved in Disrupting Amino Acid Metabolism and Redox Homeostasis Causing Synergistic Toxic Effects in Hepatocyte Spheroids. J. Agric. Food Chem. 2022, 70, 5166–5176. [Google Scholar] [CrossRef] [PubMed]
- Sunny, N.E.; Bril, F.; Cusi, K. Mitochondrial Adaptation in Nonalcoholic Fatty Liver Disease: Novel Mechanisms and Treatment Strategies. Trends in Endocrinology and Metabolism 2017, 28, 250–260. [Google Scholar] [CrossRef] [PubMed]
- Dodson, M.; De La Vega, M.R.; Cholanians, A.B.; Schmidlin, C.J.; Chapman, E.; Zhang, D.D. Modulating NRF2 in Disease: Timing Is Everything. Annu. Rev. Pharmacol. Toxicol. 2018, 59, 555. [Google Scholar] [CrossRef]
- Kasai, S.; Shimizu, S.; Tatara, Y.; Mimura, J.; Itoh, K. Regulation of Nrf2 by Mitochondrial Reactive Oxygen Species in Physiology and Pathology. Biomolecules 2020, 10, 320. [Google Scholar] [CrossRef]
- Lee, Y.J.; Kim, S.W.; Jung, M.H.; Kim, Y.S.; Kim, K.S.; Suh, D.S.; Kim, K.H.; Choi, E.H.; Kim, J.; Kwon, B.S. Plasma-Activated Medium Inhibits Cancer Stem Cell-like Properties and Exhibits a Synergistic Effect in Combination with Cisplatin in Ovarian Cancer. Free Radic. Biol. Med. 2022, 182, 276–288. [Google Scholar] [CrossRef]
- Fujimaki, J.; Sayama, N.; Shiotani, S.; Suzuki, T.; Nonaka, M.; Uezono, Y.; Oyabu, M.; Kamei, Y.; Nukaya, H.; Wakabayashi, K.; et al. The Steroidal Alkaloid Tomatidine and Tomatidine-Rich Tomato Leaf Extract Suppress the Human Gastric Cancer-Derived 85As2 Cells In Vitro and In Vivo via Modulation of Interferon-Stimulated Genes. Nutrients 2022, Vol. 14 14, 1023. [Google Scholar] [CrossRef]
- Arola-Arnal, A.; Cruz-Carrión, Á; Torres-Fuentes, C.; Ávila-Román, J.; Aragonès, G.; Mulero, M.; Bravo, F.I.; Muguerza, B.; Arola, L.; Suárez, M. Chrononutrition and Polyphenols: Roles and Diseases. Nutrients 2019, Vol. 11 11 Page 2602 2019, 2602. [Google Scholar] [CrossRef]
- Franzago, M.; Alessandrelli, E.; Notarangelo, S.; Stuppia, L.; Vitacolonna, E. Chrono-Nutrition: Circadian Rhythm and Personalized Nutrition. International Journal of Molecular Sciences 2023, Vol. 24 24, 2571. [Google Scholar] [CrossRef]
- Koronowski, K.B.; Sassone-Corsi, P. Communicating Clocks Shape Circadian Homeostasis. Science 2021, 371, eabd0951. [Google Scholar] [CrossRef] [PubMed]
- Longo, V.D.; Panda, S. Fasting, Circadian Rhythms, and Time Restricted Feeding in Healthy Lifespan. Cell Metab. 2016, 23, 1048. [Google Scholar] [CrossRef] [PubMed]
Figure 1.
Effect of CAF diet and GSPE supplementation on BMAL1 and REV-ERBα proteins at different time points. Brain and muscle Arnt-like protein-1 (BMAL1) (A) and REV-ERBα (B) were analyzed in 48 male Fischer 344 rats fed a STD diet or CAF diet with daily supplementation of either vehicle or GSPE, administered at the onset of the dark phase (ZT12). Rats were sacrificed at four different ZTs: 9 a.m. (ZT1), 3 p.m. (ZT7), 9 p.m. (ZT13), and 3 a.m. (ZT19). Top left panels show representative immunoblots for BMAL1 and REV-ERBα (n = 4). Bottom left panels display diurnal protein expression profiles for BMAL1 and REV-ERBα (n = 4). Top right panels present Western blot quantification statistics expressed as minimum to maximum values, median, and interquartile range (n = 4) in each time point and (n=16) in each diet/treatment condition. Bottom left panels illustrate acrophases and amplitudes of BMAL1 and REV-ERBα expression for STD-VH, CAF-VH, and CAF-GSPE groups, with rhythm parameters determined using CircAnalyst. Statistical significance in immunoblots is indicated as follows: * p < 0.05 significant differences due to CAF diet.

Figure 2.
Effect of CAF diet and GSPE supplementation on LC3 and p62 proteins at different time points. Microtubule-associated protein 1A/1B-light chain 3 (LC3) (A), Sequestosome 1(SQSTM1 or p62) (B) were analyzed in 48 male Fischer 344 rats fed a STD diet or CAF diet with daily supplementation of either vehicle or GSPE, administered at the onset of the dark phase (ZT12). Rats were sacrificed at four different ZTs: 9 a.m. (ZT1), 3 p.m. (ZT7), 9 p.m. (ZT13), and 3 a.m. (ZT19). Top left panels show representative immunoblots for LC3 and p62 proteins (n = 4). Bottom left panels display diurnal protein expression profiles for LC3 and p62 proteins (n = 4). Top right panels present Western blot quantification statistics expressed as minimum to maximum values, median, and interquartile range (n = 4). Bottom right panels illustrate acrophases and amplitudes of LC3 and p62 protein expression for STD-VH, CAF-VH, and CAF-GSPE groups, with rhythm parameters determined using CircAnalyst. Rhythmicity is expressed as R.

Figure 3.
CAF and GSPE effect on LC3(A), p62 (B), ULK1(C) gene expression at different time lapses. Microtubule-Associated Protein 1 Light Chain 3 (LC3) (A), Sequestosome 1 (SQSTM1 or p62) (B) were analyzed in 48 male Fischer 344 rats were fed with a STD or CAF diet and received a daily supplementation of vehicle or GSPE at the beginning of the activity/dark phase (ZT12) and were sacrificed at different time points 9 a.m. (ZT1), 3 p.m. (ZT7), 9 p.m. (ZT13) and 3 a.m. (ZT19). a) RT-qPCR statistics for LC3, p62 and ULK1 at different time points (n = 4). b) Diurnal gene expression profile for LC3 gene (n = 4). c) Acrophase and amplitude represented of LC3, p62 and ULK1 expression for STD-VH, CAF-VH and CAF-GSPE groups. For “a” data are expressed as minimum to maximum values, median and interquartile range. For “b” data are expressed as means ± SEM and the determination of rhythm parameters was done with CircAnalyst. “#” p > 0.05 indicates tendency due to CAF diet or GSPE by Mann-Whitney test.

Figure 4.
Effect of CAF diet and GSPE supplementation on NRF2/HO-1 axis at different time points. Phosphorylated Nuclear factor erythroid 2–related factor 2 (p-NRF2) (A), Heme oxygenase 1 (HO-1) (B) were analyzed in 48 male Fischer 344 rats fed a STD diet or CAF diet with daily supplementation of either vehicle or GSPE, administered at the onset of the dark phase (ZT12). Rats were sacrificed at four different ZTs: 9 a.m. (ZT1), 3 p.m. (ZT7), 9 p.m. (ZT13), and 3 a.m. (ZT19). Top left panels show representative immunoblots for p-NRF2 and HO-1 proteins (n = 4). Bottom left panels display diurnal protein expression profiles for p-NRF2 and HO-1 proteins (n = 4). Top right panels present Western blot quantification statistics expressed as minimum to maximum values, median, and interquartile range (n = 4) in each time point and (n=16) in each diet/treatment condition. Bottom right panels illustrate acrophases and amplitudes of p-NRF2 and HO-1 protein expression for STD-VH, CAF-VH, and CAF-GSPE groups, with rhythm parameters determined using CircAnalyst. Rhythmicity is expressed as R.

Figure 5.
Effect of CAF and GSPE supplementation on AMPK activity at different time points. Forty-eight male Fischer 344 rats were fed with a STD or CAF diet and received a daily supplementation of vehicle or GSPE at the beginning of the activity/dark phase (ZT12) and were sacrificed at different time points 9 a.m. (ZT1), 3 p.m. (ZT7), 9 p.m. (ZT13) and 3 a.m. (ZT19). Top left panels show representative immunoblots for AMPK (n = 4). Top right panels display diurnal protein expression profile. Top right panels present Western blot quantification statistics expressed as minimum to maximum values, median, and interquartile range (n = 4). Bottom right panels illustrate acrophases and amplitudes, with rhythm parameters determined using CircAnalyst.

Figure 6.
CAF and GSPE effect on Grp78 (A), Atf6 (B), Chop (C) gene expression at different time lapses. Glucose-Regulated Protein 78 (Grp78), Activating Transcription Factor 6 (Atf6), and DNA damage-inducible transcript 3 (Chop) were analyzed in 48 male Fischer 344 rats were fed with a STD or CAF diet and received a daily supplementation of vehicle or GSPE at the beginning of the activity/dark phase (ZT12) and were sacrificed at different time points 9 a.m. (ZT1), 3 p.m. (ZT7), 9 p.m. (ZT13) and 3 a.m. (ZT19). From left to right: RT-qPCR analysis at different time points (n = 4), diurnal gene expression profile (n = 4), and acrophase and amplitude of expression in the STD-VH, CAF-VH, and CAF-GSPE groups. In the first panel, data are presented as minimum to maximum values, median, and interquartile range. In the second panel, data are expressed as mean ± SEM. Rhythm parameters were determined using CircAnalyst. “#” indicates p > 0.05, showing a statistical trend for the effect of STD diet and CAF diet according to the Mann–Whitney test.

Figure 5.
Dietary impact on the temporal organization of the hepatic metabolome. Sparse Partial Least Squares Discriminant Analysis (sPLS-DA) score plots showing hepatic metabolic clustering for: (A) STD-VH, (B) CAF-VH (C) CAF-GSPE. Each panel represents the distribution of hepatic profiles across four ZT: ZT1 (red), ZT7 (green), ZT13 (blue), and ZT19 (purple). The separation along the first two components (Comp 1 and Comp 2) reflects the daily rhythmic oscillations of the liver metabolome. Shaded areas denote 95% confidence ellipses. Temporal clustering was assessed by PERMANOVA (p = 0.003, p = 0.066, and p = 0.021 for A, B, and C, respectively). Note the loss of distinct temporal separation in the CAF-VH group and its partial recovery with GSPE supplementation.

Figure 6.
Metabolite Sets Enrichment Analysis (MSEA) of differentially regulated metabolites. Bubble plots representing the top 25 enriched metabolic pathways based on the hepatic metabolic profiles of rats fed with: (A) Standard diet (STD-VH), (B) Cafeteria diet (CAF-VH), and (C) Cafeteria diet supplemented with Grape Seed Proanthocyanidins Extract (CAF+GSPE).


Table 1.
Nucleotide sequences of primers used for real-time quantitative PCR.
| Gene | Forward primer (5' to 3') | Reverse Primer (5' to 3') |
| Grp78 | TCGACTTGGGGACCACCTAT | GCCCTGATCGTTGGCTATGA |
| Atf6 | GGACCAGGTGGTGTCAGAG | GACAGCTCTGCGCTTTGGG |
| Chop | ACCACCACACCTGAAAGCAG | AGCTGGACACTGTCTCAAAG |
| Lc3 | GGTCCAGTTGTGCCTTTATTGA | GTGTGTGGGTTGTGTACGTCG |
| Sqstm1 | CTAGGCATCGAGGTTGACATT | CTTGGCTGAGTACCACTCTTATC |
| Ulk1 | GGCTTACAGACTGCCATTGA | GATACCACGCTGGCCTTATAC |
| Ppia | TCAAACACAAATGGTTCCCAGT | ATTCCTGGACCCAAAACGCT |
Table 2.
Lipid parameters in the liver.
| Parameter | Group | ||
| STD-VH | CAF-VH | CAF-GSPE | |
| TAG (mg/g) | 3.755 (3.373-3.215) | 11,686 (11,335-12,118)* | 9,914 (9,633-9,985)& |
| Cholesterol (mg/g) | 1,207 (1,130-1,251) | 1,395 (1,314-1,762)* | 1,390 (1,247-1,481) |
| Total lipids (mg/g) | 63,719 (54,201-72,582) | 89,127(77,189-105,920)* | 81,662 (75,031-88,872) |
Lipid parameters in the liver of Fischer 344 rats fed a STD diet and exposed to three different photoperiods for 9 weeks, supplemented with vehicle or GSPE for the last 4 weeks. Data are given as median (quartile 1 [Q1]–quartile 3 [Q3]) (n=16), using Mann–Whitney test; *Indicates significant differences between STD-VH and CAF-VH. & Indicates significant differences between CAF-VH and CAF-GSPE (p<0.05).
Table 3.
Differential hepatic metabolites in STD-VH, CAF-VH, and CAF-GSPE rats VIP scores.
| Group | Metabolite | VIP score |
| STD-VH | Glutamine Serine Lactic acid Malic acid Glucose-6-phosphate α-Ketoglutaric acid Pyruvic acid Ornithine Aspartic acid Xylonic acid |
1.98 1.90 1.82 1.50 1.47 1.38 1.32 1.30 1.23 1.03 |
| CAF-VH | Pyruvic acid Lactic acid Alanine Citric acid 3-Hydroxyisobutyric acid α-Ketoglutaric acid Succinic acid Glucose-6-phosphate Malic acid |
2.43 2.01 1.53 1.45 1.40 1.37 1.13 1.09 1.01 |
| CAF-GSPE | Cholesterol Ornithine |
2.11 1.92 |
| 4-Hydroxyproline | 1.63 | |
| Taurine | 1.52 | |
| Malic acid | 1.41 | |
| Aspartic acid | 1.32 | |
| Glycerol-1-phosphate | 1.31 | |
| α-Ketoglutaric acid | 1.17 | |
| Citric acid | 1.13 | |
| Glutamine | 1.13 | |
| Glutamic acid | 1.11 |
Differential hepatic metabolites in STD-VH, CAF-VH, and CAF-GSPE groups identified by partial least squares–discriminant analysis (PLS-DA). Variable importance in projection (VIP) scores indicate the contribution of each metabolite to group discrimination. Only metabolites with VIP > 1.0 are shown.
Disclaimer/Publisher’s Note: The statements, opinions and data contained in all publications are solely those of the individual author(s) and contributor(s) and not of MDPI and/or the editor(s). MDPI and/or the editor(s) disclaim responsibility for any injury to people or property resulting from any ideas, methods, instructions or products referred to in the content. |
© 2026 by the authors. Licensee MDPI, Basel, Switzerland. This article is an open access article distributed under the terms and conditions of the Creative Commons Attribution (CC BY) license (http://creativecommons.org/licenses/by/4.0/).
Copyright: This open access article is published under a Creative Commons CC BY 4.0 license, which permit the free download, distribution, and reuse, provided that the author and preprint are cited in any reuse.


