Submitted:
13 April 2026
Posted:
14 April 2026
You are already at the latest version
Abstract
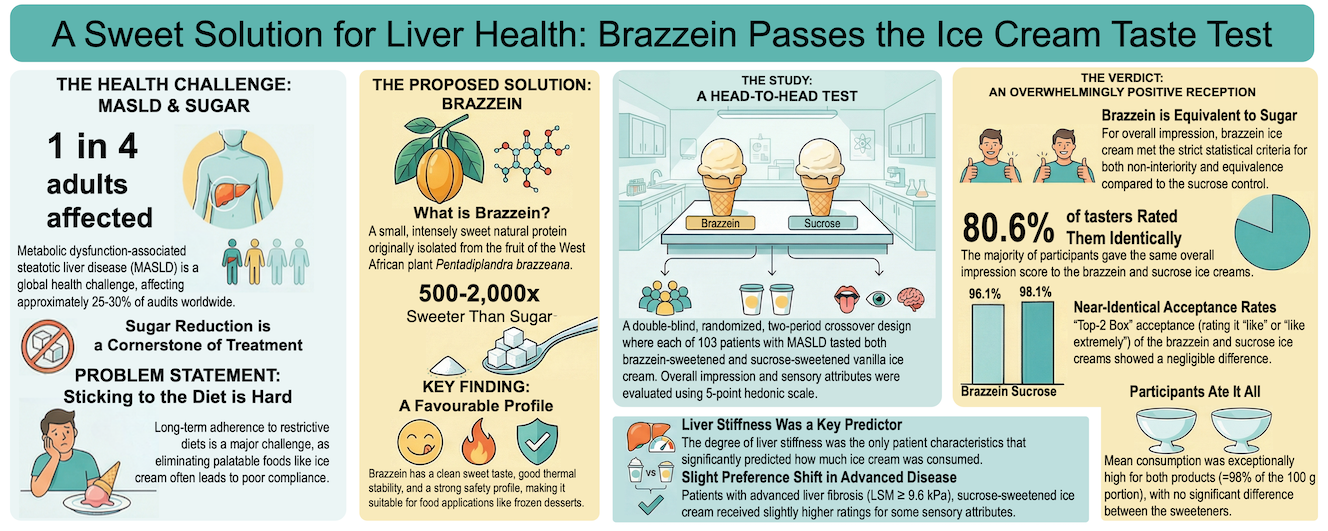
Metabolic dysfunction-associated steatotic liver disease (MASLD) affects 25%–30% of adults globally. Dietary sugar reduction is one of the key therapeutic targets, but elimination of sugar-sweetened foods may compromise adherence to calorie-restricted diets. Brazzein, a natural sweet protein that is 500–2000 times sweeter than sucrose, offers a promising substitute, yet clinical data in patients with MASLD are lacking. In a double-blind, randomized, two-period crossover trial, 103 adults with MASLD tasted iso-sweet vanilla ice cream sweetened with either brazzein or sucrose on two consecutive days. Overall impression and sensory attributes (appearance, color, aroma, flavor, and texture) were rated on 5-point hedonic scales, and the percentage of the 100 g portion consumed was recorded. Brazzein-sweetened ice cream met the prespecified criteria for both non-inferiority and equivalence versus sucrose for overall impression. Top-2 box acceptance (ratings ≥4) was extremely high and nearly identical (96.1% for brazzein and 98.1% for sucrose). Mean consumption exceeded 98% of the portion for both products, with no significant difference between sweeteners. Secondary sensory ratings were closely similar, and multivariate analyses indicated highly overlapping sensory profiles. Exploratory subgroup analyses suggested consistent findings across most demographic and clinical characteristics, although participants with advanced liver fibrosis (LSM ≥9.6 kPa) showed numerically higher ratings for sucrose. Liver stiffness was the only significant predictor of consumption, with slightly lower intake at higher stiffness values. This study provides the first evidence that brazzein-sweetened ice cream maintains consumer acceptability comparable to a conventional sucrose-sweetened product in a clinically relevant population, supporting its potential integration into dietary management strategies for MASLD.
Keywords:
brazzein
; ice cream
; sensory perception
; consumer acceptability
; metabolic dysfunction-associated steatotic liver disease
; sugar replacement
1. Introduction
Metabolic dysfunction-associated steatotic liver disease (MASLD), formerly known as non-alcoholic fatty liver disease, represents a major global health challenge affecting approximately 25-30% of adults worldwide and is associated with an unprecedented burden on healthcare systems [1,2]. MASLD is characterized by hepatic steatosis in the absence of significant alcohol consumption or other etiologies and is strongly associated with obesity, type 2 diabetes, metabolic syndrome, and cardiovascular disease. The disease spectrum ranges from metabolic dysfunction-associated steatotic liver (MASL), which is represented by simple steatosis, to metabolic dysfunction-associated steatohepatitis (MASH), which can progress to cirrhosis and hepatocellular carcinoma [3,4].
To date, only two drugs have been approved for the treatment of MASH [5,6]; however, for the vast majority of patients with MASLD, dietary intervention combined with physical exercise remains the cornerstone of MASLD management, as meta-analyses of low-calorie dietary interventions have shown consistent reductions in intrahepatic lipid content and body weight, with total dietary replacement strategies producing marked improvements in liver fat compared to control interventions [7,8]. Carbohydrate intake was identified as the most significant predictor of new-onset MASLD, followed by fat, protein, and total calorie intakes [9]. The rapid increase in the prevalence of MASLD among children and adolescents during the last decade was directly linked to the increased consumption of food with added sugar, and its restriction may be established as one of the key elements of nutritional policy to curb this health crisis [10].
Despite clear evidence supporting sugar reduction, long-term dietary adherence remains a significant challenge in MASLD management, as only 32% of patients with MASLD who were overweight or obese achieved a weight loss of ≥5% during a 5-year follow-up, and among them, only 25% maintained their weight loss 5 years after the intervention [11]. Moreover, restrictive diets that eliminate palatable foods often result in poor compliance, treatment failure, and psychological distress [12]. Ice cream and frozen desserts represent a particularly challenging food category, as they are highly palatable, culturally significant, and frequently consumed, and contribute substantial amounts of added sugar to the diet [13]. The elimination of such foods may be neither realistic nor sustainable for many patients. Therefore, the development of acceptable sugar-reduced alternatives that maintain sensory appeal while reducing caloric and glycemic loads represents a pragmatic approach to improving dietary adherence and long-term health outcomes in MASLD populations. The success of such reformulation strategies depends critically on maintaining consumer acceptability, as even nutritionally superior products will fail if they are rejected by consumers.
Among the natural sweeteners, sweet proteins have been extensively studied because they are low in calories, non-toxic, and much sweeter than sugar (100 to 10,000 times sweeter). Brazzein is a small, intensely sweet protein (approximately 53 amino acids, ~6.5 kDa) originally isolated from the fruit of the West African plant Pentadiplandra brazzeana Baillon, which was discovered in 1994 [14]. With a sweetness potency approximately 500-2,000 times that of sucrose on a weight basis, brazzein belongs to the class of sweet-tasting proteins that includes thaumatin, monellin, and miraculin [15]. Unlike synthetic high-intensity sweeteners, brazzein is a natural protein that can be produced using recombinant expression systems, offering potential advantages in terms of consumer perception and regulatory acceptance [16]. In 2024, recombinant brazzein produced by Komagataella phaffii was approved as a food ingredient in Russia, and two others (from K. phaffii and one from Aspergillus oryzae 90402) were approved in the USA [17,18]. Structural and mutagenesis studies have elucidated the molecular basis of brazzein's sweetness, identifying key surface residues and electrostatic properties that mediate its interaction with the human T1R2-T1R3 sweet taste receptor [19]. Site-directed mutagenesis experiments have demonstrated that specific amino acid substitutions, particularly in surface-exposed regions such as Ala19, can modulate sweetness intensity and receptor-binding affinity [20]. These molecular insights have enabled the development of brazzein variants with enhanced sweetness properties and may explain the differences in the sweetness of the approved variants of brazzein [17,18].
From a sensory perspective, brazzein exhibits a clean sweet taste with minimal off-flavors compared to other high-intensity sweeteners [21]. However, like many protein sweeteners, brazzein may exhibit delayed sweetness onset and lingering aftertaste [22], characteristics that vary with food matrix and concentration and possibly the molecular structure of the recombinant protein. Thermal stability studies have indicated that brazzein maintains its sweetness activity across a wide pH range and withstands moderate heat treatment, making it potentially suitable for various food applications, including frozen desserts [14,23].
The potential role of brazzein as a sugar substitute in food products for patients with MASLD has been confirmed in an experimental study that replicates the development of human obesity in mice consuming 10% sucrose or 3M-brazzein water solution for 15 weeks. Liquid 3M-brazzein consumption had no effect on adiposity hypertrophy and did not influence insulin resistance, inflammation, or glucose homeostasis [24]. The safety of brazzein derived from K. phaffii was evaluated through in silico allergenicity, in vitro genotoxicity (reverse mutation and mammalian micronucleus assays), and a 90-day dietary oral toxicity study in rats. There was no indication of allergenicity in the in silico analyses, it was non-genotoxic in the in vitro assays, and showed no adverse effects in the 90-day oral toxicity study up to the highest dose tested [25]. In contrast to artificial sweeteners, brazzein did not significantly change the gut microbiota in rats and did not result in the appearance of opportunistic bacterial species during prolonged consumption [26]. This provides additional evidence for the safety of brazzein as a sugar substitute.
Previous investigations of alternative sweeteners in ice cream, including stevia, xylitol, and various polyols, have shown variable consumer acceptance depending on the sweetener type, concentration, flavor system, and consumer population [27,28,29]. Cultural differences in sweetness preferences and familiarity with alternative sweeteners also significantly influence the acceptability outcomes [30]. However, to date, no published studies have evaluated brazzein as a sweetener in ice cream or assessed its acceptability among MASLD patients specifically.
Given the high prevalence of MASLD, the critical role of dietary sugar reduction in disease management, the challenges of long-term dietary adherence, and the lack of acceptable sugar-reduced frozen dessert options, palatable alternatives that can be integrated into MASLD dietary protocols are needed. Brazzein, a natural high-intensity sweetener with favorable sensory properties and potential for clean-label appeal, is a promising candidate for sugar replacement in ice cream. However, the acceptability of brazzein-sweetened ice cream has not been evaluated, particularly among patients with MASLD, who represent the target population for such products. Furthermore, the sensory profile of brazzein in complex frozen dairy matrices and its comparison with conventional sucrose-sweetened ice cream under controlled double-blind conditions remain uncharacterized. Therefore, the objectives of this study were to evaluate the consumer acceptability of brazzein-sweetened ice cream compared to sucrose-sweetened control among individuals with MASLD using a double-blind, randomized, crossover design and to assess the feasibility of brazzein-sweetened ice cream as a component of sugar reduction strategies for dietary management of MASLD. To our knowledge, this is the first randomized double-blind clinical sensory evaluation of brazzein in a frozen dairy product and the first such study conducted in a clinically characterized MASLD population.
2. Materials and Methods
This manuscript reports the sensory component of a double-blind, randomized, two-period crossover study (NCT06724913). The study was performed in the Department of Gastroenterology, Hepatology and Nutrition of Federal Research center of Nutrition, biotechnology and food safety in Moscow, Russia. Study protocol and informed consent form were approved by Ethics Committee of the Federal Research Center on 28.10.2024 (protocol # 9).
2.1. Participants
Patients with MASLD admitted to the Department of Gastroenterology, Hepatology and Nutrition between November 1, 2024 and October 31, 2025 were recruited according to the predefined inclusion and exclusion criteria (Appendix A, Table A1). The diagnosis of MASLD was reconfirmed according to recent guidelines [3,4] by assessing the degree of steatosis and stage of liver fibrosis using vibration-controlled transient elastography (VCTE) (Fibroscan® 530, EchoSens, France), which was performed under fasting conditions according to a standard protocol and the manufacturer's recommendations. The controlled attenuation parameter (CAP), which characterizes the amount of fat in the liver, was measured using the VCTE system. Stages of steatosis by CAP were defined as follows: S1, 248–267 dB/m; S2, 268–279 dB/m; and S3, ≥280 dB/m [31]. Stages of liver fibrosis were defined as follows: F0 – up to 6.5 kPa, F1 – 6.5-7.19 kPa, F2 – 7.2-9.59 kPa, F3 – 9.6-14.59 kPa, F4 – more than 14.6 kPa [32].
2.2. Study Design
The study used a double-blind, randomized, two-period, two-sequence crossover design, in which treatment A was brazzein-sweetened ice cream and treatment B was sucrose-sweetened ice cream (control). Participants were randomly assigned in a 1:1 ratio to sequence AB or BA using a computer-generated randomization schedule (Excel 2019, Microsoft Corporation, Redmond, WA, USA). A crossover design was selected to enable within-participant comparison of the two formulations while reducing the influence of between-subject variability in sensory preferences. To preserve blinding, all samples were presented in identical containers and labeled with three-digit random codes, and both participants and study personnel remained unaware of treatment identity during data collection.
2.3. Ice Cream Formulation
Two vanilla-flavored ice cream formulations, a brazzein-sweetened formulation (test) and a sucrose-sweetened formulation (control), were provided by the industrial partner of the project (EFKO, Moscow, Russia). Formulations of 100 g each were designed to be iso-sweet (equivalent perceived sweetness intensity) and matched for key physicochemical properties, including freezing point, viscosity, overrun, and melting rate. A brazzein concentration of 0,014% was determined through preliminary magnitude estimation and perceived as equally sweet as the 14% sucrose control formulation.
2.4. Sensory Evaluation Procedures
Sensory evaluations were conducted in a dedicated room under controlled conditions (temperature 20-22 °C, relative humidity 50-60%, white lighting). Participants attended two evaluation sessions separated by a 1-day interval intended to reduce potential residual sensory or expectation effects between periods. At each session, participants evaluated one ice cream sample (100 g, served at -10 to -12 °C in identical white plastic cups coded with three-digit random numbers).
Participants completed a structured questionnaire assessing hedonic ratings (5-point hedonic scale: 1 = dislike extremely, 3 = neither like nor dislike, 5 = like extremely) for overall, appearance, flavor, aroma, texture, and color liking. After tasting, the percentage of ice cream consumption was calculated as 100 × (distributed ice cream portion weight − remaining ice cream portion weight) / distributed portion weight.
2.5. Data Collection and Management
Questionnaire responses and consumption measurements were entered into a secure database with double-entry verification. Treatment codes were retained in blinded form until data checking and dataset locking were completed. Demographic information (age, sex, BMI, MASLD degree and stage, and diabetes status) was collected at baseline. All data were de-identified and stored in accordance with institutional data protection policies and regulations.
2.6. Statistical Analysis
All statistical analyses were performed using R version 4.3.0 (R Foundation for Statistical Computing, Vienna, Austria). The following R packages were used: ordinal (cumulative link mixed models), lme4 and lmerTest (linear mixed models), emmeans (estimated marginal means), MASS (proportional odds models), rcompanion (effect sizes), and tidyverse (data manipulation and visualization). Statistical significance was set at α = 0.05 for all tests, unless otherwise specified.
Because the trial used a 2×2 crossover design, the primary analysis was based on the within-subject paired difference in overall impression between brazzein- and sucrose-sweetened ice cream. Accordingly, the effective sample size for the confirmatory analysis was the number of participants with complete paired observations rather than the total number of tasting occasions. The prespecified equivalence margin was ±0.3 points on the 5-point hedonic scale, and the non-inferiority margin was -0.3 points. With 103 complete participant pairs and an observed standard deviation of 0.513 points for the paired differences, the final sample size was considered sufficient to provide adequate precision for evaluation against the prespecified equivalence and non-inferiority margins. Approximate sample-size calculations indicated that, under the observed mean difference, about 95 paired participants would be required to achieve 90% power, supporting the adequacy of the final sample size.
Continuous variables were summarized using means and standard deviations for approximately symmetric distributions, or medians and interquartile ranges for non-normal data. Ordinal sensory variables measured on 5-point hedonic scales were summarized using medians, quartiles, and frequency distributions. Categorical variables were summarized using counts and percentages. Sequence, period, and potential carryover effects were evaluated to assess the integrity of the crossover design. If a carryover effect showed statistical significance at p < 0.10 or materially altered the estimated treatment effect, a Period 1-only sensitivity analysis was prespecified.
The primary outcome was the overall impression score. The primary estimand was the within-participant mean difference in overall impression between brazzein- and sucrose-sweetened ice cream. The treatment effect was defined as brazzein − sucrose, such that negative values indicated higher ratings for sucrose. Equivalence was concluded if the 90% confidence interval for the mean paired difference lay entirely within the prespecified equivalence margin of -0.3 to +0.3 points. Non-inferiority was concluded if the lower bound of the same 95% confidence interval exceeded -0.3 points. The equivalence margin was specified on the raw 5-point hedonic scale to reflect practical comparability for product replacement rather than exact equality. Because sensory equivalence limits are generally context-specific and not defined by a universal rule for hedonic scales, a margin of ±0.3 points was selected to represent a small difference relative to a one-category shift and therefore an unimportant loss of liking in practical terms. Superiority of brazzein over sucrose was assessed separately using a one-sided paired test of the hypothesis that the mean paired difference (brazzein − sucrose) was greater than 0, but superiority was not the primary inferential objective. As a robustness check for the primary outcome, a non-parametric paired analysis was also performed using the Wilcoxon signed-rank test on within-subject differences. The distribution of paired differences was further described by the median difference, the proportions of participants favoring each sweetener, and an effect size to quantify the magnitude of the directional preference. This analysis was used to assess whether any statistically detectable difference was also meaningful in practical terms.
Because hedonic ratings are ordinal, a cumulative link mixed model (CLMM) with proportional odds was also fitted for overall impression as a supportive sensitivity analysis. This model included treatment, period, sequence, and patient-level covariates, including age, sex, body mass index, diabetes status, liver steatosis, and liver fibrosis, with participant included as a random effect. Results from this model were interpreted as complementary rather than primary, because they estimate treatment effects on an odds-ratio scale, whereas equivalence and non-inferiority were prespecified on the mean-difference scale.
Binary acceptance (ratings ≥4, "like" or "like extremely") was analyzed using generalized linear mixed models with a logit link and participant-specific random intercepts. Marginal acceptance probabilities were estimated for each sweetener, and the absolute risk difference (brazzein − sucrose) with 95% confidence intervals was reported. Percentage consumption was analyzed using linear mixed-effects models including treatment, period, sequence, and patient-level covariates as fixed effects, with participant included as a random effect. Estimated marginal means and pairwise treatment differences with 95% confidence intervals were reported.
Secondary sensory attributes, including aroma, flavor, texture, appearance, and color, were analyzed as ordinal outcomes using the same CLMM framework. These analyses were limited to comparative superiority testing and were interpreted as secondary endpoints. To account for multiple comparisons across secondary sensory outcomes, p-values were adjusted using the false discovery rate method at the 5% level. Adjusted p-values below 0.05 were considered statistically significant. Equivalence and non-inferiority were not formally tested for these secondary attributes. To explore the multivariate sensory profile across attributes, Multiple Correspondence Analysis (MCA) was performed using the ordinal ratings for appearance, color, aroma, texture, and flavor. MCA was used as an exploratory ordination method to examine associations among sensory attributes and to visualize whether Brazzein- and sucrose-sweetened ice cream formed distinct or overlapping sensory profiles. Individual tasting evaluations were projected onto the first two MCA dimensions, and overlap between products was assessed descriptively using the distribution of observations and 95% confidence ellipses. MCA findings were interpreted as supportive evidence of overall sensory similarity and practical comparability, rather than as a formal hypothesis test of equivalence.
Exploratory analyses were performed to examine whether treatment effects varied according to patient characteristics (diabetes status, sex, age, BMI, and liver conditions). Interaction terms were added to the primary CLMM, with interactions evaluated at α = 0.05. These analyses were considered hypothesis-generating and interpreted cautiously without multiple testing adjustments. Treatment effects were examined within demographic subgroups (diabetes status, sex, and age tertiles) using stratified analyses. For ordinal outcomes obtained in Period 1, the Mann-Whitney U test was used to compare treatments within each subgroup. Stratified linear mixed models were fitted for consumption. Subgroup analyses were exploratory.
All statistically significant findings were evaluated for practical importance by comparing the magnitude of the difference to the pre-specified equivalence margin. Effect sizes (OR, Cliff's delta, and mean differences) were reported to facilitate this assessment. This framework allowed for nuanced interpretation beyond simple "significant vs. non-significant" conclusions, recognizing that products may be statistically different yet practically equivalent, or vice versa. Model convergence was verified for all fitted models. Residual diagnostics were performed for the linear mixed models. Influential observations were identified using standard diagnostic procedures, although no observations were excluded unless data quality issues were identified.
Results are reported in accordance with the CONSORT guidelines for crossover trials. Treatment effects were presented as point estimates, 95% confidence intervals, and exact p-values. Effect sizes accompany all primary and secondary analyses to facilitate the interpretation of clinical/practical significance beyond statistical significance.
3. Results
3.1. Participant Characteristics
Among patients with MASLD who were enrolled and randomized to the two sequence groups (Figure 1), all 103 participants (Table 1) completed both tasting periods and were included in the paired primary analysis. Given the observed standard deviation of the within-subject differences (0.513 points), the study had sufficient precision to evaluate the prespecified equivalence margin of ±0.3 points; this indicated that the study had adequate precision to evaluate the prespecified equivalence margin of ±0.3 points.
3.2. Evaluation of Period and Carryover Effects
The crossover design validity assessment showed no significant differences between the sequence groups for any demographic or clinical characteristic (Table 1). The two sequence groups had similar Period 1 ratings, confirming successful randomization (Mann-Whitney U-test, U = 1289, p = 0.866). No significant difference was found between the ratings of periods 1 and 2, suggesting that the participants did not systematically rate differently based on when they tasted the product (Wilcoxon signed-rank test: W = 137, p = 0.204). However, diagnostic assessment suggested possible carryover (Mann-Whitney U test: U = 997, p = 0.003), indicating that ratings in the second period may have been influenced by the product tasted in the first period.
3.3. Primary Analysis Results
For the primary endpoint of overall impression, the confirmatory crossover analysis was based on the within-subject paired difference in rating between brazzein- and sucrose-sweetened ice cream. The mean paired difference (brazzein − sucrose) was −0.146 points, indicating a slight tendency toward higher ratings for sucrose.
The 90% confidence interval for the mean paired difference lay entirely within the prespecified equivalence margin of −0.3 to +0.3 points, thereby demonstrating equivalence. In addition, the lower bound of the 95% confidence interval remained above the non-inferiority margin of −0.3 points, supporting non-inferiority of brazzein relative to sucrose. Brazzein did not demonstrate superiority over sucrose, because the observed mean difference was negative and the one-sided superiority test was not significant (p = 0.998) (Figure 2). Taken together, these findings indicate that sucrose showed a slight average advantage, but the magnitude of that difference remained within the prespecified bounds of practical equivalence.
The distribution of within-subject paired differences further supported the practical similarity of the two products. Most participants (80.6%) assigned identical overall impression ratings to both ice creams, whereas 16.5% rated sucrose higher and 2.9% rated brazzein higher (Figure 3). Thus, although the observed direction of effect favored sucrose, most paired differences were absent or small in magnitude.
In the supportive nonparametric paired analysis, the within-subject differences were statistically different from zero (Wilcoxon signed-rank test, p = 0.0065), but the magnitude of the difference was small. The median paired difference was 0, and the associated nonparametric effect size was negligible, indicating that the statistically detectable directional preference had minimal practical importance.
Because diagnostic assessment suggested possible carryover in the crossover data, a prespecified Period 1-only sensitivity analysis was performed. In this analysis, overall impression ratings were nearly identical between brazzein and sucrose (4.84 ± 0.36 vs 4.82 ± 0.46, p = 0.8), supporting the robustness of the primary conclusion after removal of potential carryover effects.
As an additional supportive sensitivity analysis, a cumulative link mixed model (CLMM) was fitted for overall impression. The estimated treatment effect was directionally consistent with the paired analysis, favoring sucrose on the ordinal odds scale. However, because this model estimates treatment effects as odds ratios rather than on the prespecified mean-difference scale, it was interpreted as complementary and not as the basis for the confirmatory equivalence conclusion. Overall, the combined analyses indicate that sucrose had a slight statistical advantage, but the difference was sufficiently small to remain within the predefined margin of practical equivalence.
3.4. Secondary Analyses
3.4.1. Individual Sensory Attributes
Because significant carryover effects were identified for flavor, texture, and aroma (Appendix A, Table A2), only Period 1 data were used for the analysis of individual sensory attributes. No statistically significant between-product differences were observed for these attributes (Appendix A, Table A3). To further explore the joint sensory structure across attributes, Multiple Correspondence Analysis (MCA) was performed using ratings for appearance, color, aroma, texture, and flavor. MCA was used to examine interrelationships among attributes and to visualize whether the two ice cream formulations formed distinct or overlapping sensory profiles. The MCA plot showed substantial overlap between brazzein- and sucrose-sweetened samples, with no clear separation of the two groups in the first two dimensions (Figure 4), supporting the interpretation that the products had broadly similar overall sensory profiles. This analysis was considered exploratory and descriptive, and was not used as a formal test of equivalence.
3.4.2. Top-2 Box Acceptance
To evaluate consumer acceptance of the two ice cream formulations, acceptance was defined as an overall impression rating of 4 or higher on the 5-point hedonic scale. Crude acceptance was very high for both products: 96.1% (99/103) for brazzein and 98.1% (101/103) for sucrose.
In the generalized linear mixed model with participant-specific random intercepts, no statistically significant sweetener effect was detected. The model-estimated marginal acceptance probabilities were 99.99% (95% CI: 99.55%–100.00%) for brazzein and 100.00% (95% CI: 99.67%–100.00%) for sucrose. Given the near-ceiling acceptance rates, model-based probabilities should be interpreted cautiously. The absolute risk difference, defined as brazzein − sucrose, was −0.0051% (95% CI: −0.0275% to 0.0174%; p = 0.173). Overall, both formulations showed extremely high acceptance, with no statistically or clinically meaningful difference between sweeteners.
3.4.3. Ice Cream Consumption Analysis
Overall, the ice cream consumption was very high across both treatment groups. The mean consumption was 98.25% (SD = 7.99%), with a median of 100%, indicating that the majority of participants consumed the entire portion of ice cream, regardless of the sweetener type. This high consumption rate suggests the excellent palatability and acceptability of both formulations. The estimated marginal means for consumption were 98.01% (95% CI: 96.10–99.92%) for the brazzein-sweetened ice cream and 99.61% (95% CI: 97.71–101.52%) for the sucrose-sweetened ice cream (Figure 5A).
The mean difference between the treatments was -1.60% (95% CI: -3.64 to 0.44%), indicating a slightly lower but not significant consumption of the brazzein formulation compared to that of sucrose. However, this difference was not statistically significant (t(101) = -1.559, p = 0.122), demonstrating similar consumption between the two ice creams (Figure 5C). Among the patient characteristics examined, liver stiffness measurement (LSM) emerged as the only significant predictor of ice cream consumption (β = -0.812, 95% CI: -1.432 to -0.193, t(95) = -2.570, p = 0.012). This negative association indicated that participants with higher liver stiffness consumed slightly less ice cream, with each 1 kPa increase in LSM associated with an approximately 0.81% decrease in consumption (Figure 5B). This relationship was consistent across both treatment groups, as evidenced by the parallel regression slopes. In contrast, the controlled attenuation parameter (CAP), a measure of hepatic steatosis, did not significantly predict consumption (β = 0.018, 95% CI: -0.026 to 0.062, p = 0.432). Similarly, age (p = 0.198), sex (p = 0.261), BMI (p = 0.304), diabetes status (p = 0.979), period (p = 0.263), and sequence (p = 0.787) were not associated with the consumption levels (Figure 5D). The random effects’ structure revealed substantial between-patient variability in baseline consumption (variance = 20.80, SD = 4.56) and residual within-patient variability (variance = 53.46, SD = 7.31). The model was fitted using the restricted maximum likelihood (REML criterion = 1453.05) and included 206 observations from 103 patients.
3.4.4. Subgroup Analyses
To explore whether treatment effects varied according to patient characteristics, we conducted exploratory subgroup analyses by adding interaction terms to the primary cumulative link mixed model. We examined six covariates: diabetes status, sex, age, BMI, controlled attenuation parameter (CAP), and liver stiffness measurement (LSM). A statistically significant interaction was detected between treatment and LSM category (LR χ²(2) = 12.26, p = 0.002), indicating that the treatment effect varied according to the liver stiffness levels. However, no significant interactions were observed for diabetes status, sex, age, BMI, or CAP, indicating that the high acceptance of both formulations was consistent across these patient subgroups.
The LSM interaction model revealed that the effect of brazzein versus sucrose on overall impression varied with liver stiffness levels (interaction coefficient = -0.873, SE = 0.359, p = 0.015) (Figure 6).
Specifically, for each 1 kPa increase in LSM, the log-odds of higher acceptance ratings increased by 0.646 for sucrose (p = 0.111) but decreased by 0.227 for brazzein (combined effect: 0.646–0.873 = -0.227). Despite this statistical interaction, acceptance rates remained consistently high (>95%) for both sweeteners across all LSM quartiles. The minimal absolute differences in acceptance rates suggest that, although statistically significant, this interaction may have limited clinical or practical relevance.
To complement the primary analysis, we conducted a supplementary paired mean difference analysis, treating sensory ratings as interval-level measurements (Figure 7). For each participant, we calculated the difference between the brazzein-sweetened and sucrose-sweetened ice cream ratings for each sensory attribute. Mean differences with 95% confidence intervals (CIs) were computed and stratified by liver stiffness measurement level (<9.6 kPa vs. ≥9.6 kPa), which corresponded with non-advanced (<F3) and advanced (F3-F4) liver fibrosis.
An equivalence margin of ±0.3 was established a priori to assess practical significance, representing a clinically meaningful difference on the 5-point hedonic scale. In the LSM <9.6 kPa stratum (n=90 pairs), all sensory attributes had 95% CIs within ±0.3 between brazzein and sucrose ice cream. Specifically, the mean differences ranged from -0.144 (Aroma and Flavor) to -0.011 (appearance), with all CIs contained within the equivalence boundaries. In contrast, the LSM ≥9.6 kPa stratum (n=13 pairs) exhibited greater variability, and several attributes had 95% CIs extending beyond ±0.3. Color (mean difference: -0.154, 95% CI: -0.381 to 0.073), texture (-0.462, 95% CI: -0.992 to 0.068), flavor (-0.385, 95% CI: -0.778 to 0.008), and Overall Impression (-0.462, 95% CI: -0.861 to -0.063) had 95% CIs extending beyond the ±0.3 equivalence margin (Figure 7). The wider confidence intervals in this subgroup reflect both the smaller sample size and the potentially greater heterogeneity in sensory perception among participants with higher liver stiffness. These exploratory findings suggest greater uncertainty and possible heterogeneity in participants with higher liver stiffness, but they should be interpreted cautiously because of the small subgroup size.
4. Discussion
4.1. Summary of Main Findings
This double-blind, randomized crossover sensory study represents the first evaluation of brazzein-sweetened ice cream in 103 patients with MASLD, a population for whom sugar reduction is a critical dietary intervention. The study yielded several important findings regarding the consumer acceptability and sensory profile of brazzein as a sugar replacement strategy in frozen milk desserts. The primary objective was to determine whether the brazzein product was sensorially non-inferior and equivalent to the sucrose control in terms of overall impression on a 5-point hedonic scale. Across the whole sample, brazzein ice cream met both the pre-specified non-inferiority and equivalence criteria for overall impression, with mean differences well within the ±0.3-point equivalence margin and overlapping confidence intervals. Acceptance based on top-2 box ratings (overall impression ≥4) was very high and almost identical for both formulations. Consumption analysis revealed no significant difference between brazzein- and sucrose-sweetened ice creams, with both formulations achieving exceptionally high consumption rates (>98%). The only significant predictor of consumption was liver stiffness, suggesting that patients with more advanced liver fibrosis may have a slightly reduced appetite or tolerance for sweet foods or a disturbed perception of sweet flavor. These findings support the conclusion that brazzein is an acceptable alternative to sucrose in terms of palatability and consumption by patients with MASLD.
Secondary analyses showed that individual sensory attributes (appearance, color, aroma, texture, and flavor) were broadly consistent with the primary result, indicating that replacing sucrose with brazzein did not meaningfully compromise these dimensions in this matrix. Although a small numerical advantage for sucrose was observed for some attributes, the observed differences were generally small and of limited practical magnitude. Subgroup analyses suggested that these findings were consistent across age, sex, diabetes status, and hepatic steatosis. In patients with higher LSM values, sucrose-based ice cream tended to receive higher hedonic scores, and equivalence margins were not always met. Nevertheless, acceptance remained very high in this subgroup, and the observed differences were modest.
4.2. Brazzein vs Sucrose in Ice Cream: Positioning Within Sensory Literature
The reduction of sugar in ice cream often comes at a sensory cost. Studies on products sweetened with high-intensity sweeteners and sugar alcohols frequently report penalties in flavor, aftertaste, or texture, which can reduce overall liking and limit consumer acceptance. When used alone, both sucralose and stevia often result in lower consumer liking than sucrose, mainly due to altered taste profiles and, for stevia, increased bitterness and lingering aftertaste [33,34,35]. Erythritol, especially in blends, can help mimic the sensory qualities of sucrose, reducing bitterness and chemical aftertastes. It also contributes to a cooling effect and can alter the texture, increasing the firmness and melting stability [36]. Neotame and aspartame have shown promise in maintaining desirable sensory characteristics, particularly smoothness and chocolate flavor, which are critical for consumer acceptance; however, they are accepted at lower levels than neosucralose blends [37,38]. Due to the disadvantages of using a single artificial or natural sweetener instead of sucrose in ice cream, recent studies have shown that their combinations approximate sucrose-like properties [34,38]. Thus, sensory parity with full-sugar ice cream was achieved by using a combination of low-glycemic-index sugars (tagatose, erythritol, and trehalose) with sucralose for sweetness adjustment [39], emphasizing the critical importance of matching freezing curves and rheological properties. Similarly, the current study's approach of combining brazzein with bulking agents to replace both the sweetness and functional properties of sucrose aligns with this established best practice. Against this backdrop, the present findings are notable in showing that brazzein-sweetened vanilla ice cream achieved hedonic ratings and consumption levels comparable to those of a conventional sucrose-sweetened product in a clinically relevant population. The fact that 80.6% of the participants rated both sweeteners identically represents a notable achievement in iso-sweet formulation development. This finding is consistent with that of a previous study in which the blending of several sweeteners achieved the sensory quality of sucrose in ice cream [34,36]; however, our brazzein formulation achieved non-inferiority and equivalence as a single sweetener ingredient. This simplicity offers practical advantages for product development and clean label positioning. The sensitivity of the crossover design in detecting subtle sensory differences strengthens our conclusion that brazzein successfully replicates the sensory profile of sucrose. While statistical analysis revealed a minimal mean difference of -0.146 points favoring sucrose, this difference falls well below the established thresholds for practical significance in consumer preference, with Cliff's delta of 0.126 indicating a negligible effect size.
From a sensory standpoint, the numerical advantage of sucrose in some attributes was unsurprising. Sweet proteins, such as brazzein, have distinct temporal and qualitative sweetness profiles, and subtle differences in sweetness onset, persistence, or aftertaste may be detectable under controlled testing conditions. However, the crucial point is that these differences did not translate into a meaningful loss of hedonic value. The near-identical top-2 box acceptance and very high consumption indicate that, at the tested concentration and in the tested matrix, brazzein provided a sweetness experience that participants were willing to treat as effectively interchangeable with sucrose. Our use of Multiple Correspondence Analysis further supports this interpretation. The two formulations occupied largely overlapping regions in the sensory configuration, suggesting that the participants perceived them as very similar at the multivariate level (Figure 4). This pattern contrasts with the more clearly separated sensory profiles often reported when sucrose is replaced by more traditional high-intensity sweeteners and suggests that brazzein may offer advantages for sugar reduction in frozen milk desserts from the perspective of practical sensory comparability.
Among sweet proteins, brazzein offers distinct advantages over thaumatin and monellin for ice cream applications. Thaumatin, despite being the most commercialized sweet protein, is primarily used as a flavor enhancer at 50 mg/kg, rather than as a complete sugar replacer [40]. The heat lability of monellin above the 50°C limit restricts its use in processed foods, although this may be less problematic for frozen desserts [41]. Our results indicate that brazzein at 0.014% concentration provides a useful sugar replacement without limitations reported for other sweet proteins, positioning it as a superior alternative within this emerging category of natural high-intensity sweeteners, at least for frozen milk desserts.
4.3. Implications for Sugar Reduction and Dietary Management in MASLD
Patients with MASLD are routinely advised to reduce their intake of added sugars, particularly from sugar-sweetened beverages and energy-dense snacks [42,43]. These recommendations are based on the results of randomized clinical studies showing that even a short-term reduction in carbohydrate intake in patients with MASLD significantly improves hepatic triglyceride content, triglyceridemia, lipid oxidation, and insulin resistance [44,45]. While such recommendations are clinically justified, long-term adherence is challenging, especially when they imply giving up familiar indulgent foods, such as ice cream. In this context, the present study provides encouraging evidence that a brazzein-sweetened vanilla ice cream can preserve the sensory pleasure and consumption behaviors associated with a sucrose-based product.
From a behavioral and nutritional standpoint, this is important for two reasons. First, sensory equivalence is a prerequisite for real-world substitution: if a sugar-reduced product is perceived as inferior, consumers may initially try it but will be unlikely to adopt it in the long term [46,47]. Second, the combination of high hedonic ratings and near-complete consumption suggests that the brazzein product is not only acceptable in principle but is also actually eaten in practice under test conditions. Although our study did not assess long-term purchasing or consumption patterns, these findings support the feasibility of using brazzein-based frozen milk desserts as part of a broader sugar-reduction strategy for individuals with MASLD. It is also plausible that these implications extend beyond MASLD. While our sample consisted of patients under specialist care, many were typical adult consumers. If similar sensory results are obtained in non-clinical populations and in more naturalistic settings, brazzein-sweetened ice cream could serve as both a targeted option for patients with metabolic diseases and a mainstream product for sugar-conscious consumers.
4.4. Disease-Related Differences in Sensory Perception: The Liver Stiffness Signal
A novel aspect of this study was the exploration of liver fibrosis as a potential moderator of the sensory responses. In participants with lower LSM values, brazzein and sucrose showed close similarity across overall impression and individual sensory attributes. In contrast, among participants with LSM values compatible with advanced fibrosis, sucrose received slightly higher ratings, and some sensory attributes fell outside the predefined equivalence margin.
These findings should be interpreted cautiously because of the small size of the advanced fibrosis subgroup and the exploratory nature of the analysis. Nonetheless, they raise the possibility that the progression of liver disease in patients with MASLD may be associated with subtle changes in taste or texture perception or in the hedonic evaluation of specific sweeteners. The intensity of taste sensation for sucrose is increased in patients with chronic hepatitis C compared to controls, especially in those with advanced fibrosis; however, no significant differences were found in the hedonic response to sucrose [48]. In contrast, an earlier study showed that food sample tests indicated that patients with liver disease are less likely to find food sweet [49]. In general, in patients with MASLD, the prevalence of dysgeusia was found to increase with liver disease progression, appearing significantly higher in advanced fibrosis (65%) than in non-advanced disease (5%) [50]. Potential mechanisms include systemic inflammation, changes in nutrient status, medication effects, oral health issues, and alterations in central reward pathways. A recent study showed that 6 months of treatment of patients with liver diseases with 100 mg zinc resulted in an improvement in perception threshold higher than 55% for several tastes, including sweet [51]. At present, the clinical and practical relevance of the observed interaction remains uncertain, since the overall acceptance of the brazzein product remained high, even among patients with elevated liver stiffness. However, this signal is intriguing and warrants more targeted investigation in future studies focused specifically on sensory function in patients with advanced liver disease.
4.5. Methodological and Sensometric Considerations
This study also methodologically contributes to the sensory evaluation of sugar-reduced products. First, we treated hedonic ratings as ordinal outcomes and applied cumulative link mixed models rather than relying solely on mean comparisons. This approach respects the measurement properties of the 5-point scale while accommodating the crossover design and within-subject correlation. The use of odds ratios and predicted probabilities of scoring in the top categories provides an interpretable link between the statistical output and consumer-relevant metrics. Because top-category acceptance was near ceiling for both products, these model-based probabilities should be interpreted primarily as supportive summaries rather than as highly discriminating measures of between-product difference.
The equivalence between the 9-point and 5-point hedonic scales depends on various contextual factors, including the consumer group being tested, cultural influences, and specific characteristics of the products being evaluated. We selected a 5-point scale for its ease of use and good performance in the elderly, as we expected to have many older patients enrolled. In a study comparing four acceptance methods, the 5-point hedonic scale was found to be comparable or even better at discriminating between samples than the 9-point hedonic scale for elderly participants, and at the same time, for younger adults, both scales showed relatively similar discriminability [52]. Moreover, in some cultural contexts, translating the verbal anchors for a 9-point scale can be challenging due to a lack of fully equivalent terms; therefore, consumers may naturally express their degree of liking on a 3-point or 5-point basis, making shorter scales more relevant and easier to use [53].
Second, we adopted an explicit non-inferiority and equivalence framework. When the practical question is whether a sugar-reduced formulation can replace a sucrose product without a meaningful loss of liking, traditional null-hypothesis tests for “any difference” are of limited utility [54]. By pre-specifying an equivalence margin on the hedonic scale, we were able to formally test whether any observed differences were small enough to be considered negligible from the consumer perspective. This aligns with recent calls in sensometrics to move beyond simple tests of difference and toward decision-oriented inferential frameworks [55,56].
The chosen equivalence margin should be interpreted as a practical decision threshold rather than a universal sensory constant. The sensory literature supports the use of similarity and equivalence testing when the goal is to determine whether products are close enough for the intended purpose [56,57,58], but it does not define a single negligible-difference value for 5-point hedonic scales. In the present study, the margin of ±0.3 points was selected to represent a small and practically unimportant difference on the raw liking scale, consistent with the high proportion of exact within-subject agreement between products. Thus, the equivalence framework was intended to assess practical comparability for product replacement, not to claim exact sensory equality between brazzein- and sucrose-sweetened ice cream.
Finally, we conducted standard diagnostics for crossover design validity and addressed the evidence of carryover in several sensory attributes. Together, these elements strengthen the confidence in the robustness of our findings.
4.6. Strengths and Limitations
The key strengths of the present study include the clinically characterized MASLD sample, double-blind randomized crossover design, and combination of subjective and behavioral endpoints. Objective measures of liver steatosis and stiffness allowed us to precisely define the target population and explore disease-related moderators. The use of a realistic 100 g portion and actual consumption, rather than only hypothetical liking, increases the ecological validity. However, this study has several limitations. The study was conducted at a single center and in one cultural context, which may limit its generalizability to other populations with different food cultures or expectations regarding sweetness and ice cream. Only one flavor (vanilla) and one brazzein concentration were tested; thus, the results may not be directly extrapolated to other flavors or levels of sugar reduction. We used a 5-point hedonic scale, which is simple and suitable for clinical settings but offers less discrimination than 7- or 9-point scales and does not capture the ideal intensity or just-about-right judgments. We also did not include direct measures of sweetness intensity, aftertaste, temporal profiles, or emotional responses, which could have provided a more nuanced picture of how brazzein and sucrose differ in terms of sensory perception. Finally, the subgroup with advanced fibrosis was relatively small; therefore, the liver stiffness interaction should be considered exploratory and hypothesis-generating rather than definitive.
4.7. Practical Implications and Future Research
Despite these limitations, our findings have several practical implications. For product developers, brazzein is a promising sweetener for sugar reduction in ice cream, capable of delivering sensory and behavioral responses comparable to those of a sucrose-based product in a clinically relevant group of consumers. For clinicians and dietitians working with patients with MASLD, incorporating such products into dietary recommendations could offer a way to reduce added sugar intake while preserving access to familiar indulgent foods, potentially improving adherence to long-term dietary changes and promoting liver health.
Future research should aim to replicate these findings in larger and more diverse samples, including healthy consumers, and extend testing to other flavors and product categories. Studies incorporating more detailed sensory profiling (e.g., just-about-right scales, temporal dominance of sensations, emotional and situational measures) could clarify which aspects of the sweetness experience differ meaningfully between brazzein and sucrose. Longitudinal or repeated exposure designs would be valuable in determining whether any small initial differences in hedonic response diminish with familiarity. Finally, dedicated studies on sensory perception across the spectrum of liver disease could help elucidate whether and how advanced fibrosis modifies responses to different sweeteners, including sweet proteins such as brazzein.
5. Conclusions
This double-blind, randomized crossover sensory study provides the first evidence of consumer acceptability of brazzein-sweetened ice cream among individuals with MASLD. Brazzein-sweetened ice cream achieved consumer acceptability comparable to that of conventional sucrose-sweetened ice cream, demonstrating the viability of brazzein as a natural sweetener alternative for frozen milk desserts. These findings support the potential integration of brazzein-sweetened frozen desserts into dietary management strategies for MASLD, offering patients a palatable sugar-reduced option that may enhance long-term dietary adherence without compromising the therapeutic goals.
Supplementary Materials
The following supporting information can be downloaded at: Preprints.org, Table A1: Inclusion and exclusion criteria of the study; Table A2: Carryover effect analysis results for sensory attributes; Table A3: Analysis of hedonic rating (5-point scale) of sensory attributes between brazzein and sucrose sweetened ice cream during Period 1.
Author Contributions
VI: Conceptualization, Methodology, Writing- Original draft preparation, Review and Editing, Supervision. AG: Investigation, Data curation, Software, Formal Analysis, Writing- Review and Editing. VP: Visualization, Investigation, Writing- Review and Editing. AS: Investigation, Formal Analysis, Writing- Review and Editing. AK: Resources, Investigation, Software, Validation, Writing- Reviewing and Editing. VB: Resources, Investigation, Validation, Writing- Reviewing and Editing. All authors accepted the responsibility for the content of the manuscript and consented to its submission, reviewed all the results, and approved the final version of the manuscript.
Funding
This work was supported by the Russian Science Foundation [# 19-76-30014].
Institutional Review Board Statement
The study was conducted in accordance with the Declaration of Helsinki and approved by the Ethics Committee of Federal Research Centre of nutrition, biotechnology and food safety, Moscow, Russia. (protocol #9 of 28.10.2024).
Informed Consent Statement
Informed consent was obtained from all subjects involved in the study.
Data Availability Statement
The data are available upon request from correspondent author due to legal restrictions.
Acknowledgments
The authors used Paperpal (AI-assisted language editing) to improve grammar, clarity, and style in the manuscript. The authors used EndNote with an AI-assisted feature to support reference checking and formatting consistency. No generative AI tool was used to create, fabricate, or alter study data, results, or figures, nor to generate scientific content in place of the authors’ own analysis and interpretation. All substantive content, including study design, data analysis, results, interpretation, and final wording, was developed and verified by the authors, who take full responsibility for the integrity of the work.
Conflicts of Interest
The authors declare no conflicts of interest.
Abbreviations
The following abbreviations are used in this manuscript:
| CAP | Controlled attenuation parameter |
| CLMM | Cumulative link mixed model |
| GLMM | Generalized linear mixed model |
| LSM | Liver stiffness measurement |
| MASL | Metabolic dysfunction-associated steatotic liver |
| MASLD | Metabolic dysfunction-associated steatotic liver disease |
| MASH | Metabolic dysfunction-associated steatohepatitis |
| MCA | Multiple Correspondence Analysis |
| REML | Restricted maximum likelihood |
| STROBE | Strengthening the Reporting of Observational Studies in Epidemiology |
| TOST | Two one-sided tests |
| VCTE | Vibration-controlled transient elastography |
Appendix A

Table A1.
Inclusion and exclusion criteria of the study.
| Criteria | |
|---|---|
| Inclusion criteria |
|
| Exclusion criteria |
|
Table A2.
Carryover effect analysis results for sensory attributes.
| Attribute | W_statistic | p_value | Interpretation |
|---|---|---|---|
| appearance | 5.0 | 0.5716 | No significant carryover |
| color | 3.5 | 0.1294 | No significant carryover |
| aroma | 18.0 | 0.0238 | Significant carryover detected |
| texture | 30.0 | 0.0197 | Significant carryover detected |
| flavor | 85.0 | 0.0071 | Significant carryover detected |
Table A3.
Analysis of hedonic rating (5-point scale) of sensory attributes between brazzein. and sucrose sweetened ice cream during Period 1.*
Table A3.
Analysis of hedonic rating (5-point scale) of sensory attributes between brazzein. and sucrose sweetened ice cream during Period 1.*
| Attribute | Brazzein mean | Sucrose mean | Odds ratio (95% CI) | p value |
|---|---|---|---|---|
| Appearance | 4.978 | 4.983 | 0.772 (0.047, 12.689) | 0.8562 |
| Color | 5.000 | 5.000 | Not estimable | — |
| Aroma | 4.711 | 4.776 | 0.739 (0.240, 2.278) | 0.5985 |
| Texture | 4.911 | 4.914 | 0.587 (0.125, 2.765) | 0.5007 |
| Flavor | 4.800 | 4.776 | 0.810 (0.293, 2.234) | 0.6833 |
* Mean ratings are presented for descriptive purposes only. Because median ratings were uniformly 5 for both products across sensory attributes, medians are not shown. Statistical comparisons were performed on Period 1 data using cumulative link models that treated the 5-point hedonic scores as ordinal outcomes. Because the Period 1 subset contains one observation per participant, participant-level random effects were not estimable, and models were fitted without random effects. Odds ratios greater than 1 indicate higher odds of a higher rating for brazzein relative to sucrose. Period 1 included 45 brazzein observations and 58 sucrose observations. Color was not estimable because all observations had the same score.
References
- Feng, G.; Targher, G.; Byrne, C.D.; Yilmaz, Y.; Wai-Sun Wong, V.; Adithya Lesmana, C.R.; Adams, L.A.; Boursier, J.; Papatheodoridis, G.; El-Kassas, M., et al. Global burden of metabolic dysfunction-associated steatotic liver disease, 2010 to 2021. JHEP Reports 2025, 7, 101271. [CrossRef]
- Golabi, P.; Isakov, V.; Younossi, Z.M. Nonalcoholic Fatty Liver Disease: Disease Burden and Disease Awareness. Clinics in liver disease 2023, 27, 173–186. [CrossRef]
- Kanwal, F.; Neuschwander-Tetri, B.A.; Loomba, R.; Rinella, M.E. Metabolic dysfunction–associated steatotic liver disease: Update and impact of new nomenclature on the American Association for the Study of Liver Diseases practice guidance on nonalcoholic fatty liver disease. Hepatology 2024, 79, 1212–1219. [CrossRef]
- Tacke, F.; Horn, P.; Wai-Sun Wong, V.; Ratziu, V.; Bugianesi, E.; Francque, S.; Zelber-Sagi, S.; Valenti, L.; Roden, M.; Schick, F., et al. EASL-EASD-EASO Clinical Practice Guidelines on the management of metabolic dysfunction-associated steatotic liver disease (MASLD). Journal of Hepatology 2024, 81, 492–542. [CrossRef]
- Kokkorakis, M.; Boutari, C.; Hill, M.A.; Kotsis, V.; Loomba, R.; Sanyal, A.J.; Mantzoros, C.S. Resmetirom, the first approved drug for the management of metabolic dysfunction-associated steatohepatitis: Trials, opportunities, and challenges. Metabolism: clinical and experimental 2024, 154, 155835. [CrossRef]
- Petta, S.; Kim, K.; Targher, G.; Romeo, S.; Sookoian, S.; Zheng, M.H.; Aghemo, A.; Valenti, L. Focus on Semaglutide 2.4 mg/week for the Treatment of Metabolic Dysfunction-Associated Steatohepatitis. Liver international : official journal of the International Association for the Study of the Liver 2025, 45, e70407. [CrossRef]
- Dobbie, L.J.; Burgess, J.; Hamid, A.; Nevitt, S.J.; Hydes, T.J.; Alam, U.; Cuthbertson, D.J. Effect of a Low-Calorie Dietary Intervention on Liver Health and Body Weight in Adults with Metabolic-Dysfunction Associated Steatotic Liver Disease (MASLD) and Overweight/Obesity: A Systematic Review and Meta-Analysis. Nutrients 2024, 16, 1030. [CrossRef]
- Pi, S.; Zhang, S.; Zhang, J.; Guo, Y.; Li, Y.; Deng, J.; Du, H. Low-carbohydrate diets reduce cardiovascular risk factor levels in patients with metabolic dysfunction-associated steatotic liver disease: a systematic review and meta-analysis of randomized controlled trials. Front Nutr 2025, 12, 1626352. [CrossRef]
- Lee, Y.C.; Lee, H.S.; Jeon, S.; Lee, Y.J.; Kwon, Y.J.; Lee, J.W. Assessing Nutritional Factors for Metabolic Dysfunction-Associated Steatotic Liver Disease via Diverse Statistical Tools. Diabetes Metab J 2025, 50, 178–189. [CrossRef]
- Hartmann, P.; Mouzaki, M.; Hassan, S.; Kehar, M.; Mysore, K.R.; Mauney, E.; Nonga, D.; Karjoo, S.; Sood, S.; Tou, A., et al. Call to action-Pediatric MASLD requires immediate attention to curb health crisis. Hepatology 2025, 82, 1341–1351. [CrossRef]
- Malespin, M.H.; Barritt, A.S.t.; Watkins, S.E.; Schoen, C.; Tincopa, M.A.; Corbin, K.D.; Mospan, A.R.; Munoz, B.; Trinh, H.N.; Weiss, L.M., et al. Weight Loss and Weight Regain in Usual Clinical Practice: Results From the TARGET-NASH Observational Cohort. Clin Gastroenterol Hepatol 2022, 20, 2393–2395 e2394. [CrossRef]
- Funuyet-Salas, J.; Martin-Rodriguez, A.; Perez-San-Gregorio, M.A.; Romero-Gomez, M. Influence of Psychological Biomarkers on Therapeutic Adherence by Patients with Non-Alcoholic Fatty Liver Disease: A Moderated Mediation Model. J Clin Med 2021, 10, 2208. [CrossRef]
- Goff, H.D.; Hartel, R.W. Ice Cream, 7 ed.; Springer: New York, NY, 2013; pp. 462.
- Ming, D.; Hellekant, G. Brazzein, a new high-potency thermostable sweet protein from Pentadiplandra brazzeana B. FEBS Lett. 1994, 355, 106–108. [CrossRef]
- Kant, R. Sweet proteins--potential replacement for artificial low calorie sweeteners. Nutrition journal 2005, 4, 5. [CrossRef]
- Novik, T.S.; Koveshnikova, E.I.; Kotlobay, A.A.; Sycheva, L.P.; Kurochkina, K.G.; Averina, O.A.; Belopolskaya, M.V.; Sergiev, P.V.; Dontsova, O.A.; Lazarev, V.N., et al. Sweet-Tasting Natural Proteins Brazzein and Monellin: Safe Sugar Substitutes for the Food Industry. Foods 2023, 12, 4065. [CrossRef]
- FDA, U.S. GRN No.1142 Brazzein produced by Komagataella phaffii expressing a gene encoding for brazzein from Pentadiplandra brazzeana. 2024.
- FDA, U.S. GRN No.1207 Brazzein preparation produced by Aspergillus oryzae 90402 expressing a gene encoding for brazzein from Pentadiplandra brazzeana. 2025.
- Jiang, P.; Ji, Q.; Liu, Z.; Snyder, L.A.; Benard, L.M.; Margolskee, R.F.; Max, M. The cysteine-rich region of T1R3 determines responses to intensely sweet proteins. The Journal of biological chemistry 2004, 279, 45068–45075. [CrossRef]
- Ghanavatian, P.; Khalifeh, K.; Jafarian, V. Structural features and activity of Brazzein and its mutants upon substitution of a surfaced exposed alanine. Biochimie 2016, 131, 20–28. [CrossRef]
- Zeece, M. Flavors. In Introduction to the Chemistry of Food, Elsevier: 2020; 10.1016/b978-0-12-809434-1.00006-2pp. 213–250.
- Izawa, K.; Amino, Y.; Kohmura, M.; Ueda, Y.; Kuroda, M. 4.16 - Human–Environment Interactions – Taste. In Comprehensive Natural Products II, Liu, H.-W., Mander, L., Eds. Elsevier: Oxford, 2010; pp. 631–671. [CrossRef]
- Rajan, V.; Howard, J.A. Brazzein: A Natural Sweetener. In Sweeteners: Pharmacology, Biotechnology, and Applications, Mérillon, J.-M., Ramawat, K.G., Eds. Springer International Publishing: Cham, 2018; 10.1007/978-3-319-27027-2_3pp. 17–33.
- Kim, H.; Kang, J.; Hong, S.; Jo, S.; Noh, H.; Kang, B.H.; Park, S.; Seo, Y.J.; Kong, K.H.; Hong, S. 3M-Brazzein as a Natural Sugar Substitute Attenuates Obesity, Metabolic Disorder, and Inflammation. Journal of agricultural and food chemistry 2020, 68, 2183–2192. [CrossRef]
- Lynch, B.; Wang, T.; Vo, T.; Tafazoli, S.; Ryder, J. Safety evaluation of oubli fruit sweet protein (brazzein) derived from Komagataella phaffii, intended for use as a sweetener in food and beverages. Toxicology Research and Application 2023, 7, 23978473231151258. [CrossRef]
- Veselovsky, V.A.; Boldyreva, D.I.; Olekhnovich, E.I.; Klimina, K.M.; Babenko, V.V.; Zakharevich, N.V.; Larin, A.K.; Morozov, M.D.; Zoruk, P.Y.; Sergiev, P.V., et al. Effect of the consumption of brazzein and monellin, two recombinant sweet-tasting proteins, on rat gut microbiota. Front Nutr 2024, 11, 1362529. [CrossRef]
- Schiatti-Siso, I.P.; Quintana, S.E.; Garcia-Zapateiro, L.A. Stevia (Stevia rebaudiana) as a common sugar substitute and its application in food matrices: an updated review. J Food Sci Technol 2023, 60, 1483–1492. [CrossRef]
- Abril, J.R.; Stull, J.W.; Taylor, R.R.; Angus, R.C.; Daniel, T.C. Characteristics of Frozen Desserts Sweetened with Xylitol and Fructose. Journal of Food Science 1982, 47, 472–475. [CrossRef]
- Kalicka, D.; Znamirowska, A.; Pawlos, M.; Buniowska, M.; Szajnar, K. Physical and sensory characteristics and probiotic survival in ice cream sweetened with various polyols. International Journal of Dairy Technology 2019, 72, 456–465. [CrossRef]
- Lacerda, R.C.C.; Andersen, G.H.; Junge, J.Y.; Kidmose, U.; Bolini, H.M.A. Perception and acceptance of natural sweeteners in a plant-based cocoa-flavored ice cream: Difference between Danish and Brazilian consumers. Journal of Sensory Studies 2024, 39, e12890. [CrossRef]
- Karlas, T.; Petroff, D.; Sasso, M.; Fan, J.G.; Mi, Y.Q.; de Ledinghen, V.; Kumar, M.; Lupsor-Platon, M.; Han, K.H.; Cardoso, A.C., et al. Individual patient data meta-analysis of controlled attenuation parameter (CAP) technology for assessing steatosis. J Hepatol 2017, 66, 1022–1030. [CrossRef]
- Tsochatzis, E.A.; Gurusamy, K.S.; Ntaoula, S.; Cholongitas, E.; Davidson, B.R.; Burroughs, A.K. Elastography for the diagnosis of severity of fibrosis in chronic liver disease: a meta-analysis of diagnostic accuracy. J Hepatol 2011, 54, 650–659. [CrossRef]
- de Medeiros, A.C.; Filho, E.R.T.; Bolini, H.M.A. Impact of Natural and Artificial Sweeteners Compounds in the Sensory Profile and Preference Drivers Applied to Traditional, Lactose-Free, and Vegan Frozen Desserts of Chocolate Flavor. Journal of Food Science 2019, 84, 2973–2982. [CrossRef]
- Long, M.; Wei, Y.; Tao, S.; Wu, Y.; Wang, J.; Zhou, D.; Cai, H.; Zhan, G. Ice cream with sucralose, stevioside, and erythritol as sugar substitutes: Sensory profile and customer preference. Food Science and Technology International 2023, 30, 273–281. [CrossRef]
- Muenprasitivej, N.; Tao, R.; Nardone, S.J.; Cho, S. The Effect of Steviol Glycosides on Sensory Properties and Acceptability of Ice Cream. Foods 2022, 11, 1745. [CrossRef]
- Moriano, M.E.; Alamprese, C. Honey, trehalose and erythritol as sucrose-alternative sweeteners for artisanal ice cream. A pilot study. LWT 2017, 75, 329–334. [CrossRef]
- Peres, J.; Esmerino, E.; da Silva, A.L.; Racowski, I.; Bolini, H. Sensory Profile, Drivers of Liking, and Influence of Information on the Acceptance of Low-Calorie Synbiotic and Probiotic Chocolate Ice Cream. Journal of Food Science 2018, 83, 1350–1359. [CrossRef]
- Palazzo, A.B.; Bolini, H.M.A. Sweeteners in diet chocolate ice cream: Penalty analysis and acceptance evaluation. J. Food Stud. 2017, 6, 1. [CrossRef]
- Whelan, A.P.; Vega, C.; Kerry, J.P.; Goff, H.D. Physicochemical and sensory optimisation of a low glycemic index ice cream formulation. International Journal of Food Science & Technology 2008, 43, 1520–1527. [CrossRef]
- Joseph, J.A.; Akkermans, S.; Nimmegeers, P.; Van Impe, J.F.M. Bioproduction of the Recombinant Sweet Protein Thaumatin: Current State of the Art and Perspectives. Front Microbiol 2019, 10, 695. [CrossRef]
- Saraiva, A.; Carrascosa, C.; Ramos, F.; Raheem, D.; Pedreiro, S.; Vega, A.; Raposo, A. Brazzein and Monellin: Chemical Analysis, Food Industry Applications, Safety and Quality Control, Nutritional Profile and Health Impacts. Foods 2023, 12, 1943. [CrossRef]
- Pekarska, K.; Brennan, P.N.; Ivancovsky Wajcman, D.; Towey, J.; Cox, L.; Weatherby, K.; McPherson, S.; Stine, J.; Willemse, J.; Li, W., et al. Nutrition in MASLD: a patient focused, evidence-based clinician’s guide. Frontline Gastroenterology 2025, 10.1136/flgastro-2025-103183, flgastro–2025–103183. [CrossRef]
- Simancas-Racines, D.; Annunziata, G.; Verde, L.; Fasci-Spurio, F.; Reytor-Gonzalez, C.; Muscogiuri, G.; Frias-Toral, E.; Barrea, L. Nutritional Strategies for Battling Obesity-Linked Liver Disease: the Role of Medical Nutritional Therapy in Metabolic Dysfunction-Associated Steatotic Liver Disease (MASLD) Management. Curr Obes Rep 2025, 14, 7. [CrossRef]
- London, A.; Richter, M.M.; Sjoberg, K.A.; Wewer Albrechtsen, N.J.; Povazan, M.; Drici, L.; Schaufuss, A.; Madsen, L.; Oyen, J.; Madsbad, S., et al. The impact of short-term eucaloric low- and high-carbohydrate diets on liver triacylglycerol content in males with overweight and obesity: a randomized crossover study. The American journal of clinical nutrition 2024, 120, 283–293. [CrossRef]
- Rinaldi, R.; De Nucci, S.; Donghia, R.; Donvito, R.; Cerabino, N.; Di Chito, M.; Penza, A.; Mongelli, F.P.; Shahini, E.; Zappimbulso, M., et al. Gender Differences in Liver Steatosis and Fibrosis in Overweight and Obese Patients with Metabolic Dysfunction-Associated Steatotic Liver Disease before and after 8 Weeks of Very Low-Calorie Ketogenic Diet. Nutrients 2024, 16, 1408. [CrossRef]
- Hutchings, S.C.; Low, J.Y.Q.; Keast, R.S.J. Sugar reduction without compromising sensory perception. An impossible dream? Critical reviews in food science and nutrition 2019, 59, 2287–2307. [CrossRef]
- Markey, O.; Lovegrove, J.A.; Methven, L. Sensory profiles and consumer acceptability of a range of sugar-reduced products on the UK market. Food Research International 2015, 72, 133–139. [CrossRef]
- Musialik, J.; Suchecka, W.; Klimacka-Nawrot, E.; Petelenz, M.; Hartman, M.; Blonska-Fajfrowska, B. Taste and appetite disorders of chronic hepatitis C patients. Eur J Gastroenterol Hepatol 2012, 24, 1400–1405. [CrossRef]
- Deems, R.O.; Friedman, M.I.; Friedman, L.S.; Munoz, S.J.; Maddrey, W.C. Chemosensory function, food preferences and appetite in human liver disease. Appetite 1993, 20, 209–216. [CrossRef]
- Dallio, M.; Romeo, M.; Di Nardo, F.; Napolitano, C.; Vaia, P.; Iadanza, G.; Olivieri, S.; Coppola, A.; Niosi, M.; Federico, A. Dysgeusia in MASLD-related advanced chronic liver disease (ACLD): a silent driver towards the "Bermuda" triangle of malnutrition-sarcopenia-frailty severely affecting prognosis. Nutrition journal 2025, 24, 10. [CrossRef]
- Juárez-Hernández, E.; López-Méndez, I.; Uribe, M.; Chávez-Tapia, N.; Meneses-Mayo, M. Zinc supplementation in patients with cirrhosis and dysgeusia: Randomized Clinical Trial. Proceedings of Scientific Research Universidad Anáhuac. Multidisciplinary Journal of Healthcare 2024, 4, 13–22. [CrossRef]
- Waimaleongora-ek, P.; Prinyawiwatkul, W. Comparison of discriminability of common food acceptance scales for the elderly. International Journal of Food Science and Technology 2020, 56, 148–157. [CrossRef]
- Addo-Preko, E.; Amissah, J.G.N.; Adjei, M.Y.B. The relevance of the number of categories in the hedonic scale to the Ghanaian consumer in acceptance testing. Frontiers in Food Science and Technology 2023, 3, 1071216. [CrossRef]
- Ennis, J.M.; Rousseau, B.; Ennis, D.M. Sensory Difference Tests as Measurement Instruments: a Review of Recent Advances. Journal of Sensory Studies 2014, 29, 89–102. [CrossRef]
- Meyners, M.; Carr, B.T.; Kunert, J. Equivalence and non-inferiority tests using replicated discrimination and preference data. Journal of Sensory Studies 2023, 38, e12882. [CrossRef]
- Bi, J. Similarity (equivalence) testing. In Sensory Discrimination Tests and Measurements, John Wiley&Sons: 2015. pp. 98–138. [CrossRef]
- Meyners, M. Least equivalent allowable differences in equivalence testing. Food Quality and Preference 2007, 18, 541–547. [CrossRef]
- Wichchukit, S.; O'Mahony, M. The 9-point hedonic scale and hedonic ranking in food science: some reappraisals and alternatives. J Sci Food Agric 2015, 95, 2167–2178. [CrossRef]
Figure 1.
Patients’ allocation chart.

Figure 2.
Primary paired analysis of overall impression. The treatment effect was defined as the mean within-subject paired difference in overall impression (Brazzein − sucrose), such that negative values indicate slightly higher ratings for sucrose. The black marker shows the estimated mean paired difference, the blue horizontal bar shows the 95% confidence interval used for non-inferiority assessment, and the red horizontal bar shows the 90% confidence interval used for equivalence assessment. The green shaded area represents the prespecified equivalence region (−0.3 to +0.3 points), with the vertical black line at 0 indicating no difference. Brazzein did not demonstrate superiority over sucrose (one-sided p = 0.998), because the observed mean difference was negative. However, the lower bound of the 95% confidence interval remained above the non-inferiority margin of −0.3, and the 90% confidence interval lay entirely within the equivalence region, supporting both non-inferiority and equivalence.

Figure 3.
Distribution of within-subject paired differences in overall impression between brazzein- and sucrose-sweetened ice cream. Paired difference was defined as brazzein − sucrose on the 5-point hedonic scale. A value of 0 indicates identical ratings for both products; negative values indicate higher ratings for sucrose, and positive values indicate higher ratings for brazzein. The black solid vertical line marks no difference, the green solid vertical line marks the mean paired difference (−0.146), and the red dashed lines indicate the prespecified equivalence margins of ±0.3 points. Most participants (80.6%) assigned identical ratings to both products, while 16.5% rated sucrose higher and 2.9% rated brazzein higher.

Figure 4.
Multiple Correspondence Analysis (MCA) of sensory attributes for brazzein-sweetened (blue) and sucrose-sweetened (red) ice cream samples. The first two dimensions explain 30.99% of the total variance (Dim 1: 16.96%, Dim 2: 14.03%). Dimension 1 represents a sensory quality gradient from low (positive values) to high (negative values) ratings across all attributes. Dimension 2 differentiates moderate (positive values) from extreme (negative values) sensory evaluations. Each point represents an individual tasting evaluation (n=206). Ellipses represent 95% confidence regions for each ice cream type. The substantial overlap between groups indicates similar multivariate sensory profiles between brazzein- and sucrose-sweetened ice creams based on appearance, color, aroma, texture, and flavor attributes.

Figure 5.
Comprehensive ice cream consumption analysis. Multi-panel figure combining all consumption analysis results. (A) Estimated marginal means by sweetener type with 95% confidence intervals. (B) Scatter plot showing the relationship between liver stiffness (LSM) and consumption, stratified by treatment. (C) Distribution of consumption percentages by sweetener type. (D) Forest plot of all fixed effects estimates with 95% confidence intervals. The analysis demonstrates similar consumption between brazzein and sucrose sweeteners (p = 0.122), with liver stiffness as the only significant predictor of consumption (p = 0.012). n = 103 participants, 206 total observations.

Figure 6.
Predicted acceptance of sucrose- and brazzein-sweetened ice cream across the range of liver stiffness measurement. Points show observed acceptance responses with slight vertical jitter for visualization, defined as an overall impression score of ≥4. Curves show model-derived predicted probabilities of acceptance obtained from a cumulative link mixed model fitted to the full ordinal overall-impression score, and shaded areas indicate 95% confidence intervals around the predicted probabilities. The model included fixed effects for sweetener, liver stiffness measurement, their interaction, sequence, and period, with participant as a random intercept. A significant sweetener-by-LSM interaction was observed (β = −0.863, SE = 0.355, p = 0.015), although predicted acceptance remained high for both sweeteners across the observed LSM range.

Figure 7.
Paired mean differences in sensory attributes between brazzein-sweetened and sucrose-sweetened ice cream, stratified by liver stiffness measurement (LSM). Points represent mean differences (brazzein - sucrose) with error bars indicating 95% confidence intervals. Blue points denote participants with LSM <9.6 kPa (n=90 pairs), and red points denote participants with LSM ≥9.6 kPa (n=13 pairs). The green shaded region represents the equivalence margin (±0.3), with dashed green lines marking the boundaries. The solid black vertical line indicates no difference (zero). Negative values indicate higher ratings for sucrose-sweetened ice cream.

Table 1.
Demographic and Clinical Characteristics of Study Participants.
| Characteristic | Overall (n = 103) |
Sequence A (n = 45) | Sequence B (n = 58) | p-value* |
|---|---|---|---|---|
| Age, years (mean ± SD) | 54.7 ± 9.7 | 54.6 ± 10.7 | 54.8 ± 9.0 | 0.918 |
| Sex, n (%) Male Female |
24 (23.3%) 79 (76.7%) |
11 (24.4%) 34 (75.6%) |
13 (22.4%) 45 (77.6%) |
0.995 |
| BMI, kg/m2 (mean ± SD) | 38.5 ± 6.2 | 38.8 ± 5.4 | 38.3 ± 6.7 | 0.678 |
| BMI category, n (%) | 0.582 | |||
| Overweight (25-29.9) Obese Class I (30-34.9) Obese Class II+ (≥35) |
2 (1.9%) 31 (30.1%) 69 (67.0%) |
0 (0.0%) 13 (28.9%) 32 (71.1%) |
2 (3.4%) 18 (31.0%) 37 (63.8%) |
|
| Diabetes, n (%) | 45 (43.7%) | 16 (35.6%) | 29 (50.0%) | 0.206 |
| Liver steatosis S3 n (%) | 83 (80.6%) | 36 (80.0%) | 47 (81.0%) | 1.000 |
| Liver fibrosis F3/F4 n (%) | 14 (13.6%) | 4 (8.9%) | 10 (17.2%) | 0.349 |
* p-values were calculated using the independent-samples t-test for continuous variables and the chi-square test or Fisher’s exact test, as appropriate, for categorical variables.
Disclaimer/Publisher’s Note: The statements, opinions and data contained in all publications are solely those of the individual author(s) and contributor(s) and not of MDPI and/or the editor(s). MDPI and/or the editor(s) disclaim responsibility for any injury to people or property resulting from any ideas, methods, instructions or products referred to in the content. |
© 2026 by the authors. Licensee MDPI, Basel, Switzerland. This article is an open access article distributed under the terms and conditions of the Creative Commons Attribution (CC BY) license (http://creativecommons.org/licenses/by/4.0/).
Copyright: This open access article is published under a Creative Commons CC BY 4.0 license, which permit the free download, distribution, and reuse, provided that the author and preprint are cited in any reuse.


