

Submitted:
09 April 2026
Posted:
10 April 2026
You are already at the latest version
Abstract
Identifying the main drivers of soil CO₂ emissions in tropical agroecosystems is essential for balancing productivity and climate mitigation. This study evaluated the effects of crop type, irrigation, phenological stage, and fertilization on soil respiration in a humid marshland system in Rwanda using a two-season field experiment. Five crops (maize, soybean, common bean, Irish potato, and Brachiaria) were grown under irrigated and rainfed conditions, and soil CO₂ emissions were measured across 19 sampling campaigns in both crop-covered and adjacent bare soil conditions in all plots. Crop type and growth stage were the dominant drivers of soil CO₂ emissions (p < 0.001), while irrigation had no significant direct effect despite increasing yields (p < 0.001). As a result, irrigation reduced yield-scaled CO₂ emissions for several crops (p < 0.05–0.01). Brachiaria showed higher emissions, particularly during the development stage, but its high bio-mass led to lower emissions per unit yield. Fertilization significantly increased soil respiration (p < 0.001), and emissions were higher under crop-covered soils than bare soils (p < 0.001). These findings indicate that crop traits and nutrient inputs primarily control soil respiration under moisture-sufficient tropical conditions.
Keywords:
soil respiration
; tropical agroecosystems
; crop type
; irrigation
; fertilization
; carbon emissions
1. Introduction
Soil respiration, defined as the release of carbon dioxide (CO₂) from soil through microbial decomposition of organic matter and plant root respiration, is a major component of the global carbon cycle. Agricultural soils contribute substantially to terrestrial CO₂ emissions, accounting for approximately 10–25% of total terrestrial fluxes depending on land use and management intensity [1,2]. Because soil respiration is highly sensitive to management practices, understanding how agricultural interventions regulate soil CO₂ emissions is essential for improving carbon budget assessments and developing climate-smart agricultural systems.
Among management practices, irrigation plays a key role in regulating soil respiration by altering soil moisture conditions that control microbial activity and root metabolism. In water-limited agroecosystems, irrigation can stimulate soil respiration by alleviating moisture constraints and promoting microbial decomposition and root activity [3]. However, responses are not uniform; while moderate moisture increases may enhance CO₂ emissions, excessive or prolonged wetting can restrict oxygen diffusion and suppress aerobic microbial processes, leading to reduced respiration rates [4]. These contrasting effects highlight the need for field-based assessments under realistic soil moisture conditions.
Crop type also strongly influences soil respiration through differences in root biomass, rooting depth, and rhizosphere interactions. Crops with larger or more active root systems typically exhibit higher soil CO₂ emissions due to increased root respiration and greater carbon inputs to the rhizosphere [5,6]. In addition, crop-specific root exudation patterns regulate microbial activity and organic matter turnover, resulting in substantial variation in soil respiration among crops grown under similar environmental conditions.
Soil respiration is further modulated by crop growth stages and associated changes in root development and microbial activity. Temporal variations in root biomass and physiological activity can lead to seasonal fluctuations in CO₂ emissions, particularly during early growth stages when root expansion and microbial stimulation are pronounced [7,8]. These dynamics indicate that the effects of irrigation and crop type on soil respiration are not static and must be evaluated across growing periods.
Another important aspect is the distinction between crop-covered and bare soil respiration. Vegetated soils generally exhibit higher CO₂ emissions due to combined root respiration and rhizosphere microbial activity, whereas bare soil respiration mainly reflects microbial decomposition of soil organic matter [9,10]. However, direct comparisons within the same experimental framework remain limited, particularly under contrasting irrigation regimes.
Despite substantial advances, important knowledge gaps remain. Few field-based studies have simultaneously assessed the combined effects of irrigation and multiple crop types while directly comparing crop-covered and bare soil respiration under realistic farming conditions. In addition, many studies rely on short-term measurements or controlled experiments that do not adequately capture seasonal variability in agricultural systems.
Therefore, this study aimed to evaluate the combined effects of irrigation and crop type on soil CO₂ emissions under marshland field conditions in Rwanda. Specifically, the objectives were to: (i) assess the effects of crop type and irrigation on soil CO₂ emissions across growth stages; (ii) compare emissions between crop-covered and bare soils; (iii) evaluate seasonal variation; and (iv) examine relationships between soil CO₂ emissions and environmental drivers.
2. Materials and Methods
2.1. Site Description
The field experiment was conducted in Tonga marshland, located in Huye District, Southern Province of Rwanda (2°35′9″ S, 29°43′23″ E). The marshland is owned by the University of Rwanda and has long served as an important agricultural site for local farmers. Historically, it was used for vegetable cultivation until 2014, after which parts of the land were converted to maize farming and clay extraction. Since 2017, a large section has been cultivated for rice production, while the slightly elevated area used in this study has been reserved for experimental research.
The site is characterized by a tropical wet and dry climate (Köppen classification), typical of Rwanda’s savanna regions. Mean monthly temperatures are consistently above 18 °C, and annual rainfall ranges between 1200- and 1400-mm. Rainfall follows a bimodal distribution, resulting in two cropping seasons: Season 1 (September–January) and Season 2 (February–May). Irrigation water was supplied from a natural stream traversing the marshland.
2.2. Soil Physical and Chemical Properties
Baseline soil analysis indicated relatively uniform physical properties across the soil profile and generally low soil fertility (Table 1 and Table 2). According to the United States Department of Agriculture (USDA) soil texture classification system, soils from 0 to 100 cm depth were classified as sandy loam, with sand contents ranging from 58% to 66%, silt from 26% to 29%, and clay from 8% to 13%. Bulk density increased with depth from 1.32 to 1.78 g cm⁻³, indicating greater compaction in subsoil layers, while gravimetric moisture content increased from 11.8% in the topsoil to 16.4% at 80–100 cm. Electrical conductivity increased with depth but remained within non-saline ranges.
Surface soil chemical properties (0–20 cm) indicated strong acidity and low nutrient status. Soil pH (H₂O) averaged 4.6. Organic carbon (1.7%) and total nitrogen (0.12%) were low, while available phosphorus ranged from low to moderate levels. Exchangeable base cations (Ca, Mg, and K) were generally low, and exchangeable sodium was very low. These conditions necessitated soil amendments, including lime and fertilizers, to support crop growth.
Physical and chemical properties at the study site are consistent with common soil conditions in Rwanda, where about 75% of soils are strongly acidic (pH < 5.5) and generally have low soil organic carbon (<3%), particularly outside valley swamps and natural forests [11]. Such highly weathered tropical soils typically have low base cation contents and limited inherent fertility due to intense weathering and long-term cultivation.
2.3. Fertilizer and Soil Amendment Management
To improve soil fertility and support crop growth, both organic and inorganic fertilizers was applied. Lime and compost were incorporated before planting to correct soil acidity and improve soil organic matter, while mineral fertilizers (DAP, Urea, KCl, and NPK 17:17:17) supplied essential macronutrients (N, P, and K). Fertilizer types, application rates, and nutrient compositions are summarized in Table 3 and Table 4.
Fertilizer application rates followed recommendations from the Rwanda Ministry of Agriculture, which provides region-specific guidelines based on soil classification. However, during the pilot cropping season (February–May 2024), crop performance was constrained partly due to insufficient potassium supply. As a result, we increased potassium application rates in the subsequent season (which was the first season of our study) through additional KCl application, ensuring adequate nutrient availability and more suitable conditions for assessing soil respiration responses under different water management and crop types. Fertilizers were placed around the crop root area at planting (crop initial growing stage) and during the first round of weeding performed in crop development stage. Fertilization effect was evaluated by comparing CO₂ emissions from crop covered conditions measured on the day before fertilizer application with those recorded two weeks later.
DAP: Diammonium phosphate; KCL: Muriate of Potash
The compost used in this study consisted of a mixture of farm-derived organic materials, primarily animal manure and crop residues (e.g., maize stover and bean haulms), following common composting practices in Rwanda. No laboratory analysis of the compost was conducted prior to application. Published agronomic studies from Rwanda and East Africa indicate that compost application rates of 5–15 t ha⁻¹ are commonly recommended to improve soil organic matter and nutrient supply in low-fertility tropical soils [12]. In addition, these studies report that similar dry composts typically contain approximately 0.8–1.5% total nitrogen, 0.4–0.8% P₂O₅, and 0.8–1.5% K₂O, with organic matter contents ranging from 30 to 50% [13]. However, only a fraction of these nutrients is immediately plant-available, as nutrient release from compost occurs gradually through mineralization.
2.4. Experimental Design and Crop Management
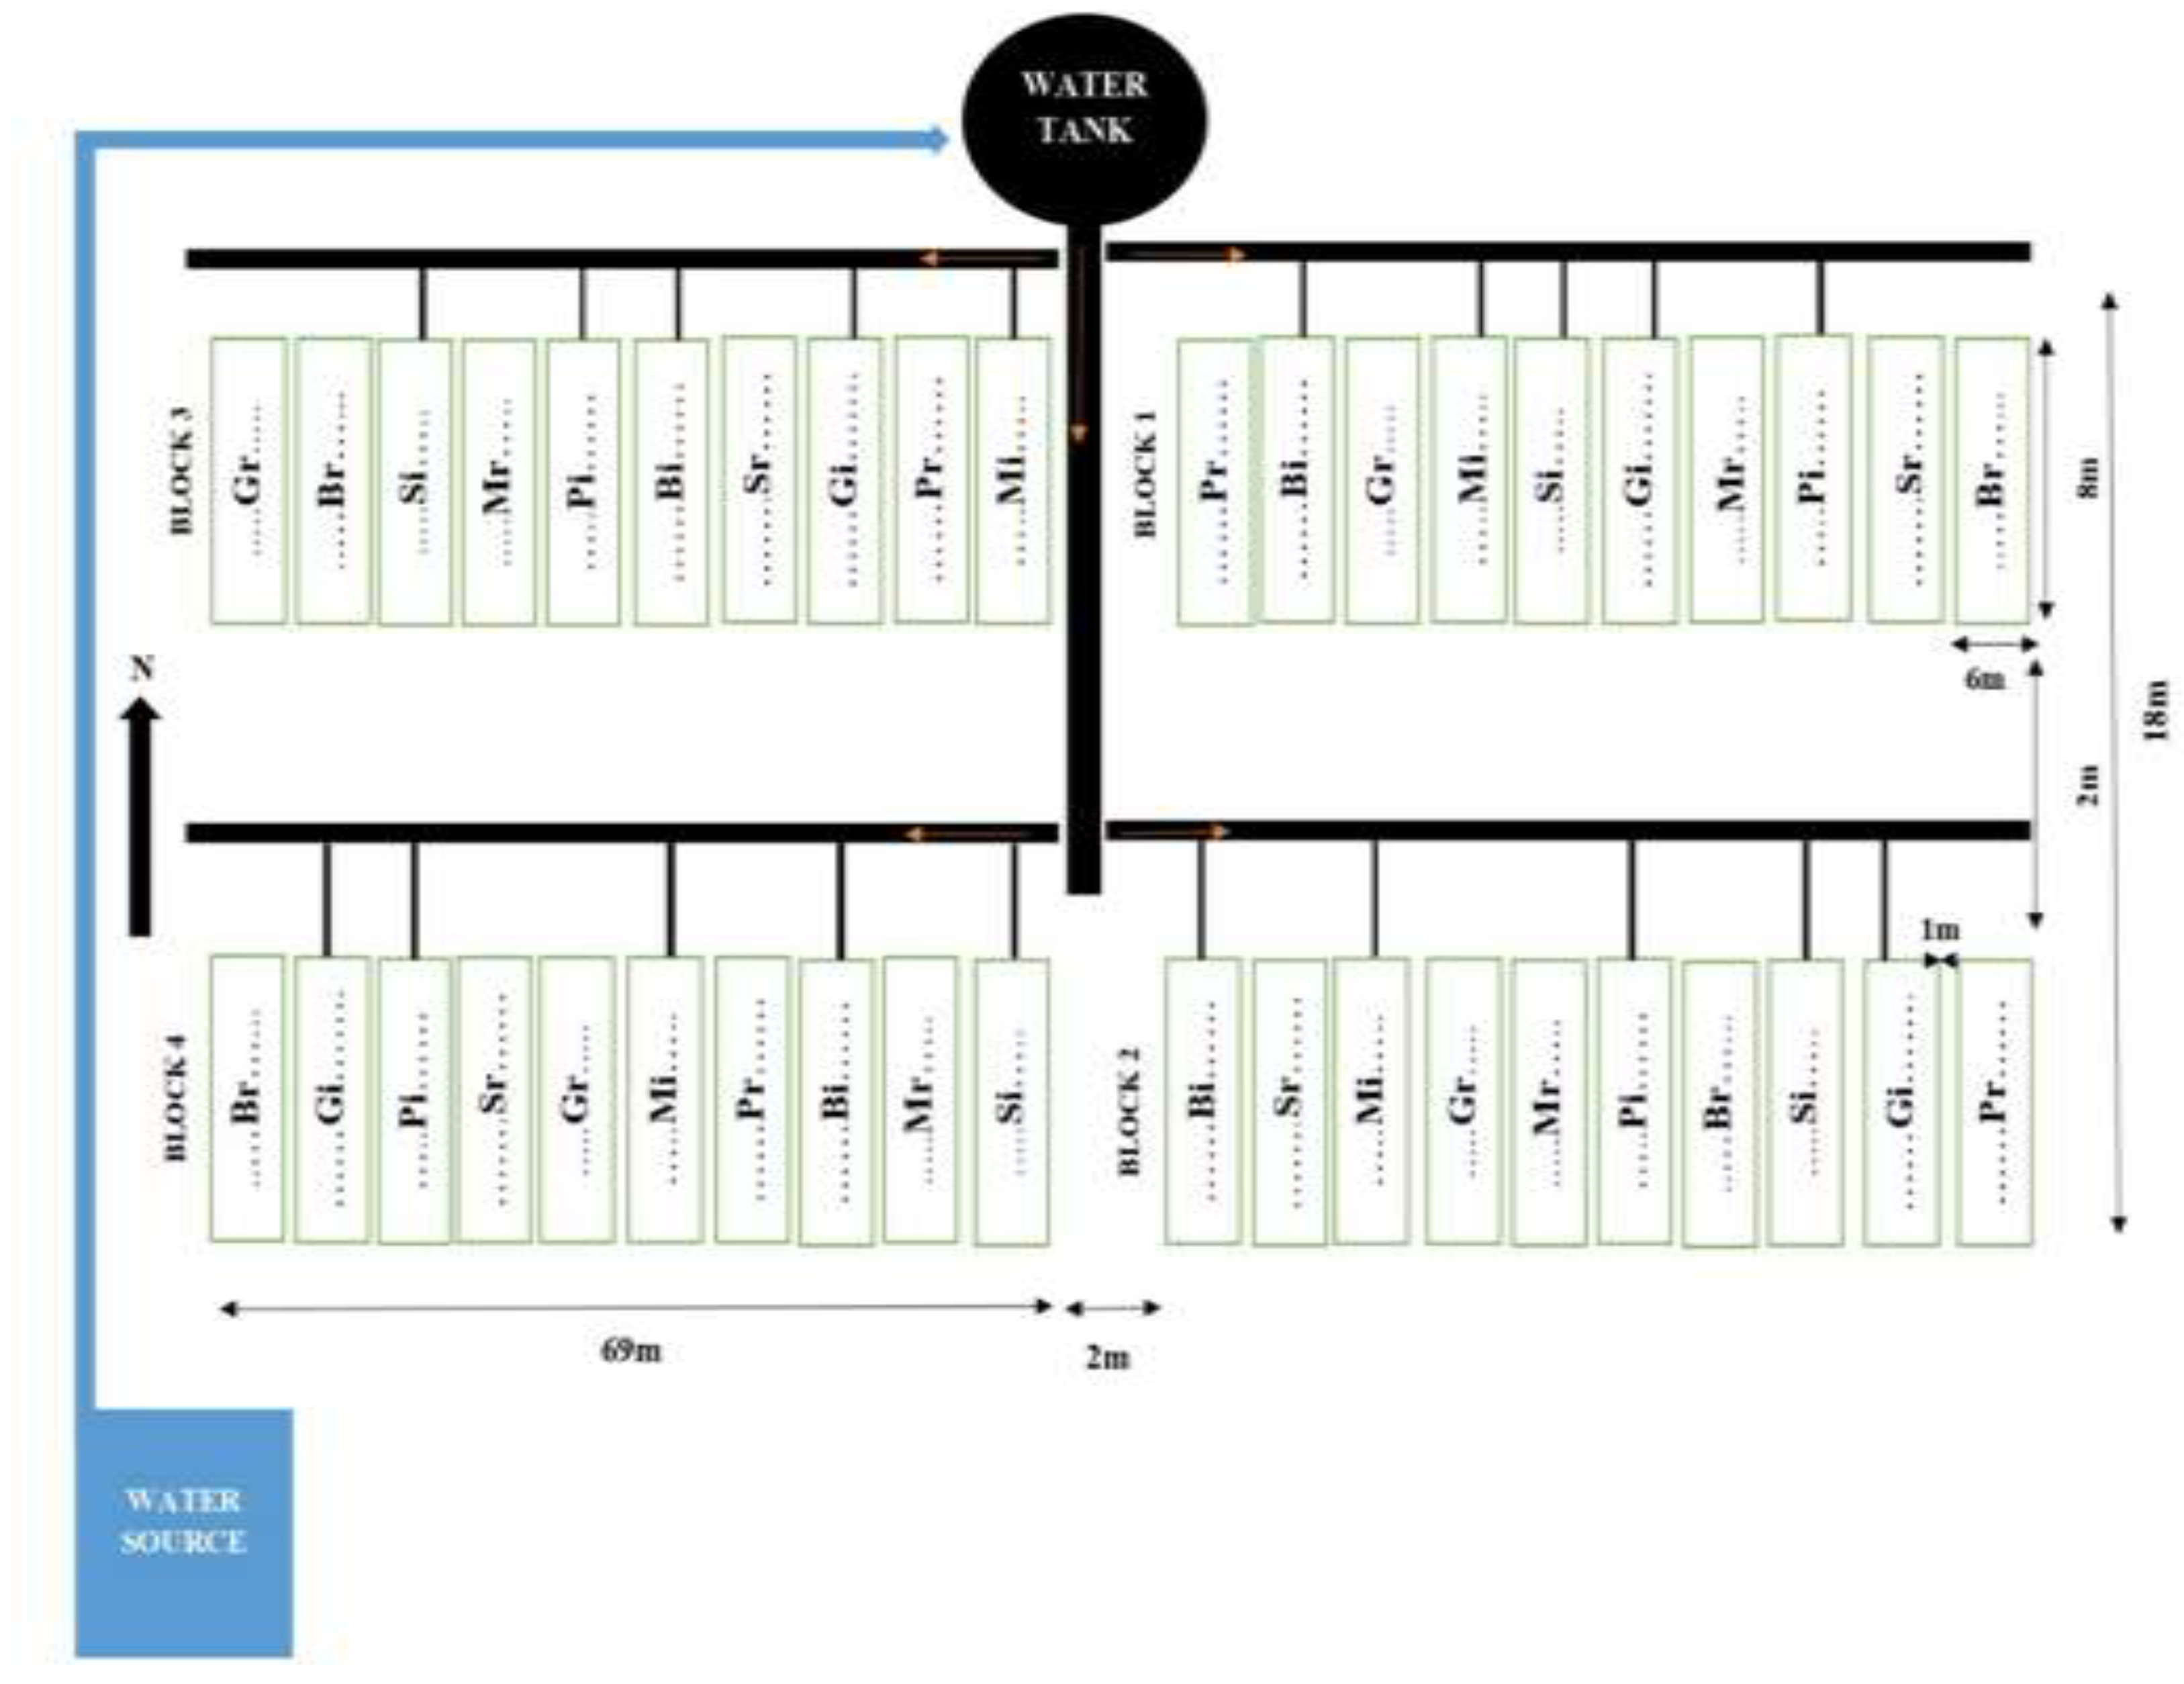
The experiment followed a Randomized Complete Block Design (RCBD) with four blocks and was replicated in an agricultural season. Treatments consisted of two water management regimes (irrigated and rainfed) and five crop types: maize (Zea mays), soybean (Glycine max), Irish potato (Solanum tuberosum), common bean (Phaseolus vulgaris), and Brachiaria grass (Urochloa brizantha). Crop rotation was performed at the start of the second season for seasonal crops where maize rotated with potato, soya beans rotated with beans, potato rotated with soya beans and beans rotated with maize. Each block therefore included ten treatment combinations, resulting in a total of 40 plots. Each plot measured 48 m² (6 m × 8 m).
Water was supplied in the field by drip irrigation where each row has a line with drippers to keep soil moisture above the permitted moisture depletion for the specific crop for the entire growing season. This means that each crop was irrigated according to the specific crop needs. Water was pumped from Tonga natural stream.
Figure 1.
Field experimental set up, where Pr = rainfed potato, Pi = irrigated potato, Sr = irrigated soybean, Si= rainfed soya bean, Gi = irrigated grass (Brachiaria), Gr=rainfed grass (Brachiaria) Mi = irrigated maize, Mr = rainfed maize, Bi = irrigated beans and Br=rainfed beans.
Figure 1.
Field experimental set up, where Pr = rainfed potato, Pi = irrigated potato, Sr = irrigated soybean, Si= rainfed soya bean, Gi = irrigated grass (Brachiaria), Gr=rainfed grass (Brachiaria) Mi = irrigated maize, Mr = rainfed maize, Bi = irrigated beans and Br=rainfed beans.
2.5. Data Collection
2.5.1. Soil Respiration Measurement
CO2 samples were collected using closed static chamber method following standard protocols [14,15] directly connected to carbon dioxide probe (GMP343 sensor) and pump to get direct measurements.
Soil CO₂ emissions was measured during 20 sampling campaigns conducted across two consecutive cropping seasons (Season 1: September 2024–January 2025; Season 2: February 2025–June 2025). Measurements were performed at approximately two-week intervals throughout each season. Within each season, sampling was structured to capture crop phenological development, conducting two measurement rounds during the initial growth stage, three during the development stage, three during the mid-growth stage, and two during the late growth stage. On each sampling day, two CO2 measurements were performed per plot: one under crop-covered conditions (from the chamber with standing vegetation inside) and one under adjacent bare soil conditions (from the chamber without vegetation inside placed between two consecutive crops on the same row). This sampling design generated a total of 80 individual flux measurements per campaign. Measurement frames were installed at the sampling locations two weeks before gas sampling day.
For the frame with crop inside, we trimmed the above ground crop biomass five days before measurement to allow plant shock to stabilize, root respiration to decline and microbial activity to reach a new equilibrium. CO₂ concentration was recorded at 15-second intervals for 3 minutes. The chamber height prior to each measurement was measured to calculate chamber volume accurately. CO₂ emissions were calculated from the rate of change in chamber CO₂ concentration over time using the Ideal Gas Law following standard static chamber methods [16].
where F is CO₂ flux (mg m⁻² h⁻¹), ΔC/Δt is the rate of change in concentration, P is atmospheric pressure, R is the gas constant, T is temperature, M is molar mass of CO₂, V is chamber volume, and A is surface area.
F = (ΔC/Δt) × (P / (R × T)) × (M × V / A)
Figure 2.
Field setup for soil respiration measurement using the closed chamber method.
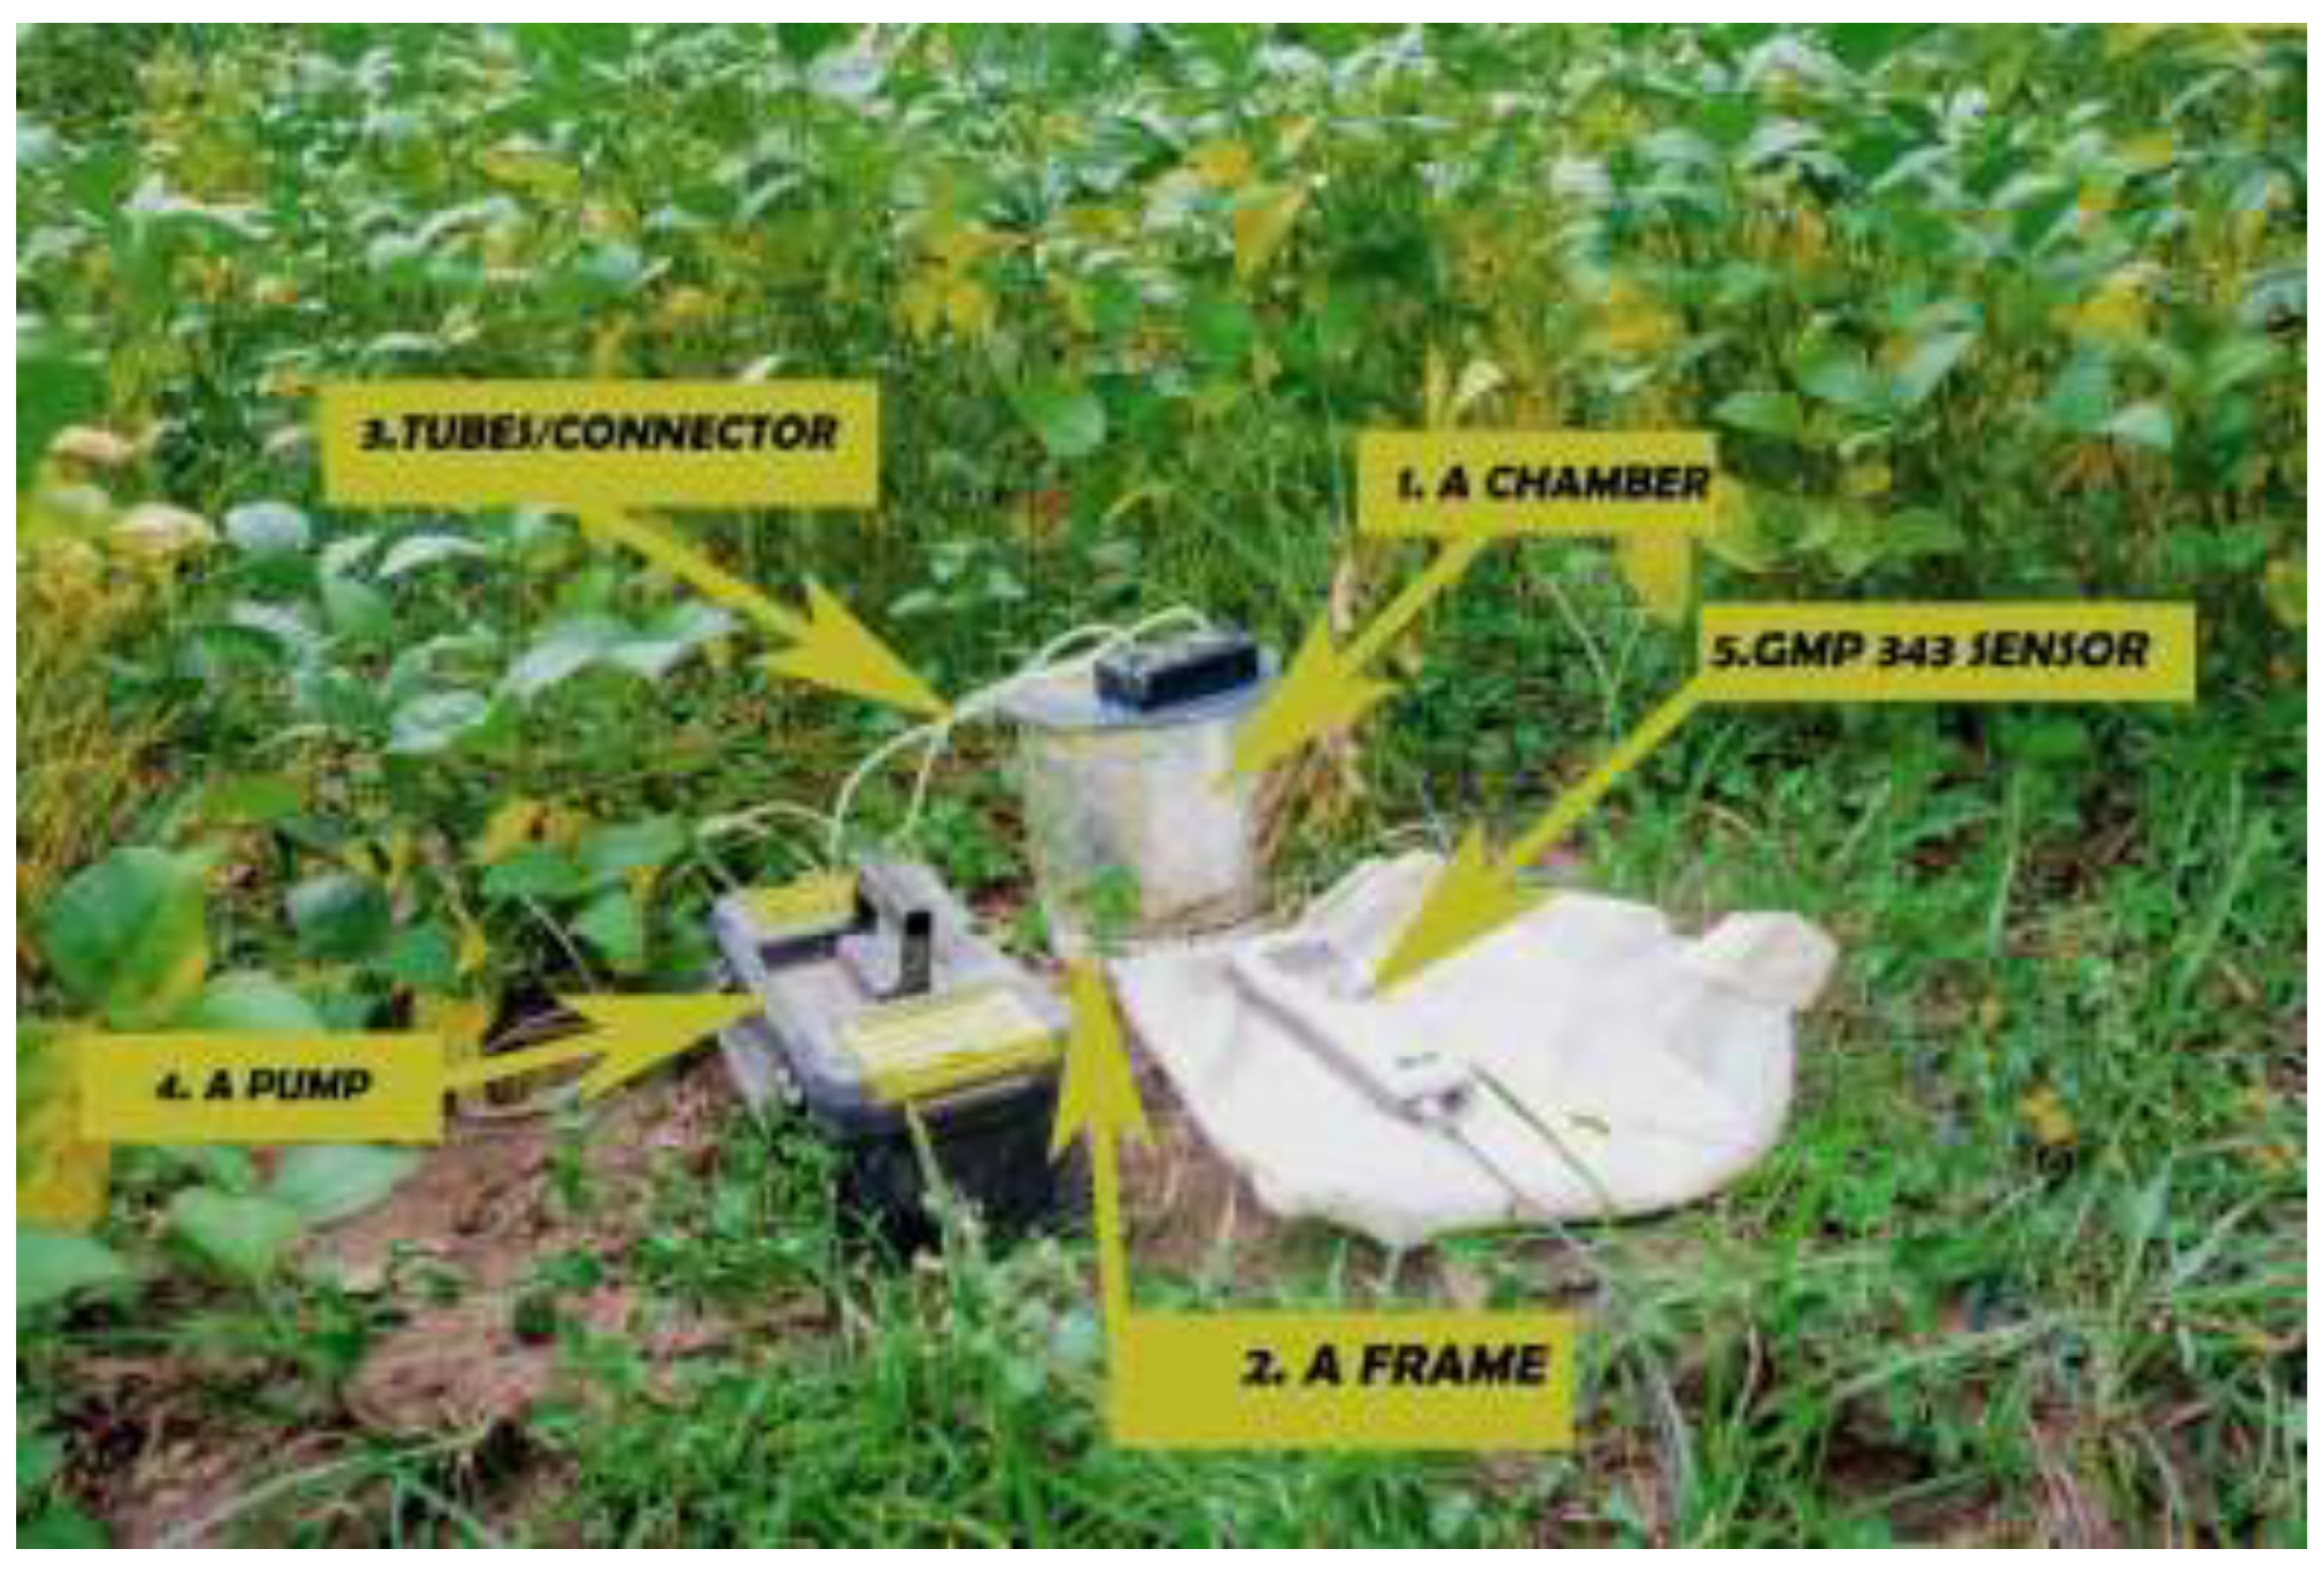
The chamber (1) was placed on a pvc frame (2) inserted 5 cm into the soil and connected via tubing (3) to an external pump (4) which in return connected to GMP343 sensor (5) for CO2 measurement recording. Measurements were recorded every 15 seconds for 3 minutes at both crop-covered and bare soil points.
2.5.2. Weather Data Measurement
Air temperature, soil temperature, soil moisture content (10 cm depth), groundwater level, and photosynthetic active radiation (PAR) were monitored each sampling day. Air temperature data were obtained from the on-site meteorological station (WatchDog 2000 Series, Spectrum Technologies, Inc., Aurora, IL, USA) and recorded prior to CO₂ measurements. Soil temperature and soil moisture were measured using a portable soil moisture meter. Groundwater level to a depth of 1.2 m was measured using an electric water level meter (Model 101, Solinst Canada Ltd., Georgetown, ON, Canada). Photosynthetically active radiation (PAR) was estimated using a smartphone-based method with the photone application [17]. which utilizes the phone’s built-in ambient light sensor, with measurements taken at 60-minutes intervals during sampling days. Every unusual weather condition (e.g., rainfall, strong winds) was recorded to consider them during result interpretation.
2.5.3. Statistical Analysis
All statistical analyses were conducted using R software version 4.4.3[18]. We analyzed CO₂ emission data using linear mixed-effects models to account for the hierarchical experimental design. Crop type, water management, and crop growing stage were included as fixed effects, and their interactions were tested too. We specified block and plot nested within block as random effects to account for the randomized block design and repeated measurements at the plot level. Model significance was assessed using type III analysis of variance. We computed estimated marginal means for fixed factors and performed pairwise comparisons using Tukey-adjusted contrasts. We determined statistical significance at p < 0.05. Data from both cropping seasons were analyzed jointly except when we were comparing emissions from both seasons.
3. Results
This section presents the results of the study evaluating the main and interactive effects of crop type, water management, and crop growing stage on soil CO₂ emissions from both crop-covered and bare soil conditions across two cropping seasons. In addition, we examined seasonal dynamics, fertilization, and relationships between CO₂ emissions and environmental variables to identify key drivers of soil respiration.
3.1. Effects of Crop Type, Irrigation, and Growth Stage on Soil CO₂ Emissions Under Crop-Covered Conditions
Mean soil CO₂ emissions under crop-covered conditions differed among crops, with the highest emissions observed under brachiaria, while soybean and bean showed intermediate values and potato and maize exhibited lower average emissions (Table 4).
Soil CO₂ emissions were significantly affected by crop type (p < 0.001) and growing stage (p < 0.001), whereas irrigation had no significant effect (p = 0.159) (Figure 3).
Relative to the reference crop (bean), brachiaria showed higher emissions (+231 mg m⁻² h⁻¹), followed by soybean (+75.5 mg m⁻² h⁻¹). Potato (−55.1 mg m⁻² h⁻¹) and maize (+2.8 mg m⁻² h⁻¹) did not differ significantly from the reference.
Across growing stages, emissions were significantly lower during the initial (−904.2 mg m⁻² h⁻¹) and late stages (−905.6 mg m⁻² h⁻¹) compared to the development stage. The mid-stage showed a non-significant reduction (−203.2 mg m⁻² h⁻¹; p = 0.12) (Figure 3).
The Crop × Water interaction was not significant (p = 0.141), while the Crop × Growth Stage interaction was marginally significant (p = 0.0847). A significant positive interaction effect was observed for brachiaria at the initial stage (p < 0.001).
3.2. Effects of Crop Type, Irrigation, and Growth Stage on Soil CO₂ Emissions Under Bare Soil Conditions
Consistent with crop-covered conditions, mean soil CO₂ emissions differed among crop types, with the highest values observed under brachiaria. Beans showed intermediate emissions, while soybean, maize, and potato exhibited lower values (Table 5).
Soil CO₂ emissions were significantly affected by crop type (p < 0.001) and growing stage (p < 0.001). Compared to beans, brachiaria showed significantly higher emissions (+370 mg m⁻² h⁻¹) and differed from all other crops (p < 0.05). Maize, soybean, and potato did not differ significantly from beans.
Water management and interaction effects (Crop × Water and Crop × Growth Stage) were not significant (p > 0.05) (Figure 4).
3.3. Seasonal Variation in Soil CO₂ Emissions Across Crops and Water Regimes
Cropping season did not significantly affect soil CO₂ emissions (p = 0.123). Mean emissions were generally higher in the second season for most crops, including beans (806 vs. 1079 mg m⁻² h⁻¹), brachiaria (1201 vs. 1321 mg m⁻² h⁻¹), maize (804 vs. 1043 mg m⁻² h⁻¹), and soybean (800 vs. 1024 mg m⁻² h⁻¹), while potato showed lower emissions in the second season (897 vs. 785 mg m⁻² h⁻¹) (Figure 5).
Crop type had a significant effect on soil CO₂ emissions (p < 0.001), whereas water management was not significant (p = 0.494).
No significant interaction effects were observed between Season × Crop (p = 0.183), Season × Water (p = 0.533), or Season × Crop × Water (p = 0.577).
3.4. Relationships Between CO₂ Emissions and Environmental Parameters
Photosynthetic active radiation (PAR) was the only environmental variable significantly associated with CO₂ emissions (β = 4.29 ± 1.30 SE, z = 3.29, p = 0.001). CO₂ emissions increased by approximately 4.3 mg m⁻² h⁻¹ per 1 µmol m⁻² s⁻¹ increase in PAR (Figure 6a).
Soil moisture content (SMC) showed a positive but non-significant association with CO₂ emissions (β = 12.34 ± 7.84 SE, p = 0.115). Soil temperature (ST) exhibited a negative, non-significant relationship (β = −16.74 ± 14.15 SE, p = 0.237). Groundwater level (GWL) did not significantly affect CO₂ emissions (β = −3.99 ± 4.60 SE, p > 0.05). Scatterplots indicated a wide dispersion of observations for SMC, ST, and GWL (Figure 6b–d).
3.5. Effects of Fertilization on Soil CO₂ Emissions
Soil CO₂ emissions differed significantly between the period before fertilization and period after fertilization where emissions measured before fertilization were on average 648.95 mg m⁻² h⁻¹ lower than those recorded two weeks after fertilizer application (, p < 0.001) (Figure 7).
3.6. Productivity–Soil Respiration Dynamics Under Irrigated and Rainfed Systems
Irrigation significantly increased crop productivity across all crops (p < 0.001) (Table 6). In contrast, mean soil CO₂ emissions from crop-covered soils did not differ significantly between irrigated and rainfed treatments, although slightly higher values were observed under irrigation.
At the crop level, yields were consistently higher under irrigated conditions for all crops (p < 0.001), while differences in soil CO₂ emissions remained small and not statistically significant (Table 6). Brachiaria exhibited relatively high CO₂ emissions under both water regimes, whereas maize, beans, soybean, and Irish potato showed only minor variation between treatments.
When expressed per unit of dry yield, soil CO₂ emission intensity was significantly lower under irrigation for beans (p < 0.05), brachiaria (p < 0.01), maize (p < 0.05), and Irish potato (p < 0.01), while no significant difference was observed for soybean (p > 0.05). Across crops, emission intensity varied markedly, with lower values for brachiaria and higher values for grain legumes (Table 6).
4. Discussion
4.1. Effects of Crop Type, Irrigation, and Growth Stage on Soil CO₂ Emissions Under Crop-Covered Conditions
The strong effect of crop growth stage on soil CO₂ emissions indicates a close coupling between plant development and rhizosphere carbon dynamics. Lower emissions observed during the initial stage likely reflect limited root biomass and reduced carbon inputs to the soil. In contrast, higher emissions during the development and mid stages can be attributed to increased belowground carbon allocation and enhanced microbial activity. The subsequent decline at the late stage is consistent with reduced photosynthetic activity and progressive root senescence.
Differences among crop types further suggest that species-specific traits regulate soil CO₂ emissions, likely through variations in root biomass, architecture, and exudate composition. The higher emissions observed under brachiaria compared to other crops may be associated with its dense root system and greater carbon input to the soil.
The absence of a significant irrigation effect suggests that soil moisture conditions were not limiting for soil respiration during the study period. This may be explained by the prevailing environmental conditions, as data collection occurred during the rainy seasons, with rainfall preceding most sampling events. Under such conditions, both root and microbial respiration are likely maintained within an optimal moisture range, reducing the influence of additional water inputs.
These findings are consistent with previous studies highlighting plant phenology and rhizosphere carbon inputs as key regulators of soil respiration in agricultural systems [19,20]. Overall, the results support the hypothesis that biological factors, particularly crop type and growth stage, play a dominant role in controlling soil CO₂ emissions under crop-covered conditions.
4.2. Effects of Crop Type, Irrigation, and Growth Stage on Soil CO₂ Emissions Under Crop-Covered Conditions
Soil CO₂ emissions were significantly higher under crop-covered than bare soil conditions, indicating a strong contribution of plant-associated respiration to total soil carbon fluxes. The magnitude of this difference varied among crops, with a significant soil condition × crop interaction observed for brachiaria, while other crops showed no differential response. The covered–bare contrast was also stage-dependent and most pronounced during the initial and late growth stages, highlighting temporal variation in plant-driven carbon inputs.
The persistence of crop effects under bare soil conditions suggests that plant identity influenced soil respiration beyond the immediate rhizosphere. This pattern indicates that crop-specific differences in belowground carbon allocation and root development may stimulate microbial activity and enhance carbon turnover in surrounding bulk soil. The relatively higher emissions associated with brachiaria under both soil conditions may reflect its extensive root system and greater belowground carbon inputs, which can sustain microbial processes over time.
The significant effect of growth stage further supports the role of plant developmental dynamics in regulating soil respiration at the system scale, even in areas without direct root presence at the measurement point.
The absence of irrigation effects under both soil conditions suggests that moisture was not a limiting factor for soil respiration during the study period. This is likely related to the prevailing environmental conditions, as no pronounced dry periods occurred. Under drier conditions, irrigation may exert a stronger influence on soil CO₂ emissions.
These findings are consistent with previous studies showing that root-derived carbon inputs and rhizosphere priming effects can extend beyond the immediate root zone into adjacent bulk soil [21,22,23]. Similarly, it was reported higher soil respiration rates in vegetated soils compared to bare soils due to the direct and indirect effects of living roots on soil carbon dynamics [24,25].
4.3. Seasonal Variation in Soil CO₂ Emissions Across Crops and Water Regimes
Seasonal variation had a limited effect on soil CO₂ emissions, indicating that short-term differences between cropping seasons were insufficient to significantly alter soil biological activity. Although emissions were generally higher in the second season for most crops, this trend was not statistically significant, suggesting a relatively stable system response across seasons.
The slightly higher emissions observed in the second season may be associated with cumulative biological effects, including residual organic inputs from the preceding crop. Root residues and remaining plant-derived carbon could increase the availability of decomposable substrates, thereby sustaining microbial activity and CO₂ production.
The lower emissions observed under potato in the second season may reflect crop rotation effects, as potato replaced maize during this period. Differences in residue quality and carbon inputs between crops, as well as variation in root architecture and carbon allocation patterns, may contribute to reduced microbial activity and lower CO₂ emissions under potato compared with other crops.
In contrast to seasonal effects, crop type remained a significant driver of soil CO₂ emissions, highlighting the importance of plant functional traits in regulating belowground carbon dynamics. Variations in root biomass, carbon allocation, and rhizosphere activity among crops likely influenced microbial processes and soil respiration rates.
The absence of significant water and interaction effects suggests that soil moisture conditions were not limiting during the study period. Under such conditions, biologically driven processes appear to dominate the regulation of soil CO₂ emissions across seasons.
These findings are consistent with previous studies showing that plant functional traits and root-derived carbon inputs exert stronger control over soil respiration than short-term climatic variability [9,26]. Generally, the results indicate that crop identity plays a more prominent role than seasonal variation in shaping soil CO₂ emissions in this system.
4.4. Relationships Between CO₂ Emissions and Environmental Parameters
Photosynthetically active radiation (PAR) was the only environmental variable significantly associated with soil CO₂ emissions, indicating a close link between carbon fluxes and plant physiological activity. Higher radiation levels are associated with increased photosynthesis and greater belowground carbon allocation, which can enhance root and rhizosphere respiration.
Despite this relationship, the wide dispersion of observations suggests that PAR alone does not fully explain the variability in soil CO₂ emissions, and that additional biotic or environmental factors may contribute to the observed patterns.
In contrast, soil moisture content and soil temperature did not show significant independent effects on CO₂ emissions. The lack of clear relationships, together with the high variability in the data, indicates that these factors were not primary controls of soil respiration under the conditions of this study. Similarly, groundwater level showed no consistent influence on CO₂ emissions, suggesting a limited short-term role of hydrological fluctuations in regulating soil aeration and microbial activity.
4.5. Effects of Fertilization on Soil CO₂ Emissions
The significant increase in soil CO₂ emissions following fertilization indicates a stimulation of soil biological activity during the crop growth period. The higher emissions observed two weeks after fertilizer application suggest enhanced soil respiration under increased nutrient availability.
This response may be associated with increased microbial decomposition of organic matter, as well as enhanced root growth and respiration following nutrient addition. The combined contribution of microbial and root respiration likely contributed to the observed increase in CO₂ emissions, reflecting accelerated carbon turnover in the soil.
These findings are consistent with previous studies showing that nitrogen fertilization can increase soil CO₂ emissions by stimulating microbial activity and soil carbon decomposition [29], supporting the role of nutrient inputs in regulating soil respiration dynamics.
4.6. Productivity–Soil Respiration Dynamics Under Irrigated and Rainfed Systems
Irrigation significantly increased crop productivity without a corresponding increase in soil CO₂ emissions. This indicates that yield gains were achieved without proportional increases in soil carbon efflux, suggesting a decoupling between productivity and soil respiration under the conditions of this study. The similar CO₂ emissions observed under irrigated and rainfed treatments further suggest that soil moisture remained within a range that supported both microbial and root activity, limiting additional stimulation of respiration by irrigation.
When emissions were expressed per unit of dry yield, irrigation reduced CO₂ emission intensity for several crops, with significant reductions observed for beans and Irish potato. This demonstrates that increased productivity can lower emission intensity even when absolute CO₂ fluxes remain unchanged. For maize and brachiaria, similar trends were observed but were not statistically significant.
These results highlight the importance of yield-scaled metrics in evaluating the environmental performance of agricultural systems, as they provide a more integrated assessment of productivity and associated emissions. Under such an approach, irrigation can improve the efficiency of production by increasing yields without increasing soil CO₂ emissions.
4.7. Limitations of the Study, Implications and Future Research Directions
4.7.1. Limitations
Several limitations should be considered. The moderate sample size may have reduced the ability to detect subtle treatment effects, particularly short-term responses to irrigation and fertilization. Rainfall events occurring before sampling likely reduced differences in soil moisture between irrigated and rainfed plots, potentially masking irrigation effects. In addition, the study was conducted at a single marshland site, which limits the generalization of the findings to other systems. Finally, the study covered only two cropping seasons, whereas longer-term observations are needed to capture interannual variability in soil respiration.
4.7.2. Implications and Future Research Directions
The results indicate that crop type is a stronger driver of soil CO₂ emissions than irrigation, while irrigation mainly enhances productivity without increasing emissions. This suggests that irrigation can improve yields without substantially intensifying soil carbon losses under humid marshland conditions.
Future research should focus on partitioning soil respiration into autotrophic and heterotrophic components, conducting long-term studies across varying climatic conditions, and evaluating irrigation strategies under drier environments. Such work would support the development of climate-smart management practices for marshland agroecosystems.
5. Conclusions
Soil CO₂ emissions in the Tonga marshland agroecosystem were primarily driven by crop type, phenological stage, and fertilization, while irrigation had no significant effect on total soil respiration. Emissions differed significantly among crops, with Brachiaria showing the highest fluxes, and peaked during the crop development stage, highlighting the strong influence of plant physiological activity on belowground carbon dynamics. Fertilization significantly increased soil CO₂ emissions, likely due to stimulation of microbial decomposition and root respiration following nutrient inputs.
Despite its limited influence on absolute soil respiration, irrigation substantially increased crop yields. Consequently, CO₂ emissions per unit of production were significantly lower for beans and Irish potato under irrigated conditions, reflecting improved production efficiency.
Despite its limited influence on absolute soil respiration, irrigation substantially increased crop yields. Consequently, CO₂ emissions per unit of production were significantly lower for beans and irish potato irrigated conditions, reflecting improved production efficiency. This suggests that irrigation can reduce the carbon intensity of crop production even when total soil CO₂ fluxes remain unchanged. Higher emissions observed in cropped soils compared with bare soil further confirm the dominant role of root and rhizosphere processes in regulating soil respiration. Overall, these findings emphasize the importance of evaluating greenhouse gas emissions on a yield-scaled basis to better assess trade-offs between agricultural productivity and climate mitigation in tropical agroecosystems.
Author Contributions
Conceptualization, T.A.M.,O.B.,A.J., R.N. and V.N.; methodology, T.A.M.,O.B. and A.J.; software, T.A.M. and OB; validation, T.A.M., A.J. and O.B; formal analysis, T.A.M.; investigation, T.A.M.; resources, T.A.M., A.J, O.B, M.M, G. N.,V.N.,R.N and S.R.T; data curation, T.A.M.; writing—original draft preparation, T.A.M.; writing—review and editing, A.J, O.B, M.M, G.N. and S.R.T.; visualization, T.A.M.; supervision, A. J, O.B, M.M, G.N and S.R.T.; project administration, T.A.M,A.J. and S.R.T., funding acquisition, S.R.T. All authors have read and agreed to the published version of the manuscript.
Funding
This work was supported by the University of Rwanda–Sweden Program, a research capacity-building initiative funded by the Swedish International Development Cooperation Agency. The APC was funded by the University of Rwanda–Sweden Program.
Institutional Review Board Statement
Not applicable.
Data Availability Statement
The data presented in this study are available from the corresponding author upon request. The data are not publicly available.
Acknowledgments
The authors would like to acknowledge the Rwanda Agriculture and Animal Resources Development Board for providing laboratory support. We also thank the University of Rwanda field team for their assistance during data collection and experimental activities. Appreciation is extended to the Swedish International Development Cooperation Agency administrative support team for their logistical support. The authors are grateful to Swedish University of Agricultural Sciences for providing field data collection equipment. We also acknowledge the valuable contribution of field assistants involved in this study. During the preparation of this manuscript, the authors used ChatGPT for language editing and refinement. The authors have reviewed and edited the output and take full responsibility for the content of this publication.
Conflicts of Interest
The authors declare no conflicts of interest. The funders had no role in the design of the study; in the collection, analyses, or interpretation of data; in the writing of the manuscript; or in the decision to publish the results.
Abbreviations
The following abbreviations are used in this manuscript:
| CO₂ | Carbon dioxide |
| CAFF | College of Agriculture, Forestry and Food Sciences |
| CVAS | College of Veterinary Medicine and Animal Sciences |
| SLU | Swedish University of Agricultural Sciences |
| EC | Electrical conductivity |
| DAP | Diammonium phosphate |
| KCl | Potassium chloride (Muriate of Potash) |
| NPK | Nitrogen, phosphorus, and potassium fertilizer |
| P₂O₅ | Phosphorus pentoxide equivalent |
| K₂O | Potassium oxide |
| RCBD | Randomized Complete Block Design |
| PAR | Photosynthetically Active Radiation |
| SMC | Soil moisture content |
| ST | Soil temperature |
| GWL | Groundwater level |
| SE | Standard error |
| R | R statistical software |
References
- Raich, J.W.; Schlesinger, W.H. The global carbon dioxide flux in soil respiration and its relationship to vegetation and climate. Tellus B 1992, 44, 81–99. [Google Scholar] [CrossRef]
- Jian, J.; Vargas, R.; Anderson-Teixeira, K.; Stell, E.; Herrmann, V.; Horn, M.; Bond-Lamberty, B. A global analysis of soil respiration and its environmental controls. Glob. Chang. Biol. 2021, 27, 3142–3156. [Google Scholar] [CrossRef]
- Shen, J.; Zhang, L.; Zhu, X.; Wan, S. Effects of irrigation on soil respiration in an arid cropland. Agric. For. Meteorol. 2013, 171–172, 31–39. [Google Scholar] [CrossRef]
- Trost, B.; Prochnow, A.; Drastig, K.; Meyer-Aurich, A.; Ellmer, F.; Baumecker, M. Irrigation, soil organic carbon and N₂O emissions: A review. Agron. Sustain. Dev. 2013, 33, 733–749. [Google Scholar] [CrossRef]
- Kuzyakov, Y.; Gavrichkova, O. Time lag between photosynthesis and soil respiration: A review of mechanisms and controls. Soil Biol. Biochem. 2010, 42, 1363–1376. [Google Scholar] [CrossRef]
- Chen, J.; Luo, Y.; Xia, J.; Zhou, X. Plant root traits and rhizosphere interactions regulate soil respiration responses to environmental change. Rhizosphere 2021, 18, 100352. [Google Scholar] [CrossRef]
- Liu, Y.; Wang, J.; Zhang, W.; Zhang, Y.; Zhao, Y. Root biomass mediates soil respiration response to nitrogen fertilization in a maize cropping system. J. Soils Sediments 2015, 15, 1961–1969. [Google Scholar] [CrossRef]
- Waqas, M.; Lu, L.; Dai, J.; Wang, C.; Zhang, J. Crop yield and soil biochemical properties relationships with soil respiration in a wheat–maize cropping system vary with crop growth stages and soil depth. Agron. J. 2023, 115, e20699. [Google Scholar] [CrossRef]
- Kuzyakov, Y. Sources of CO₂ efflux from soil and review of partitioning methods. Soil Biol. Biochem. 2006, 38, 425–448. [Google Scholar] [CrossRef]
- Berglund, Ö.; Torssell, M.; Hallgren, K. Effects of intermittent irrigation on greenhouse gas emissions from rice paddies in northern Europe. Agric. Syst. 2020, 180, 102755. [Google Scholar] [CrossRef]
- Rwanda Agriculture; Animal Resources Development Board. Annual Agricultural Statistical Report 2019–2020; RAB Publications: Kigali, Rwanda, 2020. [Google Scholar]
- Vanlauwe, B.; Descheemaeker, K.; Giller, K.E.; Huising, J.; Merckx, R.; Nziguheba, G.; Wendt, J.; Zingore, S. Integrated soil fertility management in sub-Saharan Africa. SOIL 2015, 1, 491–508. [Google Scholar] [CrossRef]
- Izerimana, E.; Hirwa, H. Nutrient composition and agronomic value of composts commonly used in Rwanda. Rwanda J. Agric. Sci. 2019, 2, 45–58. [Google Scholar]
- Parkin, T.B.; Venterea, R.T. Chamber-based trace gas flux measurements. In Sampling Protocols; Follett, R.F., Ed.; USDA-ARS: Washington, DC, USA, 2010; pp. 3–1–3–39. [Google Scholar]
- Butterbach-Bahl, K.; Baggs, E.M.; Dannenmann, M.; Kiese, R.; Zechmeister-Boltenstern, S. Nitrous oxide emissions from soils: How well do we understand the processes and their controls? Philos. Trans. R. Soc. B 2013, 368, 20130122. [Google Scholar] [CrossRef]
- Mosier, A.R.; Mack, L.; Mosier, R. Closed chamber methods for measuring soil gas fluxes. In Agricultural Ecosystem Effects on Trace Gases and Global Climate Change; Follett, R.F., Ed.; American Society of Agronomy: Madison, WI, USA, 1998; pp. 14–20. [Google Scholar]
- Dutta, S.; et al. Photone: A smartphone-based application for light (PAR) measurement using ambient sensors. Available online: https://photone.app (accessed on 6 April 2026).
- R Core Team. R: A Language and Environment for Statistical Computing; R Foundation for Statistical Computing: Vienna, Austria, 2024; Available online: https://www.R-project.org/ (accessed on 6 April 2026).
- Kuzyakov, Y.; Blagodatskaya, E. Microbial hotspots and hot moments in soil: Concept and review. Soil Biol. Biochem. 2015, 83, 184–199. [Google Scholar] [CrossRef]
- Zhu, B.; Cheng, W.; Kuzyakov, Y. Plant phenology regulates rhizosphere carbon fluxes and soil respiration dynamics in cropping systems. Glob. Chang. Biol. 2024, 30, e17123. [Google Scholar] [CrossRef]
- Kuzyakov, Y. Factors affecting rhizosphere priming effects. J. Plant Nutr. Soil Sci. 2002, 165, 382–396. [Google Scholar] [CrossRef]
- Phillips, R.P.; Finzi, A.C.; Bernhardt, E.S. Enhanced root exudation induces microbial feedbacks to nitrogen cycling in a pine forest under long-term CO₂ fumigation. Ecol. Lett. 2011, 14, 187–194. [Google Scholar] [CrossRef]
- Bardgett, R.D.; Wardle, D.A. Aboveground–Belowground Linkages: Biotic Interactions, Ecosystem Processes, and Global Change; Oxford University Press: Oxford, UK, 2010. [Google Scholar]
- Chen, L.; Zhang, Y.; Wang, X.; Li, J. Root activity and vegetation cover drive soil respiration patterns in managed agricultural ecosystems. Soil Tillage Res. 2024, 238, 105842. [Google Scholar] [CrossRef]
- Irving, L.J.; Wang, Y.; Chen, J. Vegetation cover enhances soil respiration through rhizosphere carbon inputs and microbial stimulation in agricultural soils. Agric. Ecosyst. Environ. 2024, 358, 108712. [Google Scholar] [CrossRef]
- Davidson, E.A.; Janssens, I.A.; Luo, Y. On the variability of respiration in terrestrial ecosystems: Moving beyond Q10. Glob. Chang. Biol. 2006, 12, 154–164. [Google Scholar] [CrossRef]
- Baldocchi, D. “Breathing” of the terrestrial biosphere: Lessons learned from a global network of carbon dioxide flux measurement systems. Aust. J. Bot. 2008, 56, 1–26. [Google Scholar] [CrossRef]
- Janssens, I.A.; Lankreijer, H.; Matteucci, G.; Kowalski, A.S.; Buchmann, N.; Epron, D.; Valentini, R. Productivity overshadows temperature in determining soil and ecosystem respiration across European forests. Glob. Chang. Biol. 2001, 7, 269–278. [Google Scholar] [CrossRef]
- Yang, R.; Liu, Q.; Zhang, H.; Li, Y. Nitrogen fertilization stimulates soil CO₂ emissions by enhancing microbial activity and carbon turnover in cropland systems. Soil Biol. Biochem. 2025, 196, 108990. [Google Scholar] [CrossRef]
Figure 3.
Soil CO₂ emissions across crop growing stages under crop-covered conditions for each crop, averaged across rainfed and irrigated treatments.
Figure 3.
Soil CO₂ emissions across crop growing stages under crop-covered conditions for each crop, averaged across rainfed and irrigated treatments.
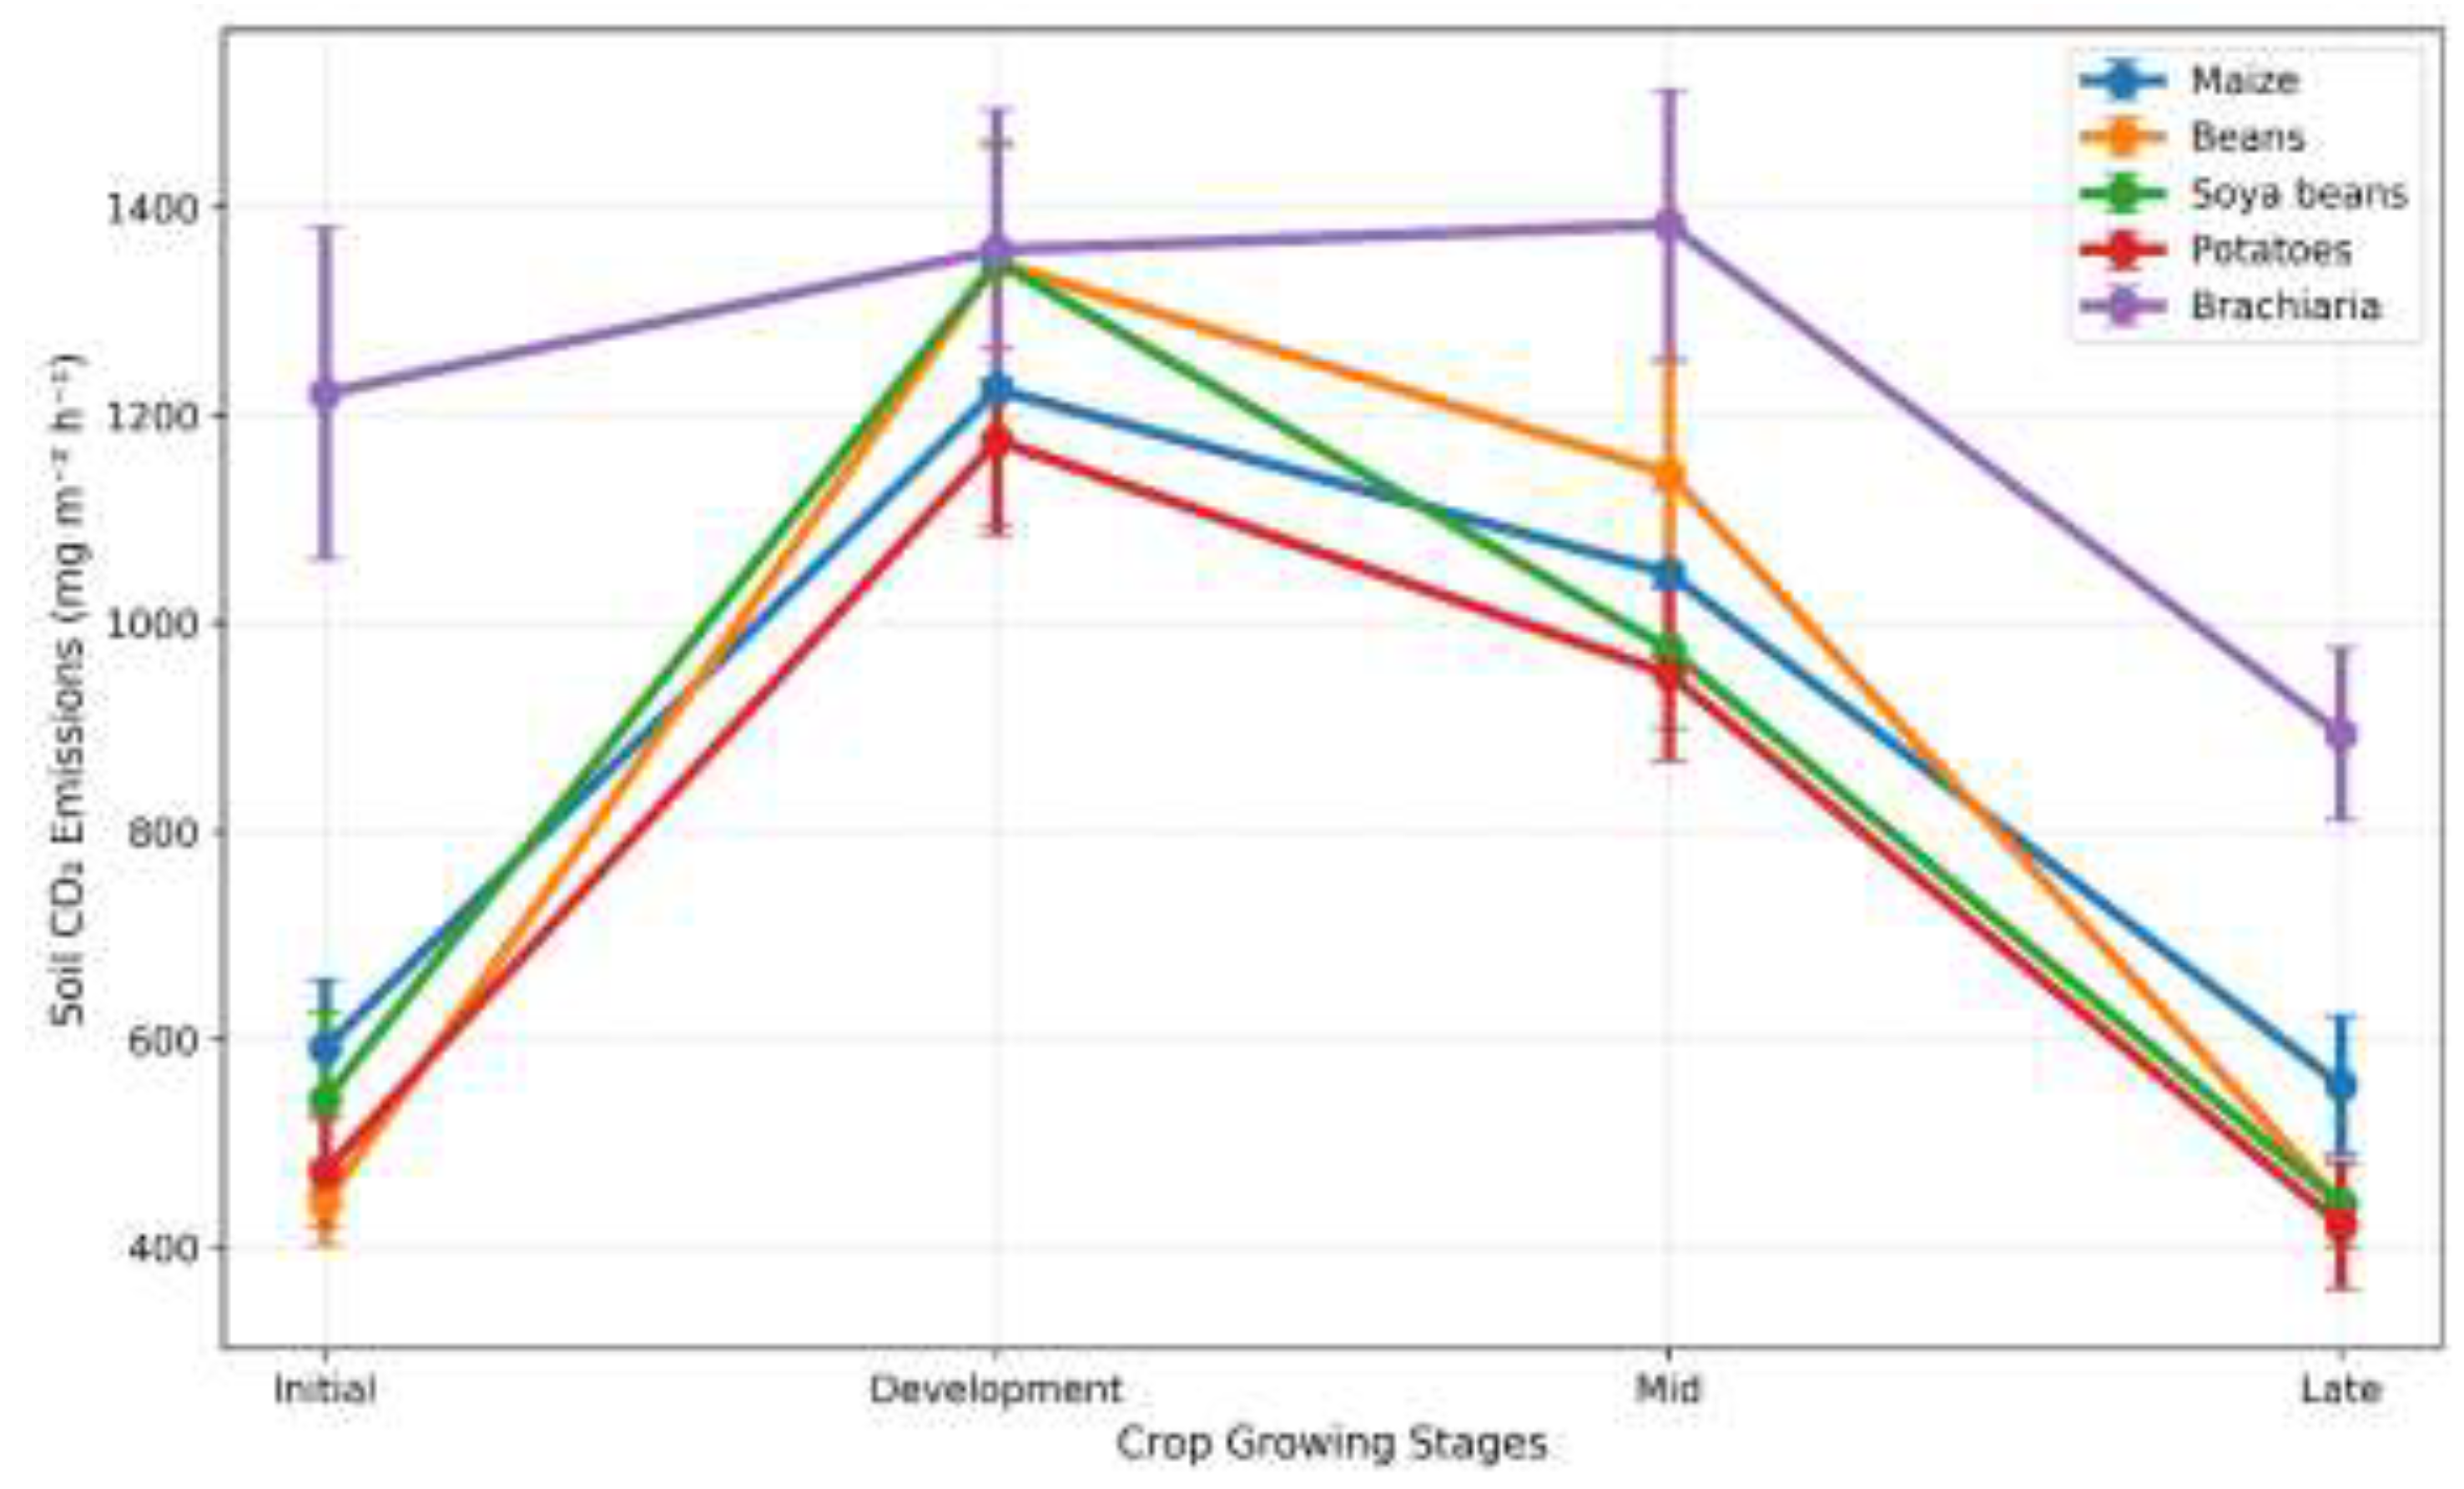
Figure 4.
Soil CO₂ emissions across crop growing stages under bare-soil conditions for each crop, averaged across rainfed and irrigated treatments.
Figure 4.
Soil CO₂ emissions across crop growing stages under bare-soil conditions for each crop, averaged across rainfed and irrigated treatments.
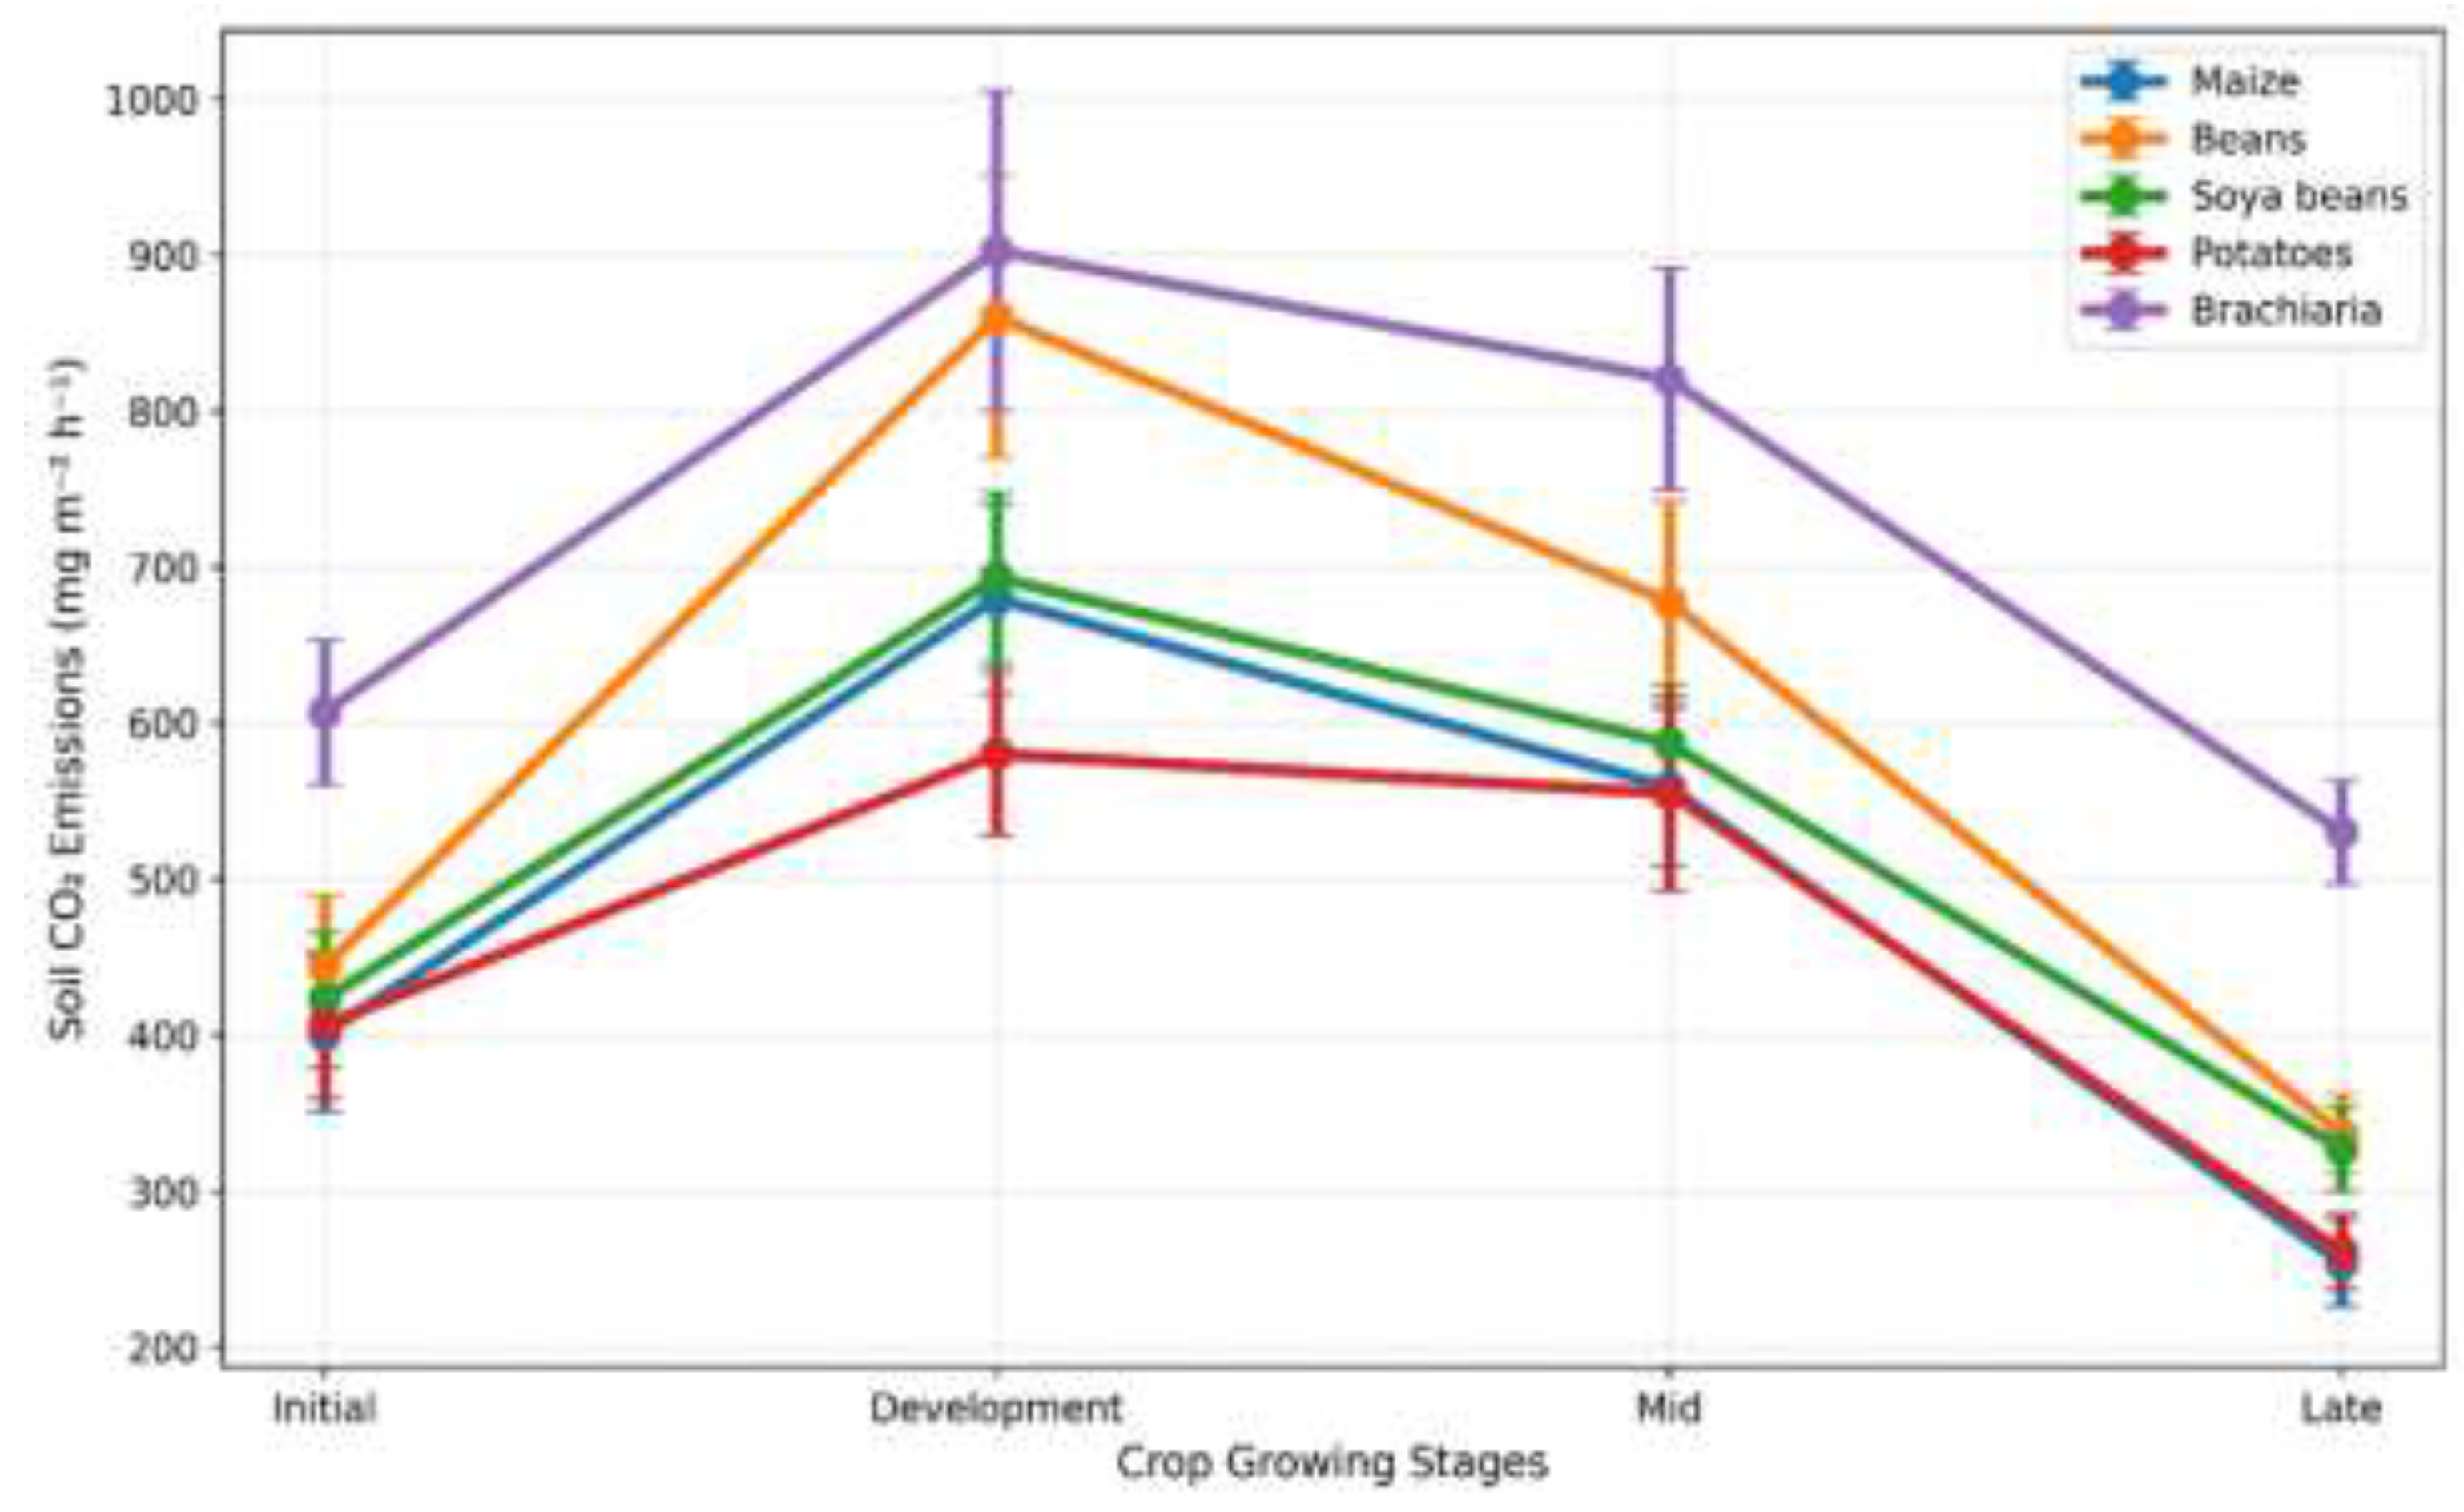
Figure 5.
Soil CO₂ emissions across seasons.
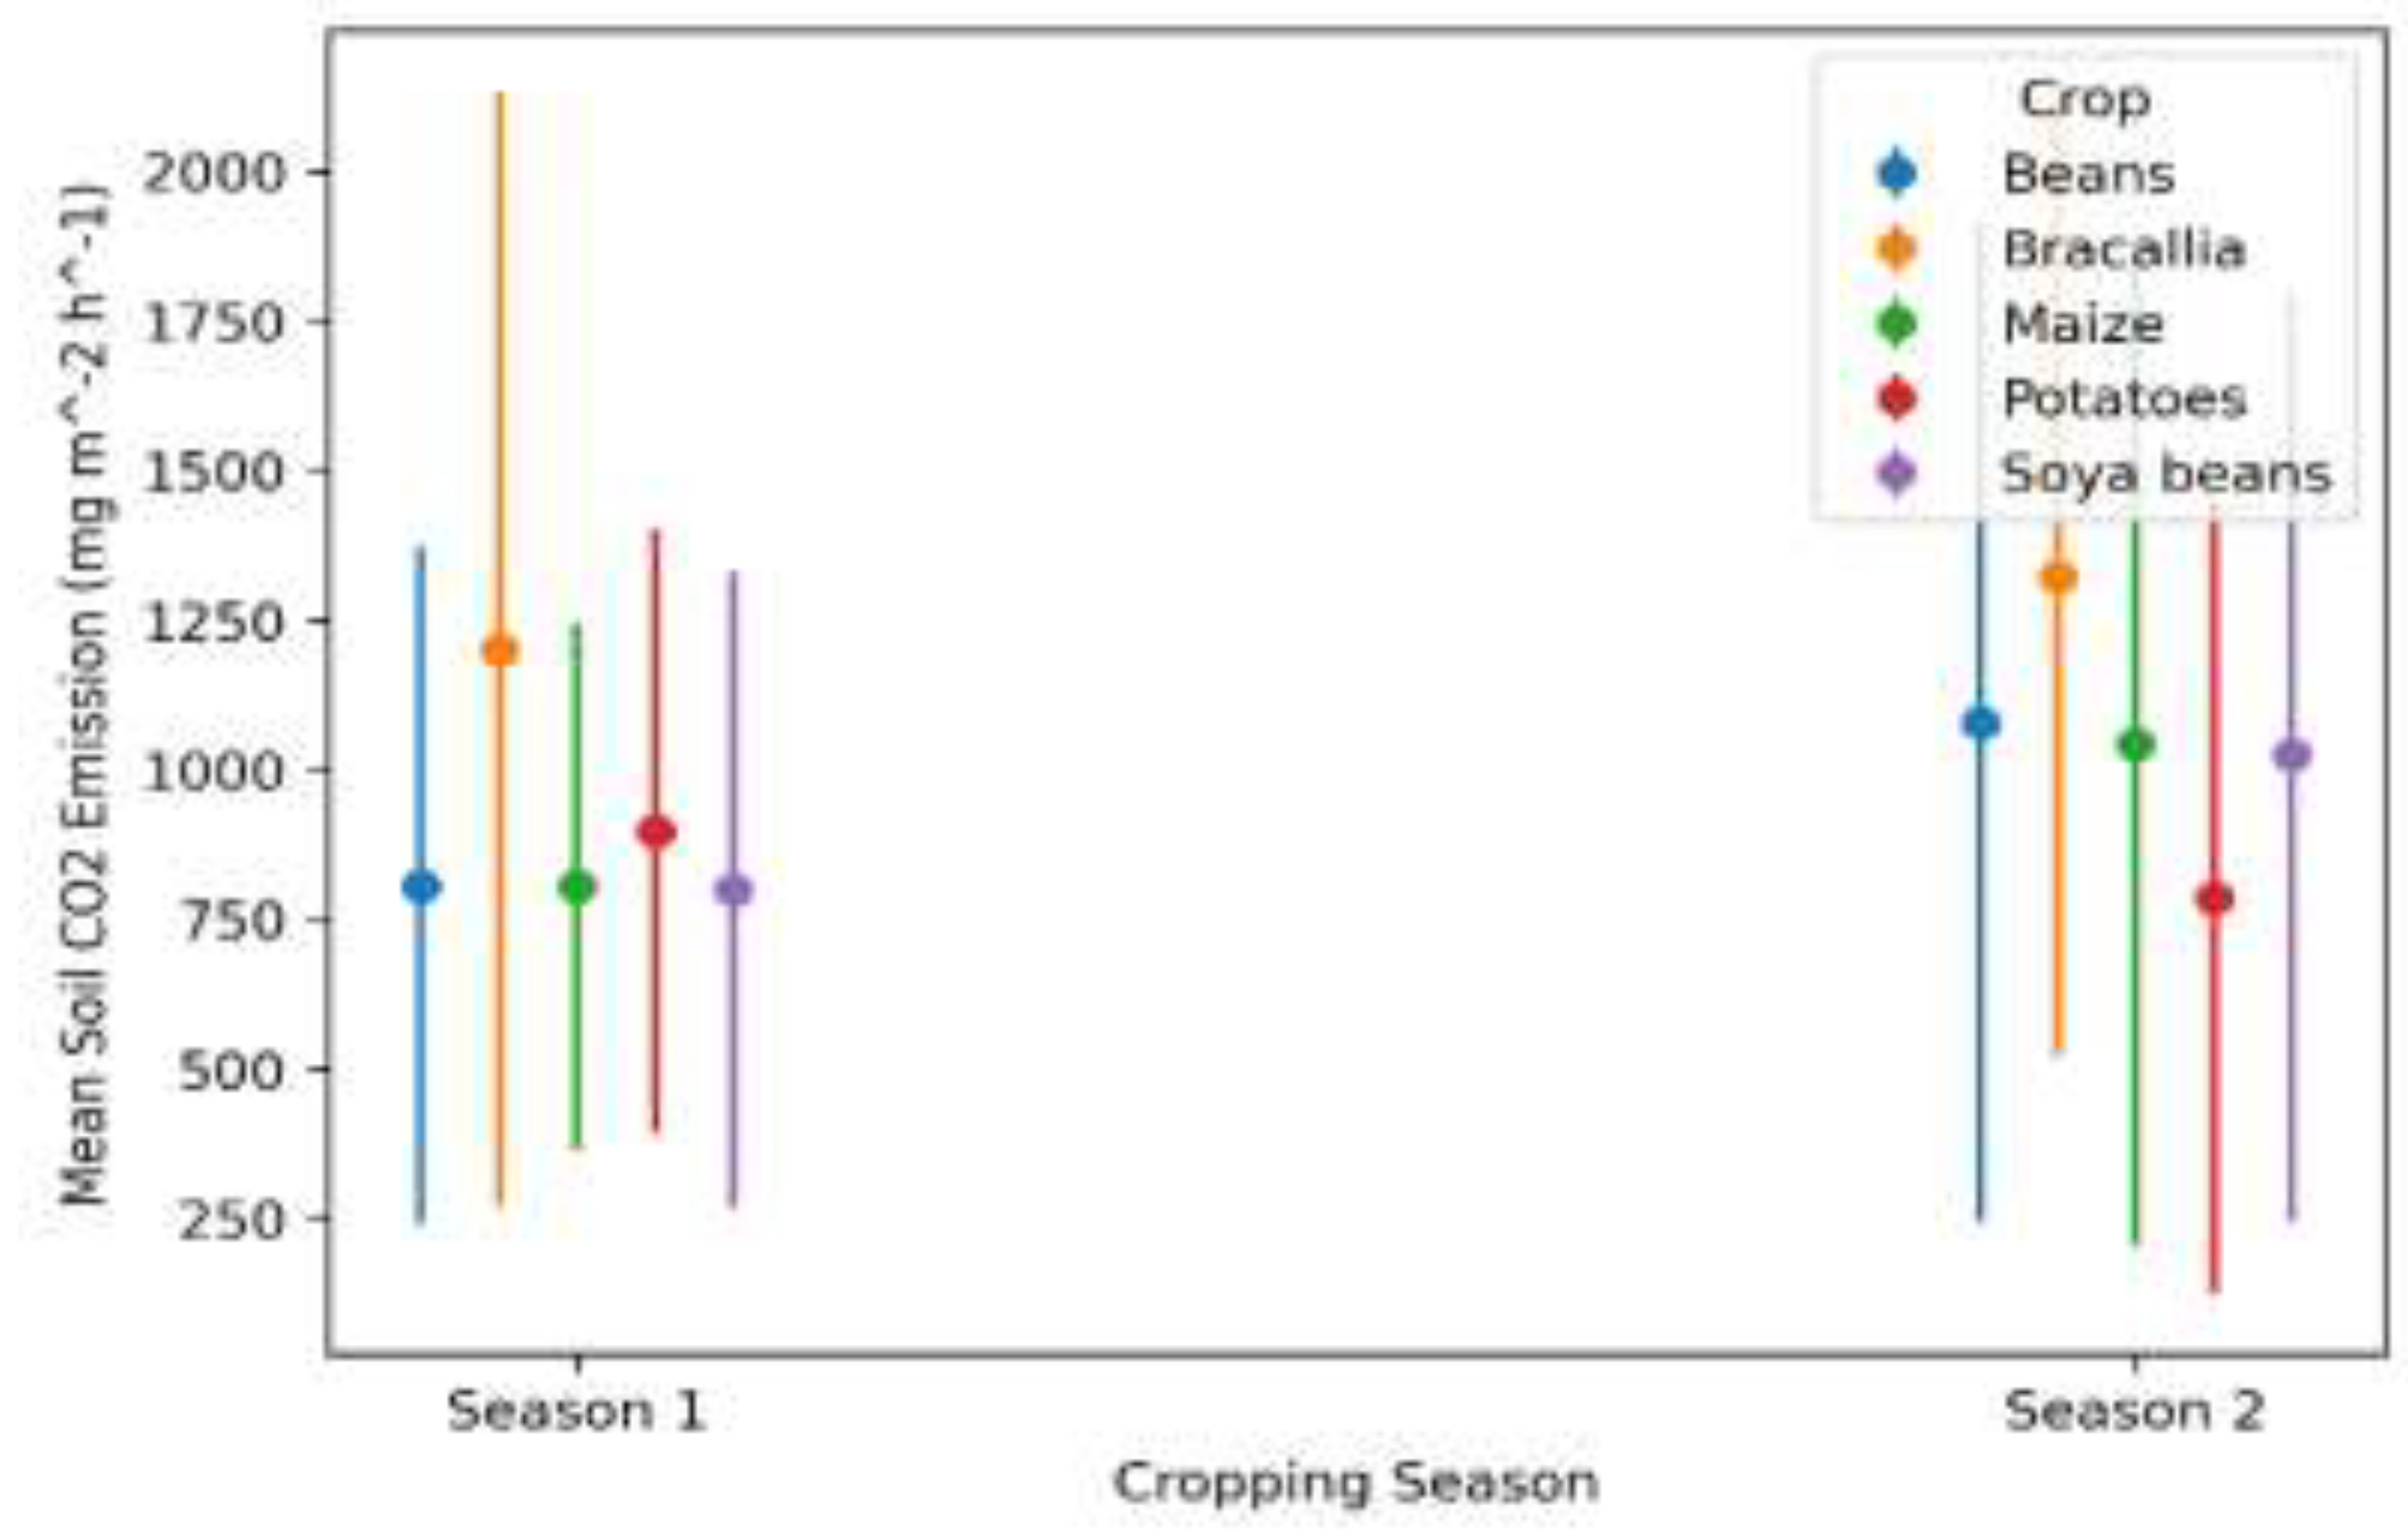
Figure 6.
Soil CO₂ emissions versus environmental parameters.
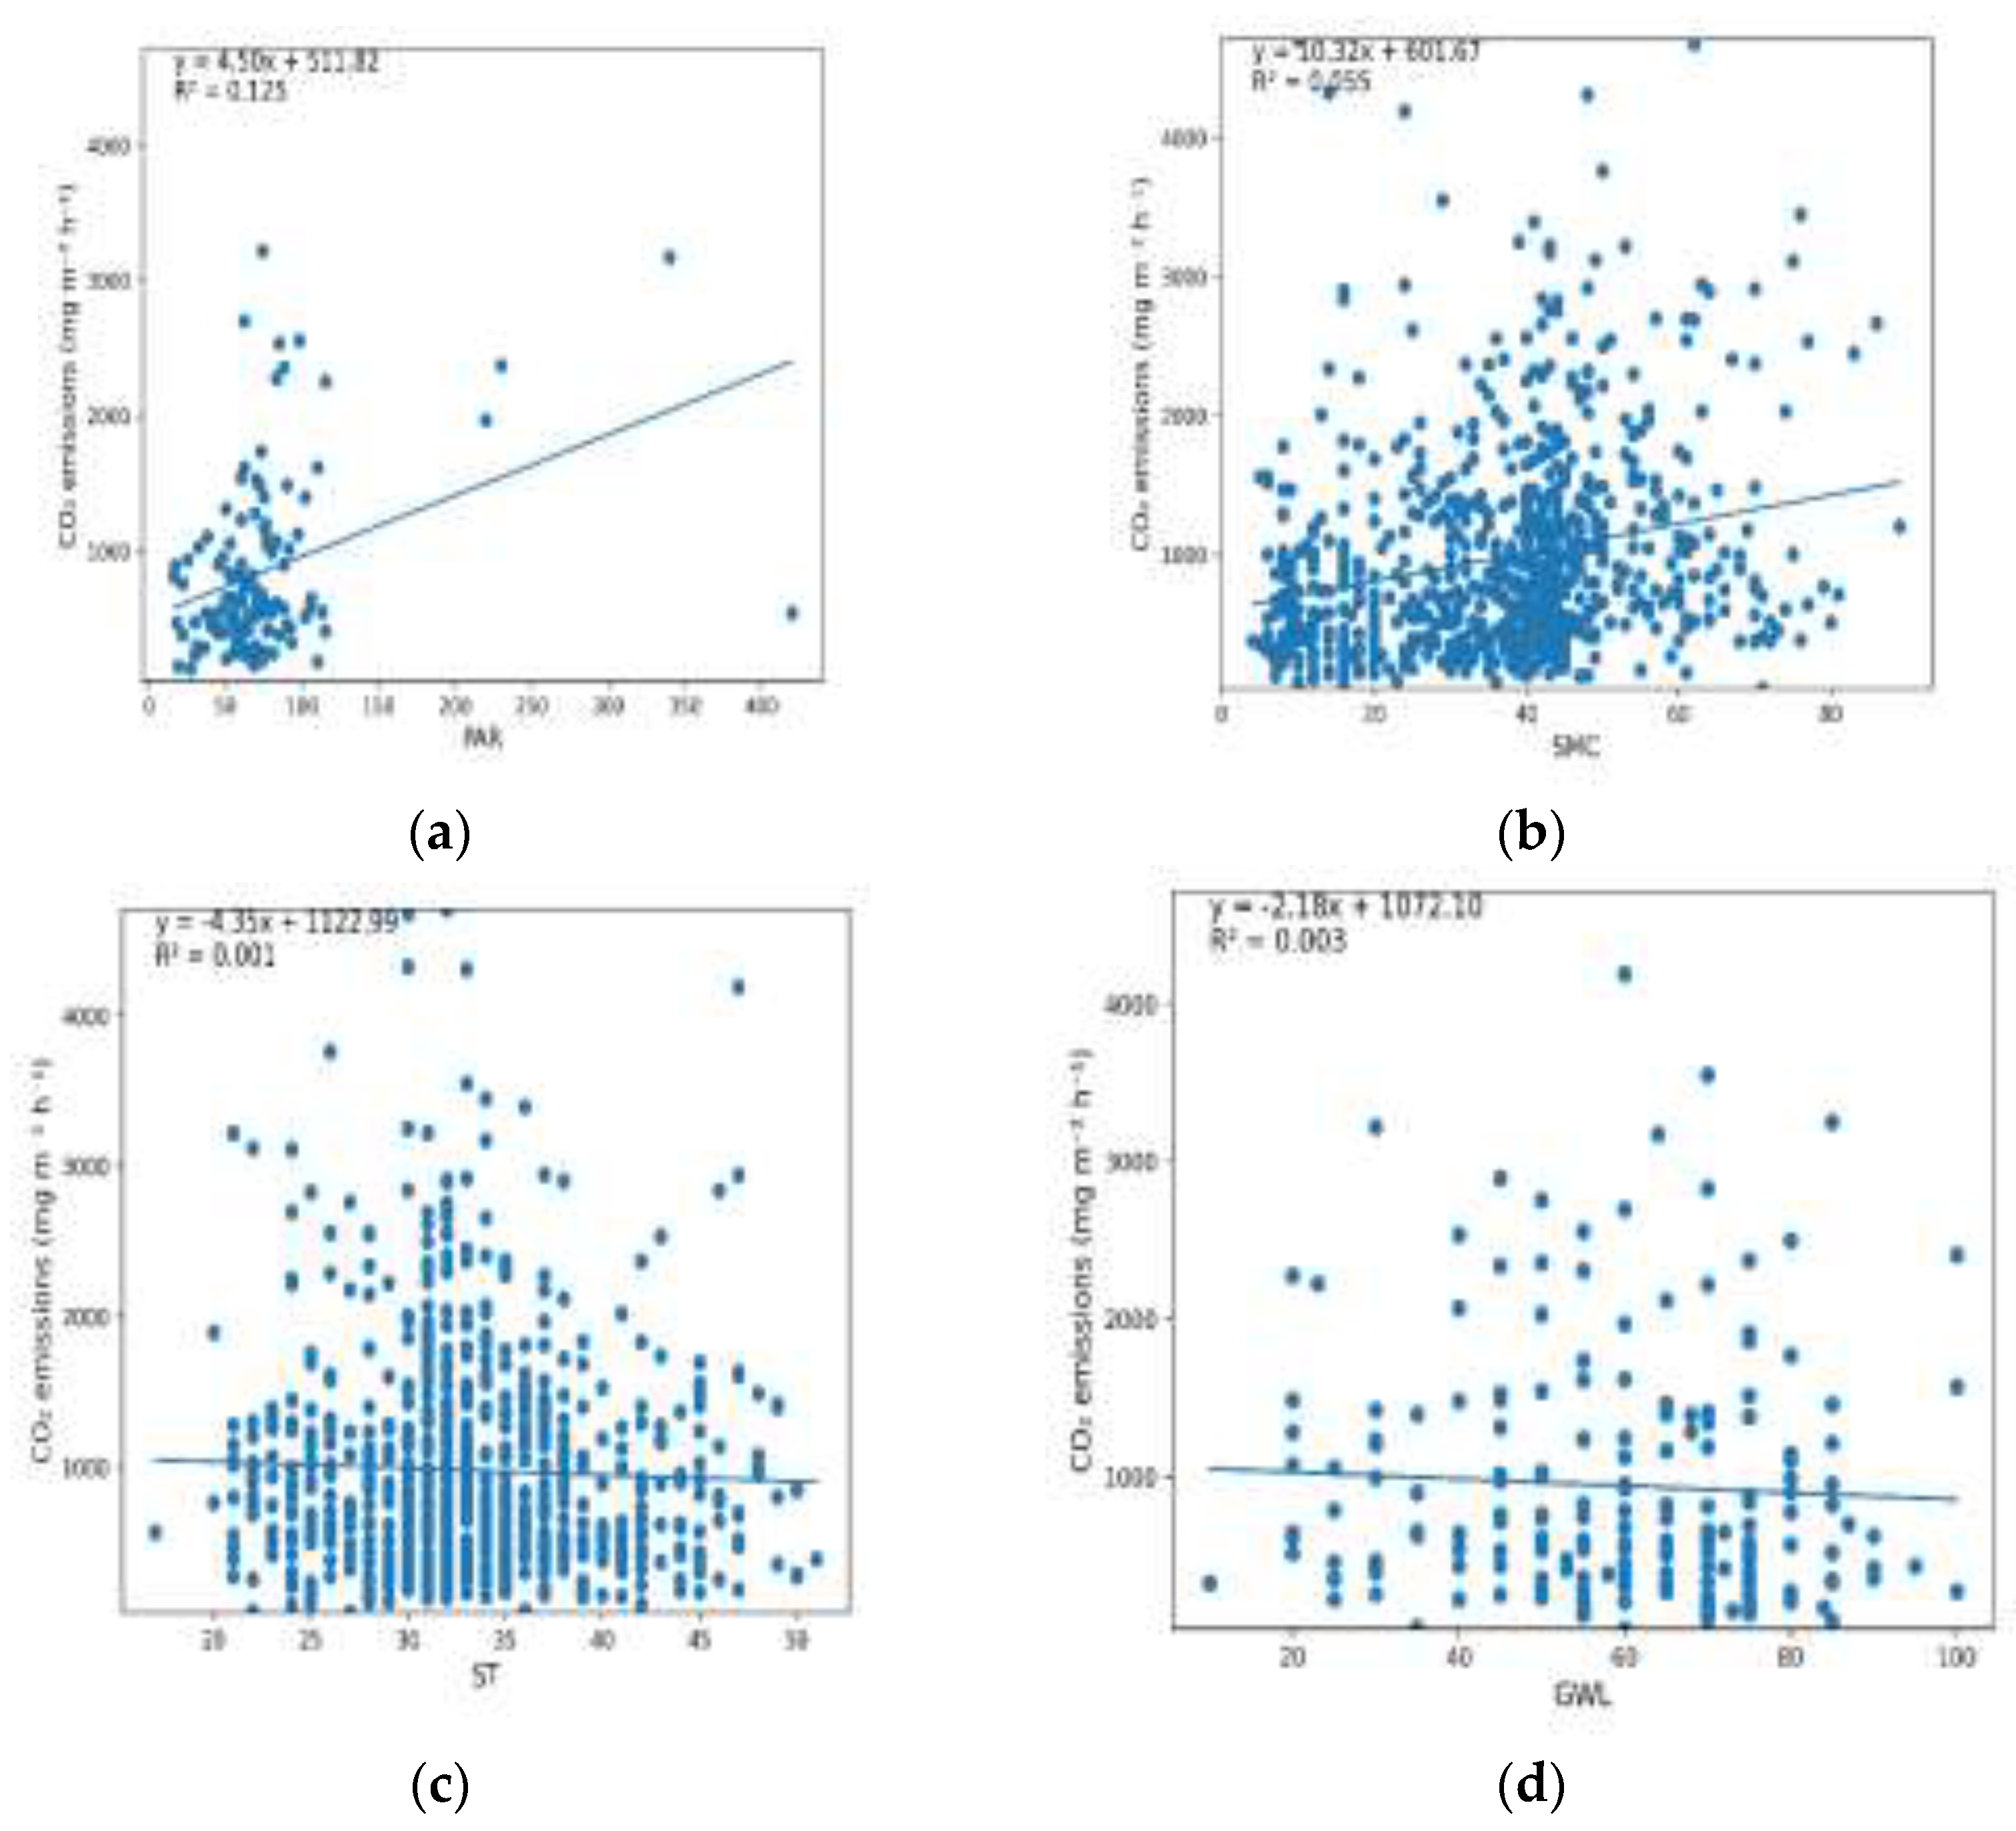
Figure 7.
Soil CO₂ emissions versus fertilization.
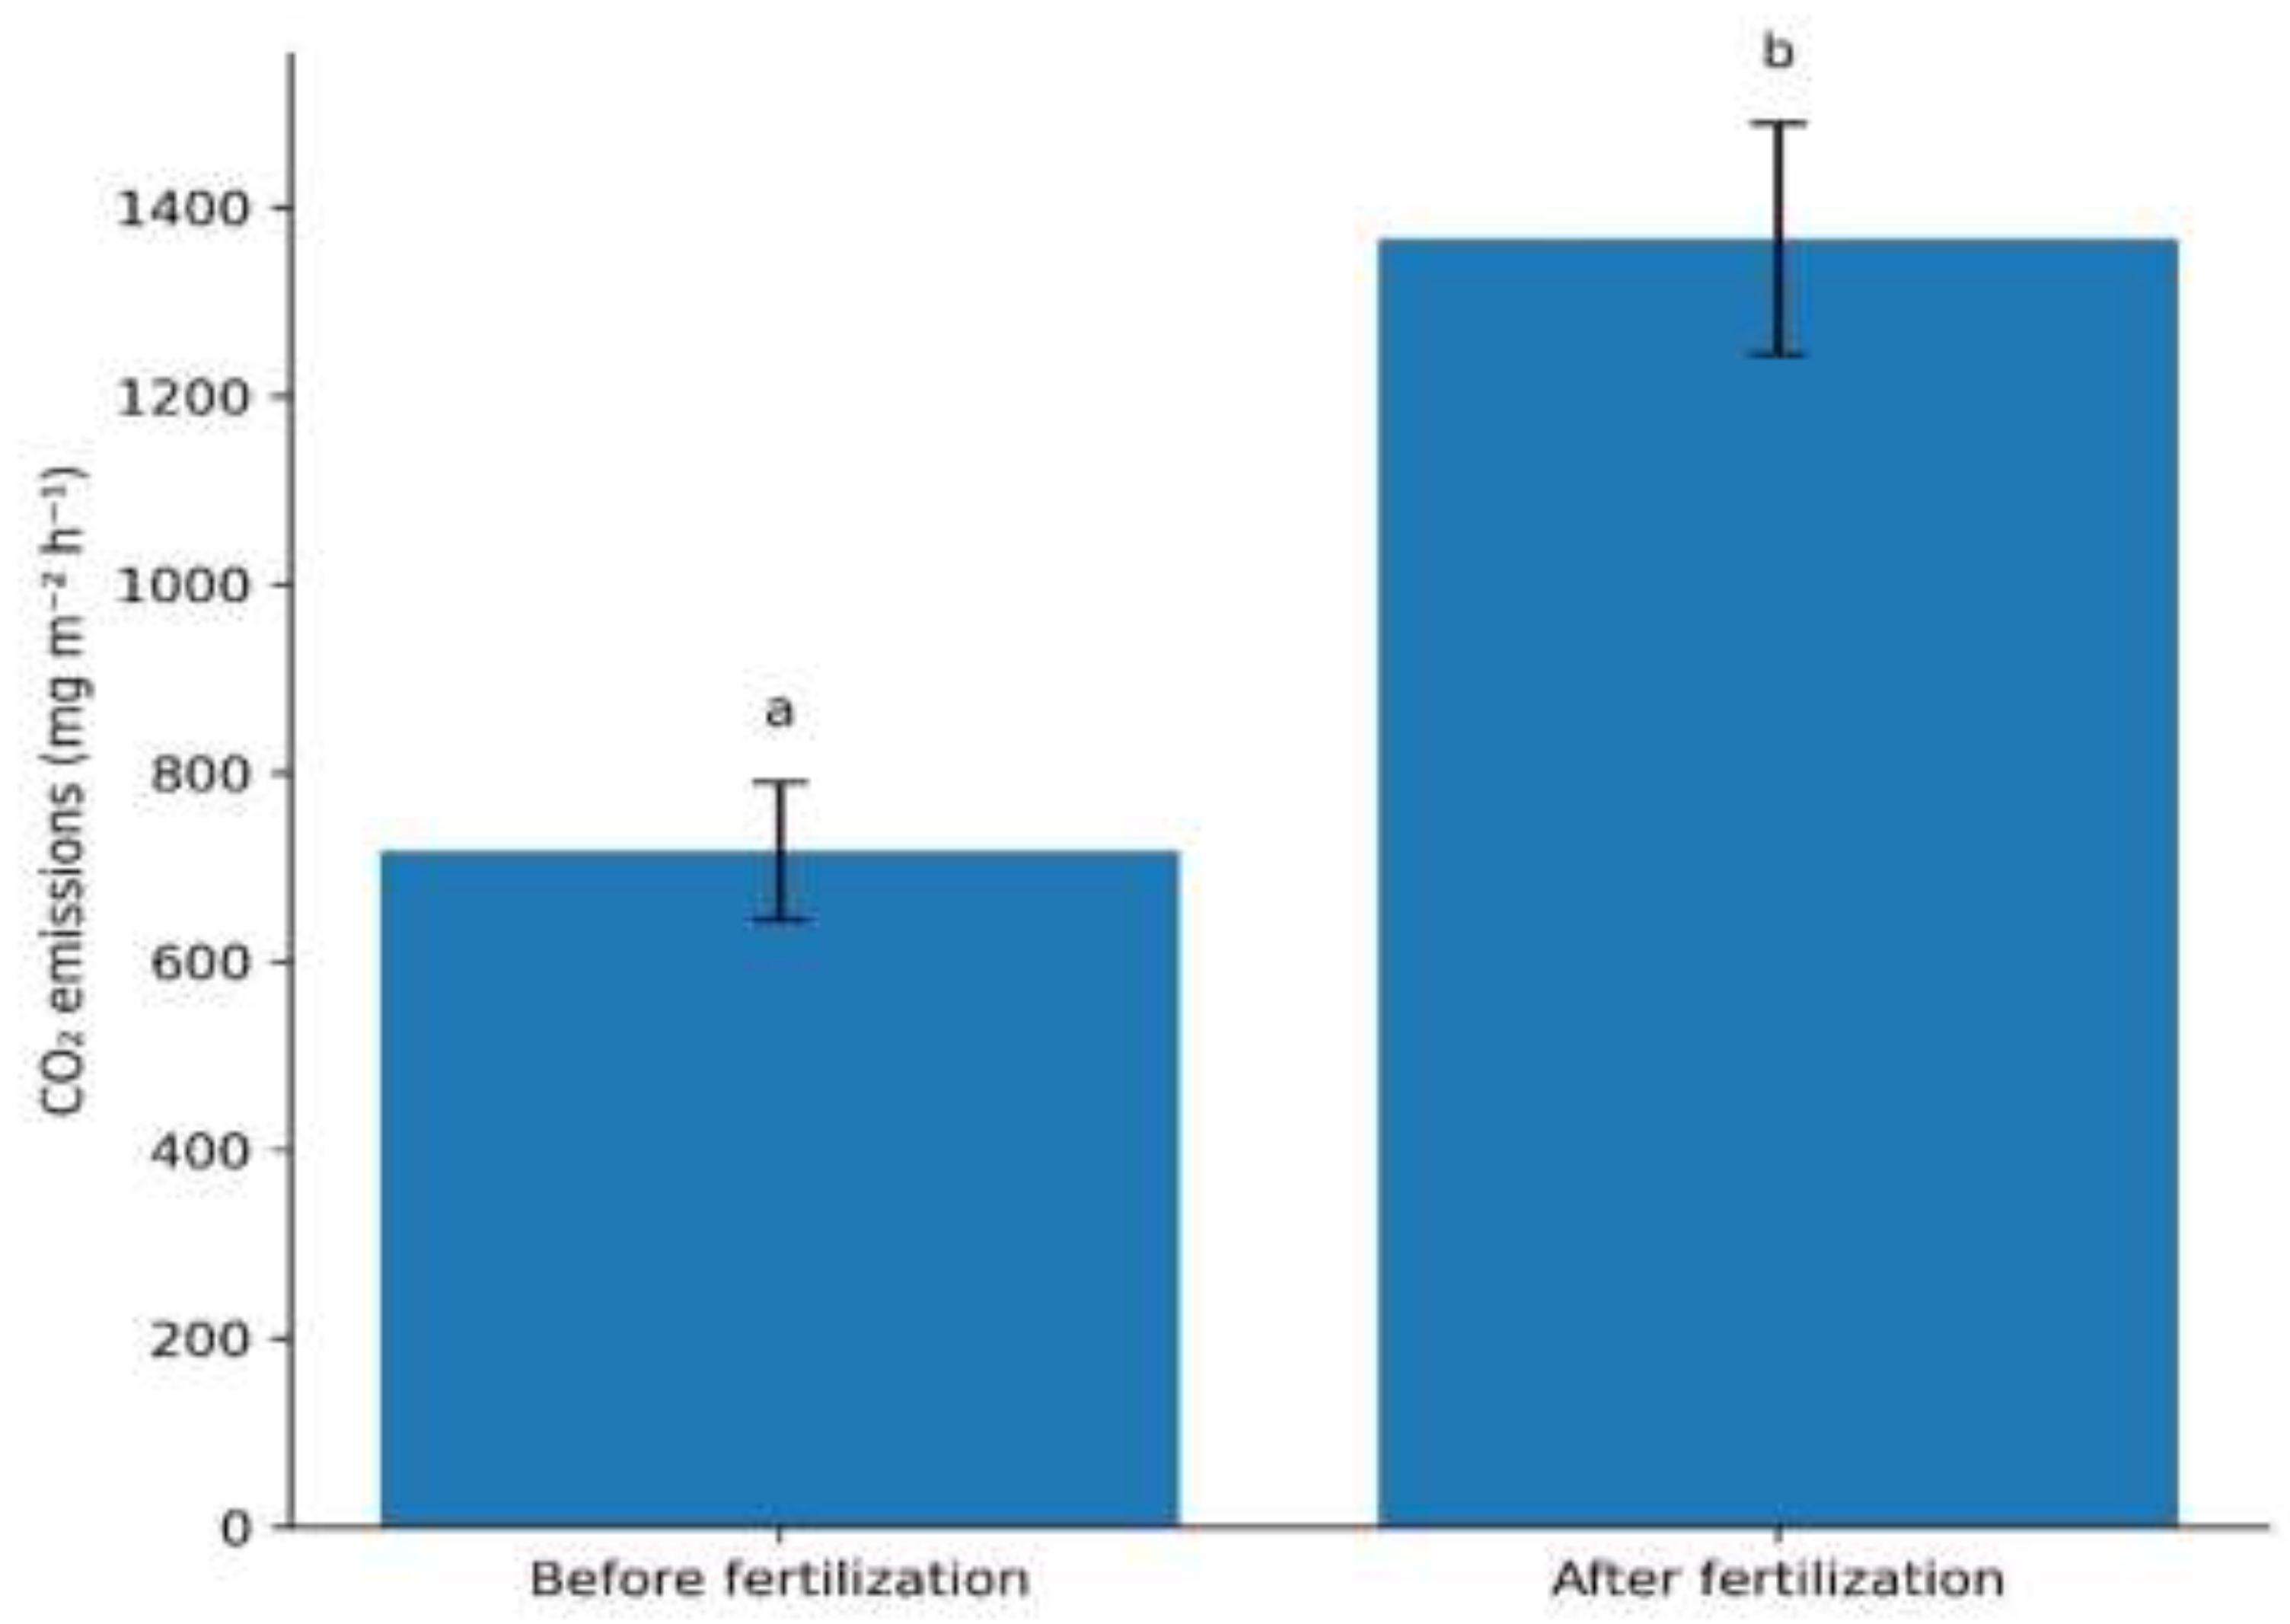

Table 1.
Soil physical properties of the study site at different depths.
| Depth (cm) | Texture class | Sand (%) | Silt (%) | Clay (%) | Bulk density (g cm⁻³) | Gravimetric moisture content (%) | EC (µS cm⁻¹) |
|---|---|---|---|---|---|---|---|
| 0–20 | Sandy loam | 66 | 26 | 8 | 1.32 | 11.8 | 27.8 |
| 20–40 | Sandy loam | 64 | 26 | 10 | 1.45 | 12.4 | 54.3 |
| 40–60 | Sandy loam | 62 | 26 | 12 | 1.59 | 13.8 | 78.4 |
| 60–80 | Sandy loam | 60 | 28 | 12 | 1.68 | 15.2 | 98.7 |
| 80–100 | Sandy loam | 58 | 29 | 13 | 1.78 | 16.4 | 112 |
1 EC = Electrical conductivity.
Table 2.
Soil chemical properties of the study site (0–20 cm) before amendment.
| Parameter | Unit | Mean value | Range |
|---|---|---|---|
| pH (H₂O) | – | 4.6 | 4.1–5.1 |
| Total nitrogen | % | 0.12 | 0.10–0.14 |
| Organic carbon | % | 1.7 | 1.5–1.8 |
| Available phosphorus | Ppm | 20 | 11–28 |
| Exchangeable Ca | cmol kg⁻¹ | 2.1 | 1.6–2.6 |
| Exchangeable Mg | cmol kg⁻¹ | 0.9 | 0.7–1.1 |
| Exchangeable K | cmol kg⁻¹ | 0.25 | 0.18–0.33 |
Table 3.
Soil chemical properties of the study site (0–20 cm) before amendment.
| Crop | Total N (kg ha⁻¹) | Total P₂O₅ (kg ha⁻¹) | Total K₂O (kg ha⁻¹) | Lime (kg ha⁻¹) | Compost (kg ha⁻¹) | |
|---|---|---|---|---|---|---|
| Irish potato | 124 | 120 | 126 | 2000 | 10000 | |
| Maize | 72.5 | 54.5 | 53.5 | 2000 | 10000 | |
| Soybeans | 72.5 | 54.5 | 26.5 | 2000 | 10000 | |
| Beans | 72.5 | 54.5 | 26.5 | 2000 | 10000 | |
| Brachiaria | 76.7 | 58.7 | 72.7 | 2000 | 10000 |
2 P₂O₅: Phosphorus pentoxide equivalent; K₂O: potassium oxide.
Table 4.
Mean soil CO₂ emissions under different crop types from crop covered conditions.
| # | Crop | Mean CO₂ emissions (mg m⁻² h⁻¹) |
|---|---|---|
| 1 | Beans | 949.64 |
| 2 | Brachiaria | 1264.26 |
| 3 | Soybean | 917.55 |
| 4 | Maize | 930.17 |
| 5 | Potato | 837.87 |
Table 5.
Mean soil CO₂ emissions under different crop types from bare soil conditions.
| # | Crop | Mean CO₂ emissions (mg m⁻² h⁻¹) |
|---|---|---|
| 1 | Beans | 632.42 |
| 2 | Brachiaria | 755.68 |
| 3 | Maize | 515.8 |
| 4 | Potatoes | 485.48 |
| 5 | Soya beans | 545.04 |
Table 6.
Mean soil CO₂ emissions, crop yield, and yield-scaled CO₂ emissions under irrigated and rainfed conditions.
Table 6.
Mean soil CO₂ emissions, crop yield, and yield-scaled CO₂ emissions under irrigated and rainfed conditions.
| Crop | Water management | Mean CO₂ (mg m⁻² h⁻¹) | Dry yield (kg ha⁻¹) | kg CO₂ kg⁻¹ dry yield | p value (total dry yield: irrigated and rainfed conditions) | p-value (CO₂ Kg per kg of dry yield: irrigated and rainfed conditions) |
|---|---|---|---|---|---|---|
| Beans | Irrigated | 880.25 | 5350 | 0.164 | <0.001 | 0.018 |
| Beans | Rainfed | 1 019.02 | 4630 | 0.219 | - | - |
| Brachiaria | Irrigated | 1 414.2 | 32150 | 0.044 | <0.001 | 0.28 |
| Brachiaria | Rainfed | 1 114.33 | 22300 | 0.05 | - | - |
| Maize | Irrigated | 985.71 | 9400 | 0.105 | <0.001 | 0.406 |
| Maize | Rainfed | 874.63 | 7570 | 0.116 | - | - |
| Irish potatoes | Irrigated | 884.67 | 14150 | 0.062 | <0.001 | <0.001 |
| Irish potatoes | Rainfed | 791.08 | 7570 | 0.11 | - | - |
| Soybeans | Irrigated | 922.66 | 4810 | 0.193 | <0.001 | 0.197 |
| Soybeans | Rainfed | 912.43 | 4020 | 0.225 |
Disclaimer/Publisher’s Note: The statements, opinions and data contained in all publications are solely those of the individual author(s) and contributor(s) and not of MDPI and/or the editor(s). MDPI and/or the editor(s) disclaim responsibility for any injury to people or property resulting from any ideas, methods, instructions or products referred to in the content. |
© 2026 by the authors. Licensee MDPI, Basel, Switzerland. This article is an open access article distributed under the terms and conditions of the Creative Commons Attribution (CC BY) license (http://creativecommons.org/licenses/by/4.0/).
Copyright: This open access article is published under a Creative Commons CC BY 4.0 license, which permit the free download, distribution, and reuse, provided that the author and preprint are cited in any reuse.


