Submitted:
08 April 2026
Posted:
10 April 2026
You are already at the latest version
Abstract
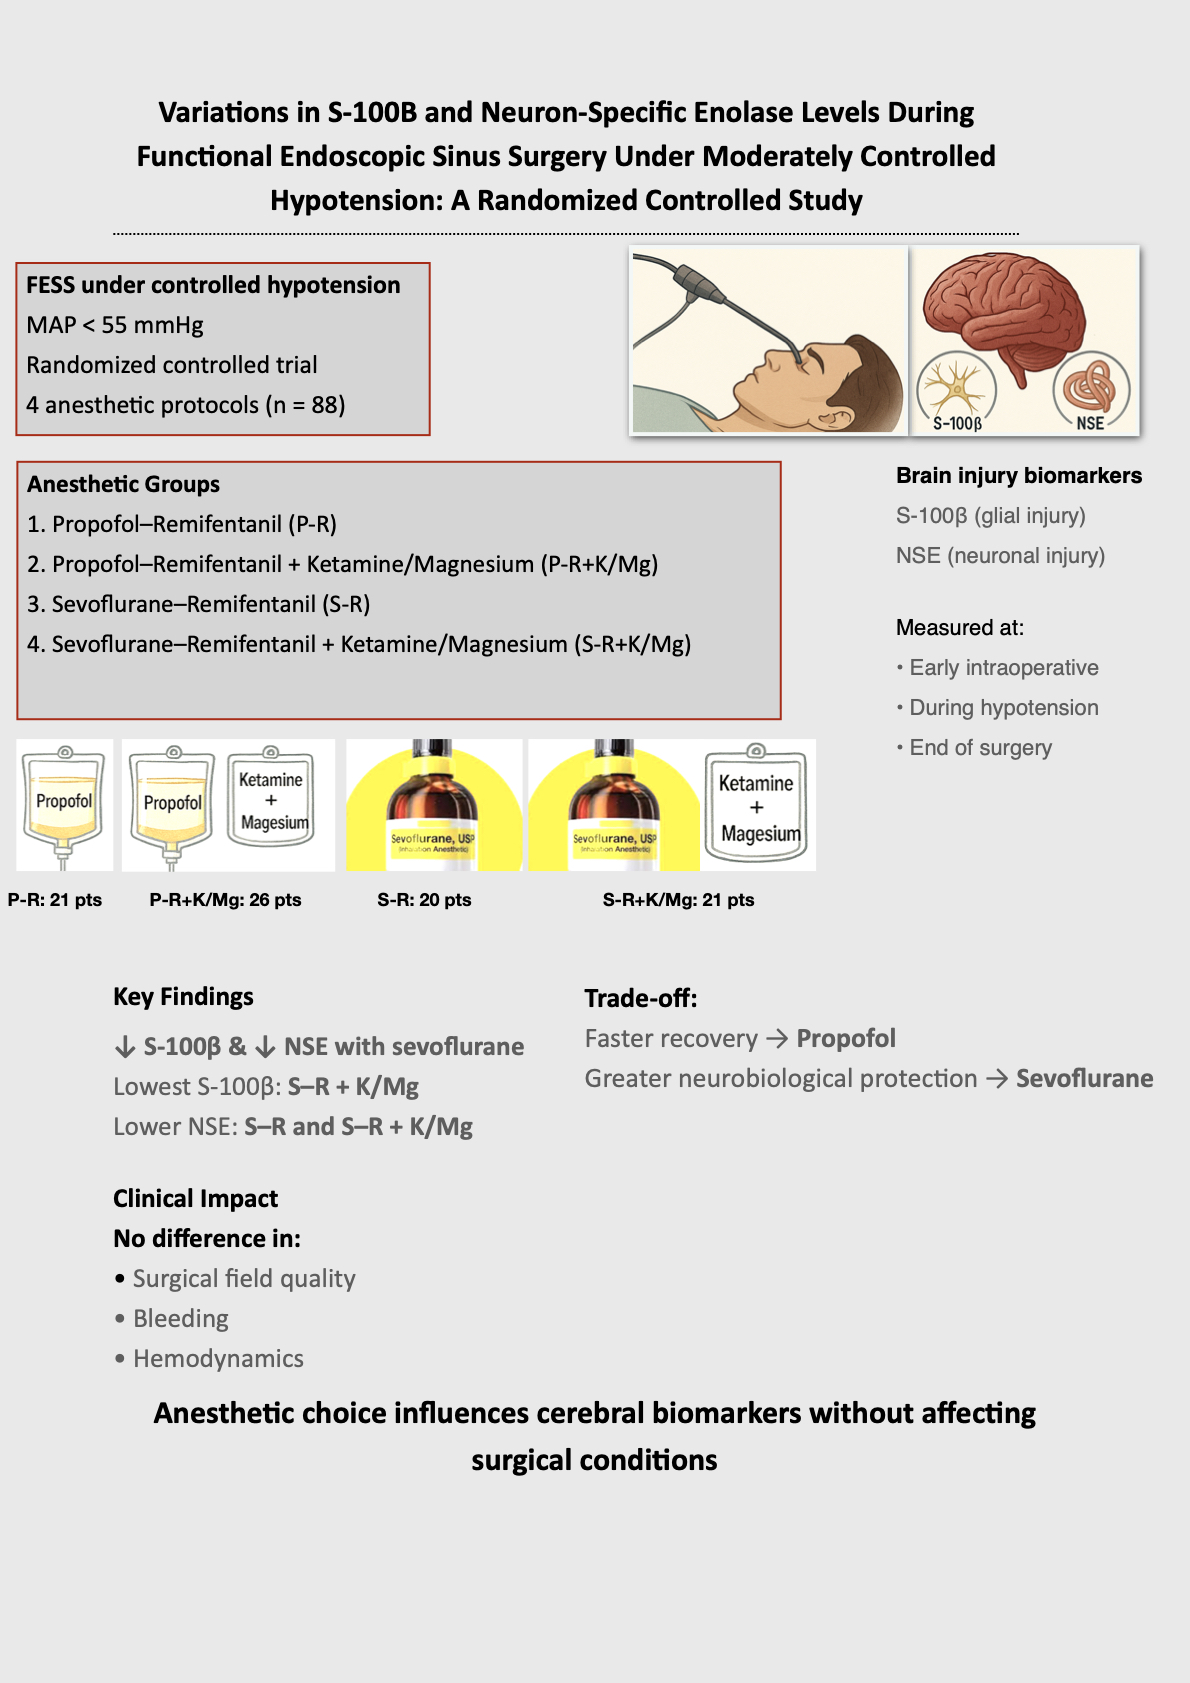
Background and Objectives: Controlled hypotension during functional endoscopic sinus surgery (FESS) improves surgical field visibility but may pose a risk of subclinical cerebral hypoperfusion. Serum S100Β and neuron‑specific enolase (NSE) are established biomarkers of glial and neuronal injury and may reflect perioperative neuroprotection associated with different anesthetic regimens. This study evaluated the effect of four anesthetic protocols on perioperative brain biomarker release during FESS. Materials and Methods: In this single‑center, randomized, controlled trial, 88 adult patients (ASA I–III) undergoing FESS under moderately controlled hypotension (mean arterial pressure <55 mmHg) were allocated to one of four groups: propofol–remifentanil, propofol–remifentanil with ketamine–magnesium, sevoflurane–remifentanil, or sevoflurane–remifentanil with ketamine–magnesium. Serum S100Β and NSE concentrations were measured at three timepoints: early intraoperatively, during hypotension, and at the end of surgery. Biomarker data were analyzed using nested ANOVA and linear mixed‑effects models adjusted for relevant covariates. Secondary outcomes included recovery characteristics, surgical field quality, bleeding scores, and perioperative hemodynamics. Results: Baseline demographic and perioperative characteristics were comparable across groups. The group receiving sevoflurane–remifentanil combined with ketamine–magnesium showed the lowest S100B levels (p=0.01 compared to the propofol-remifentanil group; p=0.04 compared to the sevoflurane-remifentanil group). Additionally, NSE concentrations were markedly lower in both sevoflurane groups (sevoflurane-remifentanil and sevoflurane-remifentanil plus ketamine–magnesium) compared to the propofol–remifentanil group (p=0.003 and p=0.007, respectively). No intergroup differences were observed at baseline. Recovery and extubation times were shortest with propofol–remifentanil, whereas ketamine–magnesium prolonged emergence. Surgical field quality, bleeding, and hemodynamic parameters did not differ significantly among groups. Conclusions: Anesthetic technique significantly influences perioperative brain biomarker release during FESS. Sevoflurane‑based regimens, with or without ketamine–magnesium, demonstrate more favorable neurobiological profiles under controlled hypotension, although propofol‑based anesthesia offers faster recovery.
Keywords:
functional endoscopic sinus surgery
; controlled hypotension
; anesthesia techniques
; sevoflurane
; propofol
; ketamine
; magnesium sulfate
; S-100Β
; neuron-specific enolase
; neuroprotection
1. Introduction
Functional endoscopic sinus surgery (FESS) is a minimally invasive technique used to treat chronic sinusitis. The procedure carries risks due to the proximity of vital structures like the orbit, brain, and carotid vessels. Furthermore, limited access to operating rooms and bleeding that can obscure endoscopic vision may increase the chances of complications such as optic nerve injury, dural puncture, or hemorrhage. For these reasons, inducing hypotension during surgery is essential. A bloodless surgical field provides better visibility of the operative field, with reduced risk of injury to adjoining structures [1,2]. On the other hand, several studies reported a significant correlation between intraoperative hypotension and organ injury [3,4,5].
A variety of pharmacological agents have demonstrated efficacy in achieving controlled hypotension to enhance surgical outcomes [1,2,6,7,8]. There is no definitive evidence indicating that either propofol or sevoflurane is superior for brain protection across all surgical contexts; each agent offers distinct advantages, and current research findings remain mixed and dependent on the specific clinical scenario [9,10,11,12]. Ketamine was found to decrease spreading depolarizations, which are associated with secondary brain injury, suggesting a potential neuroprotective role in cases of traumatic brain injury [13,14,15,16]. Animal and experimental studies on traumatic brain injury show that magnesium given before or soon after injury may reduce neuronal damage and improve motor or behavioral outcomes, indicating a neuroprotective effect [17,18,19,20].
Timely identification and assessment of patients exhibiting perioperative neurological dysfunction is of significant clinical importance. Biomarkers are defined as biological molecules that serve as indicators of the onset or progression of biological processes, or as measures of treatment effects. In this context, biomarkers have gained prominence as valuable adjuncts to traditional diagnostic modalities such as electroencephalography, sensory and motor evoked potentials, transcranial Doppler ultrasound, near-infrared spectroscopy, and various imaging techniques [21]. Non-traumatic ischemic injuries result from oxygen deprivation during certain surgeries, extracorporeal membrane oxygenation, acute stroke, or cardiac arrest [21]. Numerous studies aimed to identify specific biochemical markers that can indicate ischemic brain injuries in these conditions [21,22,23,24,25,26,27]. The presence of these biomarkers may also be observed in conditions unrelated to ischemic injuries; for instance, S100B and neuron-specific enolase (NSE) can be elevated in cases of infections and sepsis [28], and their elevation may additionally be associated with tumors [27,29].
An optimal biomarker for the diagnosis, prognosis, and monitoring of brain injury should demonstrate central nervous system specificity, be readily accessible, and exhibit resistance to both cytoplasmic and extracellular proteolytic degradation. Such a biomarker must possess high diagnostic specificity and sensitivity and offer predictive value for short-term as well as long-term outcomes. Additionally, it is essential that biomarker concentrations accurately correspond to the degree of CNS injury and respond favorably to neuroprotective interventions. Despite the confirmed correlations between the changes in biochemical markers and brain injuries, the use of individual markers is limited due to low sensitivity and specificity [30]. S100B and NSE are considered the most promising and extensively studied biomarkers for brain injury [31,32]. S100B is a calcium-binding protein released into the extracellular space after cell injury, either actively or passively. While typically found in low levels in serum or cerebrospinal fluid, its concentration rises significantly during intracranial injuries [21,31]. NSE is an isoenzyme of the enolase (EC 4.2.1.11), which can be primarily found in the cytoplasm of neurons and is not normally secreted from cells. It is released only in the event of neuronal damage, so it is considered to be a biomarker that directly assesses functional neuronal damage [21,28,33,34]. This study compares four pharmacological anesthetic protocols by measuring S100Β and NSE as indicators of brain injury, along with surgeon satisfaction [29] and surgery duration.
2. Materials and Methods
2.1. Study Design and Patient Selection
This study is a single-center, randomized, comparative, controlled clinical trial with a 1:1:1:1 concealed allocation, conducted at the General University Hospital of Patras, a tertiary referral hospital in Patras, Greece. The study protocol received approval from our institution’s Ethics Committee (Institutional code: 509/2024). Additionally, it was prospectively registered with the Clinical Research Information Service under registration number NCT07181564 preceding the recruitment of the initial participant. Written informed consent was obtained from parents or legal guardians before any participant was enrolled in the study. The research was conducted in accordance with Good Clinical Practice guidelines and adhered to the principles outlined in the Declaration of Helsinki [35].
The trial included patients 18 years of age or older, who were classified as American Society of Anesthesiologists Physical Status (ASA-PS) I to III. Patients were excluded if they had conditions precluding controlled hypotension, such as pregnancy, hypertension, coronary heart disease, heart failure, stroke, asthma, diabetes, known allergies or contraindications to study drugs or anesthetics, impaired kidney function, or liver disorders. All participants were scheduled to undergo FESS under general anesthesia with controlled hypotension.
2.2. Randomization and Group Allocation
Participants were randomly assigned to one of four anesthesia protocol groups through random permuted block randomization, which was conducted prior to induction of anesthesia. The four study groups were as follows: Group 1 received Propofol/Remifentanil; Group 2 received Propofol/Remifentanil with the addition of magnesium sulfate (M+) and ketamine (Mg⁺/Ketamine); Group 3 received Sevoflurane/Remifentanil; and Group 4 received Sevoflurane/Remifentanil with Mg⁺/Ketamine. Patients in groups 2 and 4 received a 0.2 mg/kg IV ketamine bolus after anesthesia induction, then 0.15 mg/kg/h by infusion. They also got a 50 mg/kg IV magnesium sulfate bolus over 15 minutes, followed by an 8 mg/kg/h infusion until extubation. All patients were given 8 mg of intravenous dexamethasone during surgery to reduce airway swelling and minimize coughing upon extubation. Additionally, before extubation, each patient received an extra 20–60 mg of intravenous xylocaine to prevent coughing and complications such as bronchospasm, laryngospasm, asthma attacks, agitation, and tachycardia.
The group designation was kept confidential from patients, their legal guardians, attending nurses in the post-anesthesia care unit (PACU), and postoperative outcome assessors. However, the attending anesthesiologists and operating room staff were not blinded to the group assignments. Despite this, the investigators responsible for performing the statistical analysis of the data, as well as the individual measuring the levels of biomarkers, remained blinded to the group designations.
2.3. Perioperative Monitoring and Procedures
The study was conducted in the operating rooms of the General University Hospital of Patras between June 2025 and December 2025. Each surgical procedure was attended by two anesthesiologists and a nurse from the anesthesiology department.
Upon arrival in the operating room, intravenous access was established in all patients, and standard monitoring was initiated. Heart rate (HR) and mean arterial pressure (MAP) were recorded at predefined intraoperative timepoints. For blood sampling and invasive blood pressure monitoring, an arterial catheter was inserted into the radial artery under local anesthesia. Continuous invasive monitoring allowed for the maintenance of intraoperative hypotension, targeting a MAP of less than 55 mmHg.
Blood gas analyses were performed to optimize arterial oxygen (PO₂) and carbon dioxide (PCO₂) levels during mechanical ventilation. The depth of anesthesia was monitored using bispectral index (BIS) technology (version 3.50 software, Medtronic), with target BIS values of 35 to 40 if the target hypotension was achieved. In cases where additional hypotension occurred, lower BIS values were deemed acceptable.
2.4. Anesthesia Induction and Sample Collection Procedures
Anesthesia was induced with propofol at a dose of 2 mg/kg, remifentanil at 2 μg/kg, and rocuronium at 0.6 mg/kg. Following induction, endotracheal intubation was performed, and mechanical ventilation was initiated. The ventilation parameters were adjusted to target an end-tidal carbon dioxide (ETCO₂) level of 30–35 mmHg or a blood partial pressure of carbon dioxide (PCO₂) around 35 cmH₂O. Minimum alveolar concentration (MAC) values were recorded for sevoflurane. Blood gas analysis and samples for S-100Β and NSE were collected at predetermined intervals: 10 minutes after the onset of surgery, 20 minutes after the initiation of deliberate hypotension, and upon completion of the procedure. After collection, the blood samples were allowed to thicken for 30 minutes at room temperature. Subsequently, they were centrifuged for 15 minutes at 1000 × g to separate the serum, which was then stored at –80 °C for preservation. Access to the collected samples was restricted to two primary researchers. All samples were retained for a period of two years to ensure proper study documentation and potential future analysis.
2.5. Statistical Analysis and Calculation of Patient Sample
The sample size was determined using power analysis (G-power, F-tests, ANOVA: Repeated measures, within-between interactions). To detect a potential statistical difference among four patient groups, considering three biomarker measurement time points, with α = 0.05, power = 90%, and an effect size of 0.25 (10% variance explained by the special effect, 90% error variance, numerator df=3), a total of 80 patients was required—20 per group. To account for an anticipated 10% dropout rate after randomization, we enrolled 26 patients in each group
Data were analyzed using SPSS (version 27.0) and GraphPad Prism (version 10.6.1). The Kolmogorov-Smirnov and Shapiro-Wilk tests assessed normality. Normally distributed data were compared with mixed ANOVA and post-hoc Student t-tests, applying Sidak correction for multiple comparisons. Greenhouse-Geisser epsilon correction was used to adjust for violations in sphericity. Non-normally distributed data were analyzed with the Kruskal-Wallis test and post-hoc Mann-Whitney U-tests, with Dunn test adjustment. Chi-square tests were used for analog and categorical data.
Serum S100B and NSE were measured at three timepoints for each patient across four anesthesia groups. Values below the limit of detection (LOD) were recorded as LOD/√2, then all values were subsequently log-transformed. A nested one-way ANOVA group analysis, supplemented by Tukey’s multiple comparison test, was employed to identify differences in biomarkers across the groups. Linear mixed-effects models were also used, incorporating random intercepts for patients and an unstructured within-subject covariance for each timepoint. Both group and timepoint were included as fixed effects. The adjusted model also controlled for gender, smoking status, and weight. Restricted Maximum Likelihood (REML) estimation with Satterthwaite degrees of freedom was applied; comparisons of Estimated Marginal Means (EMMeans) were adjusted using the Sidak method. If no significant group × timepoint interaction was present, only the main effects were reported. Statistical significance was determined at P<0.05.
2.6. Outcomes Measures
The principal outcomes evaluated in this study were the changes in plasma S-100Β and NSE concentrations at three distinct time points: T1 (10 minutes following the onset of surgery), T2 (20 minutes after the initiation of controlled hypotension), and T3 (upon completion of the procedure). The research examined variations in plasma biomarkers relative to the anesthetic pharmacological protocols employed. Secondary endpoints encompassed surgeon satisfaction measured by Likert scale ratings [29], bleeding score (Grade 1 to 5), recovery duration, Sedation-Agitation Score (SAS), Aldrete Score, perioperative hemodynamic parameters, drug doses, total operative time and adverse events (delirium, cough, apnea, nausea/vomiting).
3. Results
3.1. Demographics and Baseline Characteristics
Totally 88 patients were included in the analysis (Figure 1). Baseline demographic and perioperative characteristics were comparable across the four anesthetic groups (Table 1). There were no statistically significant differences in gender distribution (p = 0.64), age (p = 0.85), weight (p = 0.60), or BMI (p = 0.43). ASA-PS was similarly balanced (p = 0.37), with most patients classified as ASA-PS I–II. Smoking status also did not differ significantly between groups (p = 0.20). Surgical duration was comparable across the four groups (p = 0.43), indicating similar procedural complexity and exposure time. Overall, the absence of statistically significant differences in demographic and perioperative variables confirms that the study groups were well balanced at baseline, minimizing potential confounding and strengthening the validity of subsequent comparisons in biomarker levels (S100B and NSE).
Demographic parameters (gender, age, weight, BMI), ASA physical status, smoking status, and surgical duration for patients allocated to the four anesthetic groups. Continuous variables are presented as mean ± standard deviation (SD). Categorical variables are expressed as n (%). P-values refer to comparisons across all four groups and were calculated using ANOVA for normally distributed variables, Kruskal–Wallis tests for non-normally distributed variables, and χ² tests for categorical data. No statistically significant differences were observed among groups, indicating appropriate baseline comparability.
3.2. Primary Outcomes
S100B analysis
S100B was assessed at three different timepoints for each group. Specifically, 63 samples were collected from Group 1 (21 participants), 84 from Group 2 (26 participants), 57 from Group 3 (20 participants), and 69 from Group 4 (21 participants).
A nested one-way ANOVA group analysis (Table 2 and Figure 2), using Tukey’s multiple comparison test, demonstrated that Group 4 exhibited the lowest ln(S100Β) values, with statistically significant reductions compared to Group 1 (p = 0.01) and Group 3 (p = 0.04). Further analysis employing a mixed-effects model (REML) with post hoc pairwise comparisons adjusted by the Sidak method showed that Group 1 had significantly higher ln(S100B) levels than Group 4 at T3 (mean difference: Δln = 0.91, p = 0.001). Additionally, Group 2 presented significantly elevated ln(S100B) levels relative to Group 4 at T2 (p = 0.03, mean difference: Δln = 0.69) and at T3 (p < 0.001, mean difference: Δln = 0.84). No statistically significant differences were observed between groups at T1 (lnS100B baseline level; see Figure S1).
Serum S100B concentrations were also analyzed on a logarithmic scale employing a multiple linear regression model. After adjusting for gender, smoking status, and body weight, the analyses demonstrated a significant main effect of Group on ln(S100B) (F(3,80)=3.29, p=0.025), as well as a significant main effect of Timepoint (F(2,86)=3.96, p=0.022). The interaction between Group and Timepoint was not statistically significant (F(6,85)=0.704, p=0.65), indicating that the temporal patterns remained consistent across different anesthetic protocols. Regarding other covariates, female sex (p=0.034) and smoking (p=0.03) were independently associated with elevated ln(S100B) levels, whereas increased body weight was associated with reduced concentrations (p=0.008). Evaluation of model residuals confirmed an appropriate model fit and no evidence of distributional violations. Specifically, female sex was linked to a 44% rise in S100B levels (p=0.03), and smoking to a 36% increase (p=0.03). Conversely, each 10 kg increase in body weight corresponded to a 13% reduction in S100B levels (p=0.008) (see Table S1).
Pairwise post-hoc comparisons of S100B concentrations between the four anesthetic groups based on the mixed-effects model using log-—values. Results are presented as mean differences in log scale (Δ ln), 95% Confidence Intervals, and Tukey’s-adjusted p-values.
NSE analysis
Group 1 (21 participants), Group 2 (28), Group 3 (19), and Group 4 (23) each provided blood samples at three timepoints, totaling 63, 84, 57, and 69 samples respectively for NSE analysis. Nested one-way ANOVA group analysis (Figure 3 and Table 3) with Tukey’s multiple comparison test indicated that Group 4 exhibited significantly lower NSE values than Group 1 (p = 0.007). Furthermore, Group 3 demonstrated statistically significant reductions in NSE levels compared to Group 1 (p = 0.003). A mixed-effects model (REML) analysis followed by post-hoc pairwise comparisons using the Sidak adjustment showed that Group 1 had notably higher ln(NSE) levels than Group 4 at both T2 (Δ ln = 0.90, p = 0.006) and T3 (Δ ln = 1.44, p <0.001). Group 1 also displayed increased NSE levels compared to Group 3 at T2 (Δln=1.24, p<0.001) and at T3 (Δln = 1.49, p <0.001). Furthermore, at T3, Group 1’s ln (NSE) levels were significantly higher than those of Group 2 (Δ ln = 0.76, p = 0.01). No statistically significant differences were observed between groups at T1 (NSE baseline level; see Figure S2).
Serum NSE concentrations were also evaluated on the logarithmic scale utilizing a multiple linear regression model. After controlling for gender, smoking status, and body weight, analyses revealed a significant main effect of anesthetic group on NSE concentrations (p= 0.001). In contrast, neither the effect of time (p = 0.486) nor the interaction between group and time (p = 0.381) reached statistical significance, indicating that changes in NSE levels over time were consistent across anesthetic protocols. Among the covariates evaluated, both age and weight were identified as independent predictors of elevated NSE concentrations (p = 0.012 and p = 0.001, respectively). ASA-PS class, gender, smoking history, surgery duration, and intraoperative hemodynamic parameters (mean HR and MAP) demonstrated no significant association with NSE levels (all p > 0.10). Notably, even after adjusting for these covariates, the anesthetic group remained a significant determinant of NSE concentrations (p = 0.001), whereas neither timepoint nor the Group × Timepoint interaction achieved statistical significance (Table S2).
3.3. Secondary Outcomes
Recovery time
Median verbal response and extubation times are listed in Supplement Table 3. Post-hoc Mann–Whitney tests showed that anesthesia with propofol–remifentanil (Group 1) produced consistently shorter recovery and extubation times than other protocols. Group 1 was significantly faster than Group 2 (both p < 0.001) and Group 4 (p = 0.004 for verbal response; p = 0.005 for extubation), while no significant difference was found between Group 1 and Group 3 (verbal response: p = 0.18; extubation: p = 0.14).
Group 3 (sevoflurane–remifentanil) recovered faster than Group 2 (verbal response p = 0.04; extubation p = 0.01). Comparison between sevoflurane regimens (Group 3 vs. Group 4) showed a non-significant trend toward quicker extubation in Group 3 (p = 0.05 after adjustments). All group comparisons are detailed in Table 4, and Recovery Times Across Anesthetic Groups are in Table S3.
Surgical Field, Bleeding, SAS, Aldrete Score
No statistically significant differences were observed among the four anesthetic groups with respect to surgical field quality, bleeding scores, sedation–agitation levels, or early post-anesthesia recovery (see Table S4). Median Likert scores for the surgical field ranged from 5 to 6 across all groups (p = 0.16), and bleeding scores were comparable (p = 0.42). Sedation–Agitation Scale (SAS) outcomes revealed no significant variation (p = 0.35). Similarly, Aldrete scores did not demonstrate clinically meaningful differences between groups (p = 0.16).
Hemodynamic and Ventilatory management
MAP was similar across all anesthetic groups at every intraoperative timepoint (T1: p = 0.18; T2: p = 0.53; T3: p = 0.93; see Table S5). HR showed no significant group differences at baseline (p = 0.71) or postoperatively (p = 0.145), with a nonsignificant intraoperative trend toward higher rates in Group 4 after adjustment (Table S6). Mean PCO₂ remained within the normal range (34–37 mmHg) throughout, with minimal and clinically irrelevant group differences (Table S7).
Anesthetic Doses and Adjuvant Use
Propofol dosage, MAC values, and remifentanil needs followed normal distributions and showed no significant differences between groups (Supplementary Table S8). In contrast, fentanyl, clonidine, and phenylephrine doses had non-normal distributions with many zero values. The Kruskal–Wallis test found a significant difference in intraoperative fentanyl use (p=0.03): Group 2 received more fentanyl than Group 1 (p=0.02) and Group 3 (p=0.01), with no other notable group differences. Clonidine and phenylephrine administration did not differ significantly across groups (Table S8).
4. Discussion
Induced hypotensive anesthesia is frequently used to reduce bleeding and optimize the visual field for FESS [10,36]. Excessive bleeding and an inadequate surgical field during FESS can increase complications. Serious complications due to organ hypoperfusion are uncommon and morbidity resulting from major neurological complications is very low. However, cerebral ischemia is still a concern during controlled hypotension for FESS. Intraoperative hypotension, particularly its duration, is significantly associated with the occurrence of a postoperative stroke [37,38]. However, the reported safe range of arterial pressure for controlled hypotension is inconsistent and multiple risk factors are associated with complications.
This study provides evidence that anesthetic technique plays a critical role in modulating perioperative neuronal biomarker release among patients undergoing FESS. The two biomarkers assessed—S100B and NSE—are established indicators of glial activation and neuronal injury, respectively, and are utilized in various perioperative and neurological contexts to evaluate CNS stress [21,39]. Within this context, the results demonstrate distinct neurobiological profiles associated with different anesthetic regimens.
Among the four anesthetic protocols, sevoflurane–remifentanil when combined with ketamine–magnesium, resulted in the lowest S100B levels.
Volatile anesthetics can induce ischemic preconditioning, preserve cerebral autoregulation, stabilize the blood–brain barrier, and reduce oxidative stress [40,41]. A prior study demonstrated that S100B concentrations increased during general anesthesia with propofol and remifentanil compared to baseline levels; however, these values consistently remained within the normal range [36]. Additionally, another investigation comparing propofol and desflurane anesthesia found no significant difference in S100B levels between the two anesthetic regimens [12]. Our study used a different volatile anesthetic (Sevoflurane), which may be more effective during controlled hypotension, along with ketamine and magnesium, which could offer better brain protection [13,14,15,20]. Regarding S100Β concentrations, it should be emphasized that sevoflurane demonstrates superiority over propofol exclusively when ketamine and magnesium are incorporated into the treatment protocol.
NSE, an established biomarker of neuronal cytoplasmic injury, exhibited a more differentiated response. Sevoflurane-based anesthesia was associated with significantly reduced NSE levels when compared to propofol-based anesthesia. Furthermore, adjunctive administration of ketamine–magnesium produced a greater decrease in NSE concentrations relative to the use of sevoflurane–remifentanil alone, consistent with the recognized effect of NMDA receptor antagonists in attenuating calcium influx and subsequent excitotoxic processes [13,14,15,16,17,20]. However, the NMDA/magnesium-mediated protection did not exceed the NSE biomarker outcomes observed with sevoflurane–remifentanil administration alone. These results indicate that while NMDA receptor blockade and magnesium provides significant neuronal stabilization, volatile anesthetics—particularly Sevoflurane—may activate a more comprehensive array of protective mechanisms, resulting in superior neuroprotection.
Patient-related factors also emerged as important predictors: age and weight independently correlated with elevated NSE levels. Such relationships are consistent with literature reporting age-dependent increases in neuronal vulnerability and biomarker release, as well as metabolic and inflammatory alterations associated with higher body mass [10]. In contrast, no significant associations were observed with ASA class, smoking status, intraoperative hemodynamics, or surgical duration. These results imply that intrinsic biological characteristics may exert stronger influence on perioperative neuronal biomarker dynamics than moderate variations in physiological parameters during anesthesia.
Despite the clear biomarker differences across anesthetic techniques, these did not translate into differences in immediate clinical recovery or operative conditions. Surgical field quality, bleeding scores, sedation–agitation levels, and Aldrete scores remained comparable among groups, consistent with prior evidence that biochemical indicators of neuronal stress do not necessarily correlate with intraoperative clinical metrics [7]. The only clinically significant divergence was observed in recovery times: propofol–remifentanil without adjuvants produced the fastest emergence profile, aligning with the well-characterized pharmacokinetic advantages of propofol-based anesthesia [8]. Conversely, the addition of ketamine–magnesium—particularly in propofol-based regimens—prolonged time to verbal response and extubation, supporting existing data that NMDA antagonists can delay emergence [9].
Our study is limited by its single-center design and small, uneven group sizes. Nonetheless, each group included at least 20 patients based on power analysis. Additionally, baseline biomarker concentrations were measured 10 minutes after the onset of surgery, during which all patients received propofol for anesthesia induction. This approach may introduce bias, as it does not adequately highlight the potential protective effects of sevoflurane. Conversely, the groups were carefully structured to identify distinctions in neuroprotection between propofol and sevoflurane, while also accounting for the neuroprotective effects of magnesium and ketamine. Finally, although randomization was implemented, the study was not double-blinded due to safety reasons, which could potentially introduce observer bias. Specifically, the attending anesthesiologist and the nursing staff in the operating room was informed about the medication used, whereas the postoperative outcome assessors, the statistician, as well as the individual measuring the levels of biomarkers, remained blinded to the group designations.
To our knowledge, this is the first study comparing propofol and sevoflurane with adjuncts, using two neuroprotection biomarkers. The results suggest anesthetic choice should be tailored to neurological risk and recovery needs.
5. Conclusions
Taken together, these findings underscore anesthetic selection as a modifiable determinant of perioperative neuroprotection. Sevoflurane-based regimens and targeted Mg and NMDA receptor modulation may optimize neuronal preservation during FESS, although these biochemical benefits must be weighed against differences in emergence profiles. Future studies integrating serial biomarker measurements with cognitive testing and neuroimaging are needed to clarify the clinical significance of these perioperative neuronal changes and to guide personalized anesthetic strategies in populations at increased risk for postoperative neurocognitive impairment.
Supplementary Materials
The following supporting information can be downloaded at the website of this paper posted on Preprints.org.
Author Contributions
Conceptualization, A.D. and R.S.; methodology, A.D. and R.S.; software, A.D. and R.S.; validation, R. S. and A.D.; formal analysis, R.S. and A.D.; investigation, R.S., V.A. and D.G.; resources, D.A.L., G.D. and A.D.; data curation, R.S., D.A.L. and A.D.; writing—original draft preparation, R.S.; writing—review and editing, A.D. and LS.; visualization, A.D. and R.S.; supervision, A.D.; project administration, A.D.; funding acquisition, A.D. and LS. All authors have read and agreed to the published version of the manuscript.
Funding
Research was funded by University of Patras (82490—MEDICOS PROGRAM—Special Account for Research Funds, University of Patras).
Institutional Review Board Statement
University of Patras (82490—MEDICOS PROGRAM—Special Account for Research Funds, University of Patras).
Informed Consent Statement
Informed consent was obtained from all subjects involved in the study.
Data Availability Statement
The data supporting this study are available from the corresponding author upon reasonable request. The data are not publicly accessible due to privacy and ethical considerations.
Conflicts of Interest
The authors declare no conflicts of interest.
Abbreviations
The following abbreviations are used in this manuscript:
| ANOVA | Analysis of Variance |
| ASA | American Society of Anesthesiologists |
| BIS | Bispectral index |
| BMI | Body mass index |
| CI | Confidence interval |
| CNS | Central Neuron System |
| ETCO₂ | End-tidal carbon dioxide |
| FESS | Functional endoscopic sinus surgery |
| HR | Heart rate |
| IV | Intravenous |
| LOD | Limit of detection |
| MAC | Minimum alveolar concentration |
| MAP | Mean arterial pressure |
| Mg+ | Magnesium sulfate |
| NSE | Neuron-specific enolase |
| NMDA | N-Methyl-D-aspartate |
| PACU | Post-anesthesia care unit |
| PCO₂ | Partial pressure of carbon dioxide |
| REML | Restricted maximum likelihood |
| S-100B | S-100 beta protein |
| SAS | Sedation–Agitation Scale |
| SD | Standard deviation |
References
- Chhabra, A.; Saini, P.; Sharma, K.; Chaudhary, N.; Singh, A.; Gupta, S. Controlled hypotension for FESS: A randomised double-blinded comparison of magnesium sulphate and dexmedetomidine. Indian J. Anaesth. 2020, 64, 24–30. [Google Scholar] [CrossRef]
- Giriyapur, P.; Madhusudhana, R. Controlled Hypotension for Functional Endoscopic Sinus Surgery With Two Different Doses of Fentanyl. Cureus 2023. [Google Scholar] [CrossRef]
- relationship_between_intraoperative_mean_arterial.6. p. 6.
- Hallqvist, L.; Granath, F.; Huldt, E.; Bell, M. Intraoperative hypotension is associated with acute kidney injury in noncardiac surgery. Eur. J. Anaesthesiol. 2018, 35, 273–9. [Google Scholar] [CrossRef]
- Van Waes, J.A.R.; Van Klei, W.A.; Wijeysundera, D.N.; Van Wolfswinkel, L.; Lindsay, T.F.; Beattie, W.S. Association between intraoperative hypotension and myocardial injury after vascular surgery. Anesthesiology 2016, 124, 35–44. [Google Scholar] [CrossRef]
- Mugabo, E.N.; Kulimushi, Y.M.; Pollach, G.; Sabra, R.A.; Beltagy, R.S.; Blaise Pascal, F.N. Clonidine and dexmedetomidine for controlled hypotension during functional endoscopic sinus surgery: a comparative study. BMC Anesthesiol. 2024, 24. [Google Scholar] [CrossRef]
- Kumar, B.R.P.; Venkatesh, C.B.; Hirguppe Somashekhar, A. EUROPEAN JOURNAL OF CARDIOVASCULAR MEDICINE European Journal of Cardiovascular Medicine Dexmedetomidine versus Esmolol for Induced Hypotension during Functional Endoscopic Sinus Surgery-A Prospective Randomised Comparative Study Open Access Article Title: Dexmedetomidine versus Esmolol for Induced Hypotension during Functional Endoscopic Sinus Surgery-A Prospective Randomised Comparative Study. Available online: https://www.healthcare-bulletin.co.uk/.
- Sahu, B.P.; Nayak, L.K.; Mohapatra, P.S.; Mishra, K. Induced Hypotension in Functional Endoscopic Sinus Surgery: A Comparative Study of Dexmedetomidine and Esmolol. Cureus 2021. [Google Scholar] [CrossRef]
- Kenny, J.D.; Westover, M.B.; Ching, S.N.; Brown, E.N.; Solt, K. Propofol and sevoflurane induce distinct burst suppression patterns in rats. Front. Syst. Neurosci. 2014, 8. [Google Scholar] [CrossRef] [PubMed]
- Chauhan, R.; Panda, N.; Bhagat, H.; et al. Comparison of propofol and sevoflurane on cerebral oxygenation using juglar venous oximetery (SjVo2) in patients undergoing surgery for traumatic brain injury. Asian J. Neurosurg. 2020, 15, 614–9. [Google Scholar] [CrossRef] [PubMed]
- Zhang, Y.; Shan, G.J.; Zhang, Y.X.; et al. Propofol compared with sevoflurane general anaesthesia is associated with decreased delayed neurocognitive recovery in older adults. Br. J. Anaesth. 2018, 121, 595–604. [Google Scholar] [CrossRef]
- Jang, J.S.; Kwon, Y.; Hwang, S.M.; et al. Comparison of the effect of propofol and desflurane on S-100Β and GFAP levels during controlled hypotension for functional endoscopic sinus surgery: A randomized controlled trial. Medicine 2019, 98, e17957. [Google Scholar] [CrossRef] [PubMed]
- Zanza, C.; Piccolella, F.; Racca, F.; et al. Ketamine in Acute Brain Injury: Current Opinion Following Cerebral Circulation and Electrical Activity. Healthcare (Switzerland) 2022. [Google Scholar] [CrossRef] [PubMed]
- Gregers, M.C.T.; Mikkelsen, S.; Lindvig, K.P.; Brøchner, A.C. Ketamine as an Anesthetic for Patients with Acute Brain Injury: A Systematic Review. Neurocritical Care 2020. [Google Scholar] [CrossRef]
- Choudhury, D.; Autry, A.E.; Tolias, K.F.; Krishnan, V. Ketamine: Neuroprotective or Neurotoxic? Frontiers in Neuroscience 2021. [Google Scholar] [CrossRef]
- Hakim, K.Y.K.; Wahba, W.Z. Effect of N-methyl-d-aspartate (NMDA) receptor antagonist combination as adjuvant to general anesthesia in functional endoscopic sinus surgery. Ain-Shams Journal of Anesthesiology 2019, 11. [Google Scholar] [CrossRef]
- Sen, A.P.; Gulati, A. Use of Magnesium in Traumatic Brain Injury. [CrossRef]
- Suk Lee, J.; Min Han, Y.; Sung Yoo, D.; et al. A Molecular Basis for the Efficacy of Magnesium Treatment Following Traumatic Brain Injury in Rats. 2004. [Google Scholar]
- Nutrition and Traumatic Brain Injury : Improving Acute and Subacute Health Outcomes in Military Personnel. National Academies Press, 2011.
- Jitsinthunun, T.; Raksakietisak, M.; Pantubtim, C.; Mahatnirunkul, P. Effects of Magnesium Sulfate on Intraoperative Blood Loss and Anesthetic Requirement in Meningioma Patients Undergoing Craniotomy with Tumor Removal: A Prospective Randomized Study. J. Neuroanaesth. Crit. Care 2022, 9, 168–76. [Google Scholar] [CrossRef]
- Makovec, M.; Skitek, M.; Šimnovec, L.; Jerin, A. Neuron-Specific Enolase and S100B as Biomarkers of Ischemic Brain Injury During Surgery. Clinics and Practice 2025. [Google Scholar] [CrossRef]
- Khanduja, S.; Kim, J.; Kang, J.K.; et al. Hypoxic-Ischemic Brain Injury in ECMO: Pathophysiology, Neuromonitoring, and Therapeutic Opportunities. Cells 2023. [Google Scholar] [CrossRef] [PubMed]
- Xie, Y.; Yao, Z. Relationships of serum VILIP-1, NSE, and ADP levels with postoperative cognitive dysfunction in elderly patients undergoing general anesthesia: a retrospective, observational study. Journal of International Medical Research 2023, 51. [Google Scholar] [CrossRef] [PubMed]
- Eyglóardóttir, K.; Michaëlsson, I.; Hallén, T.; Jakola, A.; Skoglund, T. Circulating Brain Injury Biomarkers for Predicting Outcomes Following Elective Neurosurgery: A Scoping Review. World Neurosurgery 2024. [Google Scholar] [CrossRef]
- Fletcher-Sandersjöö, A.; Lindblad, C.; Thelin, E.P.; et al. Serial S100B sampling detects intracranial lesion development in patients on extracorporeal membrane oxygenation. Front. Neurol. 2019, 10. [Google Scholar] [CrossRef]
- Michetti, F.; Clementi, M.E.; Di Liddo, R.; et al. The S100B Protein: A Multifaceted Pathogenic Factor More Than a Biomarker. International Journal of Molecular Sciences 2023. [Google Scholar] [CrossRef]
- Komarnicki, P.; Musiałkiewicz, J.; Stańska, A.; et al. Circulating Neuroendocrine Tumor Biomarkers: Past, Present and Future. Journal of Clinical Medicine 2022. [Google Scholar] [CrossRef]
- Zhi, M.; Huang, J.; Jin, X. Clinical value of serum neuron-specific enolase in sepsis-associated encephalopathy: a systematic review and meta-analysis. Syst. Rev. 2024, 13. [Google Scholar] [CrossRef] [PubMed]
- Hodge, D.R.; Gillespie, D.F. Phrase Completion Scales. [PubMed]
- Reis, C.; Wang, Y.; Akyol, O.; et al. What’s new in traumatic brain injury: Update on tracking, monitoring and treatment. Int. J. Mol. Sci. 2015, 16, 11903–65. [Google Scholar] [CrossRef] [PubMed]
- Stefanović, B.; Durić, O.; Stanković, S.; et al. Elevated Serum Protein S100B and Neuron Specific Enolase Values as Predictors of Early Neurological Outcome after Traumatic Brain Injury. J. Med. Biochem. 2017, 36, 314–21. [Google Scholar] [CrossRef]
- Dragas, M.; Koncar, I.; Opacic, D.; et al. Fluctuations of serum neuron specific enolase and protein S-100B concentrations in relation to the use of shunt during carotid endarterectomy. PLoS One 2015, 10. [Google Scholar] [CrossRef]
- Dash, P.K.; Zhao, J.; Hergenroeder, G.; Moore, A.N. Biomarkers for the Diagnosis, Prognosis, and Evaluation of Treatment Efficacy for Traumatic Brain Injury. [CrossRef]
- Clausen, N.G.; Antonsen, S.; Spielmann, N.; Hansen, T.G.; Weiss, M.; Ringer, S.K. Hypotension and Hypocapnia during General Anesthesia in Piglets: Study of S100b as an Acute Biomarker for Cerebral Tissue Injury. J. Neurosurg. Anesthesiol. 2020, 32, 273–8. [Google Scholar] [CrossRef]
- INTERNATIONAL COUNCIL FOR HARMONISATION OF TECHNICAL REQUIREMENTS FOR PHARMACEUTICALS FOR HUMAN USE ICH HARMONISED GUIDELINE GOOD CLINICAL PRACTICE (GCP) E6(R3).
- Kwon, Y.; Jang, J.S.; Hwang, S.M.; et al. Range of S-100Β levels during functional endoscopic sinus surgery with moderately controlled hypotension. European Archives of Oto-Rhino-Laryngology 2017, 274, 3527–32. [Google Scholar] [CrossRef] [PubMed]
- Gregory, A.; Stapelfeldt, W.H.; Khanna, A.K.; et al. Intraoperative Hypotension Is Associated with Adverse Clinical Outcomes after Noncardiac Surgery. Anesth. Analg. 2021, 132, 1654–65. [Google Scholar] [CrossRef]
- Bijker, J.B.; Persoon, S.; Peelen, L.M.; et al. Intraoperative Hypotension and Perioperative Ischemic Stroke after General Surgery A Nested Case-Control Study. 2012. [Google Scholar]
- Thelin, E.P.; Nelson, D.W.; Bellander, B.M. A review of the clinical utility of serum S100B protein levels in the assessment of traumatic brain injury. Acta Neurochirurgica 2017. [Google Scholar] [CrossRef] [PubMed]
- Park, H.P.; Jeong, E.J.; Kim, M.H.; et al. Effects of sevoflurane on neuronal cell damage after severe cerebral ischemia in rats. Korean J. Anesthesiol. 2011, 61, 327–31. [Google Scholar] [CrossRef]
- Park, S. Volatile anesthetics as a neuroprotective agent. Korean Journal of Anesthesiology 2011. [Google Scholar] [CrossRef]
Figure 1.
Study flowchart.

Figure 2.
T Mean (SD) S100B levels (A) and differences between group means (B). Statistically significant differences are presented as red squares (B).
Figure 2.
T Mean (SD) S100B levels (A) and differences between group means (B). Statistically significant differences are presented as red squares (B).

Figure 3.
Mean (SD) neuron specific enolase (NSE) levels (A) and differences between group means (B). Statistically significant differences are presented as red squares (B).
Figure 3.
Mean (SD) neuron specific enolase (NSE) levels (A) and differences between group means (B). Statistically significant differences are presented as red squares (B).


Table 1.
Patients Demographic and Baseline Characteristics.
| Variable | Group 1 (n=21) N [%] Mean [SD] |
Group 2 (n=26) N [%] Mean [SD] |
Group 3 (n=20) N [%] Mean [SD] |
Group 4 (n=21) N [%] Mean [SD] |
p-value |
|---|---|---|---|---|---|
|
Gender male female |
12 [57] 9 [42.9] |
20 [71.4] 6 [28.6] |
12 [60] 8 [40] |
15[ 71.4] 6 [28.6] |
0.64 |
| Age (years) | 43.047 [18.94] | 40.53 [13.39] |
44.47 [13.41] |
43.23 [17.38] |
0.85 |
| Weight (kg) | 77.19 [17.48] |
81.17 [15.79] |
84.45 [18.3] |
81.19 [17.07] |
0.6 |
| B.M.I (kg/m²) | 25.76 [3.7] |
27.18 [4.13] |
28.31 [5.69] |
27.27 [5.41] |
0.43 |
|
ASA 1 2 3 |
11 [55] 8 [40] 1 [5] |
15 [53,6] 13 [46.4]0 |
11 [61.1] 5 [27.8] 2 [11.1] |
8[38.1] 10[47,6] 3 [14,3] |
0.37 |
|
Smoking Smokers Non-smokers |
8 [40] 12 [60] |
15[53.6] 13[46.4] |
4[23.5] 13[76.5] |
12[57.1] 9 [42.9] |
0.2 |
|
Surgery Duration (min) |
98.4 [28.6] |
103.85 [21.9] |
99.52 [29.17] |
114.23 [34.13] |
0.43 |
Table 2.
This is a table. Tables should be placed in the main text near to the first time they are cited.
Table 2.
This is a table. Tables should be placed in the main text near to the first time they are cited.
| S100B – Comparisons Between Groups | |||
|---|---|---|---|
| Tukey’s multiple comparisons test | Mean diff. | 95% CI of diff. | Adjusted P Value |
| Group 1 vs. Group 2 | 0.22 | -0.38 to 0.82 | 0.66 |
| Group 1 vs. Group 3 | 0.15 | -0.47 to 0.78 | 0.85 |
| Group 1 vs. Group 4 | 0.79 | 0.18 to 1.40 | 0.01 |
| Group 2 vs. Group 3 | -0.06 | -0.67 to 0.54 | 0.98 |
| Group 2 vs. Group 4 | 0.57 | -0.02 to 1.20 | 0.06 |
| Group 3 vs. Group 4 | 0.64 | 0.02 to 1.30 | 0.04 |
Table 3.
Differences in NSE levels between groups.
| Neuron Specific Enolase (NSE)—Comparisons Between Groups | |||
|---|---|---|---|
| Tukey’s multiple comparisons test | Mean diff. | 95% CI of diff. | Adjusted P Value |
| Group 1 vs. Group 2 | 0.58 | -0.05 to 1.21 | 0.07 |
| Group 1 vs. Group 3 | 1.09 | 0.43 to 1.76 | 0.003 |
| Group 1 vs. Group 4 | 0.94 | 0.28 to 1.60 | 0.007 |
| Group 2 vs. Group 3 | 0.51 | -0.12 to 1.15 | 0.12 |
| Group 2 vs. Group 4 | 0.36 | -0.27 to 1.00 | 0.32 |
| Group 3 vs. Group 4 | -0.15 | -0.81 to 0.51 | 0.88 |
Pairwise post-hoc comparisons of Neuron Specific Enolase (NSE) concentrations between the four anesthetic groups based on the mixed-effects model using log-transformed values. Results are presented as mean differences in log scale (Δ ln), 95% Confidence Intervals, and Tukey’s-adjusted p-values.
Table 4.
Pairwise Mann-Whitney U test Comparisons for Recovery and Extubation Time between groups (Time to Verbal Response end Extubation Time).
Table 4.
Pairwise Mann-Whitney U test Comparisons for Recovery and Extubation Time between groups (Time to Verbal Response end Extubation Time).
| Recovery Time (Time to Verbal Response, min) | U | Z | p-value |
|---|---|---|---|
| Group1 vs Group2 | 113.5 | −3.49 | <0.001 |
| Group1 vs Group3 | 126.0 | −1.34 | 0.18 |
| Group1 vs Group4 | 100.0 | −2.88 | 0.004 |
| Group2 vs Group3 | 151.0 | −2.04 | 0.04 |
| Group2 vs Group4 | 290.0 | −0.08 | 0.93 |
| Group3 vs Group4 | 122.5 | −1.65 | 0.10 |
| Extubation Time(min) | |||
| Group1 vs Group2 | 115.5 | −3.44 | <0.001 |
| Group1 vs Group3 | 122.0 | −1.46 | 0.14 |
| Group1 vs Group4 | 102.5 | −2.81 | 0.005 |
| Group2 vs Group3 | 128.5 | −2.57 | 0.01 |
| Group2 vs Group4 | 280.0 | −0.28 | 0.77 |
| Group3 vs Group4 | 112.0 | −1.95 | 0.05 |
Pairwise post-hoc comparisons of recovery time (time to verbal response and extubation time) between the four anesthetic groups using the Mann–Whitney U test. Results are reported as U statistic, Z score, and two-tailed p-values. Significant differences (p < 0.05) indicate slower recovery in Group 2 compared with Group 1 and Group 3, and slower recovery in Group 4 compared with Group 1. Significant findings indicate longer extubation times in Group 2 compared with Groups 1 and 3, and in Group 4 compared with Group 1. A borderline trend was observed between Groups 3 and 4 (p = 0.05).
Disclaimer/Publisher’s Note: The statements, opinions and data contained in all publications are solely those of the individual author(s) and contributor(s) and not of MDPI and/or the editor(s). MDPI and/or the editor(s) disclaim responsibility for any injury to people or property resulting from any ideas, methods, instructions or products referred to in the content. |
© 2026 by the authors. Licensee MDPI, Basel, Switzerland. This article is an open access article distributed under the terms and conditions of the Creative Commons Attribution (CC BY) license (http://creativecommons.org/licenses/by/4.0/).
Copyright: This open access article is published under a Creative Commons CC BY 4.0 license, which permit the free download, distribution, and reuse, provided that the author and preprint are cited in any reuse.


