

Submitted:
04 April 2026
Posted:
07 April 2026
You are already at the latest version
Abstract
This study assessed the spatial and temporal variability of rainfall erosivity (R factor) and its implications for potential soil loss in the Velhas River Basin, Minas Gerais, Brazil. Rainfall erosivity was estimated using data from 48 rain gauge stations and precipitation derived from CHIRPS product, processed in a cloud-based environment Google Earth Engine. Between 2014 and 2024, annual R values exhibited high variability, ranging from 3,900 to more than 9,000 MJ mm ha⁻¹ h⁻¹ yr⁻¹, with peak values recorded in the wettest year (2022) and the lowest values in 2014. Potential soil loss was estimated using the RUSLE model for the years of minimum and maximum erosivity, yielding values between 0.60 and 274.17 Mg ha⁻¹ yr⁻¹. The highest soil losses occurred in areas of exposed soil and agricultural land, whereas forest formations exhibited lower rates even under high rainfall erosivity conditions. The comparison between observed and estimated datasets revealed strong spatial and statistical agreement according to the Pearson correlation coefficient (r ≈ 0.999), although CHIRPS slightly underestimated extreme values. These results demonstrate the strong potential for integrating observed and remote sensing data in hydrosedimentological analyses at the basin scale.
Keywords:
rainfall erosivity
; RUSLE
; soil erosion
; Google Earth Engine
; satellite rainfall data
; MapBiomas
1. Introduction
Water erosion is a natural phenomenon and one of the main drivers of environmental degradation in tropical soils, as it affects agricultural production, ecological stability, water quality, and the hydro sedimentological functioning of river basins [1,2,3]. Thus, increasing anthropogenic pressure, combined with climatic variability and the intensification of extreme rainfall events, reinforces global concern about soil loss and ecosystem degradation [4,5,6]. In Brazil, this process is particularly significant due to the predominance of a tropical rainfall regime characterized by intense and highly concentrated precipitation, which enhances the erosive potential of rainfall [7].
Rainfall erosivity is represented by the R factor of the Revised Universal Soil Loss Equation (RUSLE), which governs the detachment and transport of soil particles [8,9]. The estimation of this factor requires accurate and continuous pluviographic records, which remain scarce in many regions of Brazil. This limitation has led to the development and application of empirical equations based on monthly or daily precipitation data, which have been widely used to investigate the spatiotemporal distribution of rainfall erosivity across different regions and biomes [10,11,12]. Recent studies indicate that these approaches are also valuable for assessing the impacts associated with the intensification of extreme rainfall events [12].
In this context, remote sensing products for precipitation estimation have expanded the possibilities for hydrometeorological analyses in areas with limited ground-based monitoring. The Climate Hazards Group InfraRed Precipitation with Station Data (CHIRPS) dataset integrates satellite observations and ground-based measurements, providing long and spatially continuous precipitation records [13]. Evaluations in different tropical regions indicate satisfactory performance of this product for hydrological and climatological applications, including analyses related to rainfall erosivity and soil loss modeling [14]. Recent studies also highlight the usefulness of these data for estimating erosive processes in tropical environments through integrated modeling approaches [15].
This study was conducted in the Velhas River Basin (VRB), one of the tributaries of the São Francisco River. The basin is characterized by high geological, geomorphological, and climatic diversity, encompassing physical, biological, and socioeconomic characteristics that are representative of the state of Minas Gerais [16,17]. The basin hosts important mining districts in the Quadrilátero Ferrífero, one of the main mineral provinces in Brazil, which intensifies environmental pressure on the landscape [18]. Furthermore, it includes the urban area of the Belo Horizonte Metropolitan Region and extensive agricultural areas, which increase land use conflicts and the environmental vulnerability of the basin [19,20].
Tropical river basins subjected to strong anthropogenic pressure, pronounced relief, and changes in land use tend to exhibit greater susceptibility to soil erosion, sediment transport, and hydro sedimentological imbalance [21,22,23]. The Velhas River Basin also plays a strategic role in regional water supply, sustaining the water security of approximately six million inhabitants [24]. Under these conditions, intense rainfall events in southeastern Brazil, often associated with climatic variability and climate change [4,5], can contribute to increased rainfall erosivity and soil loss rates [8,11,12]. Marked altitudinal variation and the presence of steep slopes favor the occurrence of processes, especially during periods of rainfall [21,25].
In this context, this study estimated and compared the annual variation of the R factor in the Velhas River Basin using two complementary approaches: (i) the application of empirical equations to observed rainfall data and (ii) the estimation of rainfall erosivity based on precipitation derived from the CHIRPS product. Based on these results, the years of minimum and maximum rainfall erosivity were identified, and RUSLE was applied to these two scenarios to quantify potential soil loss under contrasting climatic conditions. This approach allows the evaluation of the applicability of satellite-derived precipitation products for rainfall erosivity estimation, improves the understanding of regional erosive dynamics, and characterizes how variability in the R factor influences susceptibility to soil loss in one of the most important river basins in Brazil.
2. Materials and Methods
2.1. Study Area
The Velhas River Basin covers about 29,000 km2 in the central portion of Minas Gerais state, southeastern Brazil (Figure 1).
The geological framework of the Velhas River Basin is characterized by high structural and lithological complexity. In the upper course, Archean and Paleoproterozoic sequences associated with the Quadrilátero Ferrífero predominate, particularly those belonging to the Rio das Velhas and Minas Supergroups [17,18]. In the middle and lower sectors of the basin, carbonate and pelitic units of the Bambuí Group stand out, exerting strong control over the organization of the drainage network and regional geomorphological compartmentalization [16]. In the northern and northeastern sectors, metasedimentary rocks related to the Serra do Espinhaço occur, associated with areas of higher relief energy and pronounced landscape dissection [16]. This lithological diversity leads to marked contrasts in resistance to weathering and directly influences regional erosive dynamics.
The basin relief exhibits a strong altitudinal gradient, with elevations ranging from approximately 1,740 m in the headwater areas to less than 500 m near the confluence with the São Francisco River [26]. This topographic contrast reflects regional geomorphological evolution and influences drainage organization and erosive processes. According to the Agricultural Land Suitability Assessment System, the middle course is dominated by flat to gently undulating surfaces, which concentrate much of the agricultural activity and human occupation [27]. In contrast, the southern and eastern portions of the upper course present undulating to strongly undulating terrains, frequently with slopes exceeding 20%, a condition that intensifies relief dissection and increases susceptibility to erosion.
According to Alvares et al. [7], the climate of the basin is predominantly classified as Aw, Cwa, and Cwb according to the Köppen classification. Regional rainfall dynamics are influenced by the South Atlantic Convergence Zone, cold fronts, and convective systems, which account for a significant portion of extreme events in southeastern Brazil [5]. This climatic seasonality results in a strong concentration of rainfall during the austral summer, increasing the erosive potential of precipitation and intensifying rainfall erosivity represented by the R factor [6].
Regarding soils, Argisols (30%), Neosols (22%), Latosols (22%), and Cambisols (17%) predominate, according to the soil map of the state of Minas Gerais [28]. These soil classes are typical of highly weathered tropical environments [29]. Although they exhibit high porosity and good infiltration capacity, these soils may exhibit high vulnerability to erosion when vegetation cover is removed or under inadequate soil management [30]. In addition, attributes such as texture, structure, depth, and organic matter content directly influence infiltration, surface runoff, and sediment transport processes [31].
The Velhas River Basin lies in a transition zone between the Cerrado and Atlantic Forest biomes. The Cerrado occupies a large portion of the area and is characterized by savanna formations typical of a seasonal tropical climate, with high structural and phytophysiognomic diversity [32]. Remnants of Atlantic Forest are mainly concentrated in the southern and eastern sectors of the basin, associated with higher elevations and more humid climatic conditions [33]. This configuration results in a mosaic of vegetation formations that contributes to landscape environmental heterogeneity.
Land use and land cover are highly heterogeneous across the basin. The Belo Horizonte Metropolitan Region concentrates extensive urbanized areas and major mining districts associated with the Quadrilátero Ferrífero [18]. In the central-northern sectors, pastures, temporary crops, and silviculture dominate, land uses that reduce water infiltration into the soil, increase surface exposure, and favor the initiation of erosive processes [25]. Forest, savanna, and grassland formations are distributed in a fragmented pattern throughout the basin, as indicated by the MapBiomas Project [34], reflecting the progressive replacement of native vegetation and the increasing environmental vulnerability of the region.
The combination of a seasonal tropical climate, highly weathered soils, heterogeneous relief, and intense anthropogenic pressures creates an environment particularly susceptible to water erosion. Recent studies applying erosion models in tropical environments demonstrate that the interaction between rainfall erosivity, relief characteristics, and land use changes exerts strong control over soil loss in river basins [35,36], justifying an integrated assessment of rainfall variability, the R factor, and potential soil loss.
2.2. Methodological Procedures
We obtained observed rainfall data from ANA [26]. To increase spatial representativeness and reduce monitoring gaps near the basin boundaries, we applied a 30 km buffer was generated using the Buffer tool in ArcGIS 10.8. After delineating the expanded area, 391 stations were identified within the buffer zone. According to ANA, 141 of these stations are no longer operational, while others contain extensive gaps or time series unsuitable for consistent hydrological analyses. We evaluated each station individually for record continuity and data quality. After this screening process, 48 stations had complete time series for the period 2014–2024, and we selected them for rainfall erosivity estimation, as shown in Figure 1. The valid records were organized into monthly and annual totals to conform to the requirements of the empirical equations used.
To complement ground-based observations and enable continuous spatial analyses, we used data from the CHIRPS product. This dataset combines satellite-derived precipitation estimates with rain gauge observations and demonstrates robust performance in tropical regions [5,12,13,14]. All pixels intersecting the basin area were extracted and integrated into the geographic information system (GIS) environment. Monthly and annual totals were calculated for the same period as the ANA observations and spatially aligned to ensure consistency between the datasets.
We estimated Rainfall erosivity (R) using empirical equations widely applied in Brazilian studies, based on the relationship between monthly and annual precipitation [7,8,9,10]. The calculation was based on the formulation originally proposed by Wischmeier and Smith [9] and later adapted for monthly data by national studies [8,9,10,11], expressed as:
where: Pᵢ represents monthly precipitation (mm) and P corresponds to total annual precipitation (mm).
We performed the calculations for each of the 48 ANA stations and for each CHIRPS pixel in Google Earth Engine (GEE) environment, using points coincident with the station locations. The sum of monthly values resulted in annual rainfall erosivity, enabling the identification of years with minimum and maximum erosivity, which were used as reference years for estimating potential soil loss. The spatial distribution of R was obtained through Inverse Distance Weighting (IDW) interpolation in ArcGIS 10.8 [37]. The agreement between annual series was assessed using the Pearson correlation coefficient (r), calculated in the R software environment [38].
We estimated soil loss using RUSLE, a model widely applied in erosion studies [6,9,36]. The general equation is expressed as:
where: A represents the average annual soil loss (Mg ha−1 yr−1); R corresponds to the rainfall erosivity factor (MJ mm ha−1 h−1 yr−1); K represents the soil erodibility factor (Mg ha−1 MJ−1 mm−1); LS corresponds to the topographic factor (dimensionless); C represents the land use and management factor (dimensionless); and P corresponds to the conservation practices factor (dimensionless).
We calculated the LS topographic factor was calculated using the method proposed by Desmet and Govers [39], based on the contributing area per pixel and slope derived from the digital elevation model. Processing was performed in ArcGIS 10.8 using the 30 m Copernicus Digital Elevation Model (DEM), accessed through the Google Earth Engine (GEE) platform, whose accuracy is suitable for topographic analyses applied in RUSLE studies [40]. The applied formulation is expressed as:
where: Aflow represents the contributing area per cell, θ denotes slope in radians, and m and n are exponents defined according to the surface runoff regime.
The K factor was assigned based on the soil map of Minas Gerais developed by UFV et al. [28], with values derived from studies that quantify erodibility across different tropical soil classes [29,30,35].
We defined the land use and management factor (C) based on was assigned using values consolidated in the literature for each land use and land cover class identified within the basin, as presented in Table 1. We considered the degree of surface protection provided by vegetation cover, canopy density, agricultural management practices, and the level of soil exposure to adequately represent differences between natural, agricultural, and anthropogenic areas [25,31,41]. Surfaces lacking structured soil or erodible pedological material, such as rock outcrops, water bodies, flooded areas, and active mining areas, were not included in the soil loss estimation because they do not meet the physical assumptions of RUSLE, originally developed to estimate sheet and rill erosion in structured soils [6,9]. In active mining areas, where the surface soil is removed and erosive processes become dominated by slope instability and localized sediment redistribution, the direct application of RUSLE presents methodological limitations [42]. The use of fixed values for the C factor ensured comparability between minimum and maximum erosivity scenarios and allowed the isolation of the effect of the R factor in soil loss modeling.
The P factor represents the effectiveness of conservation practices in controlling erosion [9]. To isolate the influence of the other RUSLE factors, we adopted P = 1 was across the entire basin. This assumption represents the absence of conservation practices and reflects the scenario of maximum potential soil loss, enabling direct comparison between years of minimum and maximum rainfall erosivity.
3. Results
3.1. Rainfall and Erosivity Variability
The spatially averaged annual precipitation in the Velhas River Basin exhibited high variability during the study period, ranging from 717.99 mm (2014) to 1598.77 mm (2020). The years 2014, 2017 (912.79 mm), and 2023 (963.00 mm) were represented the driest periods in the series, whereas 2020, 2022 (1452.42 mm), and 2021 (1375.65 mm) were the wettest. The mean annual precipitation for the analyzed period was approximately 1162 mm year−1.
Annual rainfall erosivity (R), estimated from ANA rain gauge stations and the CHIRPS product (Table 2), also exhibited strong variability. For the ANA stations, values ranged from 4504.90 to 9228.68 MJ·mm·ha−1·h−1·yr−1, corresponding to 2014 and 2022, respectively. The CHIRPS dataset exhibited a similar pattern, with values ranging from 3892.63 to 7989.21 MJ·mm·ha−1·h−1·yr−1.
The data in Table 2 indicate that, although 2020 recorded the highest annual precipitation total, maximum rainfall erosivity occurred in 2022. The years with the lowest rainfall erosivity coincided with the lowest precipitation totals, particularly 2014 and 2017, confirming the direct relationship between precipitation availability and erosive energy.
The spatial distribution of annual rainfall erosivity estimated based on CHIRPS data is shown in Figure 2.
The CHIRPS maps indicate that dry years, such as 2014, 2017, and 2023, are characterized by a predominance of low and moderate rainfall erosivity classes across most of the basin. In contrast, wet years, particularly 2016, 2020, 2021, and 2022, exhibit an expansion of high and very high classes, with greater intensity in the central-southern sector.
The spatial distribution of rainfall erosivity derived from ANA stations is shown in Figure 3.
The patterns observed in the station data confirm the spatial variability identified by CHIRPS but reveal greater local detail and amplitude, particularly in 2016, 2020, and 2022, when specific locations reached the very high class. In years of lower rainfall erosivity, reduced values predominate in the northern sector of the basin.
3.2. Soil Loss Estimates
Based on years of minimum (2014) and maximum rainfall erosivity (2022), the RUSLE model was applied to estimate potential soil loss under contrasting climatic scenarios. The estimated the soil loss results are presented in Table 3.
Spatially, the highest soil losses are concentrated in the Quadrilátero Ferrífero and in the mountainous sectors of the central-southern portion of the basin, where steep slopes and shallow soils increase the LS factor and enhance surface runoff (Figure 4).
In contrast, areas with gentler relief in the middle and lower reaches of the basin exhibit moderate soil loss, associated with the predominance of Latosols and Argisols and greater surface protection.
3.3. Rainfall Erosivity and Climate Change
The relationship between mean annual precipitation and rainfall erosivity (R) is shown in Figure 5 and Figure 6, which summarize the interannual variability over the study period.
Although 2020 recorded the highest annual precipitation total, maximum rainfall erosivity was observed in 2022. This pattern indicates that the R factor is not solely controlled by total annual rainfall, but is strongly influenced by rainfall intensity and its temporal concentration. Rainfall erosivity derived from ANA stations ranged from 4504.90 MJ·mm·ha−1·h−1·yr−1 in 2014 to 9228.68 MJ·mm·ha−1·h−1·yr−1 in 2022. Similarly, rainfall erosivity estimated from CHIRPS ranged from 3892.63 MJ·mm·ha−1·h−1·yr−1 in 2014 to 7989.21 MJ·mm·ha−1·h−1·yr−1 in 2022, showing a comparable interannual pattern, although with slightly attenuated extreme values.
4. Discussion
4.1. Interannual Variability of Rainfall and Erosivity
Interannual variability in precipitation in the Velhas River Basin is directly reflected in the rainfall erosivity values estimated for the 2014–2024 period. Although 2020 recorded the highest annual precipitation total, maximum rainfall erosivity was observed in 2022, indicating that the R factor is not solely controlled by total rainfall volume but primarily by rainfall intensity and its temporal concentration. This behavior is consistent with the original formulation of RUSLE, in which rainfall erosivity is a function of rainfall kinetic energy and the maximum 30 min intensity of rainfall events (EI30) [6,8].
Previous studies at the national scale indicate that tropical regions exhibit high sensitivity of rainfall erosivity to rainfall irregularity, particularly when associated with extreme events [7,11,12]. The intensification observed during the 2020–2022 period suggests a greater concentration of high-energy rainfall events, even without a proportional increase in total annual precipitation, a pattern consistent with scenarios of increasing rainfall extremes reported in recent climate assessments [4,5].
4.2. Spatial Patterns of Erosivity and Performance of CHIRPS
The spatial patterns indicate a clear reorganization of rainfall erosivity classes across the basin over time. During dry years (2014 and 2017), low and moderate classes predominate across most of the basin. In contrast, the 2020–2022 period is characterized by an expansion of moderate-high, high, and very high classes, particularly in the central-southern sector, where the altitudinal gradient and orographic control favor greater concentration of rainfall energy.
Comparison between ANA stations and CHIRPS indicates strong spatial agreement, although the satellite-derived product tends to slightly attenuate extreme values. This tendency is consistent with previous studies indicating good CHIRPS performance in tropical regions, particularly for hydrological and rainfall erosivity applications [13,14]. The ability of this dataset to represent seasonal patterns and extreme rainfall events reinforces its suitability for regional-scale analyses.
4.3. Soil Loss Response under Contrasting Erosivity Scenarios
The application of RUSLE to years with minimum (2014) and maximum (2022) rainfall erosivity highlighted the central role of the R factor as the main interannual driver of potential soil loss. In 2014, soil loss values below 5 Mg ha−1 yr−1 predominate across most of the basin, whereas in 2022 a clear expansion of areas exceeding 15 Mg ha−1 yr−1, particularly in agricultural areas and mountainous sectors.
This pattern reflects the interaction between rainfall erosivity (R), topography (LS), and land use and management (C). Areas with steeper slopes, such as the Quadrilátero Ferrífero, promote greater concentration of surface runoff, thereby amplifying the effect of rainfall [21,23]. Conversely, deep and well-structured soils, predominant in the middle and lower portions of the basin, tend to attenuate the erosive response, as documented in tropical Latosols and Argisols [41,43]. The highest soil losses occur in temporary crops and poorly vegetated areas, reflecting high values of the C factor [25,44]. In contrast, forest formations maintained low soil loss rates, reinforcing their role in hydrosedimentological protection of the basin [31,35].
4.4. Climatic Variability and Hydrosedimentological Sensitivity
The temporal pattern suggests a recent increase in the frequency of years classified as high or very high in terms of rainfall erosivity. Although the analyzed series does not allow robust conclusions regarding long-term climatic trends, the coincidence between erosivity peaks and years of higher rainfall irregularity is consistent with scenarios of increasing precipitation extremes associated with global climate warming [4].
Figure 5 and Figure 6 illustrate the temporal relationship between annual precipitation and rainfall erosivity based on rain gauge observations and CHIRPS estimates. Despite differences in data sources, both series reveal a consistent interannual pattern in which variations in rainfall erosivity closely track changes in rainfall regime rather than total annual precipitation alone. This agreement indicates that the erosive response of the basin is primarily controlled by the intensity and temporal concentration of rainfall events, a behavior consistently captured by both observational and satellite-based datasets.
Greater atmospheric energy availability favors the development of more intense storms and temporally concentrated precipitation, increasing raindrop kinetic energy and consequently the R factor [4,6]. In basins with dissected relief and intense anthropogenic land use, such as the Velhas River Basin, this climatic intensification tends to generate a disproportionate erosive response, increasing the vulnerability of structurally sensitive sectors.
Therefore, the erosive dynamics of the Velhas River Basin result from a multiscale interaction between climatic variability, geomorphological characteristics, and land use changes, with the R factor acting as the primary interannual trigger of increased soil loss.
5. Conclusions
This study demonstrates that the interannual variability in rainfall erosivity is the primary natural control on potential soil loss in the Velhas River Basin. The comparison between years of minimum (2014) and maximum (2022) rainfall erosivity showed that increases in the R factor not only increase mean soil loss values but also expand the spatial extent of critical areas.
The results indicate that rainfall erosivity is not solely controlled by total annual precipitation but is strongly influenced by rainfall intensity and temporal concentration. The year 2022 recorded the highest rainfall erosivity value in the series, despite not exhibiting the highest annual precipitation total, confirming the decisive role of intense rainfall events in controlling erosive dynamics.
The spatial distribution of soil loss revealed a heterogeneous pattern controlled by the interaction between rainfall erosivity, slope, soil erodibility, and land use. Mountainous sectors of the Quadrilátero Ferrífero and agricultural areas showed higher vulnerability, whereas forest formations maintain a stabilizing effect even under high rainfall erosivity conditions.
The comparison between rain gauge observations and the CHIRPS product showed strong spatial agreement, although the satellite-derived dataset tends to attenuate extreme values. Nevertheless, CHIRPS proves suitable for hydrosedimentological analyses at the basin scale, particularly in regions with uneven monitoring coverage.
Although the analyzed time series does not allow robust conclusions regarding long-term climatic trends, the recent intensification suggests increasing basin sensitivity to temporally concentrated rainfall events. In this context, the R factor emerges as the primary driver of regional erosive dynamics, highlighting the need for conservation management strategies adapted to climatic variability and landscape structural characteristics.
Despite the robustness of the analyses, some limitations should be acknowledged, including the relatively short time series, the attenuation of extreme values in satellite-derived rainfall data, and the inherent uncertainties of empirical soil loss models. These attenuations highlight the need for future studies incorporating longer time series, field validation, and higher-resolution environmental data.
Author Contributions
Conceptualization, G.R., D.S., T.B., G.L., V.S, F.R., J.A. and R.M.; methodology, G.R., D.S., T.B., G.L., F.R., J.A. and R.M.; software, G.R.; validation, G.R.; formal analysis, G.R. and R.M.; investigation, G.R. and R.M.; resources, F.R., J.A. and R.M.; data curation, G.R., M.P, F.G, D.S.; writing—original draft preparation, G.R.; writing—review and editing, G.R., D.S., M.R., T.B., G.L., V.H.S, F.R., P.G.,aV.S, J.A. and R.M.; visualization, G.R.; supervision, J.A., F.R and R.M.; project administration, G.R. and R.M.; funding acquisition, G.R. and R.M. All authors have read and agreed to the published version of the manuscript.
Funding
This research was funded by the Coordination for the Improvement of Higher Education Personnel—Brazil (CAPES), Finance Code 001. The APC was funded by the authors J.A. and R.M.
Data Availability Statement
Rainfall data from ground-based rain gauge stations were obtained from the Brazilian National Water and Sanitation Agency (ANA) through the Hidroweb hydrometeorological database, available at: https://www.snirh.gov.br/hidroweb/. Estimated precipitation data were obtained from the Climate Hazards Group InfraRed Precipitation with Station data (CHIRPS), available at: https://www.chc.ucsb.edu/data/chirps. Land use and land cover data were acquired from the MapBiomas Project (latest collection), available at: https://mapbiomas.org/. Values for the cover-management factor (C factor) were obtained from previously published scientific studies cited in the manuscript. Topographic data used to derive the LS factor were obtained from the Copernicus Digital Elevation Model, available at: https://spacedata.copernicus.eu. The LS factor was calculated using the Moore and Burch method implemented in ArcGIS software. All original datasets are publicly available from their respective repositories. The datasets generated during the analysis, including rainfall erosivity indices and spatial outputs, are available from the corresponding author upon reasonable request.
Acknowledgments
The authors thank CAPES (Coordination for the Improvement of Higher Education Personnel) for the scholarship to the first and seventh authors; and CNPq (National Council for Scientific and Technological Development) for the scholarship to eighth and ninth authors. All individuals included in this section have consented to the acknowledgement.
Conflicts of Interest
The authors declare no conflicts of interest.
Abbreviations
The following abbreviations are used in this manuscript:
| ANA | Brazilian National Water and Sanitation Agency |
| VRB | Velhas River Basin |
| CHIRPS | Climate Hazards Group InfraRed Precipitation with Station Data |
| DEM | Digital Elevation Model |
| EMBRAPA | Empresa Brasileira de Pesquisa Agropecuária |
| GEE | Google Earth Engine |
| GIS | Geographic Information System |
| IDW | Inverse Distance Weighting |
| RUSLE | Revised Universal Soil Loss Equation |
| UFV | Universidade Federal de Viçosa |
References
- Pimentel, D.; Burgess, M. Soil Erosion Threatens Food Production. Agriculture 2013, 3(3), 443–463. [Google Scholar] [CrossRef]
- Panagos, P.; Borrelli, P.; Poesen, J.; Ballabio, C.; Lugato, E.; Meusburger, K.; Montanarella, L.; Alewell, C. The new assessment of soil loss by water erosion in Europe. Environ. Sci. Policy 2015, 54, 438–447. [Google Scholar] [CrossRef]
- García-Ruiz, J.M.; Nadal-Romero, E.; Lana-Renault, N.; Beguería, S. Erosion in Mediterranean landscapes: Changes and future challenges. Geomorphology 2015, 20–36. [Google Scholar] [CrossRef]
- IPCC. Climate Change 2021: The Physical Science Basis; Cambridge University Press: Cambridge, UK, 2021. [Google Scholar]
- Marengo, J.A.; Cardona, O-D. Editorial: Climatic hazards and disaster risk reduction in South-Central America and the Caribbean. Front. Clim. 2022, 12, 19. [Google Scholar] [CrossRef]
- Renard, K.G.; Foster, G.R.; Weesies, G.A.; McCool, D.K.; Yoder, D.C. Predicting Soil Erosion by Water: A Guide to Conservation Planning with the RUSLE. In USDA Handbook 703; USDA: Washington, DC, USA, 1997. [Google Scholar]
- Alvares, C.A.; Stape, J.L.; Sentelhas, P.C.; Gonçalves, J.L.M.; Sparovek, G. Köppen’s Climate Classification Map for Brazil. Meteorol. Z. 2013, 22, 711–728. [Google Scholar] [CrossRef]
- Oliveira, P.T.S.; Wendland, E.; Nearing, M.A. Rainfall Erosivity in Brazil: A Review. Catena 2013, 100, 139–147. [Google Scholar] [CrossRef]
- Wischmeier, W.H.; Smith, D.D. Predicting Rainfall Erosion Losses: A Guide to Conservation Planning. In USDA Handbook 537; USDA: Washington, DC, USA, 1978. [Google Scholar]
- Riquetti, N.B.; Panagos, P.; Borrelli, P.; Oliveira, P.T.S.; Nearing, M.A. Rainfall Erosivity in South America: Current Patterns and Future Perspectives. Sci. Total Environ. 2020, 724, 138315. [Google Scholar] [CrossRef]
- Oliveira-Roza, M.P.; Cecílio, R.A.; Teixeira, D.B.S.; Moreira, M.C.; Almeida, A.Q.; Xavier, A.C.; Zanetti, S.S. Rainfall Erosivity over Brazil: A Large National Database. Data 2024, 9(10), 120. [Google Scholar] [CrossRef]
- Bolleli, T.M.; Santos, B.C.; Sanches, R.G.; Moreira, R.M.; Bourscheidt, V.; Souza, P.H.; Mauad, F.F. Análise espaço-temporal e extrema da erosividade da chuva na região centro-leste do Estado de São Paulo, Brasil. Rev. Dep. Geogr. 2023, 43, e205190. [Google Scholar] [CrossRef]
- Funk, C.; Peterson, P.; Landsfeld, M.; Pedreros, D.; Verdin, J.; Shukla, S.; Husak, G.; Rowland, J.; Harrison, L.; Hoell, A.; Michaelsen, J. The Climate Hazards Infrared Precipitation with Stations—A New Environmental Record for Monitoring Extremes. Sci. Data 2015, 96, 69–83. [Google Scholar] [CrossRef]
- Arregocés, H.A.; Rojano, R.; Pérez, J. Validation of the CHIRPS dataset in a coastal region with extensive plains and complex topography. Case Stud. Chem. Environ. Eng. 2023, 8, 100452. [Google Scholar] [CrossRef]
- Cooper, M.; Noronha, N.C. Land Use and Erosion. Land 2020, 9, 233. [Google Scholar] [CrossRef]
- Salgado, A.A.R.; Santos, L.J.C.; Paisani, J.C. (Eds.) The Physical Geography of Brazil: Environment, Vegetation and Landscape; Springer: Cham, Switzerland, 2019. [Google Scholar]
- Alkmim, F.F.; Teixeira, W. The Minas Accretionary Orogen. In São Francisco Craton, Eastern Brazil; Heilbron, M., Alkmim, F.F., Eds.; Springer: Cham, Switzerland, 2017. [Google Scholar]
- Cavalcanti, J.A.D.; Silva, M.S.; Schobbenhaus, C.; Atencio, D.; Lima, H.M. Geoconservation of geological and mining heritage related to banded iron formation of Itabira Group, Quadrilátero Ferrífero, Minas Gerais, Brazil: A challenging issue. Int. J. Geoherit. Parks. 2023, 11, 118–148. [Google Scholar] [CrossRef]
- Wang, Y.; Shu, J.; Yuan, Y. Navigating urban risks for sustainability: A comprehensive evaluation of urban vulnerability based on a pressure–sensitivity–resilience framework. Sustain. Cities Soc. 2024, 117, 105961. [Google Scholar] [CrossRef]
- Carmo, F.F.; Lanchotti, A.O.; Kamino, L.H.Y. Mining Waste Challenges: Environmental Risks of Gigatons of Mud, Dust and Sediment in Megadiverse Regions in Brazil. Sustainability 2020, 12(20), 8466. [Google Scholar] [CrossRef]
- Oliveira, P.T.S.; Wendland, E.; Nearing, M.A. Rainfall erosivity in Brazil: A review. Catena 2012, 100, 139–147. [Google Scholar] [CrossRef]
- Montgomery, D.R. Slope Processes and Erosion. Geol. Soc. Am. Bull. 2004, 116, 162–176. [Google Scholar] [CrossRef]
- Santana, D.B.; Lense, G.H.E.; Rios, G.S.; Archanjo, R.E.; Raniero, M.; Santana, A.B.; Rubira, F.G.; Ayer, J.E.B.; Mincato, R.L. Spatiotemporal Dynamics of Soil and Soil Organic Carbon Losses via Water Erosion in Coffee Cultivation in Tropical Regions. Sustainability 2025, 17, 821. [Google Scholar] [CrossRef]
- Instituto Brasileiro de Geografia e Estatística (IBGE). Estimativas Populacionais dos Municípios. Available online: https://www.ibge.gov.br (accessed on 10 January 2025).
- Mello, C.R.; Norton, L.D.; Pinto, L.C.; Beskow, S.; Curi, N. Agricultural Watershed Modeling: A Review for Hydrology and Soil Erosion Processes. Ciênc. Agrotec. 2016, 40, 7–25. [Google Scholar] [CrossRef]
- Agência Nacional de Águas e Saneamento Básico (ANA). Sistema Hidroweb. Available online: https://www.snirh.gov.br (accessed on 10 January 2025).
- Ramalho Filho, A.; Beek, K.J. Sistema de Avaliação da Aptidão Agrícola das Terras; Embrapa: Rio de Janeiro, Brazil, 1995. [Google Scholar]
- Universidade Federal de Viçosa (UFV); Fundação Estadual do Meio Ambiente (FEAM); Fundação Centro Tecnológico de Minas Gerais (CETEC). Universidade Federal de Lavras (UFLA). Mapa de Solos do Estado de Minas Gerais: Legenda Expandida; FEAM: Belo Horizonte, Brazil; 2010. [Google Scholar]
- Curi, N.; Ker, J.C.; Novais, R.F.; Vidal-Torrado, P.; Schaefer, C.E.G.R. Assessing Soil Erosion Susceptibility in a Tropical Landscape: Insights from a Brazilian Case Study. Sustainability 2026, 18(4), 1878. [Google Scholar] [CrossRef]
- Cunha, E.R.; Bacani, V.M.; Panachuki, E. Modeling Soil Erosion Using RUSLE and GIS in a Watershed Occupied by Rural Settlement in the Brazilian Cerrado. Nat. Hazards 2017, 85, 851–868. [Google Scholar] [CrossRef]
- Bertoni, J.; Lombardi Neto, F. Conservação do Solo, 10th ed.; Ícone: São Paulo, Brazil, 2017. [Google Scholar]
- Durigan, G. Cerrado: Biodiversity and Ecosystem Services under Severe Threat by Misguided Restoration. Ann. Bot. 2025, mcaf306. [Google Scholar] [CrossRef]
- Vancine, M.H.; Muylaert, R.L.; Niebuhr, B.B.; Oshima, J.E.F.; Tonetti, V.; Bernardo, R.; De Angelo, C.; Rosa, M.R.; Grohmann, C.H.; Ribeiro, M.C. The Atlantic Forest of South America: Spatiotemporal Dynamics of Vegetation and Implications for Conservation. Biol. Conserv. 2024, 291, 110499. [Google Scholar] [CrossRef]
- Projeto MapBiomas. Coleção 8. Available online: https://mapbiomas.org (accessed on 10 January 2025).
- Beskow, S.; Mello, C.R.; Norton, L.D.; Curi, N.; Viola, M.R.; Avanzi, J.C. Soil erosion prediction in the Grande River Basin, Brazil using distributed modelling. Catena 2009, 79, 49–59. [Google Scholar] [CrossRef]
- Rios, G.S.; Santana, D.B.; Lense, G.H.E.; Silva, B.A.; Ayer, J.E.B.; Kader, S.; Spalevic, V.; Rubira, F.G.; Mincato, R.L. Estimates of Soil Losses Due to Water Erosion in the Amazon Biome. Agric. For. 2024, 70, 361–378. [Google Scholar] [CrossRef]
- Dirks, K.N.; Hay, J.E.; Stow, C.D.; Harris, D. High-Resolution Studies of Rainfall on Norfolk Island: Part II: Interpolation of Rainfall Data. J. Hydrol. 1998, 208, 187–199. [Google Scholar] [CrossRef]
- R Core Team. R: A Language and Environment for Statistical Computing; R Foundation for Statistical Computing: Vienna, Austria, 2024. [Google Scholar]
- Desmet, P.J.J.; Govers, G. A GIS Procedure for Automatically Calculating the LS Factor on Topographically Complex Landscape Units. J. Soil Water Conserv. 1996, 51, 427–433. [Google Scholar] [CrossRef]
- European Space Agency (ESA). Copernicus Digital Elevation Model (DEM). Available online: https://spacedata.copernicus.eu (accessed on 10 January 2025).
- Silva, M.L.N.; Curi, N.; Ferreira, M.M.; Lima, J.M. Soil Conservation and Crop Management Effects on Soil Erosion. Rev. Bras. Ciênc. Solo 2012, 36, 683–693. [Google Scholar] [CrossRef]
- Mhaske, S.N.; Singh, S.; Bhat, S.; Pandey, A. Assessment and Management of Soil Erosion in the Hilltop Mining Dominated Catchment Using GIS Integrated RUSLE Model. J. Environ. Manag. 2021, 296, 113172. [Google Scholar] [CrossRef]
- EMBRAPA. Manual de Conservação do Solo; Empresa Brasileira de Pesquisa Agropecuária: Rio de Janeiro, Brazil, 1979. [Google Scholar]
- Lepsch, I.F.; Espindola, C.R.; Visconti, F.; Hernani, L.C.; Siqueira, D.S. Manual para Levantamento Utilitário do Meio Físico e Classificação de Terras no Sistema de Capacidade de Uso; Sociedade Brasileira de Ciência do Solo: Viçosa, Brazil, 2015. [Google Scholar]
Figure 1.
Location and land use and land cover map of the Velhas River Basin, based on data from the MapBiomas Project [22] and the Brazilian National Water and Sanitation Agency (ANA) [26].
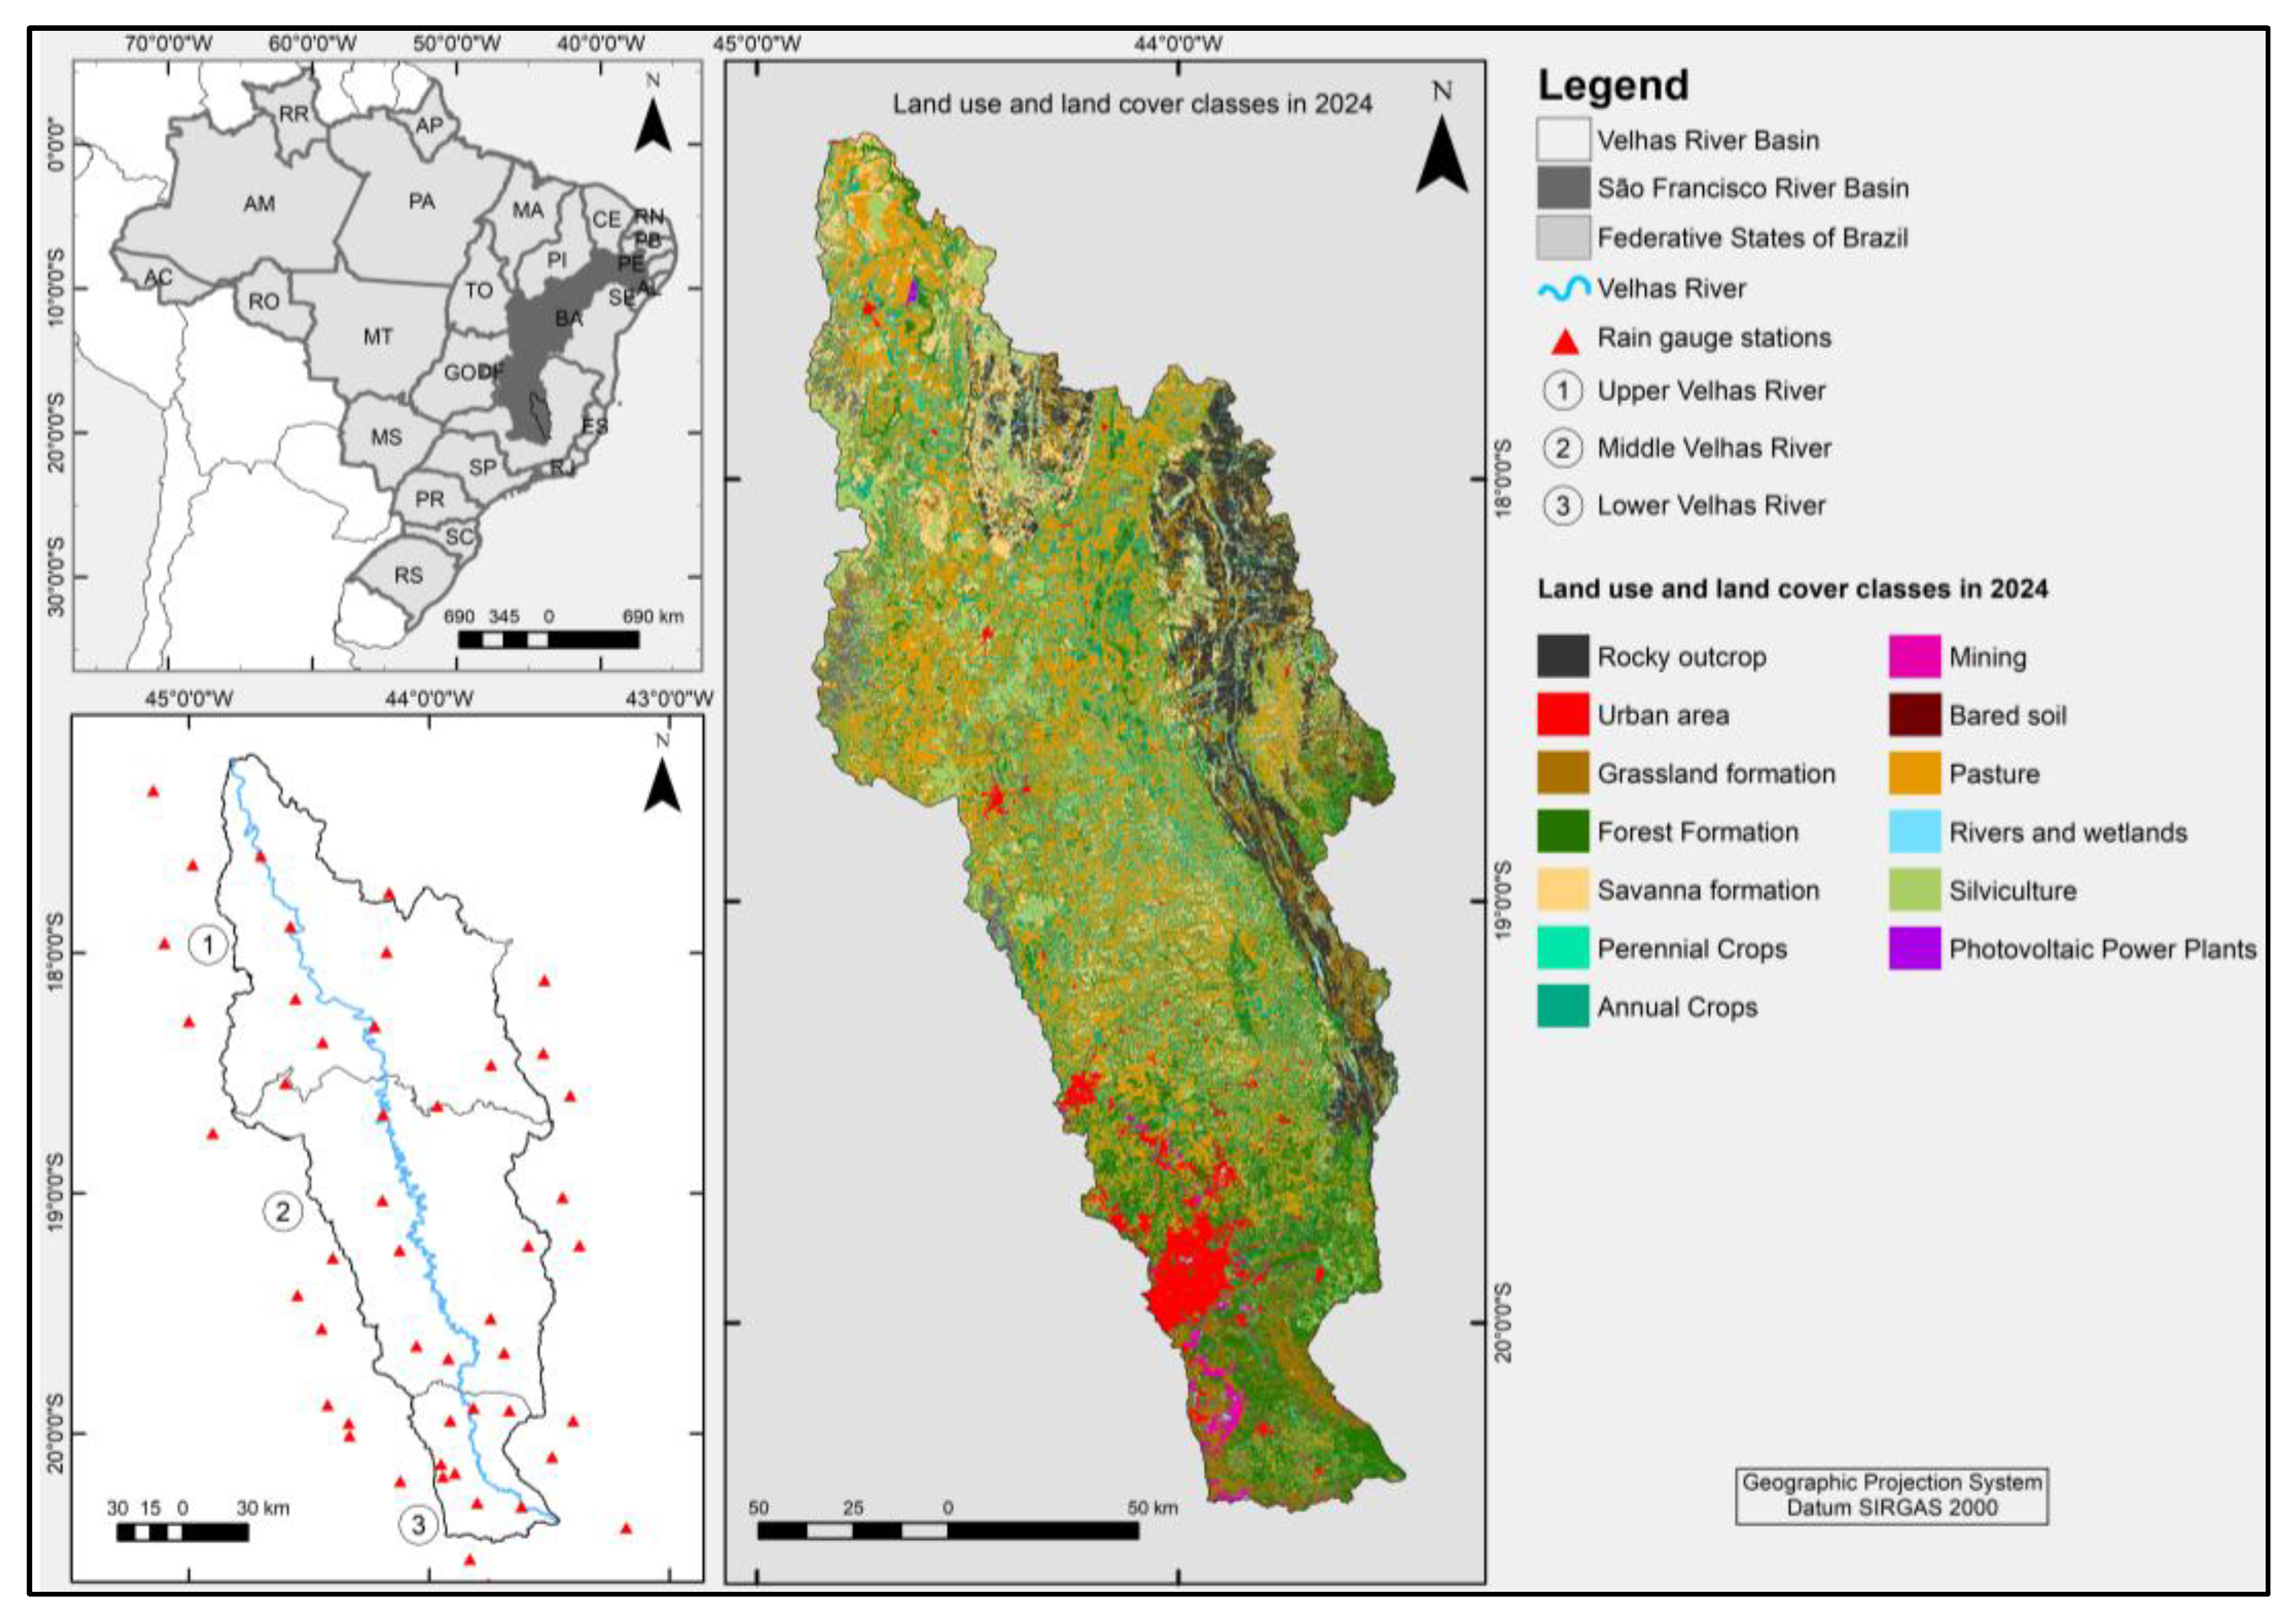
Figure 2.
Annual rainfall erosivity derived from CHIRPS data (2014–2024).
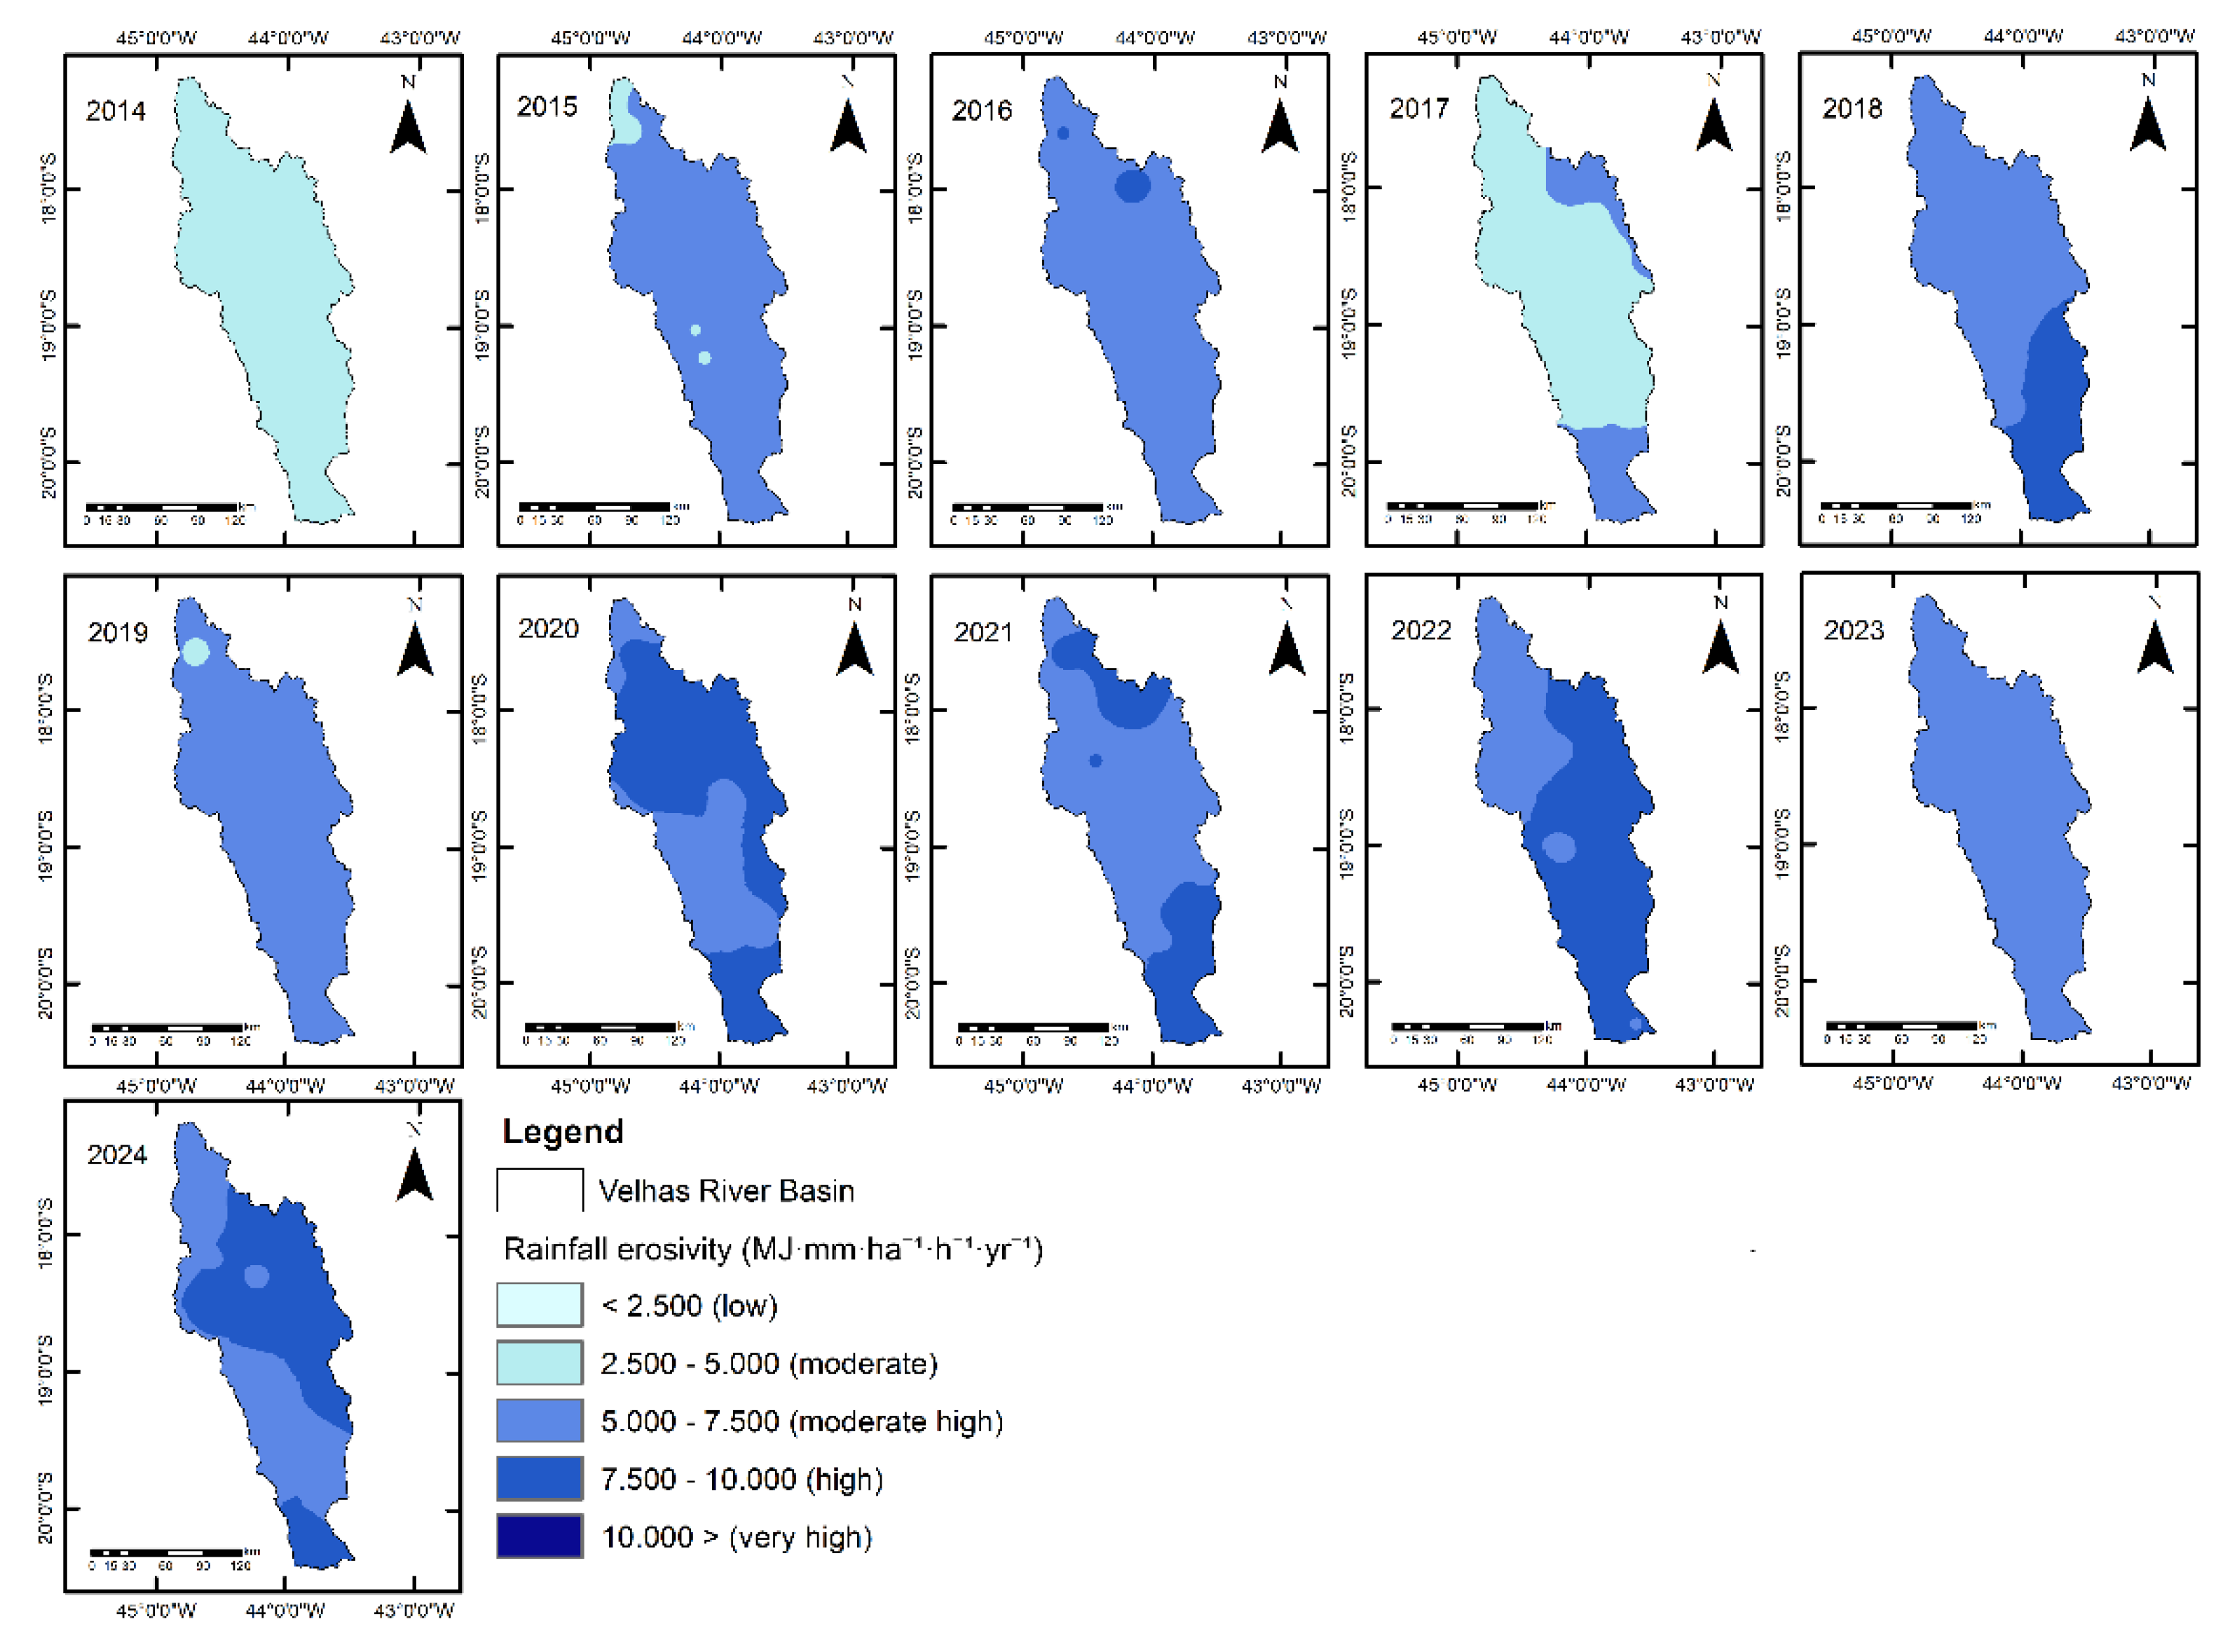
Figure 3.
Annual rainfall erosivity derived from ANA stations (2014–2024).
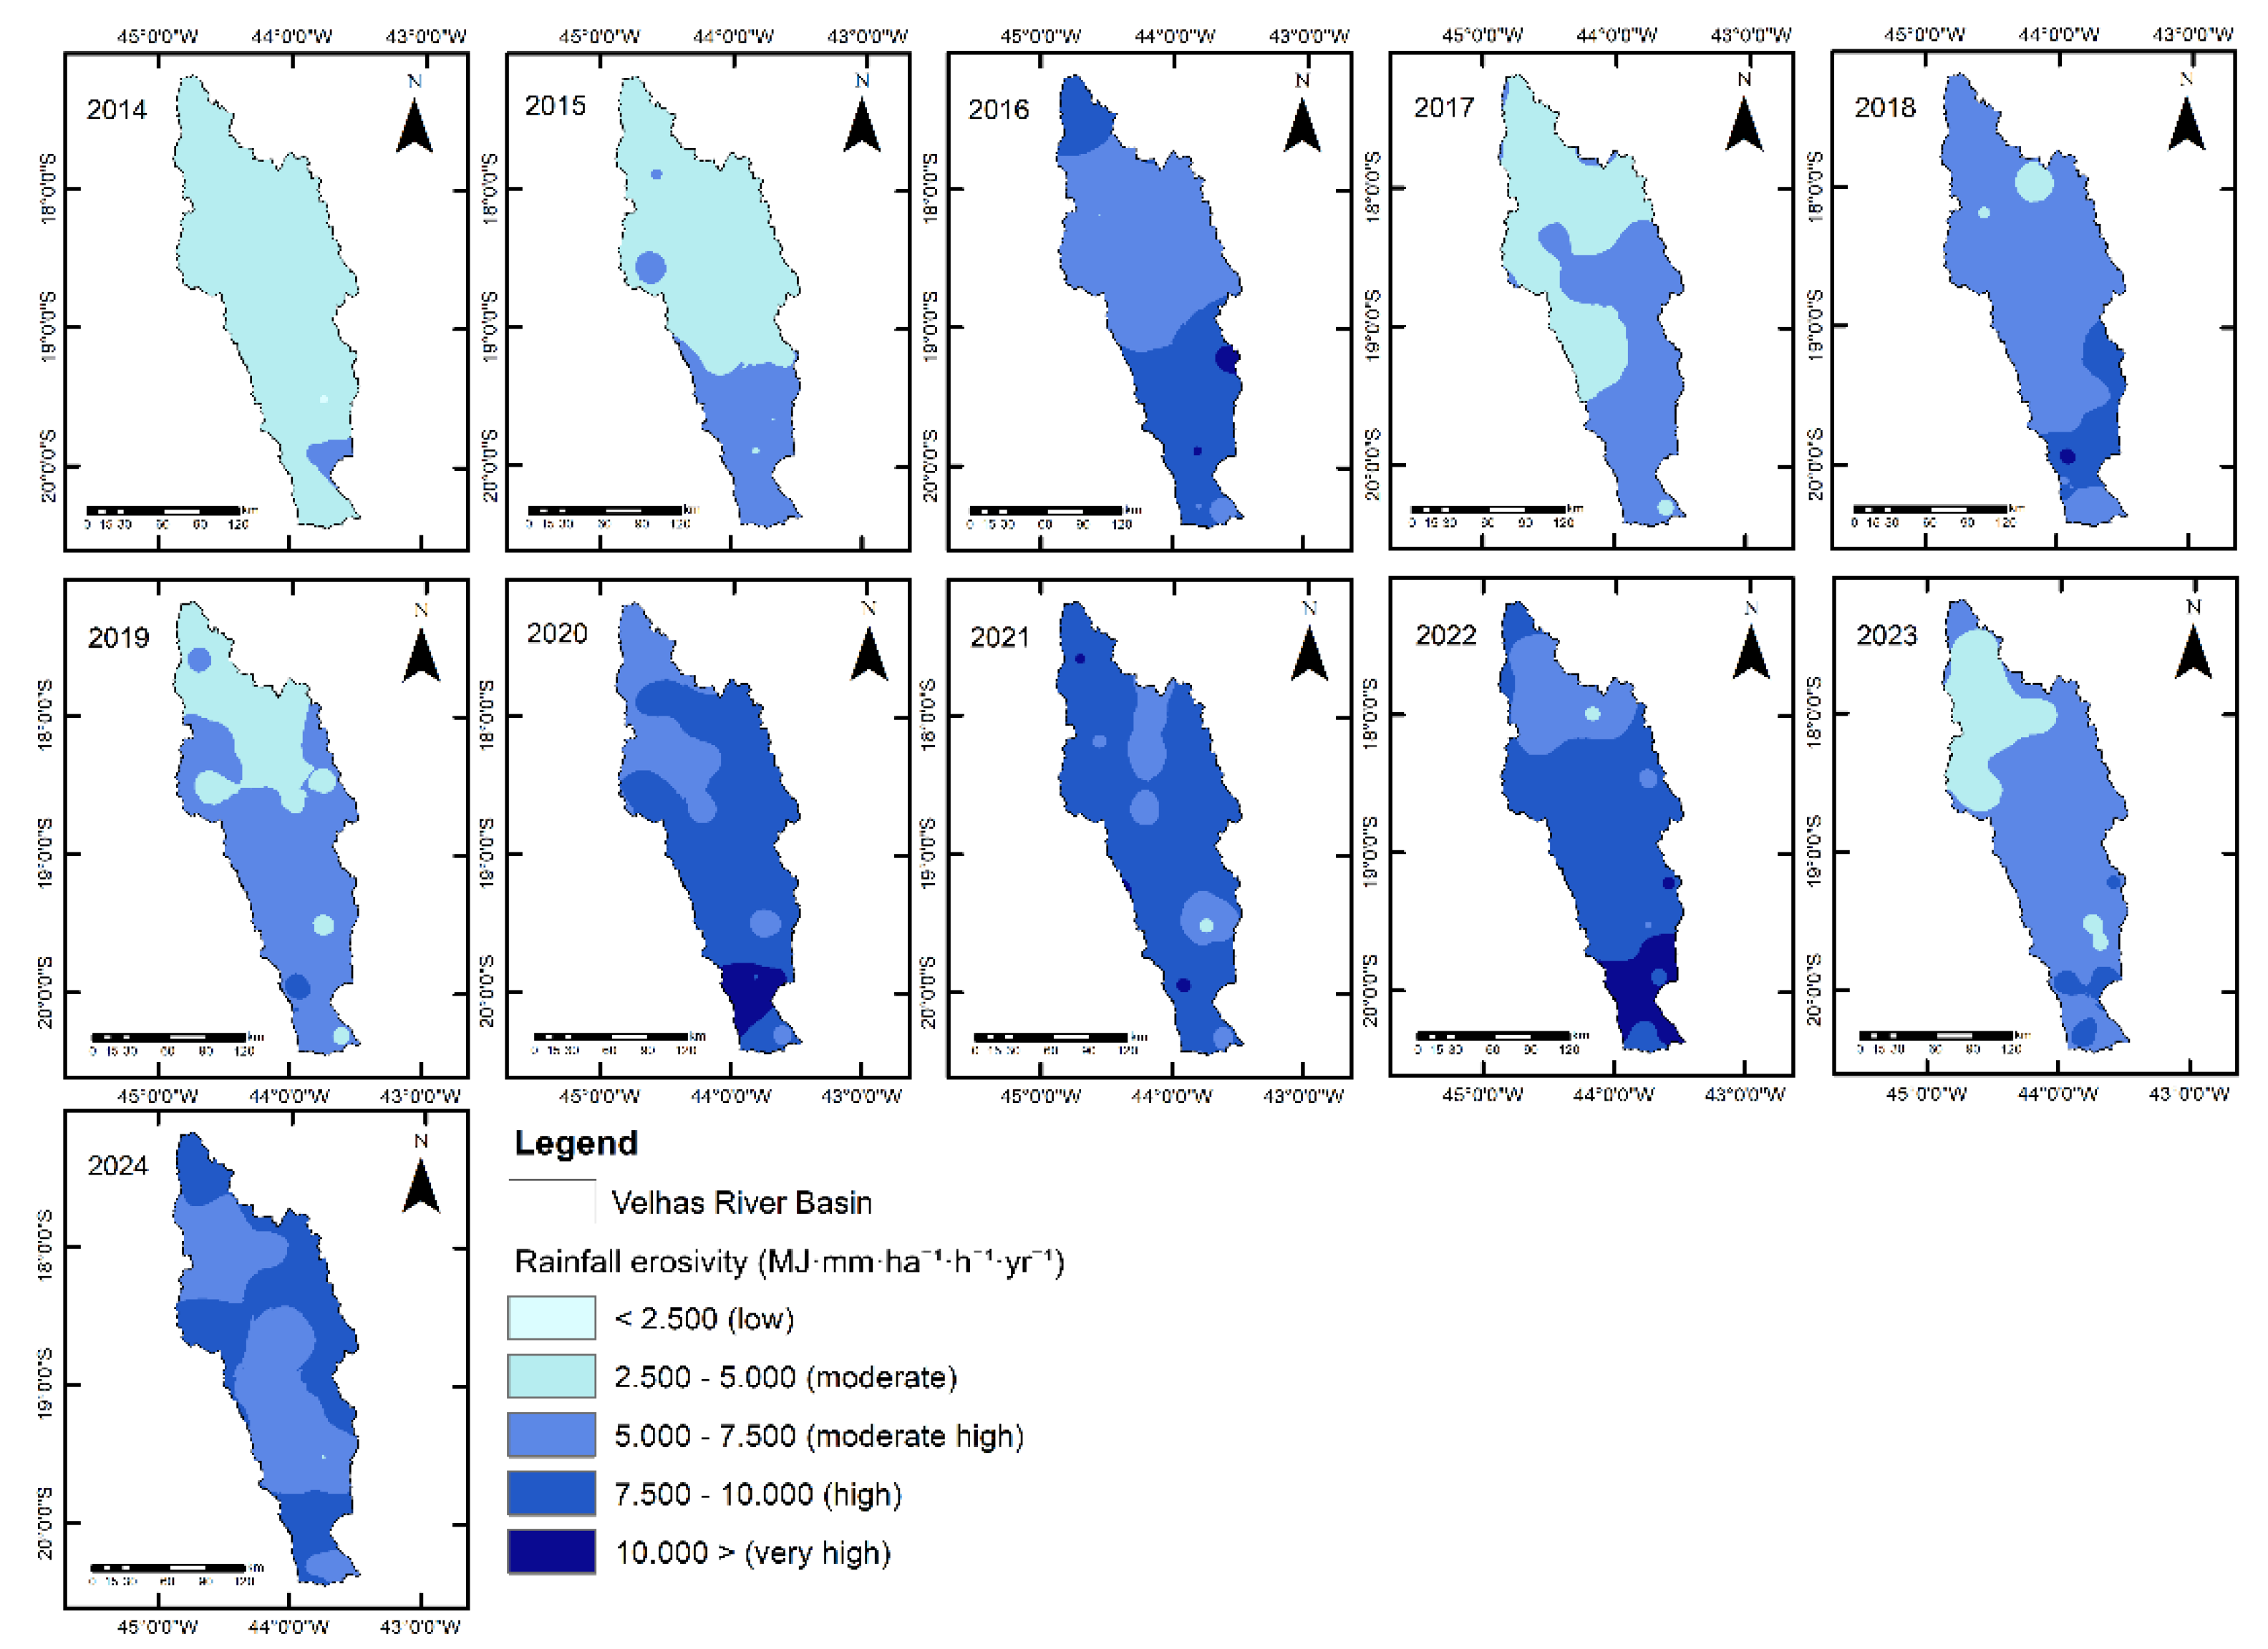
Figure 4.
Spatial distribution of soil loss (Mg ha−1 yr−1) in the Velhas River Basin estimated using RUSLE model for years of minimum and maximum rainfall erosivity. (A) 2014—ANA stations; (B) 2022—ANA stations; (C) 2014—CHIRPS; (D) 2022—CHIRPS.
Figure 4.
Spatial distribution of soil loss (Mg ha−1 yr−1) in the Velhas River Basin estimated using RUSLE model for years of minimum and maximum rainfall erosivity. (A) 2014—ANA stations; (B) 2022—ANA stations; (C) 2014—CHIRPS; (D) 2022—CHIRPS.
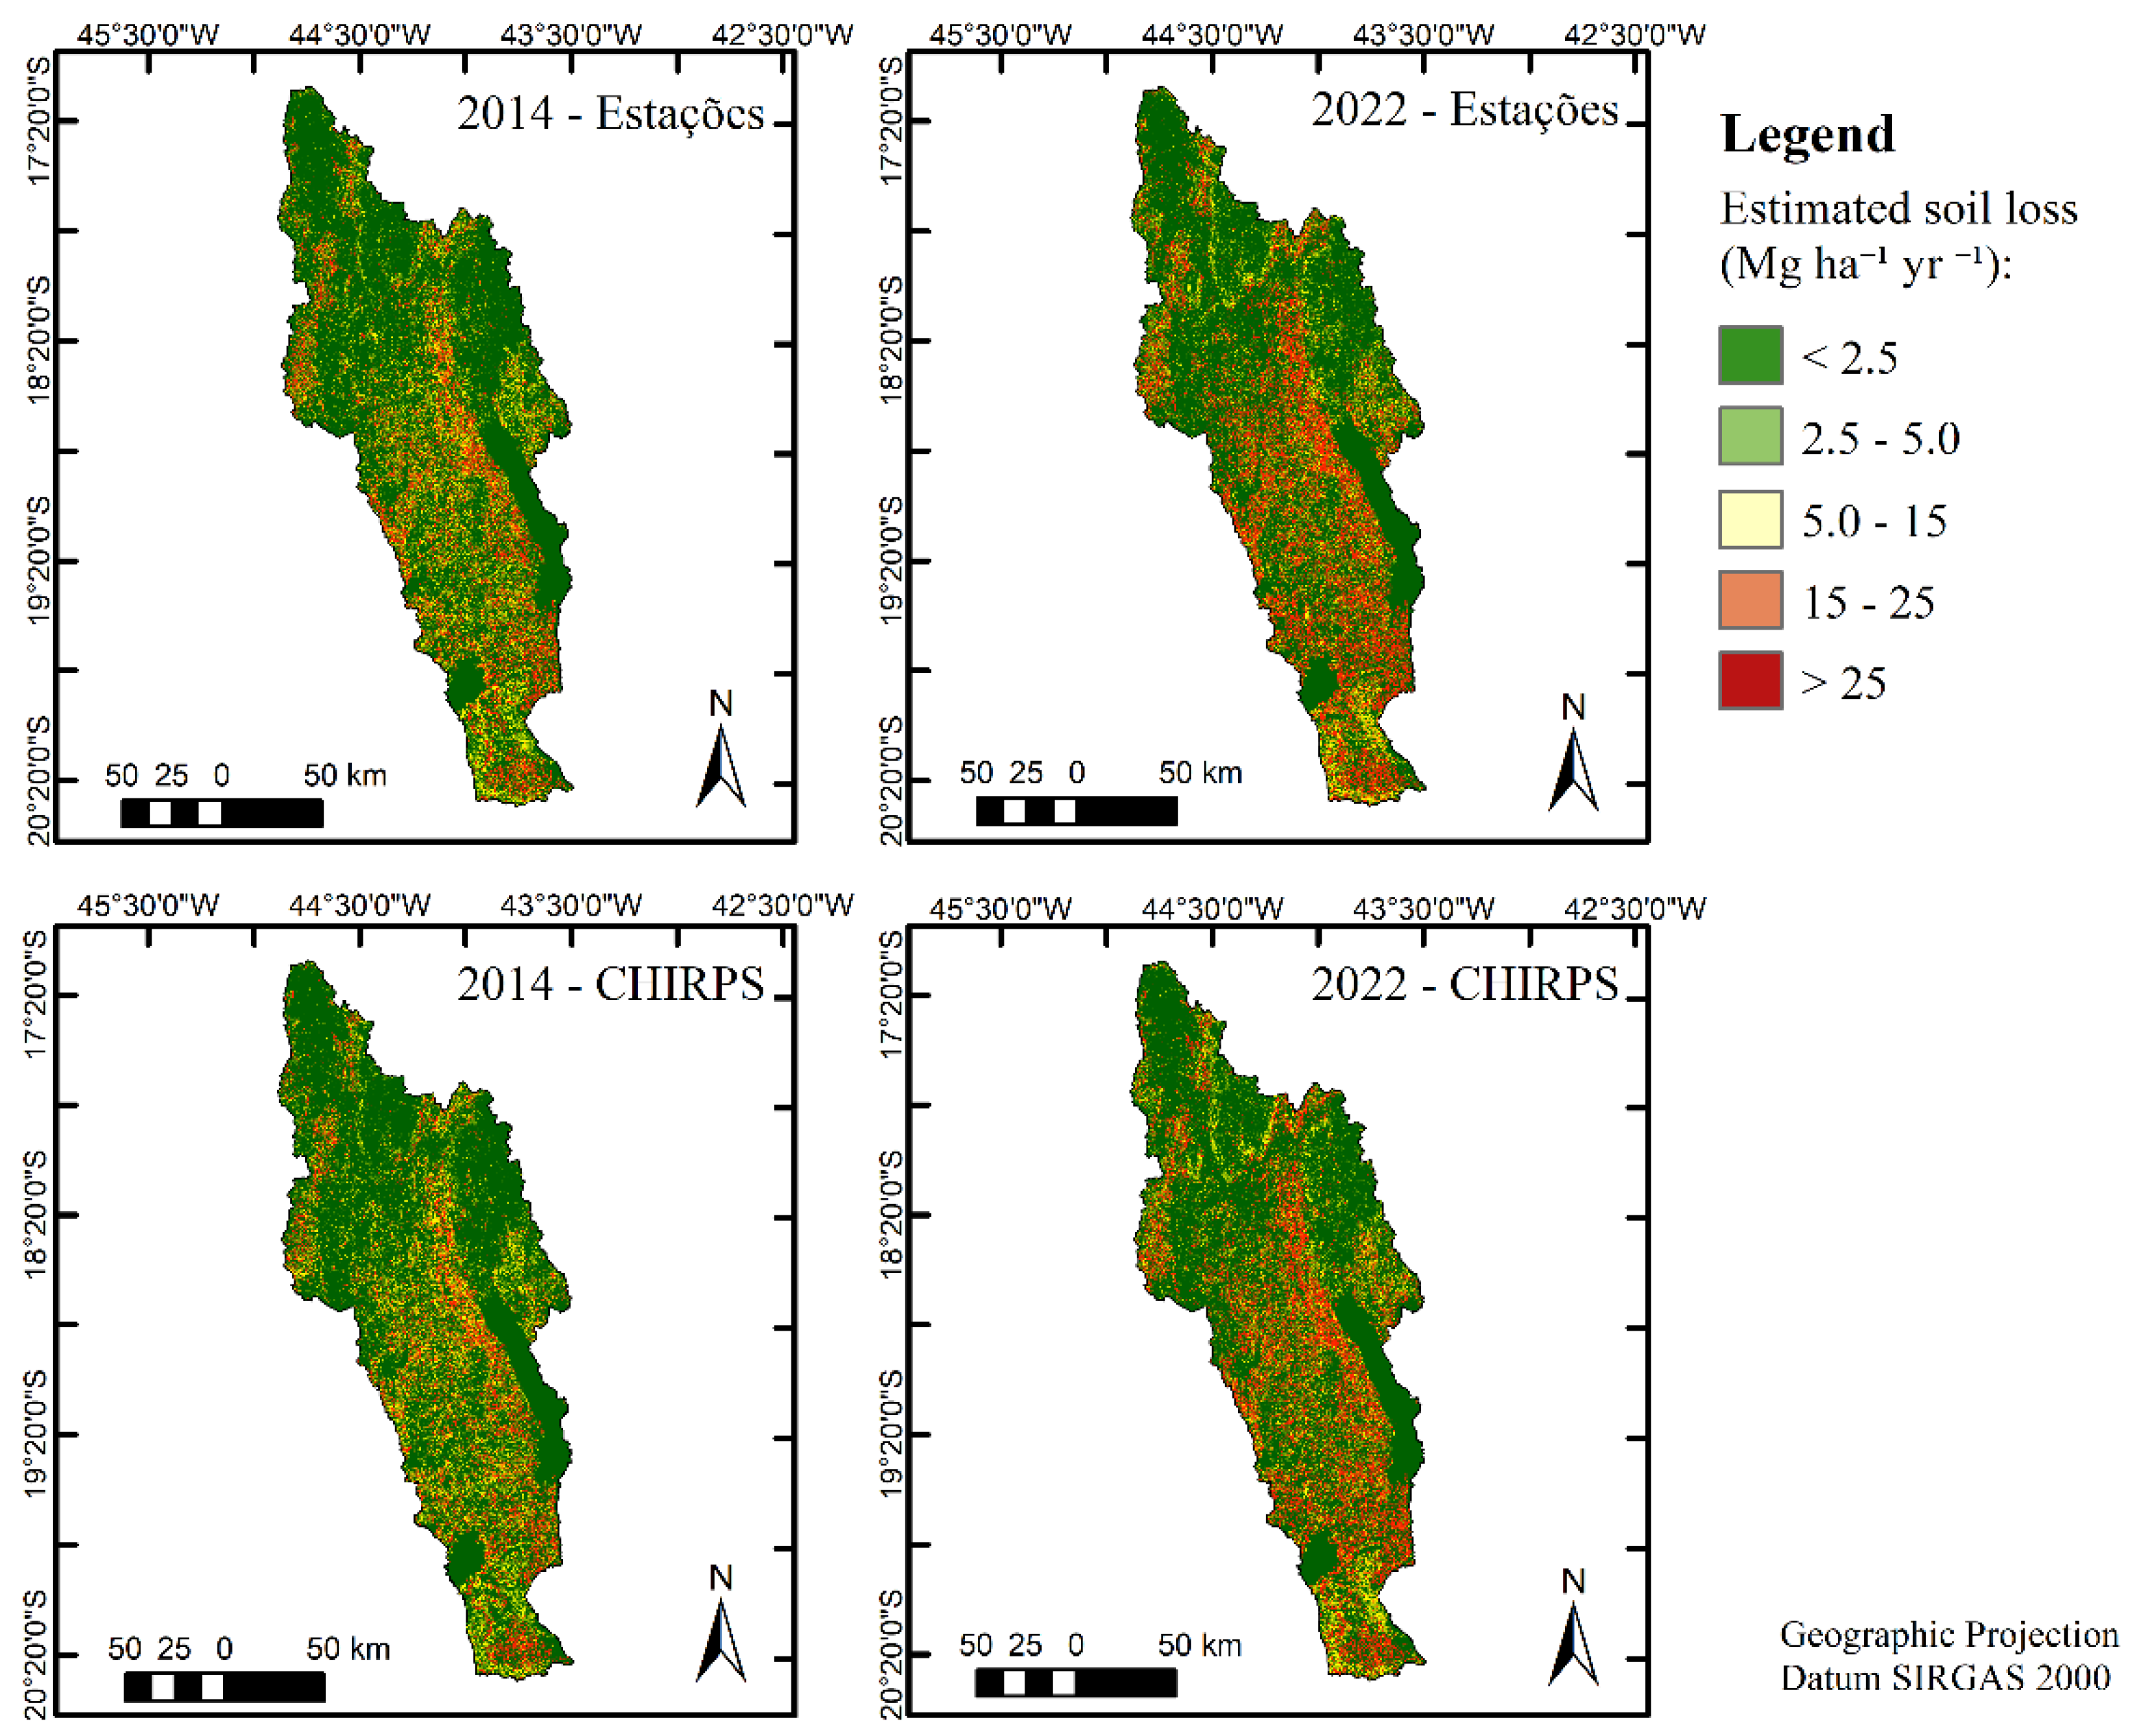
Figure 5.
Time series of mean annual precipitation (mm) and rainfall erosivity (R; MJ mm ha−1 h−1 yr−1) in the Velhas River Basin from 2014 to 2024 based on data from ANA rain gauge stations, highlighting extreme events and linear trends.
Figure 5.
Time series of mean annual precipitation (mm) and rainfall erosivity (R; MJ mm ha−1 h−1 yr−1) in the Velhas River Basin from 2014 to 2024 based on data from ANA rain gauge stations, highlighting extreme events and linear trends.
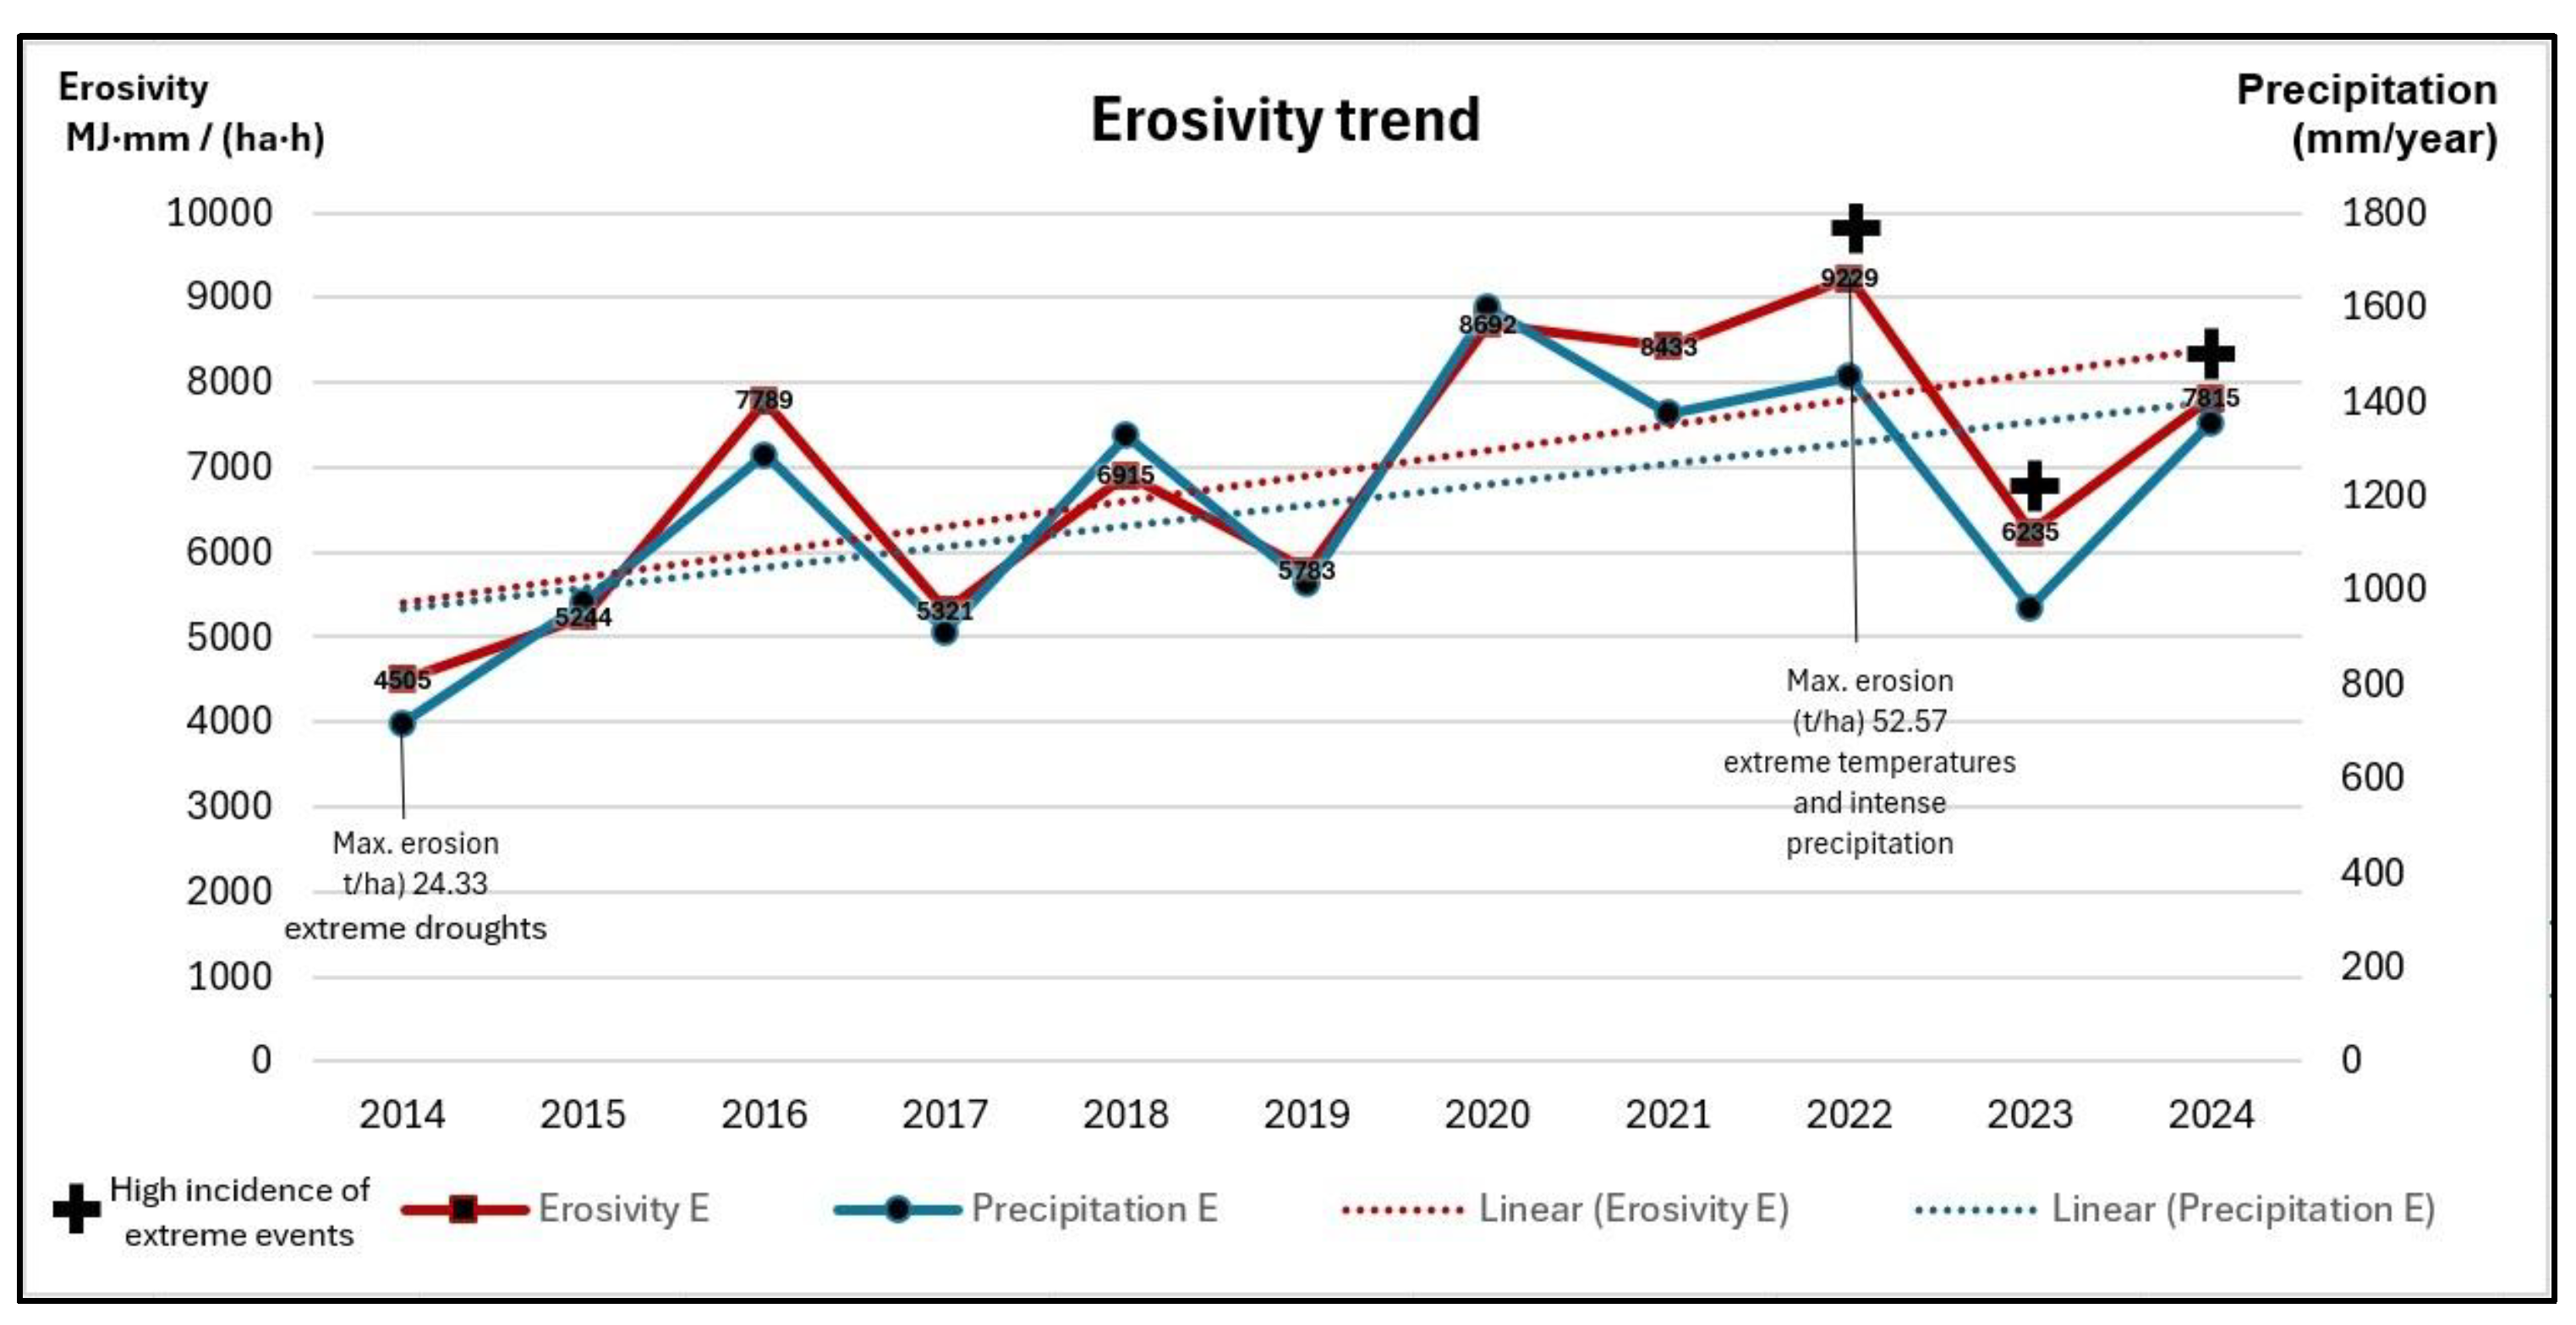
Figure 6.
Time series of mean annual precipitation (mm) and rainfall erosivity (R; MJ mm ha−1 h−1 yr−1) in the Velhas River Basin from 2014 to 2024 based on CHIRPS data, highlighting extreme events and linear trends.
Figure 6.
Time series of mean annual precipitation (mm) and rainfall erosivity (R; MJ mm ha−1 h−1 yr−1) in the Velhas River Basin from 2014 to 2024 based on CHIRPS data, highlighting extreme events and linear trends.
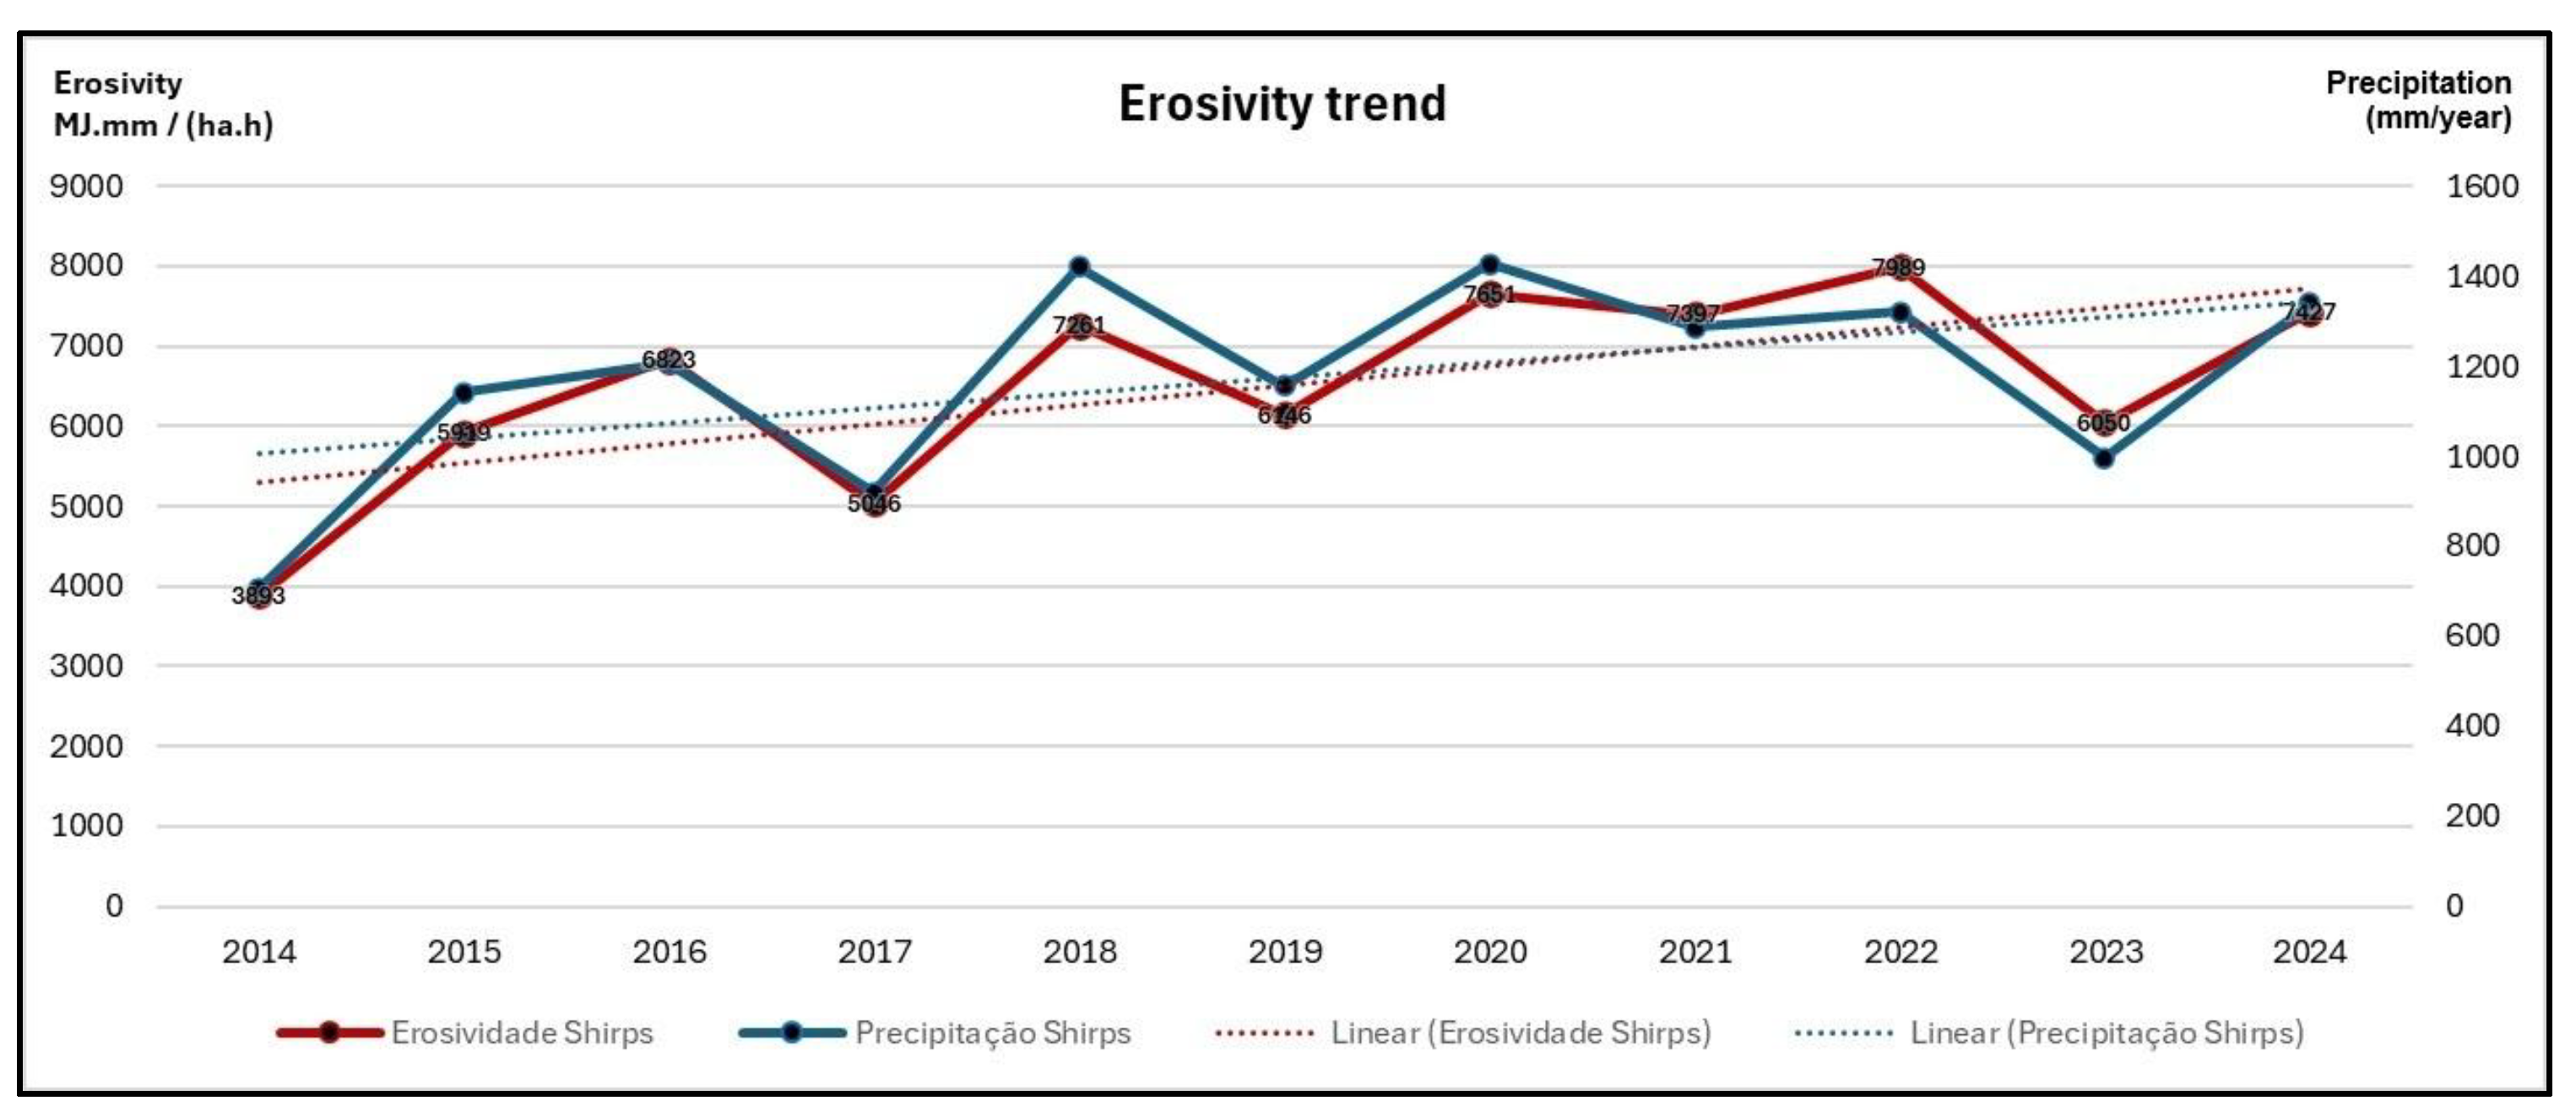

Table 1.
C factor values assigned to land use and land cover classes in the Velhas River Basin.
| Land Use and Land Cover Class | C Factor | Reference |
|---|---|---|
| Forest Formation | 0.001 | [6,9,31] |
| Savanna Formation | 0.02 | [30,31] |
| Grassland Formation | 0.02 | [30,31] |
| Pasture | 0.12 | [30,31] |
| Silviculture | 0.08 | [30,35] |
| Temporary Crops | 0.30 | [6,30,31] |
| Perennial Crops | 0.15 | [30,31] |
| Urban Areas | 0.05 | [31] |
| Exposed Soil | 1.00 | [9] |
Table 2.
Annual mean erosivity (MJ·mm·ha−1·h−1·yr−1).
| Year | ANA Stations | CHIRPS |
|---|---|---|
| 2014 | 4504.90 | 3892.63 |
| 2015 | 5243.70 | 5919.40 |
| 2016 | 7789.00 | 6823.38 |
| 2017 | 5321.09 | 5046.08 |
| 2018 | 6914.77 | 7261.33 |
| 2019 | 5783.33 | 6146.41 |
| 2020 | 8692.29 | 7650.91 |
| 2021 | 8433.37 | 7396.51 |
| 2022 | 9228.68 | 7989.21 |
| 2023 | 6234.77 | 6050.37 |
| 2024 | 7815.04 | 7426.89 |
Table 3.
Mean soil loss (Mg ha−1 yr−1) by land use and land cover classes.
| Class | 2014 Stations | 2014 CHIRPS | 2022 Stations | 2022 CHIRPS |
|---|---|---|---|---|
| Forest formation | 0.68 | 0.60 | 1.50 | 1.28 |
| Savanna formation | 1.64 | 1.43 | 3.06 | 3.14 |
| Grassland formation | 2.58 | 2.34 | 5.55 | 4.56 |
| Urban areas | 2.30 | 2.01 | 6.22 | 5.03 |
| Silviculture | 6.77 | 5.60 | 13.58 | 11.61 |
| Pasture | 7.82 | 6.81 | 16.16 | 14.37 |
| Perennial crops | 21.50 | 18.53 | 72.01 | 59.12 |
| Temporary crops | 38.49 | 33.64 | 80.88 | 71.72 |
| Exposed soil | 137.19 | 114.86 | 274.17 | 235.90 |
Disclaimer/Publisher’s Note: The statements, opinions and data contained in all publications are solely those of the individual author(s) and contributor(s) and not of MDPI and/or the editor(s). MDPI and/or the editor(s) disclaim responsibility for any injury to people or property resulting from any ideas, methods, instructions or products referred to in the content. |
© 2026 by the authors. Licensee MDPI, Basel, Switzerland. This article is an open access article distributed under the terms and conditions of the Creative Commons Attribution (CC BY) license.
Copyright: This open access article is published under a Creative Commons CC BY 4.0 license, which permit the free download, distribution, and reuse, provided that the author and preprint are cited in any reuse.


