Submitted:
03 April 2026
Posted:
07 April 2026
You are already at the latest version
Abstract
This paper proposes a two-stage hybrid framework for biosignal quality validation that produces beat-level and segment-level labels for real-time filtering and offline dataset curation. The framework is designed for non-stationary periodic biomedical time-series signals including electrocardiography (ECG), photoplethysmography (PPG), impedance cardiography (ICG), phonocardiography (PCG), electromyography (EMG), and electroencephalography (EEG) and is demonstrated and evaluated primarily on ECG. A prerequisite is synchronized acquisition of the primary biosignal together with inertial motion sensing (IMU/accelerometer) and electrode impedance or lead-off status, with the IMU positioned near the sensing electrodes. The first stage performs sensor-integrity gating to reject intervals corrupted by motion or poor electrode contact. The second stage applies software signal-quality indices to the remaining beats, including physiological plausibility constraints (R to R peaks analysis), DTW-based morphological consistency against adaptive templates, frequency-domain SNR estimation, and baseline-wander quantification. This study systematically evaluates and compares the classification performance of six complementary sensor-level and software-based signal quality assessment methods. When integrated within the proposed hybrid framework, validation against expert-annotated ECG quality labels demonstrates high performance, achieving approximately 98% accuracy, 98% F1-score, 99% sensitivity, and 97% specificity. This modular, extensible approach enhances the trustworthiness of downstream analytics by preventing contaminated segments from entering feature extraction and model training pipelines, enabling more stable physiological monitoring in free-living conditions, reducing false alarms in continuous monitoring applications, and generating higher-quality datasets for AI-based diagnostic systems.
Keywords:
signal quality assessment
; biosignals
; electrocardiogram
; motion artifact detection
; lead-off detection
; hybrid validation framework
; dynamic time warping
; signal-to-noise ratio
; baseline wander
; sensor integrity screening
; signal quality index evaluation
; accelerometer-based artifact rejection
1. Introduction
Wearable biosignal monitoring enables continuous physiological assessment outside clinical settings and supports applications such as rhythm screening, longitudinal monitoring, and remote patient management. However, real-world recordings are frequently degraded by motion artifacts, baseline drift, intermittent electrode contact, and environmental interference, which can compromise diagnostic reliability, increase false alarms, and contaminate datasets used for machine-learning model development.
Most existing signal-quality approaches operate purely in the software domain and evaluate the waveform after acquisition, which can waste computation on irrecoverably corrupted intervals and often yields binary accept/reject outputs rather than granular labels suitable for dataset curation. Conversely, hardware-level indicators such as accelerometer-derived motion measures and electrode impedance/lead-off monitoring enable early rejection, but alone cannot capture all corruption sources (e.g., EMG interference or residual waveform distortion). This motivates a unified framework that combines hardware-informed screening with robust software indices to provide interpretable, beat-resolved quality outcomes suitable for real-time and offline use.
This work presents a two-stage signal-quality validation architecture that integrates (i) Sensor Integrity gating using synchronized IMU and impedance/lead-off information and (ii) Signal Quality Index evaluation using complementary software metrics. The framework targets beat-based modalities such as ECG/PPG/ICG (beat-level scoring) and can be extended to other biosignals where segment-level and not beat-level rejection is more appropriate. It fuses multiple validation outputs into a configurable global score (unusable to excellent) to support artifact rejection, reliable feature extraction, and systematic filtering of biomedical signals.
The framework targets diverse populations including patients with cardiovascular disease requiring continuous monitoring, heart failure patients undergoing remote assessment, post-operative cardiac patients, and healthy individuals in fitness tracking. It addresses both real-time monitoring enabling automated artifact rejection and adaptive alarms and offline dataset curation for retrospective analysis and machine-learning model development. Critically, the granular quality scores enable systematic verification and filtering of data used for training AI diagnostic models, ensuring that only high-quality segments are included in training, validation datasets and increase clinician confidence in wearable monitoring technology for patient care.
2. Related Work
This framework builds upon and details the signal quality validation methodology employed in the comprehensive AI-enhanced smart textile system for cardiovascular monitoring described in [1], where synchronized multi-modal biosignals including ECG, ICG, PPG, PCG, and IMU signals all acquired at 1 kHz sampling rates, necessitating robust quality assessment to ensure reliable diagnostic accuracy.
The challenge of biosignal quality assessment in wearable and ambulatory monitoring has been approached from multiple perspectives, which can be organized into hardware-based artifact detection, software-based signal quality indices, hybrid frameworks, and application-specific validation methods.
Hardware-level quality assessment uses auxiliary sensors to identify corrupted signal segments before algorithmic processing. Accelerometer-based motion artifact detection is widely used in wearable ECG systems; Tong et al. demonstrated adaptive filtering techniques that exploit synchronized electrode-motion sensor signals to attenuate motion-induced artifacts in ECG recordings [3]. Electrode-skin impedance monitoring has emerged as a complementary approach; whereby continuous or periodic impedance measurements identify poor contact quality [5]. However, hardware-based methods alone cannot capture signal corruption arising from electromagnetic interference, muscle artifacts, or physiological variations, necessitating integration with software quality indices.
Software quality assessment methods analyze the acquired biosignal itself to quantify its integrity. For ECG signals, R-peak detection reliability has been used as a quality indicator, with the Pan-Tompkins algorithm serving as both a feature extractor and an implicit quality assessor [7]. Physiological plausibility metrics particularly RR interval analysis have been extensively employed to identify arrhythmias and artifacts, with approaches spanning simple range checking to comprehensive signal quality index frameworks incorporating multi-source data fusion [8]. Morphological quality assessment using template matching has been investigated through various approaches: Moody and Mark proposed a Karhunen-Loève transform-based method for compact QRS morphology representation and noise estimation [9]; Hayn et al. applied morphology-based feature extraction for automated ECG quality evaluation [10]; and Dynamic Time Warping (DTW), which accommodates temporal variations in beat morphology, has been applied to pulsatile signal quality assessment by Li and Clifford [16] and to real-time arrhythmia detection combined with ECG quality monitoring in intensive care settings by Krasteva et al. [11]. Frequency-domain approaches computing signal-to-noise ratio or power spectral density have proven effective for identifying high-frequency noise and baseline wander [13,14]. Orphanidou et al. proposed a comprehensive signal-quality index framework deriving and validating morphological and statistical indicators for ambulatory ECG and PPG monitoring in wireless wearable systems [17]. Li and Clifford further demonstrated the utility of DTW combined with machine learning for signal quality assessment of pulsatile biosignals [16]. Despite their effectiveness, purely software-based methods incur computational costs on fundamentally unusable data and lack the early rejection capability that hardware information provides.
Recent work has begun integrating hardware and software quality indicators to leverage complementary strengths. Gradl et al. developed a real-time ECG monitoring and arrhythmia detection system on Android-based mobile devices, demonstrating practical deployment of combined acquisition and processing pipelines in ambulatory settings [19]. Zhao and Zhang proposed a simple statistics-based SQI mechanism for single-lead ECG that quantifies baseline wander and spectral signal characteristics, providing an efficient early-rejection criterion applicable before more demanding software indices [12]. Machine learning-based quality classifiers have emerged, trained on expert-annotated datasets to learn quality patterns from combined features [19,20], but these require substantial labeled data and often function as black boxes, limiting interpretability for clinical deployment.
Quality assessment methods have been developed for specific biosignal types beyond ECG. For PPG signals, Elgendi proposed an optimal signal quality index specifically tailored to photoplethysmogram waveform characteristics [22]; Satija et al. provide a comprehensive review of signal processing techniques for ECG signal quality assessment that surveys a broad range of existing approaches [21]. Impedance cardiography quality assessment has focused on dZ/dt morphology and standardised ensemble averaging to reject corrupted cardiac cycles, as outlined in the methodological guidelines by Sherwood et al. [23]. Phonocardiography quality evaluation uses spectral features and heart sound segmentation with probabilistic state-based models [24]. EMG quality assessment emphasises frequency-domain analysis and amplitude distribution, addressing sampling, noise-reduction, and amplitude estimation issues in surface electromyography [25], while EEG quality assessment relies on automatic artifact detection exploiting the joint use of spatial and temporal signal features, as implemented in the ADJUST framework by Mognon et al. [26]. These modality-specific approaches lack a unified framework that could be adapted across different biosignals with common validation logic.
Despite this substantial body of work, critical gaps remain. Most methods provide binary classifications rather than granular quality scores suitable for dataset curation and weighted analysis. Existing approaches lack modularity across biosignal types, requiring complete redesign instead of simple modality-specific adaptations. Validation against expert-labeled ground truth across diverse real-world conditions remains limited, and synchronized IMU and impedance data have not been explicitly formulated as design prerequisites for comprehensive quality validation. This paper addresses these gaps through a modular two-stage architecture with configurable fusion, granular quality scoring, and explicit incorporation of synchronized auxiliary sensor data.
3. Methodology
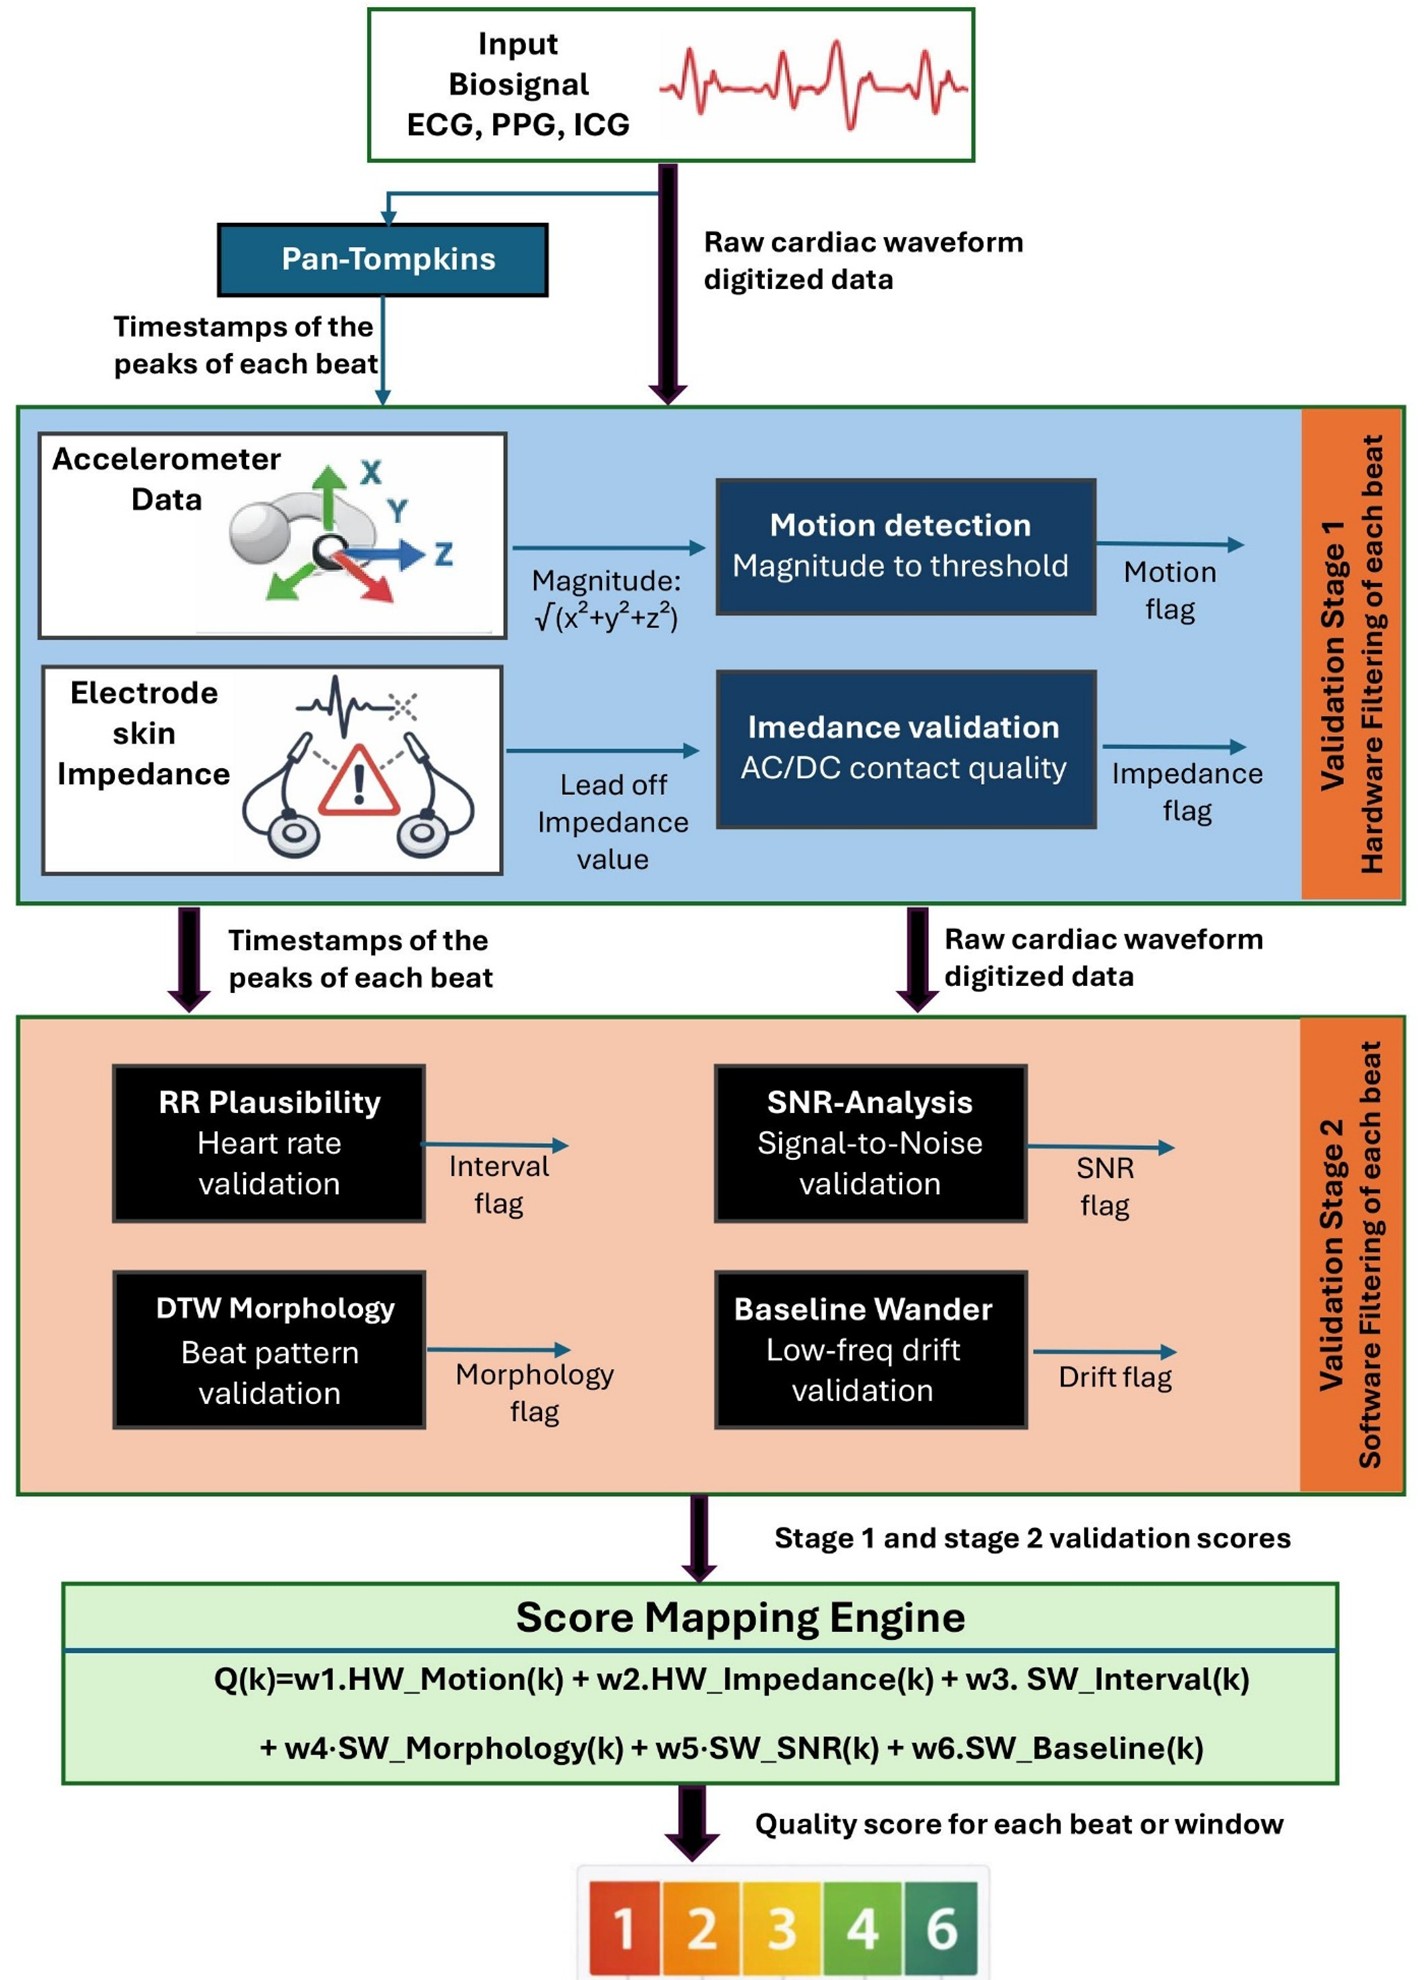
The proposed method is a two-stage signal quality validation framework for real-time and offline assessment of multimodal biosignals, as illustrated in Figure 1. It generates beat-level for cardiac based signals (or segment-level in case of EEG or EMG signals) quality labels ranging from 1 (unusable) to 6 (excellent) by combining hardware-informed gating with software-based signal quality indices. This hybrid architecture enables early rejection of irrecoverably corrupted data while maintaining computational efficiency.
The framework assumes synchronized acquisition of the primary biosignal (e.g., ECG, PPG, or ICG), a three-axis accelerometer (IMU) positioned near the electrodes for motion supervision, and electrode impedance or lead-off status for contact integrity monitoring. All channels are time-aligned at acquisition as described in [1]. Figure 1 summarizes the sequential validation stages applied to each detected beat.
3.1. Initial Preprocessing
As an initial preprocessing step, cardiac beats are segmented using robust fiducial point detection. For ECG signals, R-peaks are identified with the classical Pan–Tompkins QRS detection algorithm [7], which applies bandpass filtering and nonlinear transformations to enhance QRS complexes while suppressing baseline drift and high-frequency noise. The detected R-peak timestamps define consecutive cardiac cycle boundaries, enabling beat-synchronous application of all subsequent hardware- and software-based validation indices.
For PPG and ICG recordings, systolic peaks serve as the primary segmentation landmarks. This approach is motivated by the higher detection reliability of R-peaks and systolic peaks compared with other fiducial features (e.g., P- or T-waves in case of ECG), which often exhibit lower signal-to-noise ratios and greater inter-subject variability. Anchoring quality assessment to these stable landmarks minimizes segmentation error propagation and ensures consistent beat-level evaluation across diverse waveform morphologies and recording conditions.
3.2. Stage I: Hardware Based Sensor Integrity Filtering
3.2.1. Motion Artifact Detection
Motion artifacts are among the most significant sources of signal degradation in wearable biosignal monitoring, particularly for ECG, EEG, ICG and PPG recordings. To enable early rejection of motion-corrupted cardiac cycles, the proposed framework incorporates synchronized tri-axial inertial measurement unit (IMU) data as a hardware-level quality indicator.
Let , , and denote the raw accelerometer channels acquired concurrently with the primary biosignal. As a first preprocessing step, an orientation-independent acceleration magnitude is computed over the entire raw IMU recording:
This transformation provides a scalar motion representation that is robust to sensor rotation and enables consistent motion quantification independent of device orientation as in Figure 2. The green regions indicate stable intervals with minimal motion, corresponding to beats that are likely suitable for further biosignal processing while red regions indicate movement-contaminated intervals, where motion artifacts are expected to degrade biosignal waveform quality.
Following beat segmentation (e.g., using R-peak detection for ECG or the systolic peak detection for PPG and ICG), the acceleration magnitude signal is evaluated within each individual cardiac beat interval.
For the beat window , defined by two consecutive detected peaks, a beat-specific motion index is computed as the variance of the acceleration magnitude during that beat:
This measure reflects the degree of movement or sensor displacement occurring specifically during the acquisition of the corresponding biosignal beat.
Each beat is assigned to a binary hardware motion flag based on a predefined motion threshold which vary depending on the used sensor and sensor placement:
Beats located in the time range of movement exceeding the threshold are marked as unreliable due to the high likelihood of motion-induced artifacts contaminating the waveform morphology.
3.2.2. Electrode Lead-Off Impedance Verification
Intermittent electrode detachment and unstable skin–electrode coupling represent major sources of signal corruption in wearable electrophysiological monitoring. Poor contact conditions introduce abrupt baseline shifts, high impedance noise, and complete signal dropout, which can severely compromise the reliability of downstream feature extraction and diagnostic interpretation. Therefore, the proposed framework incorporates electrode lead-off and impedance monitoring as a second hardware-level validation mechanism.
For surface biopotential recordings such as ECG, EMG, and EEG, electrode contact quality can be assessed through lead-off detection, which determines whether an electrode is properly connected to the skin. Most modern analog front-end (AFE) integrated circuits for electrophysiological sensing (e.g., ECG/EEG/EMG chips) provide built-in lead-off detection functionality, enabling continuous or periodic monitoring of electrode integrity without additional external circuitry.
Lead-off detection is commonly implemented using either DC-based or AC-based impedance measurement techniques. In DC lead-off detection, a small bias current or voltage is applied to the electrode, and the resulting electrode potential is monitored. When the electrode becomes disconnected, the input node saturates toward supply rails, producing a detectable voltage shift. DC methods are computationally simple and are widely used in low-power wearable ECG systems. In contrast, AC lead-off detection injects a small high-frequency test signal (outside the physiological band, e.g., several kHz) and estimates the electrode–skin impedance from the measured response. Because the excitation frequency is separated from the biosignal spectrum, AC methods provide a more robust and physiologically independent estimate of electrode contact quality.
While lead-off detection is naturally available for electrode-based biopotential measurements, modalities such as photoplethysmography (PPG) require alternative strategies.
PPG sensors rely on optical coupling and not electrode contact; therefore, classical impedance lead-off detection is not applicable. Instead, contact quality can be inferred through surrogate indicators such as photodiode DC level monitoring (optical saturation or poor coupling) or perfusion index (pulse amplitude reduction).
In the proposed two-stage validation framework, impedance or lead-off status is evaluated synchronously with each detected beat interval. Beats exhibiting impedance values Z outside an acceptable operating range, or showing abrupt impedance transitions indicative of transient contact loss, are assigned a rejected hardware contact flag:
In case of ECG for instance, the beat is is labeled as “Pass” when the measured electrode lead impedance is within the acceptable range of 5 kΩ to 10 kΩ.
By combining motion-derived IMU gating with impedance-based electrode contact validation, the proposed Stage I hardware filtering ensures that only beats acquired under stable mechanical and electrical conditions are subjected to computationally heavier softwe-based quality indices. This hybrid strategy improves robustness in free-living wearable environments, reduces false acceptance of corrupted beats, and enhances the trustworthiness of biosignal datasets used for AI-driven diagnostics.
3.3. Stage II: Software-Based Signal Quality Index Evaluation
Beyond temporal plausibility constraints, high-quality cardiac biosignals are expected to exhibit consistent beat morphology across successive cardiac cycles. Even when motion artifacts and electrode contact failures are excluded in Stage I, residual waveform corruption may still arise from electromagnetic interference, EMG muscle noise added to ECG, or partial sensor displacement.
Stage II applies a set of complementary software-based signal quality indices (SQIs) directly to the biosignal waveform to assess its physiological consistency, morphological integrity, and noise characteristics.
Depending on the intended application, the input to stage II may consist either of (i) cardiac beats that have successfully passed the Stage I hardware gating in real-time operation, or (ii) the full raw biosignal recording in offline post-processing scenarios where all segments are retained for retrospective inspection. This flexibility enables the framework to support both computationally efficient real-time filtering and comprehensive dataset curation.
3.3.1. Physiological Plausibility (RR Interval Analysis)
A widely used software-based signal quality indicator for cardiac biosignals is the analysis of beat-to-beat interval consistency. Physiological plausibility constraints on peak-to-peak intervals and R-peak amplitude stability have been employed in multiple prior works to detect spurious peak detections and artifact-contaminated segments, particularly R to R times and amplitudes in ECG monitoring and wearable quality assessment pipelines (e.g., Orphanidou et al.). Such approaches rely on the observation that under stable physiological conditions, successive RR intervals evolve smoothly, whereas abrupt deviations are often caused by motion artifacts, noise-triggered false peaks, or missed detections.
Figure 3 illustrates the heart rate trajectories derived simultaneously from the recorded ECG, ICG, and PPG signals. All three modalities exhibit comparable heart rate trends over time, confirming the consistency of the synchronized multimodal acquisition. Minor deviations between the sensor-derived heart rate estimates are primarily attributable to modality-specific noise and transient recording artifacts, which affects peak detection accuracy in individual channels during wearable measurements.
R-Peak Period Stability Assessment
Following peak detection (e.g., Pan–Tompkins for ECG or systolic peak detection for PPG/ICG), the RR interval of the -th beat is computed as:
where denotes the timestamp of the current peak detected. To assess plausibility, the current interval is compared against a short-term reference distribution derived from a moving window of recent valid RR intervals. Let denote the median value within this window. A beat is considered physiologically implausible if:
- the RR interval falls outside predefined physiological bounds (e.g., 50bpm to 250bpm), or
- the deviation from the recent R-R median exceeds a relative tolerance threshold.
The resulting physiological quality flag is defined as:
The RR interval–based plausibility metric is specific to beat-structured cardiac signals and is not applicable to non-cardiac biosignals such as EEG, EMG, or EOG, where no meaningful beat-to-beat timing exists
R-Peak Amplitude Stability Assessment
Let denote the amplitude of the detected R-peak corresponding to beat . R-peak amplitude variations beyond expected physiological limits may indicate transient electrode detachment or motion-induced contact instability.
For each beat, the detected R-peak amplitude is compared against a short-term reference distribution derived from a sliding window of previously accepted beats. Let denote the median R-peak amplitude within this reference window. A beat is considered amplitude-plausible if lies within predefined physiological amplitude bounds, and the deviation from the reference median does not exceed a predefined relative tolerance threshold.
Formally, the amplitude-based physiological plausibility flag is defined as:
where represents an empirically calibrated tolerance parameter reflecting acceptable amplitude variability.
3.3.2. Morphological Consistency Using Multi Directional DTW Pattern Matching
Beyond temporal plausibility constraints, high-quality cardiac biosignals are expected to exhibit consistent waveform morphology across successive cardiac cycles. This validation step is particularly meaningful for beat-structured periodic biosignals, where each cardiac cycle contains characteristic waveform components that can be compared against an expected physiological template.
Morphological similarity is quantified using Dynamic Time Warping (DTW), a well-established alignment technique that measures the distance between two time-series sequences while allowing non-linear temporal stretching and compression. Unlike pointwise Euclidean distance or correlation-based measures, DTW is robust to small variations in beat duration and local temporal shifts, which commonly occur in wearable physiological recordings due to heart rate variability or sensor sampling jitter.
Moreover, Dynamic Time Warping (DTW) was selected for morphological validation instead of cross-correlation, since cardiac beat timing naturally varies due to local stretching and compression, and DTW provides robust alignment under such temporal variability.
Figure 4 illustrates a “pass” example of DTW-based beat-to-template validation. The candidate beat waveform is aligned to a reference template through an optimal warping path, and the resulting DTW cost matrix provides an interpretable representation of morphological similarity. A near-linear warping trajectory within the matrix indicates strong waveform consistency, whereas irregular deviations from the diagonal as in Figure 5 suggest distortion or artifact contamination.
Given a candidate beat waveform and a reference template , DTW computes an optimal alignment path that minimizes the accumulated cost:
where denotes the warping path between both sequences.
In the proposed framework, reference templates are constructed adaptively using a running average of previously accepted high-quality beats. For ECG signals, rhythm-specific templates (e.g., sinus rhythm, premature ventricular contractions, ventricular tachycardia, ventricular fibrillation) may also be incorporated to avoid penalizing clinically meaningful morphological variations.
To further enhance robustness, the statistical distribution of DTW distances is analyzed across consecutive beats. Specifically, the mean and standard deviation of the accumulated DTW cost values are computed to assess the stability and linearity of the warping path within the cost matrix. Under normal physiological conditions, morphologically consistent beats produce DTW distances with low variance, yielding a compact distribution around the mean as in Figure 4. In contrast, artifact-corrupted beats introduce irregular alignment paths and nonlinear deviations, resulting in increased standard deviation as in Figure 5.
Accordingly, a beat is classified as morphologically inconsistent if its DTW distance deviates significantly from the expected distribution:
where is an empirically calibrated tolerance parameter.
Finally, a beat is accepted as morphologically consistent if its DTW similarity score satisfies the predefined morphology threshold:
where represents the morphology acceptance threshold.
This beat-level morphology flag provides an interpretable indicator of waveform integrity and supports rejection of subtle distortions that may not be captured through hardware gating alone.
DTW-based morphological validation is primarily suited for cardiac pulse-like biosignals (ECG, PPG, ICG), where individual beats form meaningful repeatable units. For non-beat-centric biosignals such as EMG or EEG, waveform morphology is not strictly repetitive and therefore template-based DTW validation is less appropriate.
3.3.3. Signal-to-Noise Ratio (SNR)
While heart rate and morphological plausibility metrics assess the structural consistency of individual cardiac cycles, signal quality is also strongly influenced by broadband noise contamination. The signal-to-noise ratio (SNR) based validation in frequency-domain is an excellent quality assessment that has been widely adopted in biosignal validation literature, particularly for ambulatory ECG and PPG recordings, where spectral power characteristics provide robust discrimination between clean physiological activity and artifact-dominated segments.
In the proposed framework, frequency-domain SNR and baseline wander metrics were selected instead of wavelet-based methods due to their substantially lower computational complexity, enabling efficient real-time implementation on resource-constrained wearable platforms. Furthermore, SNR-based evaluation was preferred over zero-crossing analysis because beat-structured biosignals such as ECG, PPG, and ICG exhibit well-defined spectral characteristics, allowing physiologically meaningful band separation. In contrast, zero-crossing methods ignore signal magnitude information and are highly sensitive to baseline wander, which can significantly distort crossing counts and reduce reliability in ambulatory recordings.
For each detected beat window , the power spectral density (PSD) is estimated using standard Fourier-based approaches, such as Welch’s method with a Hann window. The spectral energy is then separated into a physiological signal band and a noise-dominated band. Specifically, the signal power is computed by integrating the PSD over the dominant cardiac frequency range:
In contrast, the noise power is estimated by integrating over an out-of-band region dominated by high-frequency artifacts:
The beat-level SNR is then defined as:
Higher SNR values correspond to cleaner beats with well-preserved morphology, whereas low SNR values indicate significant noise contamination.
To support interpretable quality scoring, the SNR value is converted into a binary software quality flag:
where is a calibrated threshold (e.g., 10 dB), depending on modality and application requirements.
Typical interpretations are:
- 20–50 dB: clinical-grade, high-quality signal
- 10–20 dB: acceptable quality for monitoring
- 0–10 dB: noisy waveform with reduced diagnostic reliability
The SNR evaluation provides an additional beat-level indicator of waveform fidelity and contributes to the final weighted global quality score.
3.3.4. Baseline Wander Assessment
In addition to high-frequency noise contamination, wearable cardiac biosignals are frequently affected by low-frequency baseline distortions. Baseline wander is primarily caused by respiration, slow body movements, electrode polarization effects, and gradual sensor displacement. Such drift can significantly distort waveform morphology, reduce the reliability of peak detection, and bias downstream feature extraction.
Following the baseline SQI concept implemented quality framework [12] (based on Zhao et al.), baseline wander is quantified in the frequency domain by measuring the relative contribution of very-low-frequency e.g., 0 to 0.5Hz spectral power. For each detected beat window , the power spectral density is estimated using Welch’s method. The baseline power is then computed by integrating the PSD over the baseline drift band:
This frequency range captures slow oscillations and drift components that are not part of the physiological cardiac waveform. In parallel, the total physiological signal power is computed over the main ECG bandwidth:
The baseline signal quality index is then defined as the normalized baseline-relative power:
This formulation yields values close to 1 for signals with minimal baseline drift, while lower values indicate increasing dominance of baseline wander.
To support interpretable beat-level quality scoring, the baseline SQI is converted into a binary validation flag:
where is a calibrated threshold depending on modality and application constraints.
Figure 6 shows the results of the baseline wander quality assessment. The left panel shows an ECG segment with detected beat landmarks and baseline drift. The right panel presents the corresponding baseline quality factor, which remains high during stable periods and drops sharply as low-frequency baseline wander dominates the signal, indicating degraded beat quality.
3.4. Global Quality Factor Computation
To obtain a unified measure of beat-level signal integrity, the hardware- and software-derived validation flags are fused into a single global quality score.
For each detected beat , the framework generates binary indicators from:
Stage I (Hardware):
Stage II (Software):
These indicators are combined using a weighted linear model:
where represents the corresponding validation flag and are normalized weighting coefficients reflecting the relative importance of each quality dimension.
Weights may be adapted according to the application (e.g., diagnostic interpretation, HRV analysis, dataset filtering), signal modality (beat-structured vs. non-beat signals), and computational constraints (real-time vs. offline processing).
The continuous score is mapped to an ordinal scale from 1 (unusable) to 6 (excellent), providing an interpretable and standardized beat-level quality label for real-time artifact rejection and offline dataset curation.
4. Data Acquisition and Experimental Protocol
All biosignal recordings analyzed in this study were acquired using the smart textile wearable monitoring system described in [1], which enables synchronous high-resolution multimodal cardiovascular sensing under realistic wearable conditions. The platform was configured to simultaneously record 12-lead ECG with integrated AC-based electrode lead-off detection, impedance cardiography (ICG), photoplethysmography (PPG), and inertial measurement unit (IMU) signals for motion supervision and many other cardiac diagnostic related signals. All modalities were sampled synchronously at 1 kHz, ensuring precise beat-level alignment across channels.
A dedicated multimodal dataset was collected from 20 different participants (13 males and 7 females) without cardiac disorders to capture inter-subject variability in waveform morphology and artifact conditions. All data were securely stored via the Fraunhofer IZM OwnCloud infrastructure for offline analysis.
All procedures were approved by the Ethics Committee of the Department of Psychology and Ergonomics at Technical University of Berlin, and the study was classified as ethically unobjectionable under Tracking Number: 2865545.
Cardiac cycles were segmented using detected peak timestamps (Lead II R-peaks for ECG). Each extracted ECG beat was manually annotated as Pass (physiologically interpretable waveform with minimal artifacts) or Fail (corrupted by motion, electrode detachment, noise, or baseline drift). These annotations served as the ground truth for evaluating the proposed two-stage quality validation framework.
Across all datasets, a total of 8644 were analyzed, comprising 6153 Pass beats [71%] and 2491 Fail beats [29%], reflecting the natural class imbalance typical in wearable monitoring environments as in Figure 7.
5. Results
The behavior of the four-software implemented SQI components during a representative ECG segment containing clean and motion-corrupted intervals (red shaded regions) is illustrated in Figure 8. The ECG waveform remains stable during the clean period, while significant distortion and variability appear in the poor-quality segment. The SNR metric captures increased high-frequency noise, DTW reflects reduced morphological consistency, baseline assessment identifies low-frequency drift, and the R–R plausibility check detects irregular beat intervals caused by artifact-related misdetections.
Table 1 presents the statistical summary of accuracy of all stages across the 20 ECG datasets.
The motion flag achieved 84.32% ± 2.71% accuracy (range: 80.00%–89.78%), while the impedance flag demonstrated 77.82% ± 5.38% accuracy (range: 68.55%–85.97%). These hardware-level indicators enable early rejection of severely corrupted beats, reducing computational burden for downstream processing.
The RR interval plausibility flag achieved 74.52% ± 3.70% with the lowest inter-dataset variability. The DTW morphology flag demonstrated the highest individual accuracy of 90.24% ± 2.06% (Figure 4 and Figure 5 show representative DTW alignments). The SNR flag achieved 82.14% ± 3.25% accuracy, and the baseline wander flag demonstrated 85.83% ± 1.63% accuracy.
Integration of all six validation indices through weighted fusion produced substantially superior performance compared to individual metrics. The global framework achieved 98.13% ± 1.57% mean accuracy (range: 93.68%–100%), representing a 7.89 percentage point improvement over the best individual metric (DTW morphology). 25% of the datasets 20 achieved perfect 100% accuracy. Figure 9 summarizes the comprehensive performance metrics and presents detailed visualizations of accuracy distributions.
The validation framework was evaluated using standard classification performance metrics including accuracy, sensitivity (recall), specificity, precision (positive predictive value), and F1-score. For each dataset, beats were classified as true positives (Tp: correctly identified acceptable beats), true negatives (Tn: correctly identified unacceptable beats), false positives (Fp: unacceptable beats incorrectly classified as acceptable), and false negatives (Fn: acceptable beats incorrectly classified as unacceptable). Performance metrics were computed individually for the six quality indices to evaluate the global validation outcome after sequential application of both validation stages as in Figure 10 and the histogram in Figure 11.
The framework demonstrated high sensitivity (98.81%), ensuring minimal rejection of valid beats, and strong specificity (96.70%), confirming robust identification of corrupted beats. The narrow standard deviation indicates consistent performance across diverse participants and recording conditions.
Figure 12 presents the aggregated confusion matrix. Across all 8644 beats, the framework achieved 6024 true positives, 2462 true negatives, 91 false positives, and 67 false negatives.
These results validate the two-stage hybrid architecture’s effectiveness. The synergistic integration of hardware and software validation indices achieved high performance (98.13% accuracy), substantially outperforming individual metrics while maintaining low false positive rates essential for high-quality AI training dataset curation.
6. Performance Comparison with State-of-the-Art Methods
The proposed framework’s performance was compared against six benchmark ECG signal quality assessment methods evaluated by Fotsing Kuetche et al. (2023), including simple heuristic rules, machine learning (SVM), and deep learning approaches (CNN, LSTM).

Table 2.
Performance Comparison.
| Method | Evaluation | Sensitivity (%) | Specificity (%) | Accuracy (%) |
| Orphanidou (2015) | Set of Rules +average template matching | 99.70 | 57.94 | 79.41 |
| Behar (2013) | SVM | 77.34 | 69.20 | 77.37 |
| Liu (2019) | SVM | 99.36 | 86.10 | 94.17 |
| Zhou (2018) | CNN | 89.02 | 85.23 | 89.12 |
| Fu (2021) | LSTM | 97.19 | 76.42 | 86.90 |
| Fotsing Kuetche (2023) | Set of Rules + beats correlation and clustering | 94.59 | 98.38 | 97.10 |
| Basel Adams (2026) | Sensor Fusion and Software Indices | 98.81 | 96.70 | 98.13 |
The proposed framework achieved competitive results to the best of the state-of-the-art with overall accuracy (98.13%) among all methods evaluated as presented in Figure 13. Compared to the Fotsing Kuetche et al. baseline, the framework demonstrated +4.22 percentage points improvement in sensitivity (98.81% vs. 94.59%) while maintaining competitive specificity (96.70% vs. 98.38%). The framework achieved optimal sensitivity-specificity balance, avoiding the tradeoff observed in existing methods where high sensitivity (Orphanidou: 99.70%, Liu: 99.36%) corresponds to substantially lower specificity (57.94% and 86.10%, respectively).
The framework outperformed machine learning methods (Behar: 77.37%, Liu: 94.17%) and deep learning approaches (Zhou: 89.12%, Fu: 86.90%) by 3.96–20.76 percentage points in overall accuracy.
7. Discussion
The experimental validation demonstrates that the proposed two-stage hybrid framework achieves better results than state-of-the-art performance with 98.13% accuracy, 98.81% sensitivity, and 96.70% specificity.
A critical implementation requirement is the synchronized acquisition of IMU and electrode impedance data alongside the biosignal. The IMU sensor must be positioned near the electrodes to accurately detect motion artifacts, and impedance measurement capability is necessary to monitor electrode-skin contact integrity. This hardware prerequisite may not be satisfied by legacy ECG recording systems or minimalist wearable devices lacking auxiliary sensors. For such systems, the framework can operate in software-only mode by bypassing Stage I validation, though with reduced performance. The modular architecture enables graceful degradation when hardware signals are unavailable.
In real-time filtering or validation deployments, it is strongly recommended to forward only beats that successfully pass Stage I hardware gating to Stage II software-based analysis. This strategy provides hard rejection of severely corrupted segments (motion artifacts, electrode detachment) before computationally intensive software validation, substantially reducing processing burden. For resource-constrained wearable platforms, this two-stage filtering approach enables practical real-time implementation by avoiding unnecessary DTW alignment and frequency-domain analysis on fundamentally unusable beats.
The computational complexity of frequency-domain SNR analysis and DTW-based morphology assessment may challenge real-time implementation on resource-constrained embedded processors. While Stage I hardware gating substantially reduces the number of beats requiring exhaustive Stage II analysis, optimization through efficient FFT implementations, approximate DTW algorithms, or dedicated hardware acceleration may be necessary for deployment on ultra-low-power wearable platforms. The modular architecture enables selective disabling computationally expensive indices for latency-critical applications where reduced accuracy is acceptable in exchange for lower processing requirements.
Pathological cardiac rhythms, including atrial fibrillation, premature ventricular contractions (PVCs), ventricular tachycardia, and other conduction abnormalities, inherently exhibit irregular R–R intervals. Applying strict interval-based plausibility thresholds in such contexts would risk rejecting clinically meaningful arrhythmic events and biasing subsequent diagnostic analysis. Therefore, in arrhythmia-oriented applications, R–R interval–based rejection criteria are disabled within the signal quality framework. Instead, physiological plausibility validation is restricted to the evaluation of R-peak amplitude stability, which reflects signal integrity without penalizing pathological rhythm dynamics. Similarly, RR interval and amplitudes analysis is not applicable to non-cardiac biosignals such as EMG or EEG, where beat-to-beat interval concepts are undefined.
DTW-based morphological validation is primarily suited for cardiac pulse-like biosignals (ECG, PPG, ICG), where individual beats form meaningful repeatable units. For non-beat-centric biosignals such as EMG or EEG, waveform morphology is not strictly repetitive on a beat-by-beat basis and may exhibit complex nonstationary dynamics. In such cases, template-based DTW validation should be skipped or replaced with modality-specific artifact detection techniques (e.g., spectral quality metrics, independent component analysis, or event-based segmentation). Furthermore, when the validated data will be used for rhythm detection or classification, it is essential to include templates for all possible cardiac rhythms in the multi-dimensional DTW analysis to avoid false rejection of valid pathological waveforms as corrupted beats.
The validation dataset consisted exclusively of healthy participants without known cardiac pathology. While this population exhibits diverse physiological variability and artifact conditions representative of free-living monitoring, prospective validation on patient populations with structural heart disease, conduction abnormalities, or implanted cardiac devices would strengthen generalizability claims. The narrow inter-dataset performance variability (SD = 1.57%) suggests robust generalization, but clinical validation remains necessary before deployment in diagnostic applications. Furthermore, comprehensive cross-validation on external open-access datasets remains limited, as no publicly available repositories currently provide biosignal recordings synchronously acquired with both IMU motion data and electrode impedance/lead-off measurements.
Despite these limitations, the proposed framework successfully addresses fundamental challenges in biosignal quality assessment by achieving optimal sensitivity-specificity balance. The modular two-stage architecture enables application-specific customization while maintaining interpretable validation logic suitable for both real-time monitoring and offline dataset curation.
8. Conclusions
This paper presents a two-stage hybrid signal quality validation framework that integrates hardware-based sensor integrity gating with multi-dimensional software quality assessment for multimodal biosignal monitoring. Unlike prior software-only or modality-specific approaches, the proposed architecture employs synchronized IMU and electrode impedance measurements as prerequisite gating mechanisms before applying computationally intensive software validation, enabling early rejection of irrecoverably corrupted beats while maintaining process efficiency.
Validation on 8,644 expert-annotated cardiac beats from 20 participants demonstrated state-of-the-art performance: 98.13% accuracy, 98.81% sensitivity, and 96.70% specificity. The framework achieved optimal sensitivity-specificity balance compared to six benchmark methods, with superior generalization (SD = 1.57%) and critically low false positive rate (1.05%), ensuring high-purity dataset curation for AI model training. The synergistic integration of complementary validation stages produced 7.89 percentage point improvement over the best individual metric, confirming that hardware and software quality indicators capture orthogonal aspects of signal corruption.
Future work will focus on three directions. First, extension to additional biosignal modalities (EMG, EEG, PCG, respiration) to validate the framework’s modularity across non-cardiac periodic signals. Second, machine learning-based optimization of weight parameters and quality thresholds using supervised learning methods (SVM, Random Forest) and neural networks (CNN, LSTM, GRU) trained on expert-annotated datasets, potentially improving discrimination while maintaining interpretability. Third, prospective clinical validation on patient populations with documented cardiac pathology to establish generalization across the full spectrum of cardiovascular disease. In addition, Future work will extend the proposed validation framework by incorporating additional statistical signal quality measures, including kurtosis, skewness, and entropy-based indices, to further enhance robustness against diverse artifact conditions.
The proposed framework provides a robust, interpretable, and computationally efficient solution for both real-time wearable monitoring and offline dataset curation, with direct implications for improving diagnostic accuracy, reducing false alarms in continuous cardiovascular monitoring, and provides a mechanism to improve dataset quality for downstream AI models.
Institutional Review Board Statement
All experimental procedures were approved by the Ethics Committee of the Department of Psychology and Ergonomics at Technical University of Berlin and classified as ethically unobjectionable (Tracking Number: 2865545).
Acknowledgments
The author gratefully acknowledges Prof. Dr. Marc Kraft, Dr. Andreas Ostmann, Lukas Werft, Cherry Blossom Garcia, Mervin Julio, and Isabeau Lazik from Fraunhofer IZM and Technische Universität Berlin for their invaluable support and contributions to this work. The author also acknowledge the use of AI language models (DeepL, ChatGPT, Claude AI, and Gemini) for preliminary language editing and grammatical corrections during manuscript preparation.
Conflicts of Interest
This research was conducted as part of doctoral thesis work and did not receive any specific grant from funding agencies in the public, commercial, or non-profit sectors. The authors declare no competing financial interests or personal relationships that could have influenced the work reported in this paper.
References
- Adams, B; Dils, C.L. AI-Enhanced Smart Textile System for the Monitoring of Cardiovascular Insufficiency. 2024 IEEE 10th Electronics System-Integration Technology Conference, 2025. [Google Scholar] [CrossRef]
- Poon, C. C.; Zhang, Y. T. Cuff-less and noninvasive measurements of arterial blood pressure by pulse transit time. IEEE Engineering in Medicine and Biology Magazine 2005, 24(5), 20–27. [Google Scholar]
- Tong, D. A.; Bartels, K. A.; Honeyager, K. S. Adaptive reduction of motion artifact in the electrocardiogram. IEEE Transactions on Biomedical Engineering 2002, 49(9), 1085–1088. [Google Scholar]
- Liu, S. H.; Cheng, D. C.; Lin, C. M. Arrhythmia identification with two-lead electrocardiograms using artificial neural networks and support vector machines for a portable ECG monitor system. Sensors 2013, 13(1), 813–828. [Google Scholar] [CrossRef] [PubMed]
- Medical Instrumentation: Application and Design, 4th ed.; Webster, J. G., Ed.; John Wiley & Sons, 2009. [Google Scholar]
- Meziane, N.; Webster, J. G.; Attari, M.; Nimunkar, A. J. Dry electrodes for electrocardiography. Physiological Measurement 2013, 34(9), R47–R69. [Google Scholar] [CrossRef]
- Pan, J.; Tompkins, W. J. A real-time QRS detection algorithm. IEEE Transactions on Biomedical Engineering 1985, BME-32(3), 230–236. [Google Scholar] [CrossRef] [PubMed]
- Clifford, G. D.; Behar, J.; Li, Q.; Rezek, I. Signal quality indices and data fusion for determining clinical acceptability of electrocardiograms. Physiological Measurement 2012, 33(9), 1419–1433. [Google Scholar] [CrossRef] [PubMed]
- Moody, G. B.; Mark, R. G. QRS morphology representation and noise estimation using the Karhunen-Loeve transform. In Computers in Cardiology; 1989; pp. 269–272. [Google Scholar]
- Hayn, D.; Kollmann, A.; Schreier, G. Automated quality evaluation of ECG using morphology-based features. In Computers in Cardiology; 2008; pp. 661–664. [Google Scholar]
- Krasteva, V.; Jekova, I.; Leber, R.; Schmid, R.; Abächerli, R. Real-time arrhythmia detection with supplementary ECG quality and pulse wave monitoring for the reduction of false alarms in ICUs. Physiological Measurement 2016, 37(8), 1273–1297. [Google Scholar] [CrossRef]
- Zhao, Z.; Zhang, Y. SQI quality evaluation mechanism of single-lead ECG signal based on simple statistics. Computer Methods and Programs in Biomedicine 2005, 125, 135–145. [Google Scholar]
- Spicher, N.; Kukuk, M. Delineation of electrocardiograms using multiscale parameter estimation. IEEE Journal of Biomedical and Health Informatics 2015, 19(4), 1224–1234. [Google Scholar] [CrossRef]
- Li, Q.; Mark, R. G.; Clifford, G. D. Robust heart rate estimation from multiple asynchronous noisy sources using signal quality indices and a Kalman filter. Physiological Measurement 2008, 29(1), 15–32. [Google Scholar] [CrossRef] [PubMed]
- Johannesen, L.; Vicente, J.; Gray, R. A.; Galeotti, L.; Loring, Z.; Garnett, C. E.; Strauss, D. G. Improving the assessment of heart rate variability in drug safety studies. Clinical Pharmacology & Therapeutics 2014, 96(3), 372–374. [Google Scholar]
- Li, Q.; Clifford, G. D. Dynamic time warping and machine learning for signal quality assessment of pulsatile signals. Physiological Measurement 2012, 33(9), 1491–1501. [Google Scholar] [CrossRef]
- Orphanidou, C.; Bonnici, T.; Charlton, P.; Clifton, D.; Vallance, D.; Tarassenko, L. Signal-quality indices for the electrocardiogram and photoplethysmogram: Derivation and applications to wireless monitoring. IEEE Journal of Biomedical and Health Informatics 2015, 19(3), 832–838. [Google Scholar] [CrossRef]
- Choi, A.; Shin, H.; Kim, J. Quantifying the physiological response during rest-to-exercise transition using time-varying heart rate variability indices. In Computing in Cardiology; 2011; pp. 613–616. [Google Scholar]
- Gradl, S.; Kugler, P.; Lohmann, C.; Eskofier, B. M. Real-time ECG monitoring and arrhythmia detection using Android-based mobile devices. Annual International Conference of the IEEE Engineering in Medicine and Biology Society, 2012; pp. 2452–2455. [Google Scholar]
- Smital, L.; Vítek, M.; Kozumplík, J.; Provazník, I. Adaptive wavelet Wiener filtering of ECG signals. IEEE Transactions on Biomedical Engineering 2013, 60(2), 437–445. [Google Scholar] [CrossRef]
- Satija, U.; Ramkumar, B.; Manikandan, M. S. A review of signal processing techniques for electrocardiogram signal quality assessment. IEEE Reviews in Biomedical Engineering 2018, 11, 36–52. [Google Scholar] [CrossRef] [PubMed]
- Elgendi, M. Optimal signal quality index for photoplethysmogram signals. Bioengineering 2016, 3(4), 21. [Google Scholar] [CrossRef]
- Sukor, J. A.; Redmond, S. J.; Lovell, N. H. Signal quality measures for pulse oximetry through waveform morphology analysis. Physiological Measurement 2011, 32(3), 369–384. [Google Scholar] [CrossRef] [PubMed]
- Sherwood, A.; Allen, M. T.; Fahrenberg, J.; Kelsey, R. M.; Lovallo, W. R.; Van Doornen, L. J. Methodological guidelines for impedance cardiography. Psychophysiology 1990, 27(1), 1–23. [Google Scholar] [CrossRef]
- Springer, D. B.; Tarassenko, L.; Clifford, G. D. Logistic regression-HSMM-based heart sound segmentation. IEEE Transactions on Biomedical Engineering 2016, 63(4), 822–832. [Google Scholar] [CrossRef] [PubMed]
- Clancy, E. A.; Morin, E. L.; Merletti, R. Sampling, noise-reduction and amplitude estimation issues in surface electromyography. Journal of Electromyography and Kinesiology 2002, 12(1), 1–16. [Google Scholar] [CrossRef]
- Li, Q.; Clifford, G. D. Dynamic time warping and machine learning for signal quality assessment of pulsatile signals. Physiological Measurement 2012, vol. 33(no. 9), 1491–1501. [Google Scholar] [CrossRef] [PubMed]
Figure 1.
Two-stage biosignal quality assessment framework.

Figure 2.
IMU-based motion detection module.

Figure 3.
Heart rate is estimated simultaneously from ECG, ICG and PPG recordings. The red ranges indicate areas of fast heart rate variability, which is related to poor signal quality.
Figure 3.
Heart rate is estimated simultaneously from ECG, ICG and PPG recordings. The red ranges indicate areas of fast heart rate variability, which is related to poor signal quality.

Figure 4.
DTW-based morphological ECG beat-to-template comparison, showing strong alignment with the reference waveform.
Figure 4.
DTW-based morphological ECG beat-to-template comparison, showing strong alignment with the reference waveform.

Figure 5.
DTW-based morphological ECG beat-to-template comparison, showing no alignment with the reference waveform.
Figure 5.
DTW-based morphological ECG beat-to-template comparison, showing no alignment with the reference waveform.

Figure 6.
shows baseline wander quality assessment.

Figure 7.
the distribution of annotated beats across sessions.

Figure 8.
Stage II Signal Quality Assessment results.

Figure 9.
Boxplot of the accuracy of each validation step and the final global accuracy.

Figure 10.
Boxplot of performance of the final global accuracy.

Figure 11.
Histogram of the performance matrix of the final global accuracy.

Figure 12.
Global Confusion matrix of the final global accuracy.

Figure 13.
Performance Comparison with State-of-the-Art Methods.

Table 1.
Performance Statistics for all stages.
|
Accuracy Metric |
Mean (%) |
± SD (%) |
Min (%) |
Max (%) |
| Motion Flag | 84.4 | 2.7 | 80 | 90 |
| Impedance Flag | 77.7 | 5.3 | 69 | 86 |
| Interval Flag | 74.8 | 3.8 | 68 | 81 |
| Morphology Flag | 90.4 | 2.2 | 86 | 95 |
| SNR Flag | 82.2 | 3.2 | 77 | 87 |
| Baseline Flag | 85.9 | 1.9 | 83 | 89 |
| Global Validation | 98.1 | 1.5 | 93.6 | 100 |
Disclaimer/Publisher’s Note: The statements, opinions and data contained in all publications are solely those of the individual author(s) and contributor(s) and not of MDPI and/or the editor(s). MDPI and/or the editor(s) disclaim responsibility for any injury to people or property resulting from any ideas, methods, instructions or products referred to in the content. |
© 2026 by the authors. Licensee MDPI, Basel, Switzerland. This article is an open access article distributed under the terms and conditions of the Creative Commons Attribution (CC BY) license (http://creativecommons.org/licenses/by/4.0/).
Copyright: This open access article is published under a Creative Commons CC BY 4.0 license, which permit the free download, distribution, and reuse, provided that the author and preprint are cited in any reuse.


