Submitted:
02 April 2026
Posted:
03 April 2026
You are already at the latest version
Abstract
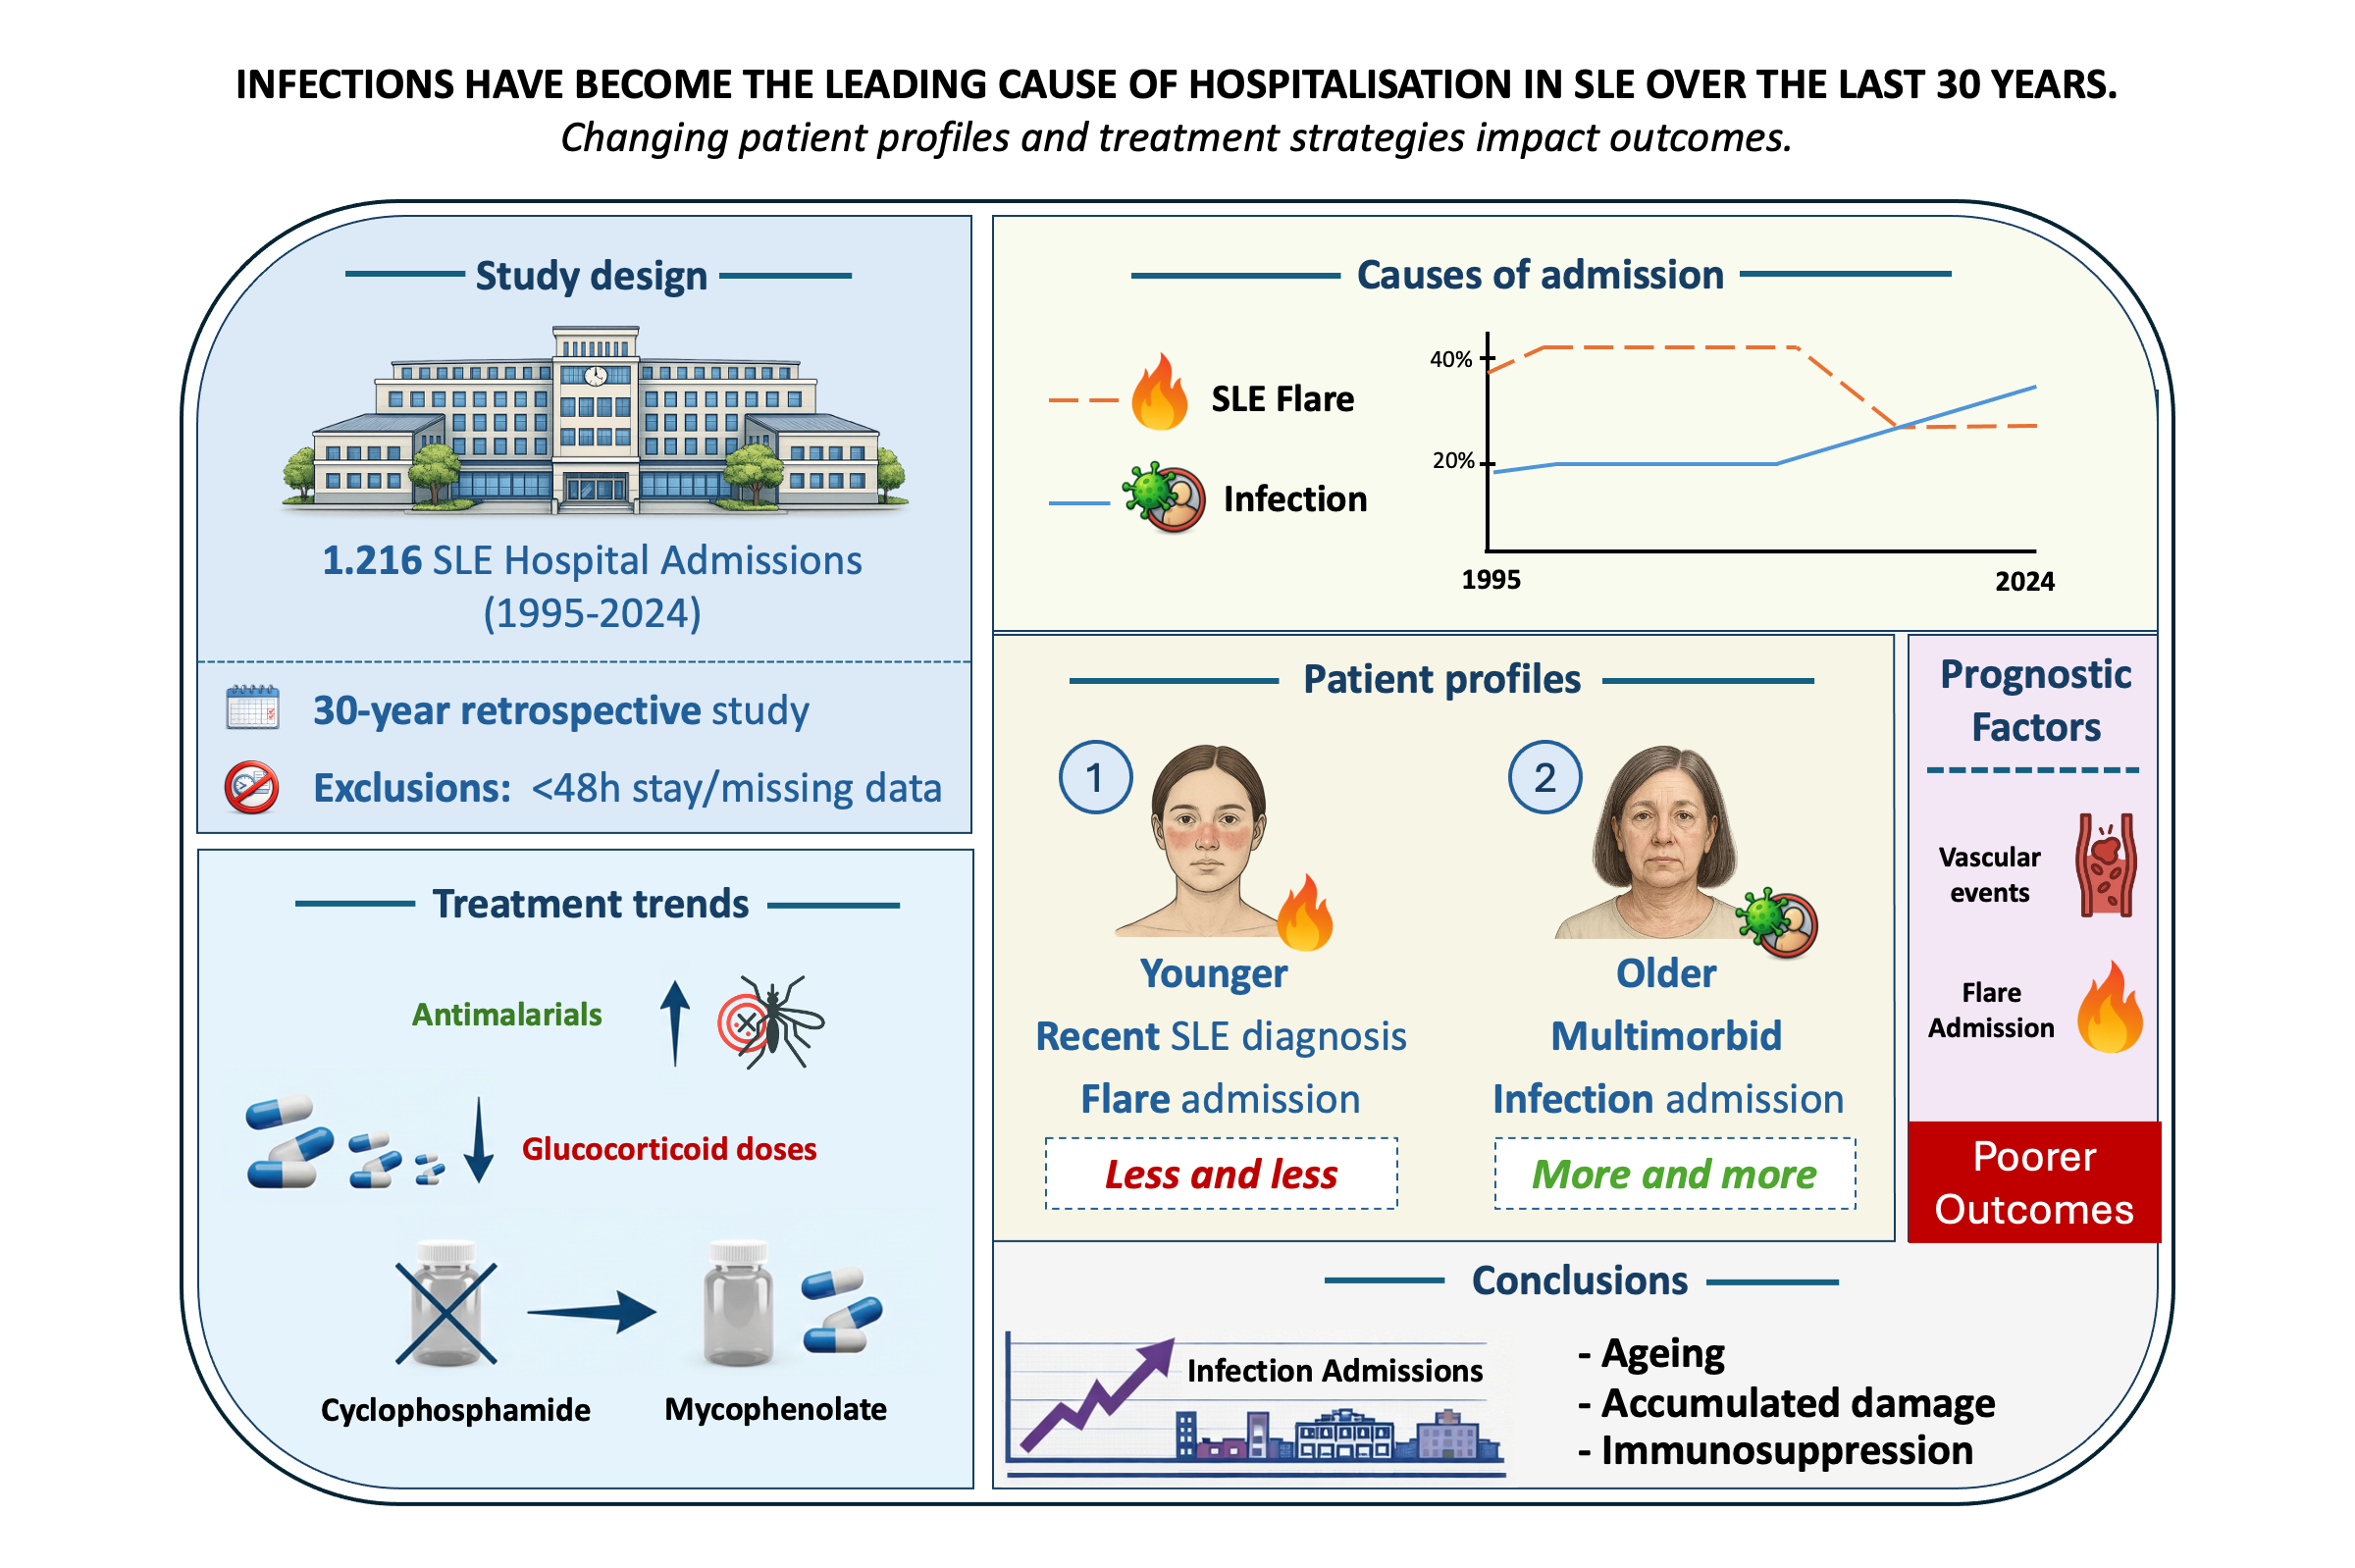
Background/Objectives: To analyse the causes, characteristics, and outcomes of hospital admissions in patients with systemic lupus erythematosus (SLE) over a 30-year period in a tertiary referral centre in Catalonia, and to evaluate temporal trends and prognostic factors associated with adverse outcomes. Methods: A retrospective observational study was conducted including all SLE patients admitted to the Department of Autoimmune Diseases at Hospital Clínic de Barcelona between June 1995 and December 2024. Admissions lasting less than 48 hours or lacking clinical documentation were excluded. Variables analysed included demographics, disease duration, comorbidities, cause of admission, treatments, and outcomes. A composite outcome was defined as intensive care unit (ICU) admission, 30-day readmission, or prolonged hospital stay. Statistical analyses included univariate and multivariate regression models. Results: Among the 1,216 hospital admissions, SLE flares and infections were the most frequent causes. Over the study period, admissions due to infections increased significantly and, in the last five years, exceeded those related to disease flares (33.7% vs. 26.1%). Patients hospitalized for flares were younger and had a shorter disease duration, whereas infection-related admissions were more common among older patients, those with overlap syndromes, and those with higher damage scores. Vascular events and SLE flares were independently associated with poorer outcomes. Although antimalarial use increased over time, it remained suboptimal, largely due to drug toxicity and newly diagnosed cases (from 45.2% to 69.7%; p< 0.001). Treatment strategies also evolved, with a shift toward lower gluco-corticoid doses (from 14.5% to 38.3%; p< 0.001), and mycophenolate mofetil replacing cyclophosphamide as the preferred immunosuppressive agent. Conclusions: Hospitalisation patterns in SLE have shifted over time, with infections emerging as the leading cause of admission. This trend reflects an evolving patient profile characterized by older age, greater accumulated damage, comorbidities, and increased exposure to immunosuppressive therapies. These findings underscore the need for optimized infection prevention strategies and individualized treatment approaches to improve outcomes in contemporary SLE care.
Keywords:
flare
; hospitalisation
; infection
; systemic lupus erythematosus
; trends
1. Introduction
Hospitalisations in patients with systemic lupus erythematosus (SLE) reflect inadequate disease control, accumulated organ damage, and a substantial burden of comorbidity [1]. Despite significant advances in diagnosis and therapeutic strategies, SLE continues to impose considerable demands on healthcare systems [2]. Hospital admissions remain frequent and clinically complex, encompassing both disease-related manifestations and complications such as infections, cardiovascular events, and effects of immunosuppressive therapy [3,4,5].
Previous studies from North America [4], Europe [5], and Asia [6,7] have reported annual hospitalisation rates ranging from 9% to 57% among SLE patients. Importantly, a growing proportion of admissions appear to be driven not by active immunological disease alone, but by comorbid conditions, treatment-related complications, and accumulated organ damage. This evolving pattern suggests a shift toward a hospitalised SLE population characterised by lower disease activity but increased clinical vulnerability and long-term complications.
In this context, our group previously analysed 814 hospitalisations in 339 SLE patients admitted to Hospital Clínic de Barcelona between 1995 and 2015, documenting a progressive decline in flare-related admissions alongside an increase in infection-related hospitalisations and damage accrual [8]. These findings were consistent with national-level data reported by Moreno-Torres et al. [9], who identified infections as the second leading cause of hospitalisation among SLE patients in Spain and the cause of 25% of all in-hospital deaths. More recently, Pires et al. [10] further highlighted the growing impact of infections and comorbidities on SLE-related hospitalisations.
We hypothesised that these changes reflect evolving disease management paradigms, including reduced glucocorticoid exposure, the implementation of treat-to-target strategies, wider use of immunosuppressive and biologic therapies, and organisational innovations such as day hospital care for mild-to-moderate flares. As these approaches have become increasingly consolidated over the past decade, it is necessary to reassess whether the trends previously observed at our centre have persisted, stabilised, or further evolved.
Therefore, the present study extends our earlier work by analysing hospitalisations among SLE patients at a tertiary referral centre in Catalonia, Spain over a 30-year period (1995-2024). We aimed to characterise the causes and clinical features of admissions, evaluate temporal trends in hospitalisation patterns and outcomes across consecutive 5-year intervals, and identify prognostic factors associated with adverse inpatient outcomes, with the ultimate goal of improving risk stratification and inpatient care in contemporary SLE.
2. Materials and Methods
2.1. Study Design and Patient Selection
Patients were identified from the hospital’s electronic administrative database, which records discharge diagnoses, by searching for the terms “lupus” or “systemic lupus erythematosus”. Using this approach, we conducted a retrospective observational study including all patients diagnosed with SLE and admitted to the Department of Autoimmune Diseases at Hospital Clínic de Barcelona, a tertiary university hospital, between June 1995 and December 2024. SLE classification was established according to the criteria in use at the time of diagnosis: the 1982 American College of Rheumatology (ACR) criteria [11] and their 1997 revision [12] for patients diagnosed before 2012, the Systemic Lupus International Collaborating Clinics (SLICC) criteria for diagnoses between 2012 and 2019, and the ACR/EULAR 2019 classification criteria [13] thereafter.
Admissions lasting less than 48 hours for intravenous treatment or lacking adequate clinical documentation were excluded. Temporal trends were analysed across the entire study period. To this end, hospitalisations were grouped into consecutive 5-year intervals, enabling the evaluation of changes over time in admission causes, clinical characteristics, treatments, and outcomes.
The study was approved by the Institutional Review Board (protocol HCB/2018/1221, approved January 17, 2019). An informed consent was not required given the long-term study period and the retrospective nature of the study.
2.2. Data Collection and Variables
Collected variables were obtained through a comprehensive review of patients’ medical records and included demographic characteristics, overlap with other autoimmune diseases, comorbidities (including cardiovascular risk factors), newly-diagnosed versus previously established SLE, disease duration (from diagnosis to admission), cause of admission, length of hospital stay, cumulative organ damage assessed using the Systemic Lupus International Collaborating Clinics/American College of Rheumatology Damage Index (SDI) [14], admission to intensive care unit (ICU), hospitalisation outcome, 30-day readmission, and treatments at admission. Glucocorticoid doses were categorized as low (≤5 mg/day), moderate (>5 to ≤30 mg/day), or high (>30 mg/day).
For flare-related admissions, additional variables were collected, including disease activity measured by SLE Disease Activity Index 2000 (SLEDAI-2K) [15], flare type (haematological, mucocutaneous, articular, serositis, renal or neuropsychiatric), and relevant laboratory biomarkers (complement levels and anti-double-stranded DNA antibody titres). Causes of admission were considered mutually exclusive; when more than one potential cause was identified, two investigators (JC and GE) independently reviewed the medical records and reached a consensus.
2.3. Statistical Analysis
Normality of continuous variables was assessed using the Kolmogorov-Smirnov test. For normal distributions, data were described as mean (± standard deviation [SD]). Highly skewed data were summarized using median and interquartile range [IQR], with non-parametric tests applied. Categorical variables were reported as absolute and relative frequencies. Differences across decades were analyzed using chi-square for categorical variables and ANOVA or Kruskal-Wallis for continuous variables, as required.
Regression analysis followed a two-step approach: univariate models identified candidate variables (p<0.2 and clinical relevance), followed by forward multivariate modelling. Collinear or unstable variables were excluded. Results were presented as odds ratios (OR) with 95% confidence intervals (CI); p<0.05 was considered statistically significant.
As previously reported by Pires et al. [9], the low frequency of individual adverse events and the presence of collinearity among outcomes limited the statistical power of separate analyses for in-hospital mortality, intensive care unit (ICU) admission, and 30-day readmission. To overcome this limitation, we constructed a composite outcome capturing severe hospitalisation trajectories, defined by the occurrence of any of the following: (i) ICU admission during the index hospitalisation; (ii) unplanned readmission within 30 days of discharge; or (iii) prolonged hospital stay, defined as a length of stay exceeding the 75th percentile (≥10 days) [16,17,18]. This approach, commonly used in observational studies when no standard clinical threshold is available, allows identification of patients with the most resource-intensive admissions. Although these components reflect partially distinct dimensions of severity, their combination increased the number of events and improved the statistical power of the multivariable analyses. All data were processed using SPSS software, version 29.0.2.0.
3. Results
A total of 1,720 hospital admissions were initially identified. Of these, 504 (29.3%) were excluded: 408 (23.7%) due to short stays for intravenous therapy and 96 (5.5%) due to insufficient clinical documentation. The final analysis included 1,216 admissions involving 500 patients (Figure 1).
3.1. General Characteristics
Among the 1,216 admissions, 87.4% were women. The mean age at admission was 42.4 years (15.6), and the median disease duration was 8 years [3,4,5,6,7,8,9,10,11,12,13,14,15,16,17]. Overlap with other systemic autoimmune diseases was present in one-third of cases. The median SDI at admission was 0 [0-1]. Table 1 summarises the main features of hospitalised SLE patients.
3.2. Causes of Hospital Admission
SLE flare was the leading cause of admission (35%), followed by infection (23.4%) and diagnostic procedures (22%) (Table 2). Among flare-related admissions, 12.4% of them were newly diagnosed SLE and renal involvement was predominant (41.1%). Among infection-related cases, respiratory (45.4%), urinary (20.7%), and gastrointestinal (15.4%) sources were the most common.
3.3. Subgroup Characteristics and Risk Factors
Subgroup analyses focused on the two most frequent causes of hospital admission: SLE flares and infections (Table 3). Admissions related to diagnostic procedures were excluded because of limited relevance, while thrombotic events were not analysed separately due to their small sample size. Comparative analyses were performed between flare-related and non-flare related admissions, as well as between infection-related and non-infection-related admissions, to better characterise the clinical profiles associated with each cause. Multivariable regression models were subsequently applied to identify factors independently associated with flare- and infection-related hospitalisations (Table 4).
3.3.1. SLE Flare-Related Admissions
Patients admitted for SLE flares were younger (37.4 years [12.9] vs. 45.9 years [16.1]) and had shorter disease duration (median 6 years [1,2,3,4,5,6,7,8,9,10,11,12,13] vs. 10 years [4,5,6,7,8,9,10,11,12,13,14,15,16,17,18,19,20]) than those admitted for other causes. This group exhibited lower prevalences of arterial hypertension (19.5% vs. 29.6%) and Sjögren’s syndrome (15.7% vs. 21%) as well as lower cumulative organ damage as measured by the SDI (although median SDI values were identical, differences in mean ranks were statistically significant on Mann-Whitney testing). Patterns of glucocorticoid use also differed, with low-dose therapy (≤5 mg/day) being less frequent (20.1% vs. 31.1%) and moderate-to-high doses predominating among flare-related admissions. In addition, hospital stays were longer in this subgroup (median 7 days [4,5,6,7,8,9,10,11] vs. 5 days [2,3,4,5,6,7,8,9]).
Univariate analysis identified 30-day readmission as a risk factor for flare-related admission (OR 1.638, 95% CI 1.008-2.661; p=0.046). Protective factors included age (OR 0.965, CI 0.956-0.973; p<0.001), disease duration (OR 0.940, CI 0.926-0.954; p<0.001), SDI (OR 0.640, CI 0.562-0.728; p<0.001), Sjögren’s syndrome (OR 0.677, CI 0.495-0.925; p=0.014), hypertension (OR 0.570, CI 0.428-0.759; p<0.001), and low-dose glucocorticoids (OR 0.591, CI 0.414-0.844; p=0.004). In multivariate analysis, only age (OR 0.980, CI 0.970-0.989; p<0.001) and disease duration (OR 0.965, CI 0.948-0.981; p<0.001) remained significant.
3.3.2. Infection-Related Admissions
Patients admitted due to infections were older than those admitted for other causes (mean age 48 ± 17.2 vs. 40.7 ± 14.5 years), and had a longer disease duration (median 13 years [6-22.2] vs. 7 years [3,4,5,6,7,8,9,10,11,12,13,14,15]), This subgroup showed a higher prevalences of hypertension (34.5% vs. 23.5%), and greater cumulative organ damage, as reflected by higher SDI scores (median 1 [0-2] vs. 0 [0-1]). Overlap syndromes were more frequent (52.1% vs. 38.8%), particularly Sjögren’s syndrome (29.6% vs. 16%). Use of biologic agent (8% vs. 2.8%) and low-dose glucocorticoids (31.8% vs. 25.9%) were also more common among infection-related admissions; patients receiving biologic therapy for non-SLE indications were excluded from this analysis. ICU admission occurred more frequently in this group (8.3% vs. 4.3%) and hospital stays were slightly longer (median 6 days [4,5,6,7,8,9] vs. 6 days [2,3,4,5,6,7,8,9]).
In univariate analysis, infection-related admission was associated with older age, longer disease duration, higher SDI scores, overlap syndromes (particularly Sjögren’s syndrome), arterial hypertension, low-dose glucocorticoid use, and biologic therapy (all p≤0.032; odds ratio (OR) range 1.03–2.93). Conversely, azathioprine use and a history of smoking were associated with lower risk of infection-related admission (OR 0.55 and 0.67, respectively). In multivariate analysis, older age, higher SDI, Sjögren’s syndrome, arterial hypertension, and biologic therapy remained independently associated with infection-related hospitalisation (all p≤0.026).
3.4. Composite Outcome: ICU Admission, Readmission, and Prolonged Stay
The composite outcome was observed in 377 admissions accounting for 31% of the total hospitalisations. The distribution of individual components was as follows: ICU admission (n=66, 5.4%), 30-day readmission (n=90, 7.4%), and prolonged hospitalisation defined as length of stay exceeding the 75th percentile (≥10 days), which occurred in 293 admissions (24%). Partial overlap among components was observed, with 70 admissions (18.5% of those meeting the composite outcome) fulfilling more than one criterion.
3.4.1. ICU Admission
A total of 66 hospitalisations involving 56 patients required ICU admission. The mean age at admission was 40.3 ± 15.3 years, with a median disease duration of 12.5 [16.2] years. The most frequent causes of ICU admission were infection (37.9%) and SLE flare (36.4%), followed by other autoimmune diseases (9.1%). The median length of hospital stay was 17 days [8,9,10,11,12,13,14,15,16,17,18,19,20,21,22,23,24,25,26,27,28,29,30,31], and the median SDI at admission was 0.5 [0.5-2]. Antimalarial therapy was being used at admission in 51.5% of cases. Among flare-related ICU admissions, the median SLEDAI-2K was 16 [11.7], with renal involvement (75%), haemolytic anaemia (45%), and constitutional symptoms (33.3%) being the most common clinical manifestations.
3.4.2. Readmission
Among the 500 unique patients included in the study, 240 (48%) experienced a single hospitalisation, whereas 260 (52%) had multiple admissions, with a mean of 2.4 ± 2.4 admissions per patient. Ninety patients (18%) were readmitted within 30 days of discharge, most commonly due to SLE flare (36.7%), infection (24.4%), and diagnostic procedures (22.2%).
3.4.3. Mortality
During the study period, 12 in-hospital deaths were recorded, all occurring in women. The leading causes of death were infection (n=5) and catastrophic antiphospholipid syndrome (CAPS, n=4). The mean age at admission was 40.3 ± 11.2 years, with a median disease duration of 14 years [7-22.5]. Median length of hospital stay was 18 days [6.25-38.5], and the median SDI at admission was 0 [0-3].
3.5. Risk Factors for the Composite Outcome
In univariate analysis, several factors were significantly associated with the composite outcome (30-day readmission, ICU admission, or prolonged hospital stay). These included older age (OR 1.01, 95%CI 1-1.02; p=0.002), higher cumulative organ damage (SDI; OR 1.16, 95% CI 1.05-1.28; p=0.004), the presence of overlap syndrome (OR 2.03, 95% CI 1.58-2.62; p<0.001), APS (OR 1.84, 95% CI 1.4-2.43; p<0.001), arterial hypertension (OR 1.63, 95% CI 1.24-2.15; p<0.001), SLE flare as the cause of admission (OR 1.42, 95% CI 1.1-1.83; p=0.008), and vascular events (OR 3.05, CI 1.80-5.15; p<0.001). Antimalarial therapy was associated with a reduced risk of the composite outcome (OR 0.7, 95% CI 0.54-0.9; p=0.005). In multivariate analysis, overlap syndromes (OR 1.85, CI 1.42-2.40; p<0.001), arterial hypertension (OR 1.55, 95% CI 1.16-2.1; p=0.003), SLE flare (OR 1.77, 95% CI 1.33-2.33; p<0.001), and vascular events (OR 3.11, 95% CI 1.80-5.38; p<0.001) remained independently associated with adverse outcomes, while antimalarial use showed a trend towards protection (OR 0.78, 95% CI 0.60-1.01; p=0.057) (Table 5).
Among admissions due to SLE flares, univariate predictors of the composite outcome included higher disease activity measured by SLEDAI-2K (OR 1.11, 95% CI 1.07-1.15; p<0.001), newly diagnosed SLE (OR 1.89, 95% CI 1.05-3.4; p=0.033), constitutional symptoms (OR 1.53, 95% CI 1.01-2.30; p=0.043), haemolytic anaemia (OR 2.20, CI 1.28-3.79; p=0.004), renal flare (OR 2.60, 95% CI 1.71-3.94; p<0.001), and neuropsychiatric flare (OR 4.37, 95% CI 1.62-11.75; p=0.004). In the multivariable model, SLEDAI-2K (OR 1.06, 95% CI 1.00-1.11; p=0.036), APS (OR 1.84, 95% CI 1.13-2.3; p=0.015), constitutional symptoms (OR 1.65, 95% CI 1.02-2.67; p=0.043), haemolytic anaemia (OR 2.15, 95% CI 1.16-3.93; p=0.014), renal flare (OR 2.45, 95% CI 1.41-4.23; p=0.001), and neuropsychiatric flare (OR 5.70, 95% CI 1.8-18.55; p=0.003) remained independently associated with the composite outcome (Table 5).
In contrast, among infection-related admissions, arterial hypertension was the only variable consistently associated with the composite outcome in both univariate (OR 2.14, 95% CI 1.26-3.63; p=0.004) and multivariate analysis (OR 2.26, 95% CI 1.29-3.96; p=0.004).
3.6. Temporal Trends Over 30 Years
The overall number of hospital admissions remained stable throughout the study period (Figure A1) with approximately 400 admissions per decade. However, the causes of admission changed substantially over time (Figure 2 and Supplementary Table S1). Infection-related admissions increased significantly, from 19.9% to 31.3% (p<0.001), as did admissions for diagnostic procedures (from 11.9% to 26.7%; p<0.001). In contrast, admissions due to SLE flares declined markedly (from 40.0% to 25.2%; p<0.001) as did those related to thrombotic events (from 8.2% to 1.4%; p<0.001). Notably, during the final five-year period, infections surpassed disease flares as the leading cause of hospitalisation (33.7% vs. 26.1%) (Figure 2).
Patients admitted in the most recent decade (2015-2024) were older (mean age 44.9 vs. 40.8 years; p<0.001) and had a longer disease duration (median 10 vs. 7 years; p<0.001). The prevalence of arterial hypertension decreased over time (from 31.3% to 22.6%; p=0.012), whereas a history of smoking became more common (from 16.1% to 23.3%; p=0.003). Disease activity at admission, measured by SLEDAI-2K, increased modestly (median 8 to 10; p=0.005), while overlap with APS declined (from 24% to 12.7%; p=0.01) (Table 6).
Treatment patterns evolved considerably over the study period. Use of antimalarials increased from 45.2% to 69.7%, immunosuppressive therapies from 27.8% to 51.9%, and biologic agents from 0% to 10.2% (all p<0.001). Mycophenolate mofetil use rose substantially (from 4.9% to 27.4%; p<0.001), replacing cyclophosphamide (from 8.7% to 2.2%). Glucocorticoid prescribing shifted towards lower doses, with low-dose use increasing from 14.5% to 38.3% (p<0.001) and moderate-to-high doses decreasing from 61% to 34.7% (p<0.001). Median length of hospital stays shortened over time (from 6 to 5 days; p<0.001), although ICU admissions became more frequent (from 3.5% to 7.7%; p=0.020) (Table 6).
4. Discussion
This comprehensive, 30-year analysis reveals a fundamental shift in SLE hospitalisation epidemiology. Infections have surpassed flares as the leading cause of admission, and this trend is associated with two distinct patient phenotypes. Younger patients with a recent SLE diagnosis or active disease present with high-intensity flares and worse in-hospital outcomes, while older multimorbid patients experience infections and accumulate permanent organ damage. We identified vascular events and renal involvement as the strongest predictors of adverse in-hospital outcomes, with implications for targeted prevention strategies.
Several therapeutic and organisational changes coincided with these epidemiological shifts during the study period. However, causality cannot be established in this observational design. These include: (i) the earlier and more aggressive use of immunosuppressive agents (particularly mycophenolate); (ii) broader access to biologic therapies; (iii) a gradual reduction in glucocorticoid doses aligned with treat-to-target strategies; and (iv) the implementation of day hospital care for mild-to-moderate flare-ups at our institution. While these interventions may have reduced hospitalisations related to flares, they may have inadvertently increased the susceptibility of highly immunosuppressed patients to infections, resulting in the observed shift towards infection-predominant admissions.
Compared with our previous analysis of 814 admissions between 1995 and 2015 [10], this expanded cohort almost doubles the sample size to 1,216 admissions and extends the follow-up period by nine years to include 2024, incorporating the era of widespread biologic use and formalised treat-to-target strategies. This additional decade provides novel insights into the long-term impact of therapeutic intensification on hospitalisation patterns.
Few recent studies have examined hospitalisation trends in SLE using large cohorts. Pires et al. [10] observed a non-significant increase in infection-related admissions over time, highlighting the need for updated, large-scale analyses. Previous national registry-based studies [19,20] have described a gradual decline in admissions due to active SLE, with a parallel increase in hospitalisations related to infections and cardiovascular comorbidity. However, most of these analyses relied on administrative data and lacked detailed clinical characterization. Our results confirm these observations and incorporate validated measures of disease activity and accumulated damage.
These evolving patterns call for a redefinition of inpatient care for SLE patients. Future clinical practice must emphasize comorbidity management, infectious disease expertise, and integration of geriatric principles into autoimmune care.
Although a decline in hospitalisations might be expected due to improved flare management and expanded outpatient care, this has been offset by rising admissions for infections and diagnostic procedures, as well as an increasing number of complex referrals to our unit.
Antimalarials increased significantly over time (45.2% to 69.7%; p<0.001), though current rates remain suboptimal. Non-prescription at admission was primarily due to newly diagnosed SLE (11% of flare-related admissions) and drug toxicity, mainly ocular. Excluding new-onset cases, usage reached almost 80% (75-79% per patient), aligning with other cohorts (80-85%) [5,21]. As a national/European referral centre managing complex patients with contraindications, our cohort likely experiences higher cumulative toxicity rates (particularly retinopathy) [22], explaining lower prescription rates compared to less specialized centres and contributing to increased hospitalisation risk.
Glucocorticoid use has evolved notably. Although overall usage rates have changed minimally, dosing patterns reflect a shift toward safer strategies. The rise in low-dose prescriptions (>0 to ≤5 mg/day) and decline in higher doses (>5 mg/day) indicate increased awareness of long-term toxicity and a preference for steroid-sparing approaches. This trend is supported by earlier use of immunosuppressants and biologics, enabling better disease control with reduced steroid exposure [23]. These changes align with international SLE management guidelines [24] and the treat-to-target strategy [25], promoting a balance between disease control and treatment-related harm [26]. Notably, low-dose glucocorticoids were less common in flare-related admissions (consistent with their protective role), while higher doses were more frequent, likely reflecting outpatient management failure in moderate-to-severe flares. Moreover, low-dose glucocorticoid use (31.8% vs. 25.9%) was more frequent among infection-related admissions. This finding may be explained by the age differences between patients receiving >0 to ≤5 mg/day of glucocorticoids (mean age 46.3 years) and those receiving >5 mg/day (39.5 years). Therefore, the group treated with >0 to ≤5 mg/day likely includes patients with long-standing glucocorticoid exposure, who tend to be older and present a higher burden of comorbidities.
Immunosuppressive therapy has also shifted, with mycophenolate emerging as the most commonly used agent and cyclophosphamide declining. This reflects institutional policy favouring mycophenolate for its safety and efficacy, particularly in non-life-threatening scenarios and in women with reproductive plans [27]. Cyclophosphamide has been largely replaced by mycophenolate in membranoproliferative lupus nephritis without poor prognostic markers, and by rituximab in severe or refractory cases, especially in women of childbearing age [24,28].
Among risk factors for poor outcomes, vascular events were most strongly associated with the composite outcome, underscoring the need for aggressive outpatient prevention strategies [29]. SLE flare, particularly renal involvement, was the second most significant predictor, highlighting the importance of early, intensive immunosuppressive therapy. Although antimalarial use did not reach statistical significance, its protective trend reinforces the need for universal prescription in eligible patients.
Although there was an increase in ICU admissions from 3.5% to 7.7% (p=0.020) throughout the study period, in-hospital mortality remained stable. This apparent paradox may reflect several non-mutually exclusive factors: (1) infections are the leading cause of ICU admission and often require intermediate-level care (e.g., monitoring and oxygen therapy), but have a lower mortality rate than catastrophic events; (2) over time, there has been a relaxation of ICU admission criteria, particularly for elderly patients or those not considered to be intubation candidates, which has expanded access to supportive care [30]; (3) referrals from other institutions have increasingly involved critically ill patients who already require ICU-level management upon arrival; and (4) improved critical care practices and antimicrobial stewardship has reduced ICU mortality. Conversely, excluding SARS-CoV-2 patients admitted to other departments may have reduced bias related to the pandemic.
The association between infection-related admissions and overlap syndromes, particularly Sjögren’s syndrome, is noteworthy. Although not previously reported in this context, Sjögren’s is known to increase infection risk due to impaired mucosal barrier function, contributing to excess mortality in isolated cases [31].
As with any retrospective study, limitations exist. Patient selection was restricted to admissions within the Department of Autoimmune Diseases, potentially excluding cases managed in other departments (e.g., acute coronary syndrome, stroke, SARS-CoV-2, fractures). Moreover, data were derived from a single tertiary centre, limiting generalizability to regional or secondary hospitals. Covid-19 pandemic may also represent a limitation of our study as it likely introduced bias at different levels, including admissions to different units, delay in seeking medical care due to fear of infection and modifications of healthcare delivery. Additionally, causes of admission were operationalised as mutually exclusive categories. In cases with more than one plausible reason for hospitalisation, records were reviewed by two investigators (JC and GE) and classified by consensus. Although this approach improved consistency, it may oversimplify the multifactorial nature of some admissions, and a degree of misclassification cannot be excluded.
Several factors may have contributed to bias and residual confounding in this 30-year, single-centre SLE cohort analysis. Admissions to other departments (e.g., cardiology for acute coronary syndrome or neurology for stroke) were excluded, which enriched the cohort for autoimmune-focused hospitalisations. Here, the apparent rise in infection-related admissions may reflect increased hospitalisation rates rather than true outpatient infection incidence. Temporal diagnostic shifts (e.g., interpreting elevated CRP as infection rather than a mild flare in recent years), improved electronic health record documentation detecting more comorbidities and confounding by indication (intensive immunosuppression being prescribed for more severe disease) may also independently explain the observed trends, apart from true epidemiological changes.
Nonetheless, the strengths of this study include a large cohort of 1,216 admissions from 500 patients, a 30-year longitudinal follow-up by the same department (often the same physicians), which ensures diagnostic and therapeutic homogeneity and minimises interobserver variability. Standardised indices (ACR/EULAR, SLEDAI-2K and SDI), clear exposure and outcome definitions, decade-by-decade analyses and data from a national reference centre enhance the study’s internal validity and provide a robust real-word insight into trends in SLE hospitalisation.
5. Conclusions
Over the past three decades, patterns of hospitalisation for SLE have shifted markedly. Infections have now surpassed flares as the leading cause, reflecting two distinct patient profiles: younger patients with high activity flares and older patients with multiple comorbidities who are on chronic immunosuppression. Admissions for SLE flares, overlap syndromes, vascular events, and arterial hypertension are associated with poorer outcomes. These findings highlight the need to redefine inpatient care, with focus on infection prevention, management of comorbidities, and early intervention for high-risk phenotypes.
Supplementary Materials
The following supporting information can be downloaded at the website of this paper posted on Preprints.org, Table S1: Decadal trends in causes of admissions in patients with SLE.
Author Contributions
Conceptualization, J.C. and G.E.; methodology, J.C. and G.E.; software, J.C.; validation, J.C., G.E.; formal analysis, J.C.; data curation, J.C. and G.E.; writing—original draft preparation, J.C.; writing—review and editing, J.C., S.P.G., O.A., G.E.F., V.G.C., M.C.G., I.R.P., J.H.R., M.C.C, G.E., and R.C.; supervision, G.E. All authors have read and agreed to the published version of the manuscript.
Funding
This research received no external funding.
Institutional Review Board Statement
The study was conducted in accordance with the Declaration of Helsinki, and approved by the Institutional Review Board (or Ethics Committee) of HOSPITAL CLÍNIC DE BARCELONA-IDIBAPS (protocol HCB/2018/1221, approved January 17, 2019).
Informed Consent Statement
Patient consent was waived due to the long-term study period and the retrospective nature of the study.
Data Availability Statement
Data supporting the findings of this study are available from the corresponding author upon reasonable request.
Acknowledgments
During the preparation of this manuscript, the authors used Microsoft M365 Copilot (GPT-5 chat model) to improve the clarity and language of the text and to support the creation of the graphical abstract. All AI-assisted content was thoroughly reviewed, verified, and approved by the authors to ensure accuracy and integrity. The authors have reviewed and edited all outputs and take full responsibility for the content of this publication.
Conflicts of Interest
The authors declare no conflicts of interest.
Abbreviations
The following abbreviations are used in this manuscript:
| ACR | American College of Rheumatology |
| ANOVA | Analysis of variance |
| APS | Antiphospholipid syndrome |
| CAPS | Catastrophic antiphospholipid syndrome |
| CI | Confidence interval |
| CRP | C reactive protein |
| DNA | Deoxyribonucleic acid |
| dsDNA | Double-stranded DNA |
| EULAR | European Alliance of Associations for Rheumatology |
| GE | Gerard Espinosa |
| ICU | Intensive care unit |
| IQR | Interquartile range |
| IV | Intravenous |
| JC | Jesús Cívico |
| NS | Non-statistical significance |
| OR | Odds ratio |
| SAD | Systemic autoimmune disease |
| SD | Standard deviation |
| SDI | Systemic Lupus International Collaborating Clinics Damage Index |
| SLE | Systemic lupus erythematosus |
| SLEDAI | SLE Disease Activity Index |
| SLICC | Systemic Lupus International Collaborating Clinics |
Appendix A
Appendix A.1
Figure A1.
Five-year trends in the main causes of hospital admission.

References
- Lin, D.H.; Murimi-Worstell, I.B.; Kan, H.; Tierce, J.C.; Wang, X.; Nab, H.; Desta, B.; Hammond, E.R.; Alexander, G.C. Health care utilization and costs of systemic lupus erythematosus in the United States: A systematic review. Lupus 2022, 31, 773–807. [Google Scholar] [CrossRef] [PubMed]
- Ng, B.; Zhu, R.; Yap, T.; Gordon, C.; Isenberg, D.; Marjanovic, S. The economic burden of systemic lupus erythematosus in New Zealand: An exploratory study. J. Med. Econ. 2021, 24, 505–513. [Google Scholar] [CrossRef]
- Hill, C.L.; Ngian, G.S.; Proudman, S.M.; Hall, S.; Gill, T.K. Hospitalisation for systemic lupus erythematosus associates with an increased risk of mortality in Australian patients from 1980 to 2014: A longitudinal, population-level, data linkage, cohort study. Lupus Sci. Med. 2023, 10, e000825. [Google Scholar] [CrossRef]
- Edwards, C.J.; Lian, T.Y.; Badsha, H.; Teh, C.L.; Arden, N.; Chng, H.H. Hospitalization of individuals with systemic lupus erythematosus: Characteristics and predictors of outcome. Lupus 2003, 12, 672–676. [Google Scholar] [CrossRef]
- Busch, R.W.; Svanström, H.; Ekstrand, C.; Jacobsen, S.; McDonald, J.C.; Voss, A.; et al. Hospitalization of patients with systemic lupus erythematosus in Denmark: Frequency, causes and outcomes. Lupus 2017, 26, 125–131. [Google Scholar] [CrossRef]
- Zeng, C.; Wang, H.; Liu, J.; Wang, L.; Sun, L.; Gao, J.; et al. Poor prognosis markers among hospitalized patients with systemic lupus erythematosus: A nationwide population-based study in China. Lupus 2022, 31, 935–942. [Google Scholar] [CrossRef]
- Al Arfaj, A.S.; Khalil, N. Clinical and demographic characteristics of hospitalized SLE patients in Saudi Arabia. Lupus 2009, 18, 465–470. [Google Scholar] [CrossRef]
- Pires da Rosa, G.; Fontecha Ortega, M.; Teixeira, A.; Espinosa, G.; Cervera, R. Causes and factors related to hospitalizations in patients with systemic lupus erythematosus: Analysis of a 20-year period (1995–2015) from a single referral centre in Catalonia. Lupus 2019, 28, 1158–1166. [Google Scholar] [CrossRef]
- Moreno-Torres, V.; Martínez-Urbistondo, M.; Gutiérrez-Rojas, A.; Castejón, R.; Sánchez, E.; Calderón-Parra, J.; et al. Impact of severe infections in SLE: An observational study from the Spanish national registry. Lupus Sci. Med. 2022, 9, e000711. [Google Scholar] [CrossRef]
- Pires da Rosa, G.; Cervera, R.; Espinosa, G. Causes of hospitalization in systemic lupus erythematosus: A narrative review. Curr. Rheumatol. Rev. 2021, 17, 29–40. [Google Scholar] [CrossRef]
- Tan, E.M.; Cohen, A.S.; Fries, J.F.; Masi, A.T.; McShane, D.J.; Rothfield, N.F.; et al. The 1982 revised criteria for the classification of systemic lupus erythematosus. Arthritis Rheum. 1982, 25, 1271–1277. [Google Scholar] [CrossRef]
- Hochberg, M.C. Updating the American College of Rheumatology revised criteria for the classification of systemic lupus erythematosus. Arthritis Rheum. 1997, 40, 1725. [Google Scholar] [CrossRef] [PubMed]
- Aringer, M.; Costenbader, K.; Daikh, D.; Brinks, R.; Mosca, M.; Ramsey-Goldman, R.; et al. 2019 European League Against Rheumatism/American College of Rheumatology classification criteria for systemic lupus erythematosus. Arthritis Rheumatol. 2019, 71, 1400–1412. [Google Scholar] [CrossRef] [PubMed]
- Petri, M.; Orbai, A.M.; Alarcón, G.S.; Gordon, C.; Merrill, J.T.; Fortin, P.R.; et al. Derivation and validation of the Systemic Lupus International Collaborating Clinics classification criteria for systemic lupus erythematosus. Arthritis Rheumatol. 2012, 64, 2677–2686. [Google Scholar] [CrossRef] [PubMed]
- Gladman, D.D.; Ibañez, D.; Urowitz, M.B. Systemic lupus erythematosus disease activity index 2000. J. Rheumatol. 2002, 29, 288–291. [Google Scholar]
- Collins, T.C.; Daley, J.; Henderson, W.H.; Khuri, S.F. Risk factors for prolonged length of stay after major elective surgery. Ann. Surg. 1999, 230, 251–259. [Google Scholar] [CrossRef]
- Wang, Y.; Eldridge, N.; Metersky, M.L.; et al. Factors associated with a prolonged length of stay after acute exacerbation of chronic obstructive pulmonary disease. Int. J. Chron. Obstruct. Pulmon. Dis. 2014, 9, 99–107. [Google Scholar] [CrossRef]
- Martins, R.S.; Dawood, Z.S.; Memon, M.K.Y.; Akhtar, S. Prolonged length of stay after surgery for adult congenital heart disease: A single-centre study in a developing country. Cardiol. Young 2020, 30, 1253–1260. [Google Scholar] [CrossRef]
- Canora-Lebrato, J.; Barba-Martín, R.; Perales-Fraile, I.; Marco-Martínez, J.; Plaza-Cantelli, S.; Zapatero-Gaviria, A. Descripción de las altas hospitalarias en pacientes con lupus eritematoso sistémico. Rev. Clin. Esp. 2012, 212, 432–439. [Google Scholar] [CrossRef]
- Moreno-Torres, V.; Tarín, C.; Ruiz-Irastorza, G.; Castejón, R.; Gutiérrez-Rojas, Á.; Royuela, A.; et al. Trends in hospital admissions and death causes in patients with systemic lupus erythematosus: Spanish national registry. J. Clin. Med. 2021, 10, 5749. [Google Scholar] [CrossRef]
- Aldarmaki, R.; Al Khogali, H.I.; Al Dhanhani, A.M. Hospitalization in patients with systemic lupus erythematosus at Tawam Hospital, United Arab Emirates (UAE): Rates, causes, and factors associated with length of stay. Lupus 2021, 30, 845–851. [Google Scholar] [CrossRef]
- Araujo, O.; Espinosa, G.; Hernández-Rodríguez, J.; Hernández-Negrín, H.; Adán, A.; Pelegrín, L.; et al. New insights into the long-term adverse effects of antimalarials in patients with systemic lupus erythematosus. Lupus 2025, 34, 243–252. [Google Scholar] [CrossRef] [PubMed]
- Morand, E.F.; Fernandez-Ruiz, R.; Blazer, A.; Niewold, T.B. Advances in the management of systemic lupus erythematosus. BMJ 2023, 383, e073980. [Google Scholar] [CrossRef] [PubMed]
- Fanouriakis, A.; Kostopoulou, M.; Andersen, J.; Aringer, M.; Arnaud, L.; Bae, S.C.; et al. EULAR recommendations for the management of systemic lupus erythematosus: 2023 update. Ann. Rheum. Dis. 2024, 83, 15–29. [Google Scholar] [CrossRef] [PubMed]
- Van Vollenhoven, R.F.; Mosca, M.; Bertsias, G.; Isenberg, D.; Kuhn, A.; Lerstrøm, K.; et al. Treat-to-target in systemic lupus erythematosus: Recommendations from an international task force. Ann. Rheum. Dis. 2014, 73, 958–967. [Google Scholar] [CrossRef]
- Piga, M.; Parodis, I.; Touma, Z.; Legge, A.; Ugarte-Gil, M.F.; Hmamouchi, I.; et al. Framework for implementing treat-to-target in systemic lupus erythematosus routine clinical care: Consensus statements from an international task force. Autoimmun. Rev. 2025, 24, 103773. [Google Scholar] [CrossRef]
- Jiang, N.; Jin, S.; Yu, C.; Zhao, J.; Wang, Q.; Tian, X.; et al. Efficacy and safety of immunosuppressive agents for adults with lupus nephritis: A systematic review and network meta-analysis. Front. Immunol. 2023, 14, 1232244. [Google Scholar] [CrossRef]
- Mok, C.C. Current role of rituximab in systemic lupus erythematosus. Int. J. Rheum. Dis. 2015, 18, 154–163. [Google Scholar] [CrossRef]
- Drosos, G.C.; Vedder, D.; Houben, E.; Boekel, L.; Atzeni, F.; Badreh, S.; et al. EULAR recommendations for cardiovascular risk management in rheumatic and musculoskeletal diseases, including systemic lupus erythematosus and antiphospholipid syndrome. Ann. Rheum. Dis. 2022, 81, 768–779. [Google Scholar] [CrossRef]
- Antón, J.M.; Castro, P.; Espinosa, G.; Marcos, M.; Gandía, M.; Merchán, R.; et al. Mortality and long-term survival prognostic factors of patients with systemic autoimmune diseases admitted to an intensive care unit: A retrospective study. Clin. Exp. Rheumatol. 2012, 30, 338–344. [Google Scholar]
- Brito-Zerón, P.; Baldini, C.; Bootsma, H.; Bowman, S.J.; Jonsson, R.; Mariette, X.; et al. Sjögren syndrome. Nat. Rev. Dis. Primers 2016, 2, 16047. [Google Scholar] [CrossRef]
Figure 1.
Flowchart of patient selection. * Admissions for scheduled intravenous treatment without an associated acute clinical diagnosis. Abbreviations: ACR: American College of Rheumatology; EULAR: European Alliance of Associations for Rheumatology; IV: intravenous; SLE: systemic lupus erythematosus.

Figure 2.
Five-year trends in the main causes of hospital admission.


Table 1.
Baseline characteristics of patients with SLE and hospital admissions.
| Variable | Value |
| Study population | |
| Female sex, n (%) | 437 (87.4) |
| Age at SLE diagnosis, years mean (SD) | 31.2 (14.8) |
| Age at hospital admission*, years mean (SD) | 42.4 (15.6) |
| Disease duration at admission*, years median [IQR] | 8 [3,4,5,6,7,8,9,10,11,12,13,14,15,16,17] |
| Newly diagnosed SLE, n (%) | 56 (4.6) |
| Cardiovascular risk factors, (n = 500), n (%) | |
| Arterial hypertension | 317 (26.1) |
| Smoking history | 264 (21.7) |
| Dyslipidaemia | 166 (13.7) |
| Diabetes mellitus | 50 (4.1) |
| Associated autoimmune diseases, (n = 500) n (%) | |
| Any overlap syndrome | 167 (33.4) |
| Antiphospholipid syndrome | 88 (17.6) |
| Sjögren’s syndrome | 67 (13.4) |
| Disease status at admission | |
| SDI (n = 500) median [IQR] | 0 [0-1] |
| SLEDAI-2K at admission (n = 426) median [IQR] | 8 [5,6,7,8,9,10,11,12,13] |
| Biomarkers at admission** (n= 331), n (%) | |
| Elevated anti-dsDNA | 284 (85.8) |
| Complement consumption | 271 (77.2) |
| Proteinuria > 0,5 mg/24 h | 221 (56.5) |
| Source of admission* (n = 1216), n (%) | |
| Emergency department | 517 (42.5) |
| Elective admission from home | 334 (27.5) |
| Day hospital | 152 (12.5) |
| Outpatient clinic | 145 (11.9) |
| Other hospital department | 51 (4.2) |
| Intensive care unit | 17 (1.4) |
| Treatment at admission* (n = 1216), n (%) | |
| Antimalarials | 697 (57.3) |
| Immunosuppressants | 516 (42.4) |
| Biologic agents | 50 (4.2) |
| Glucocorticoids | 950 (78.1) |
| Anticoagulants | 178 (14.6) |
| Antiplatelet agents | 248 (20.4) |
| Outcomes, admissions, (n = 1216) | |
| Length of hospital stay, days median [IQR] | 6 [2,3,4,5,6,7,8,9] |
| 30-day readmission, n (%) | 90 (7.4%) |
| ICU admission, n (%) | 66 (5.4%) |
| In-hospital mortality, n (%) | 12 (1.0%) |
* Among 1216 admissions ** Assessed only in patients admitted due to SLE flare. Abbreviations: dsDNA, double-stranded DNA; IQR, interquartile range; SD, standard deviation; SLE, systemic lupus erythematosus; SLEDAI, SLE Disease Activity Index; SDI, Systemic Lupus International Collaborating Clinics Damage Index.
Table 2.
Causes of hospital admission in patients with SLE.
| Cause of admission | n (%) |
| SLE flare | 426 (35.0) |
| Renal involvement | 175 (41.1)† |
| Constitutional symptoms | 167 (39.2)† |
| Haematological | 149 (35.0)† |
| Arthritis | 143 (33.6)† |
| Mucocutaneous involvement | 113 (26.5)† |
| Serositis | 79 (18.5)† |
| Neuropsychiatric involvement | 19 (4.5)† |
| Infection | 284 (23.4) |
| Respiratory | 129 (45.4)† |
| Urinary | 59 (20.7)† |
| Gastrointestinal | 44 (15.4)† |
| Skin and soft tissue | 20 (7.0)† |
| Other | 32 (11.2)† |
| Diagnostic procedures | 267 (22.0) |
| Kidney biopsy | 232 (86.8)† |
| Thrombotic events | 50 (4.6) |
| Arterial | 28 (56.0)† |
| Stroke | 12 (42.8)‡ |
| Acute coronary syndrome | 6 (21.4)‡ |
| Digital ischemia | 6 (21.4)‡ |
| Venous | 22 (44.0)† |
| Deep venous thrombosis | 14 (63.6)‡ |
| Pulmonary embolism | 5 (22.7)‡ |
| Musculoskeletal disorders | 35 (2.9) |
| Vertebral fracture | 10 (28.5)† |
| Avascular femoral head necrosis | 5 (14.2)† |
| Glucocorticoid-induced myopathy | 3 (8.5)† |
| Other causes | 154 (12.6) |
| Other systemic autoimmune disease | 34 (2.8)† |
| Neurological disorders | 24 (2.0)† |
| Cardiovascular disease (non-thrombotic) | 24 (2.0)† |
| Others | 72 (5.9)† |
† Percentages calculated using the total number of admissions within each main category as de-nominator. ‡ Percentages calculated using the total number of admissions within the corresponding throm-botic subgroup as denominator. Abbreviations: SLE: systemic lupus erythematosus.
Table 3.
Characteristics of subgroups: SLE flare and infection.
| Variable | SLE flare | Non-SLE flare | p | Infection | Non-Infection | p |
| Number of admissions (patients), n | 426 | 790 | 284 | 932 | ||
| Gender, female, n (%) | 379 (89) | 713 (90.3) | 0.480 | 262 (92.3) | 830 (89.1) | 0.119 |
| Age at SLE diagnosis, years, mean (SD) | 29.3 (13.3) | 32.2 (15.4) | <0.001 | 33.1 (16.4) | 30.6 (14.1) | 0.023 |
| Age at hospitalisation, years, mean (SD) | 37.4 (12.9) | 45.9 (16.1) | <0.001 | 48 (17.2) | 40.7 (14.5) | <0.001 |
| Duration of SLE, years, median [IQR] | 6 [1,2,3,4,5,6,7,8,9,10,11,12,13] | 10 [4,5,6,7,8,9,10,11,12,13,14,15,16,17,18,19,20] | <0.001 | 13 [6-22.2] | 7 [3,4,5,6,7,8,9,10,11,12,13,14,15] | <0.001 |
| Cardiovascular risk factors, n (%) | ||||||
| Arterial hypertension | 83 (19.5) | 234 (29.6) | <0.001 | 98 (34.5) | 219 (23.5) | <0.001 |
| Smoking history | 87 (20.4) | 177 (22.4) | 0.424 | 48 (16.9) | 216 (23.3) | 0.025 |
| Dyslipidaemia | 51 (12) | 115 (14.6) | 0.345 | 40 (14.1) | 126 (13.5) | 0.835 |
| Diabetes mellitus | 13 (3.1) | 37 (4.7) | 0.172 | 17 (6) | 33 (3.5) | 0.069 |
| Associated autoimmune diseases, n (%) | ||||||
| Overlap | 168 (39.4) | 342 (43.3) | 0.194 | 148 (52.1) | 362 (38.8) | <0.001 |
| Antiphospholipid syndrome | 118 (27.7) | 180 (22.8) | 0.057 | 70 (24.6) | 228 (24.5) | 0.950 |
| Sjogren’s syndrome | 67 (15.7) | 166 (21) | 0.025 | 84 (29.6) | 149 (16) | <0.001 |
| SDI at admission, median [IQR] | 0 [0-1] | 0 [0-1] | <0.001a | 1 [0-2] | 0 [0-1] | <0.001 |
| Treatment, n (%) | ||||||
| Antimalarials | 246 (57.7) | 451 (57.1) | 0.825 | 157 (55.3) | 540 (57.9) | 0.428 |
| Immunosuppressants | 168 (39.4) | 348 (44.1) | 0.120 | 119 (41.9) | 397 (42.6) | 0.836 |
| Biologic agents b | 12 (2.8) | 36 (4.6) | 0.126 | 22 (8) | 26 (2.8) | <0.001 |
| Glucocorticoids | 327 (76.8) | 623 (78.9) | 0.398 | 231 (81.3) | 719 (77.1) | 0.135 |
| > 0 ≤ 5mg/24h | 82 (20.1) | 234 (31.1) | <0.001 | 88 (31.8) | 228 (25.9) | <0.001 |
| > 5mg/24h | 226 (55.5) | 351 (46.7) | <0.001 | 136 (49.1) | 441 (50) | <0.001 |
| Anticoagulants | 45 (10.6) | 133 (16.8) | 0.003 | 53 (18.7) | 125 (13.4) | 0.028 |
| Antiplatelets | 76 (17.8) | 172 (21.8) | 0.201 | 68 (23.9) | 180 (19.3) | 0.207 |
| Outcomes c | ||||||
| Days of admission median [IQR] | 7 [4,5,6,7,8,9,10,11] | 5 [2,3,4,5,6,7,8,9] | <0.001 | 6 [4,5,6,7,8,9] | 6 [2,3,4,5,6,7,8,9] | 0.03 |
| Readmission at 30 days n (%) | 29 (7) | 41 (5.3) | 0.271 | 20 (7.3) | 50 (5.5) | 0.271 |
| Need for admission in ICU n (%) | 24 (5.6) | 39 (5) | 0.685 | 23 (8.3) | 40 (4.3) | 0.009 |
| Mortality d n (%) | 3 (0.7) | 8 (1) | 0.756 | 5 (1.8) | 6 (0.6) | 0.140 |
a Statistically significant differences were found in the Mann-Whitney test despite identical medians and interquartile ranges, as the test evaluates differences in mean ranks. Patients admitted for SLE flare tended to have lower SDI scores. b Patients receiving biologic therapy for other diseases, such as psoriasis or Still’s disease, were excluded from the ‘Biologics agents’ group. c Patients receiving biologic therapy for other diseases, such as psoriasis or Still’s disease, were excluded from the ‘Outcomes’ group. Patients readmitted at 30 days for diagnostic procedures were also excluded from ‘Readmission at 30 days group’. d Statistical values calculated by Fisher tests. Abbreviations: ICU: intensive care unit; IQR: interquartile range; SD: standard deviation; SLE: systemic lupus erythematosus; SDI: Systemic Lupus International Collaborating Clinics Damage Index.
Table 4.
Risk factors for SLE flare admission and infection admission events by regression.
| Univariate analysis | Multivariate analysisa | |||
| Variable | OR (CI 95%) | p | OR (CI 95%) | p |
| SLE Flare as cause of admission | ||||
| Gender (female) | 1.173 (0.793-1.735) | 0.425 | 1.111 (0.733-1.684) | 0.619 |
| Age at SLE diagnosis | 0.985 (0.977-0.993) | <0.001 | NS | NS |
| Age at admission | 0.965 (0.956-0.973) | <0.001 | 0.980 (0.970-0.989) | <0.001 |
| SDI | 0.640 (0.562-.728) | <0.001 | 0.815 (0.708-0.939) | 0.005 |
| Duration of SLE, years | 0.940 (0.926-0.954) | <0.001 | 0.965 (0.948-0.981) | <0.001 |
| Sjogren’s syndrome | 0.677 (0.495-0.925) | 0.014 | 1.030 (0.725-1.464) | 0.868 |
| Present admission is a 30-day readmission | 1.638 (1.008-2.661) | 0.046 | 1.491 (0.879-2.530) | 0.138 |
| Arterial hypertension | 0.570 (0.428-0.759) | <0.001 | 0.845 (0.610-1.170) | 0.310 |
| Anticoagulants | 0.566 (0.394-0.813) | 0.002 | 0.830 (0.556-1.238) | 0.360 |
| Glucocorticoids > 0 ≤ 5mg/24h | 0.591 (0.414-0.844) | 0.004 | 0.727 (0.497-1.063) | 0.100 |
| Infection as cause of admission | ||||
| Gender (female) | 0.652 (0.395-1.076) | 0.094 | 0.749 (0.445-1.261) | 0.276 |
| Age at SLE diagnosis | 1.012 (1.003-1.021) | 0.008 | NS | NS |
| Age at admission | 1.030 (1.021-1.039) | <0.001 | 1.015 (1.005-1.025) | 0.004 |
| SDI | 1.588 (1.428-1.767) | <0.001 | 1.401 (1.248-1.573) | <0.001 |
| Duration of SLE, years | 1.051 (1.037-1.066) | <0.001 | NS | NS |
| Overlap | 1.718 (1.310-2.253) | <0.001 | NS | NS |
| Sjogren’s syndrome | 2.259 (1.655-3.084) | <0.001 | 1.513 (1.075-2.131) | 0.018 |
| Arterial hypertension | 1.799 (1.344-2.408) | <0.001 | 1.442 (1.046-1.990) | 0.026 |
| Smoking history | 0.672 (0.474-0.953) | 0.026 | NS | NS |
| Obesity | 2.051 (1.041-4.043) | 0.038 | NS | NS |
| Azathioprine | 0.553 (0.347-0.881) | 0.013 | 0.690 (0.423-1.123) | 0.135 |
| Biologic agents | 2.932 (1.634-5.260) | <0.001 | 1.825 (1.269-2.624) | 0.001 |
| Anticoagulants | 1.513 (1.061-2.157) | 0.022 | NS | NS |
| Glucocorticoids > 0 ≤ 5mg/24h | 1.541 (1.038-2.287) | 0.032 | NS | NS |
a Colinear variables or those which introduced instability to the model were excluded from the multivariable analysis. Patients receiving biologic therapy for other diseases, such as psoriasis or Still’s disease, were excluded from the analysis. Abbreviations: CI: confidence interval; NS: non-statistical significance; OR: odds ratio; SLE: systemic lupus erythematosus; SDI: Systemic Lupus International Collaborating Clinics Damage Index.
Table 5.
Risk factors for composite outcome (30-day readmission or ICU admission or prolonged hospital stay (above the 75th percentile) in the whole sample, in SLE flare admissions and in infection admissions calculated by univariate and multivariate regression.
Table 5.
Risk factors for composite outcome (30-day readmission or ICU admission or prolonged hospital stay (above the 75th percentile) in the whole sample, in SLE flare admissions and in infection admissions calculated by univariate and multivariate regression.
| Sample | Univariate analysis | Multivariate analysisa | ||
| OR (CI 95%) | p | OR (CI 95%) | p | |
| Composite outcome in the whole sample | ||||
| Gender (female) | 1.242 (0.829-1.861) | 0.292 | 1.231 (0.811-1.867) | 0.335 |
| Age at SLE diagnosis | 1.013 (1.005-1.022) | 0.002 | NS | NS |
| Age at admission | 1.010 (1.002-1.018) | 0.011 | 1.000 (1.000-1.016) | 0.324 |
| SDI | 1.159 (1.049-1.281) | 0.004 | NS | NS |
| Overlap | 2.034 (1.581-2.618) | <0.001 | 1.852 (1.422-2.405) | <0.001 |
| Antiphospholipid syndrome | 1.842 (1.396-2.431) | <0.001 | NS | NS |
| Diabetes mellitus | 1.966 (1.104-3.502) | 0.022 | NS | NS |
| Arterial hypertension | 1.635 (1.243-2.151) | <0.001 | 1.553 (1.164-2.099) | 0.003 |
| Dyslipidaemia | 1.436 (1.016-2.030) | 0.040 | NS | NS |
| SLE Flare as cause of admission | 1.417 (1.096-1.833) | 0.008 | 1.768 (1.334-2.331) | <0.001 |
| Vascular events b | 3.050 (1.804-5.155) | <0.001 | 3.112 (1.802-5.382) | <0.001 |
| Antimalarials | 0.699 (0.545-0.898) | 0.005 | 0.784 (0.605-1.011) | 0.057 |
| Anticoagulants | 1.649 (1.182-2.300) | 0.003 | NS | NS |
| Composite outcome in SLE flare admissions | ||||
| Gender (female) | 0.746 (0.457-1.753) | 0.671 | 0.683 (0.322-1.453) | 0.321 |
| SLEDAI-2K at admission | 1.109 (1.068-1.151) | <0.001 | 1.056 (1.005-1.114) | 0.036 |
| Newly diagnosed SLE | 1.891 (1.052-3.399) | 0.033 | 0.926 (0.454-1.877) | 0.813 |
| Antiphospholipid syndrome | 1.594 (1.024-2.482) | 0.039 | 1.837 (1.126-2.998) | 0.015 |
| Constitutional symptoms | 1.527 (1.013-2.303) | 0.043 | 1.653 (1.024-2.673) | 0.043 |
| Haemolytic anaemia | 2.203 (1.280-3.790) | 0.004 | 2.147 (1.164-3.931) | 0.014 |
| Renal flare | 2.600 (1.715-3.943) | <0.001 | 2.448 (1.413-4.230) | 0.001 |
| Neuropsychiatric flare | 4.366 (1.623-11.748) | 0.004 | 5.700 (1.799-18.554) | 0.003 |
| Proteinuria | 1.730 (1.120-2.614) | 0.014 | NS | NS |
| Antimalarials | 0.654 (0.435-0.984) | 0.042 | 0.698 (0.430-1.101) | 0.119 |
| Composite outcome in infection admissions | ||||
| Gender (female) | 0.712 (0.250-2.026) | 0.524 | 0.620 (0.265-2.208) | 0.765 |
| Age at admission | 1.003 (0.988-1.017) | 0.732 | 0.995 (0.979-1.011) | 0.525 |
| Arterial hypertension | 2.148 (1.269-3.634) | 0.004 | 2.263 (1.293-3.962) | 0.004 |
a Colinear variables or those which introduced instability to the model were excluded from the multivariable analysis. b Defined as thrombotic events of all types, whether they are cause of admission or not. Patients receiving biologic therapy for other diseases, such as psoriasis or Still’s disease, were excluded from the analysis. Abbreviations: CI: confidence interval; NS: non-statistical significance; OR: odds ratio; SLE: systemic lupus erythematosus; SLEDAI: SLE Disease Activity Index; SDI: Systemic lupus International Collaborating Clinics Damage Index.
Table 6.
Decadal trends in hospitalized patients with systemic lupus erythematosus.
| Variable | 1995-2004 | 2005-2014 | 2015-2024 | p |
| Number of admissions (number of patients) | 403 (196) | 401 (139) | 412 (165) | 0.892 |
| Gender, female, n (%) | 173 (88.3) | 121 (87.1) | 143 (86.7) | 0.89 |
| Age at SLE diagnosis, years, mean (SD) | 32.3 (14.5) | 29.4 (13.5) | 31.9 (15.9) | 0.014 |
| Age at hospitalisation, years, mean (SD) | 41.3 (15.3) | 40.8 (14.3) | 44.9 (16.6) | <0.001 |
| Duration of SLE, years, median [IQR] | 7 [2,3,4,5,6,7,8,9,10,11,12,13,14] | 8 [6,7,8,9,10,11,12] | 10 [4,5,6,7,8,9,10,11,12,13,14,15,16,17,18,19,20,21] | <0.001 |
| Cardiovascular risk factors, n (%) | ||||
| Arterial hypertension | 126 (31.3) | 98 (24.4) | 93 (22.6) | 0.012 |
| Smoking history | 65 (16.1) | 103 (25.7) | 96 (23.3) | 0.003 |
| Dyslipidaemia | 64 (15.9) | 57 (14.2) | 45 (10.9) | 0.178 |
| Diabetes mellitus | 18 (4.5) | 10 (2.5) | 22 (5.3) | 0.113 |
| Associated autoimmune diseases, n (%) | ||||
| Overlap | 72 (36.7) | 36 (25.9) | 59 (35.8) | 0.860 |
| Antiphospholipid syndrome | 47 (24) | 20 (14.4) | 21 (12.7) | 0.01 |
| SDI at admission, median [IQR] | 0 [0-1] | 0 [0-1] | 0 [0-2] | 0.008 |
| SLEDAI-2K at admissiona, median [IQR] | 8 [5,6,7,8,9,10,11,12] | 8 [6,7,8,9,10,11,12] | 10 [6-17.5] | 0.005 |
| Treatment, n (%) | ||||
| Antimalarials | 182 (45.2) | 214 (53.4) | 287 (69.7) | <0.001 |
| Immunosuppressants | 112 (27.8) | 190 (47.4) | 214 (51.9) | <0.001 |
| Mycophenolate | 17 (4.2) | 96 (23.9) | 113 (27.4) | <0.001 |
| Methotrexate | 12 (3) | 22 (5.5) | 30 (7.3) | 0.022 |
| Cyclophosphamide | 35 (8.7) | 20 (5) | 9 (2.2) | <0.001 |
| Biologic agentsb | 0 | 7 (1.7) | 41 (10.2) | <0.001 |
| Glucocorticoids | 318 (78.9) | 331 (82.5) | 301 (73.1) | 0.004 |
| > 0 and ≤ 5mg/24h | 50 (14.5) | 108 (26.9) | 158 (38.3) | <0.001 |
| > 5mg/24h | 211 (61) | 223 (55.6) | 143 (34.7) | <0.001 |
| Anticoagulants | 50 (12.4) | 55 (13.7) | 73 (17.7) | 0.082 |
| Antiplatelets | 75 (18.6) | 73 (18.2) | 100 (24.3) | 0.098 |
| Outcomes c | ||||
| Days of admission, median [IQR] | 6 [4,5,6,7,8,9,10] | 5 [2,3,4,5,6,7,8,9] | 5 [2,3,4,5,6,7,8,9] | <0.001 |
| Readmission at 30 days, n (%) | 25 (6.3) | 26 (6.7) | 19 (4.8) | 0.498 |
| Need for admission in ICU, n (%) | 14 (3.5) | 18 (4.5) | 31 (7.7) | 0.020 |
| Mortality, n (%) | 4 (1) | 4 (1) | 3 (0.7) | 0.909 |
a Patients admitted due to SLE flare. b Patients receiving biologic therapy for other diseases, such as psoriasis or Still’s disease, were excluded from the ‘Biologics agents’ group. c Patients receiving biologic therapy for other diseases, such as psoriasis or Still’s disease, were excluded from the ‘Outcomes’ group. Patients readmitted at 30 days for diagnostic procedures were also excluded from ‘Readmission at 30 days group’. Abbreviations: ICU: intensive care unit; IQR: interquartile range; SD: standard deviation; SLE: systemic lupus erythematosus; SLEDAI: SLE Disease Activity Index; SDI: Systemic Lupus International Collaborating Clinics Damage Index.
Disclaimer/Publisher’s Note: The statements, opinions and data contained in all publications are solely those of the individual author(s) and contributor(s) and not of MDPI and/or the editor(s). MDPI and/or the editor(s) disclaim responsibility for any injury to people or property resulting from any ideas, methods, instructions or products referred to in the content. |
© 2026 by the authors. Licensee MDPI, Basel, Switzerland. This article is an open access article distributed under the terms and conditions of the Creative Commons Attribution (CC BY) license (http://creativecommons.org/licenses/by/4.0/).
Copyright: This open access article is published under a Creative Commons CC BY 4.0 license, which permit the free download, distribution, and reuse, provided that the author and preprint are cited in any reuse.


