Submitted:
31 March 2026
Posted:
02 April 2026
You are already at the latest version
Abstract
Background: New Caledonia, an archipelago in the South Pacific, experienced an unprecedented con-junction of prolonged border closure during the COVID-19 pandemic (2020 to 2022) and maked influence of the El Niño/Southern Oscillation (ENSO). This context provided a unique opportunity to explore how environmental drivers, island isolation, and so-cio-demographic factors interact to shape infectious disease dynamics. This study aimed to assess the respective and combination of climatic variability, travel restrictions, and so-cio-demographic factors on the dynamics of four priority infectious diseases. Methods: We analysed retrospectively data from 2017 to 2023 on four infectious diseases: leptospi-rosis, dengue, influenza, and hepatitis A (HAV). Satellite precipitation data and the Mul-tivariate El Niño/Southern Oscillation Index (MEI) were used. Socio-demographic and economic variables were gathered. Statistical analyses employed descriptive analysis, General Additive Mixed Models to evaluate the associations between climatic events, travel restrictions, and disease circulation using the communal level as random effect and time (daily) as spline effect. Results: We analysed: 878 cases of leptospirosis, 162 of HAV, 7,377 of influenza, and 6,607 dengue cases. Influenza was associated with rainfalls before lockdown (Odds Ratio (OR) 0.7, Con-fidence interval 95%, (CI95%), (0.6 - 0.8)), disappeared during lockdown but resurged post-reopening losing its meteorological association. Dengue epidemics declined, coin-ciding with Wolbachia program and border closure, and was associated with lower MEI (OR 0.78, CI95% (0.6-1) during the 2017 to 2020 period. HAV cases were correlated with the MEI (OR: 1.8, CI95% (1-3.3)). Leptospirosis cases were associated with cumulative rainfall (OR 1.12 (1.1-1.2), lower education (OR 1.04, CI95% (1-1.1)), and decreased with water supply (OR 0.7, CI95% (0.5-0.8)). Conclusion: Our findings highlight how climate variability, mobility restrictions, and so-cio-environmental inequities differentially shape infectious disease risks in island ecosys-tems. These results reinforce the need for integrated One Health surveillance that jointly addresses environmental change, social vulnerability, and infectious disease prevention.
Keywords:
emergent infectious diseases
; water-borne diseases
; vector-born disease
; travel
; leptospirosis
; dengue
; influenza
; El Niño/Southern Oscillation
; ENSO
1. Introduction
New Caledonia, a French archipelago in the South Pacific, is a biodiversity hotspot and highly vulnerable to climate change. Its unique geographical position and colonial history have shaped in a diverse population and contributed to marked socio-demographic vulnerabilities [1].
During the COVID-19 pandemic, New Caledonia successfully implemented a Zero-COVID-19 policy with two lockdowns: the first in March 2020,[2,3] and the second in March 2021 [4] (see Supplementary Materials for a detailed description of the period). In September 2021, a breach associated with the Delta variant led to a surge of cases, progressively ending strict border controls by the end of December 2021 [5]. Concurrently, weather conditions, influenced by the El Niño/Southern Oscillation (ENSO) phenomenon, shifted markedly during the years 2020 to 2022 with the advent of heavy rainfall and increased temperature due to La Niña conditions[6,7,8] during the period of border closure. La Niña phases generally favours above-normal rainfall over New Caledonia, particularly during the austral warm season, through a southwestward extension and intensification of the South Pacific Convergence Zone, although the magnitude and spatial expression of anomalies vary by season and decade [6,7,8]. Therefore, this period represents a unique opportunity to investigate the influence of a major climatic phenomenon such as ENSO on infectious disease circulation in the absence of international travel.
We aimed to analyse the infectious diseases dynamics during archipelago-wide border closure. Four infectious diseases were studied according to their relevance in this specific setting in the literature: dengue [9,10], influenza [11], hepatitis A[12], and leptospirosis[13,14]. Each disease exhibits distinct transmission patterns related to its unique characteristics, making them valuable markers for assessing particular threats during the border closure. These diseases are known to be associated with either population travel or environmental changes, both of which were significantly impacted by the lockdown and climatic events [15,16]. All of them are further described according to the global and local literature in the New Caledonia context in the Supplementary Materials.
Our hypothesis was that climatic events such as ENSO were associated with infectious diseases independently of international travel. Rainfall in New Caledonia is a good proxy La Niña events [17]. The ENSO periods can be characterised using the Multivariate El Niño/Southern Oscillation (ENSO) Index (MEI).
We first analysed the evolution of the infectious diseases’ kinetics with spatial and temporal trends at a community level of the precipitation condition along the MEI index. Secondly, we studied the effect of the territory lockdown on the infectious diseases’ circulation. Lastly, we examined the post-opening incidence of infectious diseases after the travel ban release
2. Materials and Methods
This retrospective database study followed the Helsinki recommendations and was accepted by the Centre-Hospitalier-Territorial Gaston-Bourret de Nouvelle-Calédonie (CHT) research board in 2021, with the purpose to start the analysis with the years until the end of 2023.
Study Location, Communities and Historical Setting
New Caledonia is an archipelago in the South Pacific with a significant autonomous status within the French Republic. High mountains separate the main Island and holds the rains on the east coast while the west coast is drier.
With a population of approximately 270,000 during the study period, New Caledonia is home to both the Indigenous Kanak people and of other groups resulting from successive waves of migration during the colonial era, including Europeans and communities from former Southeast Asian and Pacific colonies. These populations are unevenly distributed across the territory, with the majority primarily concentrated in Nouméa, the capital. As a legacy of settler colonialism, the European population is concentrated primarily in Nouméa and the south, while the northern region and the Loyalty islands are predominantly inhabited by Kanak communities.
The lockdown of the archipelago started in New Caledonia on March the 20th 2020 and ended in December 2021[1,5,18] (See Supplementary Materials for a more complete description of the period). During this period, three lockdowns took place in response to COVID-19 introductions. The aim was to implement a Zero-COVID-19 policy with two strict lockdowns, the first started on March the 23rd 2020,[2,3] and the second on March the 9th 2021 [4]. However, in September 2021 a breach due to the Delta variant resulted in a surge of cases, ending the need for strict border control by the end of December 2021 [5].
Data Collection
Meteorological Variables
Satellite precipitation (MSWEP, https://www.gloh2o.org/mswep/) that were used as references for the mean monthly average rainfall from January the first of 2017 to 2023. These data were compared through graphs with the meteorological data were obtained from the New Caledonia meteorological station (https://www.data.gouv.fr/fr/datasets/donnees-climatologiques-de-base-quotidiennes/) to assess the need of correction.
El Niño/Southern Oscillation (ENSO) periods were reported by from Australian Government Bureau of Meteorology (http://www.bom.gov.au/climate/enso/wrap-up/archive.shtml) based on the bi-monthly Multivariate ENSO index (MEI). The bi-monthly Multivariate ENSO index (MEI, https://psl.noaa.gov/enso/mei/) is the time series combines the information of five different variables (sea level pressure, sea surface temperature, zonal and meridional components of the surface wind, and outgoing longwave radiation) over the tropical Pacific basin (30°S-30°N and 100°E-70°W), which allow to characterize in a single index, El Niño, La Niña and neutral periods [19].
The rolling monthly average for MEI and precipitation were linearly interpolated daily. We chose the mean precipitation over each communal district for a one-month period to investigate the link with the epidemic outbreaks.
Only MEI and satellite precipitations were included in the model despite the possibility to study temperature and relative humidity or more variables. These choices were made based on the primary objectives of the understanding of the overall – macroscopic - dynamics knowing that the heavy rains and the La Niña were the key drivers of the climate changes and the studied diseases. In our knowledge of the subtropical Island setting, relative humidity and temperature were much more dependent of local characteristics within the communal districts. Considering that ENSO influences rainfalls, we decided to included only one of the two variables in the final model and not to include temperature and relative humidity because of the collinearity of the variables with MEI and precipitation.
Infectious Diseases Report and Wolbachia Program Reporting
Cases of influenza, dengue, hepatitis A and leptospirosis were gathered between 2017 and 2023 from the CHT’s database which compiles all cases from the territory for healthcare and social services department. Cases were geographically related to one of the 33 communal districts of New Caledonia using the social insurance ZIP code and declared address. When this information was missing, cases were excluded from geographic analysis. All known suspected cases of leptospirosis, dengue, and HAV were confirmed either by serological test or PCR. Influenza cases were declared according to the syndromic surveillance of the sentinel network or biological diagnosis in the CHT laboratory (only biologically confirmed cases were included in the analysis). The number of reported diseases cases and the ratio per 100,000 inhabitants using a one-month moving average in each communal district was used for statistical analysis.
The Wolbachia program was included in the analysis for representation and descriptive purposes (see Supplementary Materials) [20]. The Wolbachia program (World Mosquito Program™), was launched in Noumea in July 2019, then extended to the surrounding suburban cities in 2022-2023 (https://www.worldmosquitoprogram.org/wmp-en-nouvelle-caledonie). The release of Ae. aegypti mosquitoes infected by Wolbachia aimed to reduce the burden of vector-borne diseases. Wolbachia is a Gram-negative bacterium mainly transmitted vertically negatively associated with arboviruses transmission. This bacterium can manipulate the host reproduction in order to maximize its maternal transmission through the eggs. Combining their ability to invade the host population and to reduce the transmission of viruses, Wolbachia has been deployed to prevent the transmission of arboviruses.
Socio-Demographic and Economic Variables
The 2019 census of New-Caledonia's population provided information on the demographic, sociological and economic aspects (https://www.isee.nc/publications/la-nouvelle-caledonie-en-cartes-et-en-chiffres/donnees-du-recensement-2019-en-open-data). Data for the communal level were obtained from https://www.isee.nc/publications/la-nouvelle-caledonie-en-cartes-et-en-chiffres/cartographie-dynamique. Health care facility spatial distribution was gathered based on the 2024 New Caledonia Government publications (https://nouvelle-caledonie.opendatasoft.com/explore/dataset/situation_etablissements_sante/). Accounting for the different pathogenesis and exploratory results, were kept in the analysis: Percentage of inhabitants who walks as major transport mean, Percentage of inhabitants with water supply, Percentage of inhabitants with a BEPC (first grade diploma possible) or lower and number of healthcare facilities per habitant.
Statistical Analysis
Statistical analyses were performed using R software (version 4.3.3, R Foundation) and QGIS 3.34. Categorical variables were expressed as numbers (percentages), with the Chi-squared or Fisher exact test applied as appropriate. Continuous variables were expressed as mean (95% Confidence Interval), and the Shapiro test was used to test normality. A p-value <0.05 was considered statistically significant.
Principal Component Analysis (PCA) was used to explore socio-demographic and economic variables from the 2019 census, selecting variables according variance and relevance to disease pathogensis (see Supplementary Figure S2).
We used the General Additive Mixed Model (GAMM) to represent the associations of precipitations from the satellite measurement (monthly average measurements interpolated on a daily basis for each communal district), the MEI, time (as a spline effect) and the communal district as random effect as part of the baseline model. Time was included as a penalized spline in the GAMM to flexibly model non-linear temporal trends in the outcome, allowing adjustment for long-term trends and seasonality without imposing a predefined functional form (see Supplementary Materials for more information). The determination of specific lag was described in the Supplementary Materials. We implemented these GAMM models provided that, the number of cases was sufficient in an appropriate number of communal districts to avoid overdispersion, along most of the study period, and the cases were appropriately linked to an address to prevent location biases. When the number of cases or spatial coverage was insufficient to reliably estimate random effects, a simpler General Additive Model (GAM) without random effects was applied at the territorial level to ensure model stability and avoid overdispersion or location-related bias.
Distributions of infectious disease incidences were assumed to follow a Tweedie distribution (special case of exponential dispersion models that fit data with excess zeros) [21]. Also, Tweedie distribution was known to accommodate a wide range of skewness and covariance structures for discrete and continuous longitudinal data [22]. The model was used to consider the communal district as a random effect. Variables were selected through backward stepwise removal based on pathophysiological relevance, p<0.05, and the Akaike Information Criterion (AIC). Final model estimates were exponentiated to report odds ratios (ORs).
3. Results
Overall, from 2017 to 2023, 15,024 positive samples were analysed. There were 878 cases of leptospirosis, 162 of Hepatitis A, 6607 cases of dengue and 2,022 cases of influenza were biologically confirmed among the 7,377 cases declared (see Figure 1).
Meteorological and Socio-Demographic Variable
Rainfall and temperature were higher after the first lockdown the 20th of March (see Supplementary Materials, Supplementary, Figure S1, panel A and B). The ENSO index MEI showed a pattern towards La-Ninã phenomenon during the Island lockdown (Supplementary Figure S1 panel C).
The socio-economic variables included in the analysis were explored firstly using a PCA (Supplementary Figure S2). The variables that showed a maximum of variances were related to a socio-economical gradient, education, and whether the inhabitants were living in a tribe or not. Therefore, kept in the analysis: Percentage of inhabitants who walks as major transport mean, Percentage of inhabitants with water supply, Percentage of inhabitants with a BEPC (first grade diploma possible) or lower and number of healthcare facilities per habitant.
Infectious Agents
The number of cases, and the yearly incidence per 100 000 inhabitants is displayed in the Table 1. The spatial distributions of the incidences are shown in the Figure 1. The Table 2 shows the final modelling using GAMM, the Supplementary Table S1 shows the complete variables modelling used before stepwise reductions. The Supplementary Figure S3 escribed the prediction models along the cases distribution.
Influenza
Seasonal influenza epidemics followed a wave pattern from 2017 to 2020, which completely disappeared during the country lockdown" (2020 and 2021). Only biologically confirmed cases were included. Following the reopening of the country in December 2021 after the lockdown, the wave pattern of the influenza epidemics displayed a steeper raise for both 2022 and 2023 (Figure 2 panel A). Therefore, we have modelled the epidemic with the exclusion of this period. Using a GAMM analysis over only three years, the model showed that the cases were likely to lower with the increase of rainfall (OR: 0.7, 95% CI (0.6 - 0.8), p-value <0.0001) while the model was only dependent of randomness after the border opening (Table 2).
Dengue
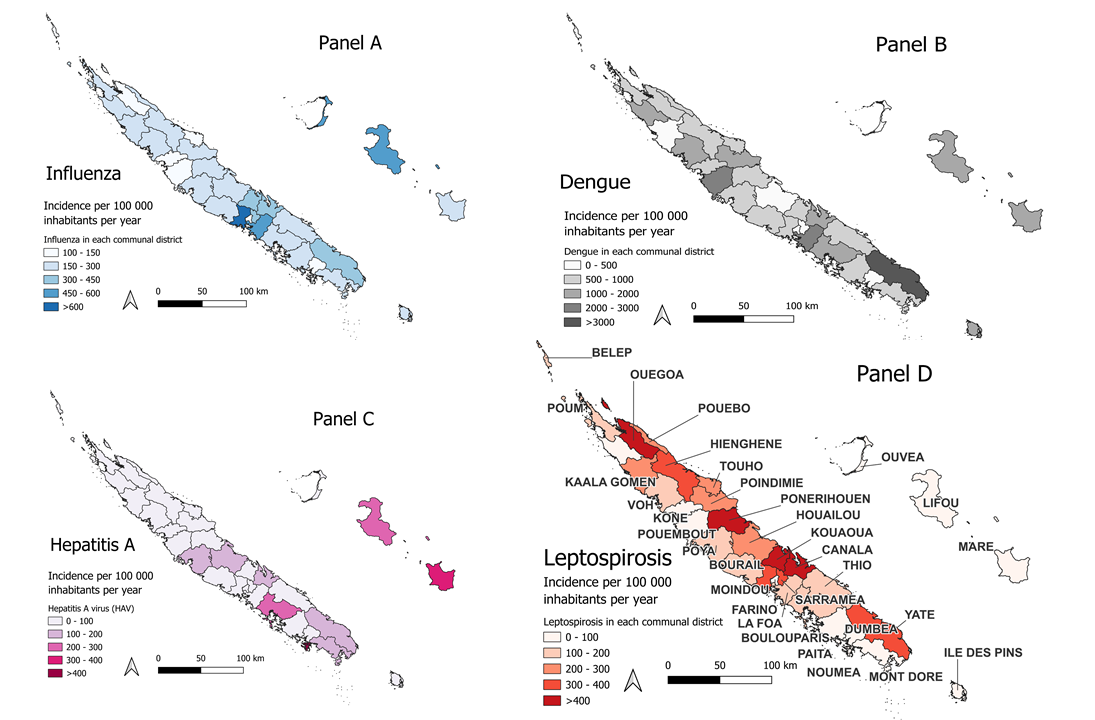
The spatial distribution of dengue incidence is presented in Figure 1B, which illustrates the annual incidence rate per 100,000 inhabitants across communal districts over the study period (2017–2020). The temporal trends are detailed in Figure 2. A one-month lag was found to fit best the model and in coherence with the literature[23].
No outbreaks were recorded after 2020, coinciding with both the implementation of COVID-19-related travel restrictions and the first year following the deployment of the Wolbachia program in Nouméa. Consequently, the analysis was restricted to the 2017–2020 period.
A negative correlation was observed between dengue incidence and the MEI (Table 2). However, the available data lacked the spatial resolution required to model the impact of Wolbachia at the archipelago level. As such, this parameter was included for illustrative purposes only (Supplementary Figure S4).
Hepatitis A Virus (HAV)
Figure 1 illustrates the spatial distribution of the average incidence of Hepatitis A. During the 2018 epidemic, cases were predominantly concentrated on the island of Maré.
A time-series analysis of indexed Hepatitis A cases, combined with mean precipitation data across the territory, revealed a significant correlation when modelled using a Generalized Additive Model (GAM) (correlation coefficient: 0.52; Figure 2, panel B).
Consistently, the final model results (Table 2) indicate that the risk of Hepatitis A virus (HAV) transmission may be influenced by large-scale oceanic trends, as reflected by the MEI.
Leptospirosis
The distribution of the cases was predominantly associated to the eastern coast and northern part of the archipelago with very few cases in the Loyalty Island province (Lifou, Ouvéa and Maré, eastern from the main Island), Belep (Northern Province), and the Île des Pins (South Province), likely due to contamination on the main island. (Figure 1 panel D). These islands were excluded from the final model. Temporally, the majority of cases occurred between 2020 and 2023 (Figure 2).
The multivariate analysis identified several socio-economic factors significantly associated with leptospirosis incidence. The cumulative role of precipitation was detected after 28 to 42 days after rainfall peaks (see Supplementary Materials). Specifically, a higher percentage of the population with lower educational attainment (defined as the absence of or a low final level in the school system) was correlated with increased leptospirosis rates (Table 2). Conversely, greater household access to drinkable water was associated with a reduced number of cases, highlighting a clear socio-economic gradient in disease risk.
4. Discussion
The unique geographical and socio-demographic context of New Caledonia, combined with the COVID-19 pandemic and the ENSO climatic event, provided a quasi-experimental setting to study infectious disease dynamics. The archipelago-wide lockdown, resulting in a zero-COVID-19 context, coincided with an extended La Niña episode characterized by unusually heavy rainfalls. A key originality of this study lies in the simultaneous analysis of four pathogens with distinct transmission pathways, used as a counterfactual framework to disentangle the respective roles of climate variability, mobility restriction, and social determinants within ongoing global health transitions.
Our findings showed that some environmentally transmitted diseases, such as leptospirosis, were significantly associated with precipitations during ENSO-related climatic events, independently of international travel restrictions but modulated by socio-economic factors such as education and water supply. These results emphasize the value of geographic data science in healthcare system assessment[24]. In contrast, some airborne and vector-borne diseases, including influenza and dengue, declined during the lockdown but only influenza resurged after reopening the borders[25,26,27]. This differential response highlights the complex interactions between environmental factors, immunity, travel, and pathogen-specific transmission dynamics. Meanwhile, Hepatitis A, a waterborne infection, disappeared with the diminution of the La Niña event.
Our study revealed several key observations.
Influenza epidemics disappeared during the borders closure and re-emerged with a steeper curve after the reopening. This pattern aligns with observations from other island settings, such as Australia and New Zealand, where influenza activity surged after lifting of travel restrictions [26,28]. Our spatial analysis showed that cases were associated with precipitations before the lockdown, but not thereafter. This temporal shift emphasized the impact of lockdown on immunity consistently with global patterns key contribution of this study is the identification of a decoupling between influenza transmission and ENSO-related meteorological event (here, La Niña).
Dengue declined after the closure, and no epidemic was recorded during the first years after the closure. Furthermore, the introduction of Wolbachia in July 2019 may have influenced the kinetics, along with lasting immunity due to previous viral circulation [20]. The isolation of the archipelago might have enhanced the effectiveness of the Wolbachia program, at least in the capital region of Noumea and surroundings [25,29,30]. However, the time lag of our study may limit the generalisability of the results. Disruptions in dengue transmission were reported in South-East Asia during pandemics[31]. At the time of the writing (early 2025), no epidemic was reported in New Caledonia while Fiji, Tonga, and French Polynesia had to face dengue outbreaks (https://www.spc.int/phd/epidemics/ ) contrasting with historical data [29,32].
Hepatitis A surged during the period of border closure and then declined, describing an epidemic pattern aligned with large-scale oceanic variability and precipitations. This trajectory contrasted with other continental or island settings, where hepatitis A decreased during the COVID-19 pandemic [33,34]. Hepatitis A is associated with inadequate sanitation conditions. To date, only one previous article on HAV in New Caledonia has been showed epidemic patterns consistent with our findings [35]. These results emphasized the need to increase epidemiological studies in isolated island settings , particularly given the very high seroprevalence (95%) reported in regions such as Micronesia or Marshal Islands, where distinct endemicity patterns have been observed [36]. Triggers of endemicity in low-lying island contexts remains poorly understood.
Leptospirosis cases were predominantly associated with the eastern coast and northern regions, in correlation with heavy rainfall during La Niña [14]. However, unlike rainfall, the MEI index was not consistently associated with leptospirosis outbreaks across all models [14,37,38]. A one month-lag period between with rainfalls and cases provided the best predictive performance consistently with recent literature[39]. Socio-economic inequalities - particularly in access to water and education - were significantly associated with disease distribution. These highlights both the challenges in accessing healthcare and the need for socio-culturally appropriate prevention programmes.
Environmental exposure emerged as a central determinant. Infectious diseases related to water exposure and contact with contaminated soil, such as Hepatitis A and leptospirosis, were more sensitive to climatic events independently of travel-related introductions. Moreover, cases were higher in areas with lower socio-economic status, as indicated by limited access to water, electricity, or transport[1,40]. These areas included the East coast and Northern Province for leptospirosis and the Loyalty Islands Province for Hepatitis A.
Future climate projections suggest an intensification of ENSO events [41,42], potentially amplifying the threats of emerging and re-emerging diseases [43]. Climatic events driven by global warming, such as ENSO, are likely to exacerbate the threats posed by emerging and re-emerging diseases. Although, we acknowledge that time line was too short to define clear climatic links.
Social disparities were explored through various factors in our study. Only influenza appeared to be independent from the social indicators. The civil unrest in New Caledonia in May 2024, triggered by social disparities, ethnic divisions and colonial inequities, further ighlights the urgency of addressing structural determinants of health. Education, mobility, and access to safe water act as proxies for these disparities and underscore the need for community-centered, equity-oriented health strategies [1,44].
Although clinical outcomes and immunization histories were not assessed, this study provides insights into disease circulation before, during, and after territorial isolation. Our analysis of dengue circulation suggest a combined role of acquired immunity and biocontrol measures, along with border closures in limiting outbreaks [25]. In contrast, for influenza, the two-year absence of influenza exposure was associated with an unusual increase in cases upon reopening, independent of meteorological factors, emphasizing the importance of timely immunization strategies and the kinetics of immunity loss.
This study has limitations typical of retrospective hospital database analyses. Using postal codes as proxies for infection sites may introduce bias, and improvements in diagnostic methods over time could affect case detection. However, the consistent definition of cases for each disease ensures the robustness of our findings. The meteorological data may not fully capture local variations. Further analysis is needed to better characterize the impact of other meteorological parameters, such as temperature, on disease transmission. Future studies should also incorporate network analyses to better characterize human interactions across all diseases and non-human transmission pathways..
5. Conclusions
The New Caledonia lockdown, coinciding with the prolonged 2020-2023 La Niña event [45], provided a unique setting to study disease dynamics independent of travel-related introductions. Environmentally and waterborne diseases increased during periods of higher precipitation attributed to La Niña and the MEI, while influenza resurged after reopening, highlighting the effects of island isolation. Community-level factors and healthcare access remain critical in mitigating climate-sensitive disease risks. Targeted, locally driven interventions are essential to strengthen culturally informed and equitable health strategies.
Supplementary Materials
The following supporting information can be downloaded at the website of this paper posted on Preprints.org.
Author Contributions
Conceptualization: PHM, ACG, MM;Data curation: PHM, ACG, CC, AB, CM; Formal Analysis: PHM, ACG, MS, MD, CM; Investigation: PHM, ACG, CC, AB ; Methodology: PHM, MM, NR, AF, CM ; Project administration: PHM ;Resources: PHM, NR, MS, MM , ACG,AB,CC, MDR, CM ; Software: PHM, NR, MM, CM ; Supervision: PHM, NR, MM,AF; Validation: PHM, NR, MM, AF, MS, CM ; Visualization: PHM, NR; Writing – original draft: PHM, NR, MM, ACG ;Writing – review and editing: all authors contributed.
Funding
“This research received no external funding”.
Institutional Review Board Statement
This retrospective database study followed the Helsinki recommendations and was accepted by the Centre-Hospitalier-Territorial Gaston-Bourret de Nouvelle-Calédonie (CHT) research board in 2021, with the purpose to start the analysis with the years until the end of 2023.
Informed Consent Statement
“Patient consent was waived due to the retrospective and non interventional settings according to the French and New-Caledonian law”.
Data Availability Statement
we are prepared to share our data according to French and New-Caledonian laws on health data upon specific request to PHM (PHMoury@chu-grenoble.fr).
Conflicts of Interest
“The authors declare no conflicts of interest.”.
Abbreviations
The following abbreviations are used in this manuscript:
CHT: Centre-Hospitalier-Territorial Gaston-Bourret de Nouvelle-Calédonie
CI: Confidence Interval
ENSO: El Niño/Southern Oscillation (ENSO)
GAM: General Additive Model
GAMM: General Additive Mixed Model
HAV: Hepatitis A virus
MEI: bi-monthly Multivariate El Niño/Southern Oscillation (ENSO) index
OR: Odds Ratio
PCA: Primary component analysis
PICTS : Pacific Islands Countries and Territories
| MDPI | Multidisciplinary Digital Publishing Institute |
| DOAJ | Directory of open access journals |
| TLA | Three letter acronym |
| LD | Linear dichroism |
References
- Moury, P.-H.; Tromhae, M.; Cazorla, C.; Série, M.; Flahault, A.; Couadau, E.; Fleury, C.; Mangeas, M.; De Greslan, T. Colonial Transition as a Major Mediator of Global Health Transition: Lessons from the 2024 New Caledonia Crisis. J. Glob. Health 2025, 15, 03004. [Google Scholar] [CrossRef] [PubMed]
- Kerbaj, J.; Cazorla, C.; De Greslan, T.; Serie, M.; Gourinat, A.-C.; Marot, B. COVID-19: The New Caledonia Experience. Clin. Infect. Dis. Off. Publ. Infect. Dis. Soc. Am. 2020, ciaa600. [Google Scholar] [CrossRef]
- Moury, P.-H.; Ochida, N.; Motiejunaite, J.; Collart, V.; Série, M.; Gervolino, S.; Mangeas, M.; Bouvier, J.-B.; Couadau, E.; Mebazaa, A.; et al. Impact of Lockdown on Cardiovascular Disease Hospitalizations in a Zero-COVID-19 Country. Public Health 2023, 217, 98–104. [Google Scholar] [CrossRef] [PubMed]
- Moury, P.-H.; Gourinat, A.-C.; Riou, O.; Laumond, S.; Dupont-Rouzeyrol, M.; Cazorla, C.; Mangeas, M. Successful COVID-19 Elimination after an Alpha Variant Outbreak in a “Safe Travel Zone.”. Travel Med. Infect. Dis. 2021, 44, 102202. [Google Scholar] [CrossRef]
- Ochida, N.; Dupont-Rouzeyrol, M.; Moury, P.-H.; Demaneuf, T.; Gourinat, A.-C.; Mabon, S.; Jouan, M.; Cauchemez, S.; Mangeas, M. Evaluating the Strategies to Control SARS-CoV-2 Delta Variant Spread in New Caledonia, a Zero-COVID Country until September 2021. IJID Reg. 2023, 8, 64–70. [Google Scholar] [CrossRef]
- Murphy, B.F.; Power, S.B.; McGree, S. The Varied Impacts of El Niño–Southern Oscillation on Pacific Island Climates. J. Clim. 2014, 27, 4015–4036. [Google Scholar] [CrossRef]
- Moron, V.; Barbero, R.; Robertson, A.W. Subseasonal-to-Interannual Variability of Rainfall over New Caledonia (SW Pacific). Clim. Dyn. 2016, 46, 2449–2468. [Google Scholar] [CrossRef]
- Moron, V.; Barbero, R.; Robertson, A.W. Subseasonal-to-Interannual Variability of Rainfall over New Caledonia (SW Pacific). Clim. Dyn. 2016, 46, 2449–2468. [Google Scholar] [CrossRef]
- Inizan, C.; Tarantola, A.; O’Connor, O.; Mangeas, M.; Pocquet, N.; Forfait, C.; Descloux, E.; Gourinat, A.-C.; Pfannstiel, A.; Klement-Frutos, E.; et al. Dengue in New Caledonia: Knowledge and Gaps. Trop. Med. Infect. Dis. 2019, 4, 95. [Google Scholar] [CrossRef]
- Ochida, N.; Mangeas, M.; Dupont-Rouzeyrol, M.; Dutheil, C.; Forfait, C.; Peltier, A.; Descloux, E.; Menkes, C. Modeling Present and Future Climate Risk of Dengue Outbreak, a Case Study in New Caledonia. Environ. Health 2022, 21, 20. [Google Scholar] [CrossRef]
- Western Pacific Region Global Influenza Surveillance and Response System Epidemiological and Virological Characteristics of Influenza in the Western Pacific Region of the World Health Organization, 2006-2010. PloS One 2012, 7, e37568. [CrossRef]
- Koff, R.S. Hepatitis A. The Lancet 1998, 351, 1643–1649. [Google Scholar] [CrossRef]
- Goarant, C.; Laumond-Barny, S.; Perez, J.; Vernel-Pauillac, F.; Chanteau, S.; Guigon, A. Outbreak of Leptospirosis in New Caledonia: Diagnosis Issues and Burden of Disease. Trop. Med. Int. Health TM IH 2009, 14, 926–929. [Google Scholar] [CrossRef] [PubMed]
- Douchet, L.; Menkes, C.; Herbreteau, V.; Larrieu, J.; Bador, M.; Goarant, C.; Mangeas, M. Climate-Driven Models of Leptospirosis Dynamics in Tropical Islands from Three Oceanic Basins. PLoS Negl. Trop. Dis. 2024, 18, e0011717. [Google Scholar] [CrossRef]
- Findlater, A.; Bogoch, I.I. Human Mobility and the Global Spread of Infectious Diseases: A Focus on Air Travel. Trends Parasitol. 2018, 34, 772–783. [Google Scholar] [CrossRef] [PubMed]
- Mora, C.; McKenzie, T.; Gaw, I.M.; Dean, J.M.; von Hammerstein, H.; Knudson, T.A.; Setter, R.O.; Smith, C.Z.; Webster, K.M.; Patz, J.A.; et al. Over Half of Known Human Pathogenic Diseases Can Be Aggravated by Climate Change. Nat. Clim. Change 2022, 12, 869–875. [Google Scholar] [CrossRef]
- Barbero, R.; Moron, V. Seasonal to Decadal Modulation of the Impact of El Niño–Southern Oscillation on New Caledonia (SW Pacific) Rainfall (1950–2010). J. Geophys. Res. Atmospheres 2011, 116. [Google Scholar] [CrossRef]
- Kerbaj, J.; Cazorla, C.; De Greslan, T.; Serie, M.; Gourinat, A.-C.; Marot, B. COVID-19: The New Caledonia Experience. Clin. Infect. Dis. Off. Publ. Infect. Dis. Soc. Am. 2020, ciaa600. [Google Scholar] [CrossRef]
- Zhang, T.; Hoell, A.; Perlwitz, J.; Eischeid, J.; Murray, D.; Hoerling, M.; Hamill, T.M. Towards Probabilistic Multivariate ENSO Monitoring. Geophys. Res. Lett. 2019, 46, 10532–10540. [Google Scholar] [CrossRef]
- Utarini, A.; Indriani, C.; Ahmad, R.A.; Tantowijoyo, W.; Arguni, E.; Ansari, M.R.; Supriyati, E.; Wardana, D.S.; Meitika, Y.; Ernesia, I.; et al. Efficacy of Wolbachia-Infected Mosquito Deployments for the Control of Dengue. N. Engl. J. Med. 2021, 384, 2177–2186. [Google Scholar] [CrossRef]
- Kurz, C.F. Tweedie Distributions for Fitting Semicontinuous Health Care Utilization Cost Data. BMC Med. Res. Methodol. 2017, 17, 171. [Google Scholar] [CrossRef]
- Ma, R.; Yan, G.; Hasan, M.T. Tweedie Family of Generalized Linear Models with Distribution-Free Random Effects for Skewed Longitudinal Data. Stat. Med. 2018, 37, 3519–3532. [Google Scholar] [CrossRef] [PubMed]
- Fletcher, C.; Moirano, G.; Alcayna, T.; Rollock, L.; Van Meerbeeck, C.J.; Mahon, R.; Trotman, A.; Boodram, L.-L.; Browne, T.; Best, S.; et al. Compound and Cascading Effects of Climatic Extremes on Dengue Outbreak Risk in the Caribbean: An Impact-Based Modelling Framework with Long-Lag and Short-Lag Interactions. Lancet Planet. Health 2025, 9, 101279. [Google Scholar] [CrossRef] [PubMed]
- Weinberger, D.; Baroux, N.; Grangeon, J.-P.; Ko, A.I.; Goarant, C. El Niño Southern Oscillation and Leptospirosis Outbreaks in New Caledonia. PLoS Negl. Trop. Dis. 2014, 8, e2798. [Google Scholar] [CrossRef]
- Li, N.; Feng, Y.; Vrancken, B.; Chen, Y.; Dong, L.; Yang, Q.; Kraemer, M.U.G.; Pybus, O.G.; Zhang, H.; Brady, O.J.; et al. Assessing the Impact of COVID-19 Border Restrictions on Dengue Transmission in Yunnan Province, China: An Observational Epidemiological and Phylogenetic Analysis. Lancet Reg. Health - West. Pac. 2021, 14, 100259. [Google Scholar] [CrossRef] [PubMed]
- O’Neill, G.K.; Taylor, J.; Kok, J.; Dwyer, D.E.; Dilcher, M.; Hua, H.; Levy, A.; Smith, D.; Minney-Smith, C.A.; Wood, T.; et al. Circulation of Influenza and Other Respiratory Viruses during the COVID-19 Pandemic in Australia and New Zealand, 2020–2021. West. Pac. Surveill. Response J. WPSAR 2023, 14, 1–9. [Google Scholar] [CrossRef]
- Taylor-Salmon, E.; Hill, V.; Paul, L.M.; Koch, R.T.; Breban, M.I.; Chaguza, C.; Sodeinde, A.; Warren, J.L.; Bunch, S.; Cano, N.; et al. Travel Surveillance Uncovers Dengue Virus Dynamics and Introductions in the Caribbean. Nat. Commun. 2024, 15, 3508. [Google Scholar] [CrossRef]
- Huang, Q.S.; Turner, N.; Wood, T.; Anglemyer, A.; McIntyre, P.; Aminisani, N.; Dowell, T.; Trenholme, A.; Byrnes, C.; Balm, M.; et al. Impact of the COVID-19 Related Border Restrictions on Influenza and Other Common Respiratory Viral Infections in New Zealand. Influenza Other Respir. Viruses 2024, 18, e13247. [Google Scholar] [CrossRef]
- Zellweger, R.M.; Cano, J.; Mangeas, M.; Taglioni, F.; Mercier, A.; Despinoy, M.; Menkès, C.E.; Dupont-Rouzeyrol, M.; Nikolay, B.; Teurlai, M. Socioeconomic and Environmental Determinants of Dengue Transmission in an Urban Setting: An Ecological Study in Nouméa, New Caledonia. PLoS Negl. Trop. Dis. 2017, 11, e0005471. [Google Scholar] [CrossRef]
- Teurlai, M.; Menkès, C.E.; Cavarero, V.; Degallier, N.; Descloux, E.; Grangeon, J.-P.; Guillaumot, L.; Libourel, T.; Lucio, P.S.; Mathieu-Daudé, F.; et al. Socio-Economic and Climate Factors Associated with Dengue Fever Spatial Heterogeneity: A Worked Example in New Caledonia. PLoS Negl. Trop. Dis. 2015, 9, e0004211. [Google Scholar] [CrossRef]
- Chen, Y.; Li, N.; Lourenço, J.; Wang, L.; Cazelles, B.; Dong, L.; Li, B.; Liu, Y.; Jit, M.; Bosse, N.I.; et al. Measuring the Effects of COVID-19-Related Disruption on Dengue Transmission in Southeast Asia and Latin America: A Statistical Modelling Study. Lancet Infect. Dis. 2022, 22, 657–667. [Google Scholar] [CrossRef]
- Inizan, C.; Minier, M.; Prot, M.; O’Connor, O.; Forfait, C.; Laumond, S.; Marois, I.; Biron, A.; Gourinat, A.-C.; Goujart, M.-A.; et al. Viral Evolution Sustains a Dengue Outbreak of Enhanced Severity. Emerg. Microbes Infect. 2021, 10, 536. [Google Scholar] [CrossRef]
- Rzymski, P.; Zarębska-Michaluk, D.; Genowska, A.; Tyszko, P.; Strukcinskiene, B.; Flisiak, R. Trends of Hepatitis A Virus Infection in Poland: Assessing the Potential Impact of the COVID-19 Pandemic and War in Ukraine. Viruses 2024, 16, 469. [Google Scholar] [CrossRef] [PubMed]
- Murakoshi, K.; Mori, H.; Prasertbun, R.; Valenti, S.; Krokva, D.; Remez, D.; Mahittikorn, A.; Hadano, Y.; Naito, T. Hepatitis A Epidemics in Japan, France, and Thailand from 2007 to 2021, Highlighting a Post-COVID-19 Decline. Sci. Rep. 2025, 15, 7228. [Google Scholar] [CrossRef] [PubMed]
- Berlioz-Arthaud, A.; Barny, S.; Yvon, J.F.; Roque-Afonso, A.M.; Dussaix, E. Laboratory based hepatitis A surveillance in New Caledonia: from an endemic to an epidemic pattern (1986-2007). Bull. Soc. Pathol. Exot. 1990 2008, 101, 336–342. [Google Scholar] [CrossRef]
- Fischer, G.E.; Thompson, N.; Chaves, S.S.; Bower, W.; Goldstein, S.; Armstrong, G.; Williams, I.; Bialek, S. The Epidemiology of Hepatitis A Virus Infections in Four Pacific Island Nations, 1995–2008. Trans. R. Soc. Trop. Med. Hyg. 2009, 103, 906–910. [Google Scholar] [CrossRef]
- Bierque, E.; Thibeaux, R.; Girault, D.; Soupé-Gilbert, M.-E.; Goarant, C. A Systematic Review of Leptospira in Water and Soil Environments. PloS One 2020, 15, e0227055. [Google Scholar] [CrossRef]
- Thibeaux, R.; Genthon, P.; Govan, R.; Selmaoui-Folcher, N.; Tramier, C.; Kainiu, M.; Soupé-Gilbert, M.-E.; Wijesuriya, K.; Goarant, C. Rainfall-Driven Resuspension of Pathogenic Leptospira in a Leptospirosis Hotspot. Sci. Total. Environ. 2024, 911, 168700. [Google Scholar] [CrossRef]
- Govan, R.; Scherrer, R.; Fougeron, B.; Laporte-Magoni, C.; Thibeaux, R.; Genthon, P.; Fournier-Viger, P.; Goarant, C.; Selmaoui-Folcher, N. Spatio-Temporal Risk Prediction of Leptospirosis: A Machine-Learning-Based Approach. PLoS Negl. Trop. Dis. 2025, 19, e0012755. [Google Scholar] [CrossRef] [PubMed]
- Moury, P.-H. Colonial Transitions in Health. Ethics Med. Public Health 2026, 34, 101217. [Google Scholar] [CrossRef]
- Cai, W.; Lengaigne, M.; Borlace, S.; Collins, M.; Cowan, T.; McPhaden, M.J.; Timmermann, A.; Power, S.; Brown, J.; Menkes, C.; et al. More Extreme Swings of the South Pacific Convergence Zone Due to Greenhouse Warming. Nature 2012, 488, 365–369. [Google Scholar] [CrossRef]
- Cai, W.; Wang, G.; Santoso, A.; McPhaden, M.J.; Wu, L.; Jin, F.-F.; Timmermann, A.; Collins, M.; Vecchi, G.; Lengaigne, M.; et al. Increased Frequency of Extreme La Niña Events under Greenhouse Warming. Nat. Clim. Change 2015, 5, 132–137. [Google Scholar] [CrossRef]
- Haines, A.; Lam, H.C.Y. El Niño and Health in an Era of Unprecedented Climate Change. The Lancet 2023. [Google Scholar] [CrossRef] [PubMed]
- Baroux, N.; Maire, L.; Cadic, L.; Lemaitre, A.-F.; Borceux, P.; Glasman, B. Riots in New Caledonia: Impact of Constrained Management on Peritoneal Dialysis Patients. Bull. Dial. À Domic. 2024, 7, 89–99. [Google Scholar] [CrossRef]
- Geng, T.; Jia, F.; Cai, W.; Wu, L.; Gan, B.; Jing, Z.; Li, S.; McPhaden, M.J. Increased Occurrences of Consecutive La Niña Events under Global Warming. Nature 2023, 619, 774–781. [Google Scholar] [CrossRef]
Figure 1.
Spatial distribution of influenza, hepatitis A virus, dengue and leptospirosis in New Caledonia, at communal district level and averaged over the 2017 to 2023 period. Influenza (biologically confirmed), (B) dengue, (C) hepatitis A virus, and (D) leptospirosis. Map in (D) show communal district names.

Figure 2.
Evolution of cases and moving 7 days averages of influenza, hepatitis A virus HAV, dengue and leptospirosis with the precipitations over the New-Caledonia. Panel A, influenza cases biologically confirmed and the seven rolling day average of the cases (light blue). Panel B, Dengue (black) and rain evolution. Panel C, Hepatitis A virus (HAV), the first cases were diagnosed in 2018 (Purple). Panel D, leptospirosis cases in red and the precipitations. Precipitation was shown in blue in each graph."


Table 1.
Cases and annual incidences of influenza (biologically confirmed), dengue, Hepatitis A virus and leptospirosis during the three-time period: before, during and after the border closure (reported in days of duration and by yearly means in the incidences calculation).
Table 1.
Cases and annual incidences of influenza (biologically confirmed), dengue, Hepatitis A virus and leptospirosis during the three-time period: before, during and after the border closure (reported in days of duration and by yearly means in the incidences calculation).
| Period | Influenza | Dengue | Hepatitis viral A | Leptospirosis | ||||
|---|---|---|---|---|---|---|---|---|
| Border Status Period | Number of cases | Incidence for 100 000 habitants/year | Number of cases | Incidence for 100 000 habitants/year | Number of cases | Incidence for 100 000 habitants/year | Number of cases | Incidence for 100 000 habitants |
| Before (1176 days) | 1,072 | 123 | 7,213 | 829 | 14 | 2 | 242 | 28 |
| Closed (649 days) | 0 | 0 | 153 | 32 | 144 | 30 | 256 | 53 |
| After (729 days) | 950 | 176 | 11 | 2 | 7 | 2 | 380 | 71 |
Table 2.
Fixed effects of GAMM for Influenza, Dengue, Hepatitis A virus (HAV), and Leptospirosis epidemic using communal district as random effect.
Table 2.
Fixed effects of GAMM for Influenza, Dengue, Hepatitis A virus (HAV), and Leptospirosis epidemic using communal district as random effect.
| Variable | Coefficient | Standard error | Odds Ratio 95%CI | p-value | |
|---|---|---|---|---|---|
| Influenza before border closure | |||||
| Mean daily precipitation over each commune (mm/d) | -0.4 | 0.1 | 0.7 (0.6 - 0.8) | <0.001 | |
| Influenza after border closure | |||||
| Mean daily precipitation over each commune (mm/d) | 0.2 | 0.2 | 1.2 (0.8 - 1.8) | 0.301 | |
| Dengue before border closure | |||||
| MEI index | -0.3 | 0.1 | 0.78 (0.6 – 1) | 0.049 | |
| Hepatitis A | |||||
| MEI index | 0.6 | 0.3 | 1.8 (1 - 3.3) | 0.042 | |
| Percentage of inhabitants with a BEPC or lower | -0.1 | 0.0 | 0.9 (0.9 - 1) | 0.052 | |
| Leptospirosis | |||||
| Mean daily precipitation over each commune (mm/d) averaged from weekly precipitation | |||||
| Precipitation week 1 | -0.04 | 0.05 | 0.96 (0.9-1.1) | 0.46 | |
| Precipitation week 2 | 0.11 | 0.05 | 1.12 (1-1.23) | 0.017 | |
| Precipitation week 3 | -0.11 | 0.05 | 0.90 (0.8-1) | 0.025 | |
| Precipitation week 4 | 0.05 | 0.02 | 1.05 (1-1.1) | 0.037 | |
| Precipitation week 5 | 0.11 | 0.02 | 1.12 (1.1-1.2) | <0.001 | |
| Percentage of inhabitants who walks as major transport mean | 0.3 | 0.2 | 1.33 (1 – 1.9) | 0.08 | |
| Percentage of inhabitants with water supply | -0.4 | 0.1 | 0.7 (0.5 - 0.9) | 0.015 | |
| Percentage of inhabitants with a BEPC or lower | 0.04 | 0.01 | 1.04 (1.02 – 1.1) | 0.008 | |
| Note: BEPC: first grade diploma obtained at 14-15years old. Odds ratios were calculated based on the exponent of the coefficient. CI: Confidence Interval at 95%; MEI: Multivariate El Niño/Southern Oscillation (ENSO) index | |||||
Disclaimer/Publisher’s Note: The statements, opinions and data contained in all publications are solely those of the individual author(s) and contributor(s) and not of MDPI and/or the editor(s). MDPI and/or the editor(s) disclaim responsibility for any injury to people or property resulting from any ideas, methods, instructions or products referred to in the content. |
© 2026 by the authors. Licensee MDPI, Basel, Switzerland. This article is an open access article distributed under the terms and conditions of the Creative Commons Attribution (CC BY) license (http://creativecommons.org/licenses/by/4.0/).
Copyright: This open access article is published under a Creative Commons CC BY 4.0 license, which permit the free download, distribution, and reuse, provided that the author and preprint are cited in any reuse.


