Submitted:
30 March 2026
Posted:
31 March 2026
You are already at the latest version
Abstract
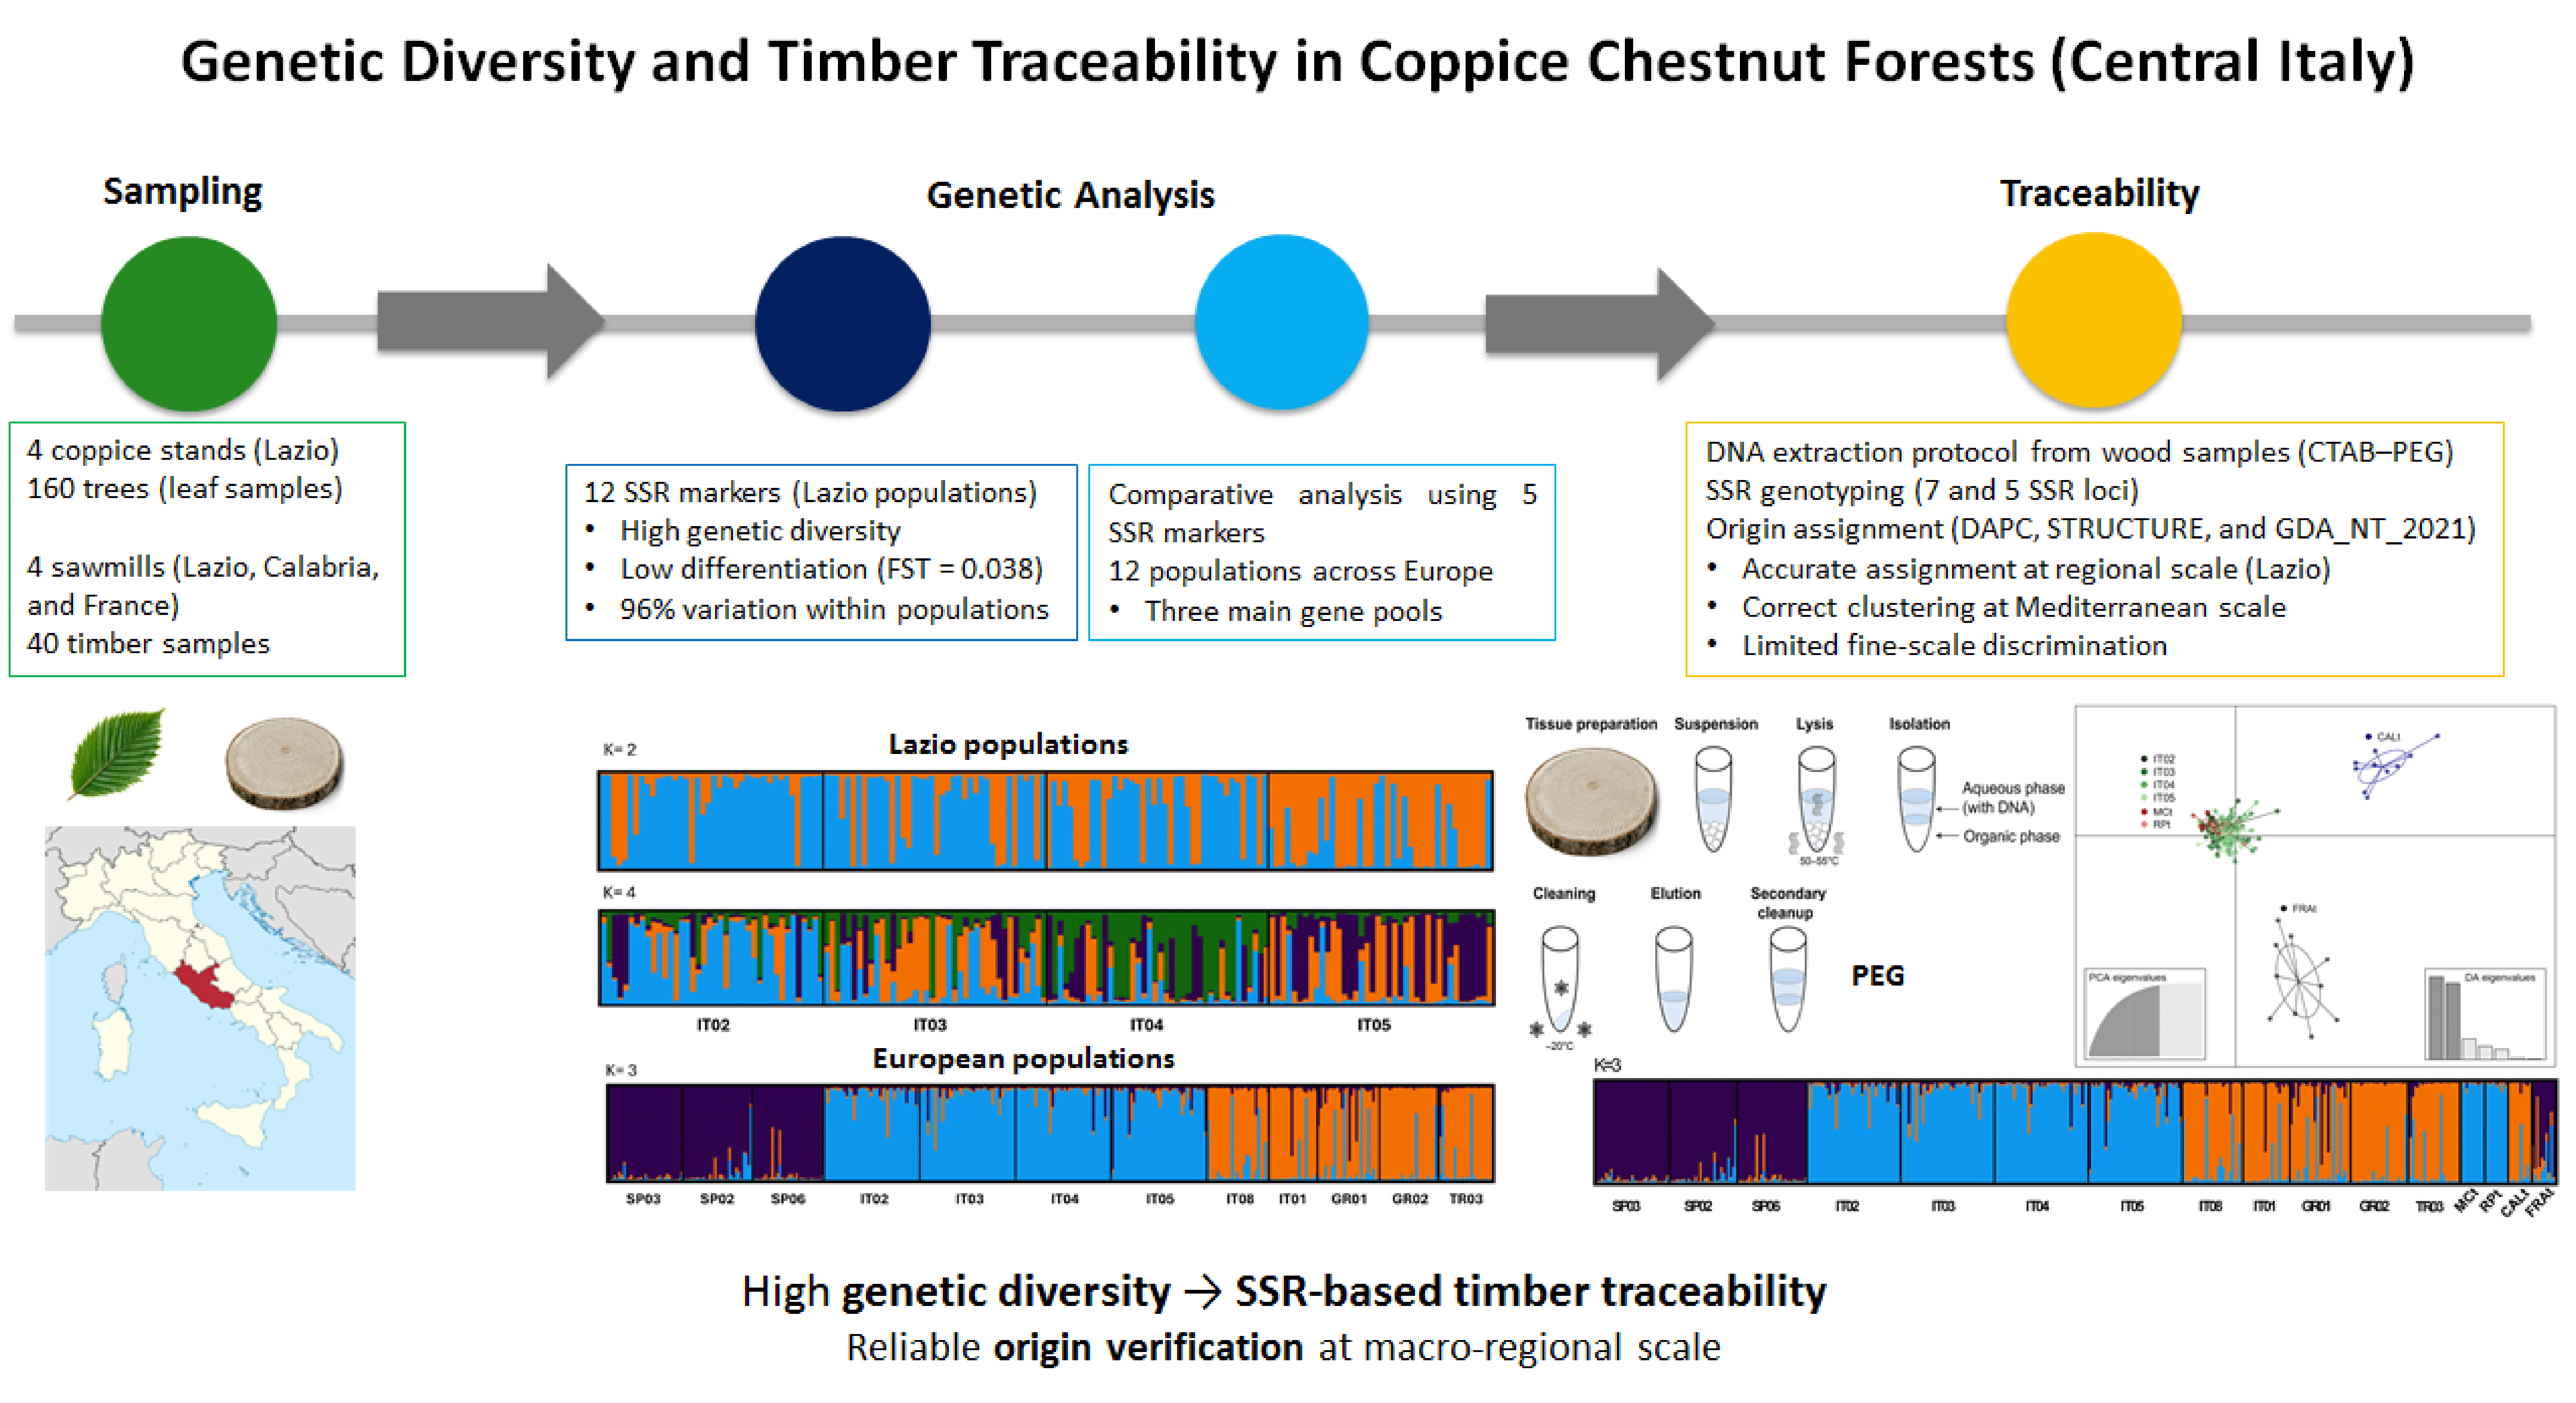
Sweet chestnut (Castanea sativa Mill.) is a key European forest species, widely managed in coppice systems for timber production. Despite its ecological and socio-economic relevance, regional-scale genetic structure in coppice stands and its potential application to timber traceability remain underexplored. This study aimed (i) to assess genetic diversity and population structure in four coppice chestnut stands of the Lazio region using 12 nuclear simple sequence repeat (SSR) loci, and (ii) to evaluate the feasibility of developing an SSR-based framework for timber origin verification at regional and Mediterranean scales. A total of 160 trees from four Lazio populations were genotyped and analyzed together with published SSR data from eight European populations (Spain, Piedmont, Sicily, Greece, and Turkey). Genetic diversity indices revealed high intra-population variability (mean Na = 9.17; mean He = 0.738; mean PIC = 0.737), with most genetic variation partitioned within populations (96% by AMOVA) and moderate differentiation among stands (Fst = 0.038). Bayesian clustering indicated substantial admixture, reflecting extensive gene flow and long-term connectivity typical of coppice systems. Comparative analysis using five shared SSR loci across 12 populations resolved three main phylogeographic gene pools corresponding to Iberian, Central Italian, and Eastern Mediterranean groups. To enable timber traceability, a modified CTAB–PEG DNA extraction protocol was optimized for dried wood material collected from four sawmills (Lazio, Calabria, and France). Reliable multilocus genotypes were obtained from 40 timber samples using seven highly polymorphic SSR loci. Timber assignment was conducted through an integrated analytical approach combining Discriminant Analysis of Principal Components (DAPC), Bayesian clustering (STRUCTURE), and likelihood-based exclusion testing (GDA_NT 2021). At the regional scale, timber from Lazio sawmills was consistently assigned to the corresponding reference populations with assignment scores of 1.000 and negligible exclusion probabilities. At the Mediterranean scale, timber samples were correctly affiliated with broader phylogeographic clusters, although fine-scale discrimination was limited by regional genetic homogeneity and reference coverage. These findings demonstrate that Lazio coppice stands maintain high genetic diversity and confirm the technical feasibility of SSR-based macro-regional timber traceability in C. sativa. While further marker expansion and broader geographic sampling are required for operational implementation, the integrated framework developed here provides a robust basis for genetic origin verification, supporting sustainable forest management and transparent timber supply chains.
Keywords:
Castanea sativa Mill.
; simple sequence repeats (SSR)
; population genetics
; forest conservation management
; timber origin verification
; forest traceability
1. Introduction
Sweet chestnut (Castanea sativa Mill.) is one of the most economically and ecologically important broadleaved tree species in Europe. It is traditionally cultivated both in specialized fruit orchards and in coppice systems managed for timber production, covering an estimated area of more than 2.5 million hectares across Europe [1,2]. Its ecological plasticity, high-quality wood, and socio-economic relevance have promoted extensive human-mediated diffusion since prehistoric and Roman times, resulting in the selection, cultivation, and propagation of numerous local varieties and ecotypes throughout the Mediterranean basin [3,4,5,6].
Molecular markers have played a central role in reconstructing the natural and anthropogenic diffusion dynamics of C. sativa, clarifying post-glacial recolonization routes, and identifying major refugial areas [5,7,8,9,10]. Microsatellite markers (SSRs) have proven highly informative for characterizing both natural populations and cultivated varieties, supporting germplasm conservation, varietal identification, and certification systems for fruit production [11,12,13,14,15]. In this context, a European reference database of SSR profiles has been established, providing a valuable framework for comparative analyses and potential applications in origin verification [16].
Large-scale population genetic studies based on multilocus SSR datasets have shown that European chestnut is structured into distinct phylogeographic groups shaped by Pleistocene glacial refugia and subsequent post-glacial expansion [5,17,18]. Central Italy has been recognized as one of the main glacial refugial areas for C. sativa, contributing to the maintenance of high genetic diversity and regional genetic connectivity across the Mediterranean basin [5].
In Italy, chestnut forests are one of the most important forest types covering approximately 800,000 hectares, of which nearly 74% are managed as coppice stands primarily for timber production; the Lazio region hosts about 36,000 hectares, with approximately 26,000 hectares under coppice management [19]. These stands are largely distributed on fertile volcanic soils in the Cimini, Sabatini, Alban, and Ernici mountain systems. Despite their economic and ecological importance, the genetic variability of Lazio coppice chestnut stands has not been comprehensively investigated, limiting the development of conservation-oriented management strategies and origin-based valorisation schemes.
Assessing genetic diversity and structure at the regional scale is essential not only for biodiversity conservation but also for understanding adaptive potential under ongoing environmental change, as recently reported in a German study on the chestnut populations of Mecklenburg Western Pomerania [20]. High intra-population diversity enhances resilience to climate variability, emerging pathogens, and extreme events by increasing the likelihood that adaptive genotypes are maintained within populations [21]. Conversely, reduced differentiation combined with vegetative propagation may increase the risk of local inbreeding or genetic homogenization if not properly managed. Understanding these dynamics provides a scientific basis for silvicultural strategies aimed at maintaining resilience and long-term sustainability.
In parallel with conservation goals, genetic tools are increasingly explored for timber traceability and forensic origin verification [22]. Illegal logging and trade in illegal timber products represent a major ecological and economic concern, as they undermine sustainable forest management and create market disadvantages for legally sourced wood. Document-based traceability systems can be vulnerable to fraud, whereas genetic signatures are intrinsic to biological material and cannot be altered post-harvest. Verifying the geographic origin of timber through genetic methods may therefore contribute to preserving and valorising forest supply chains.
Traditional approaches based on stable isotope analysis can differentiate wood from different regions by exploiting environmental signatures incorporated into biomass. However, isotopic fingerprints may overlap due to local environmental variability and may differ even among tissues from the same individual [23,24]. In contrast, genetic methods based on allele frequency distributions and shared ancestry can infer geographic origin by exploiting spatial genetic structure within species. Molecular markers such as chloroplast DNA (cpDNA) and nuclear microsatellites (nSSR) have been successfully used to detect geographic structuring of populations [25,26]. Species-specific nSSRs can also support the development of DNA profiling databases for individual, population, and species identification [27,28]. Most traceability studies have focused on tropical timbers from South America, Africa, and Southeast Asia [29,30,31,32,33], while in Europe significant efforts have been devoted to broadleaf species such as oaks (Quercus robur, Q. petraea), ash (Fraxinus excelsior), and beech (Fagus sylvatica) [34,35,36,37].
However, two major challenges constrain routine application of genetic traceability to timber. First, extracting amplifiable DNA from dried, lignified wood is technically demanding due to low DNA quantity, fragmentation, and the presence of PCR inhibitors [38]. Second, assignment accuracy depends on marker informativeness and on the completeness and geographic representativeness of the reference dataset. Without adequate sampling coverage, exclusion-based methods may reject samples even when they are genetically affiliated with nearby but unsampled populations [23].
Within the European regulatory framework, genetic traceability has gained relevance in light of the European Union Timber Regulation [39] and the more recent EU Deforestation Regulation [40], which reinforce due diligence requirements and the need for reliable origin verification. Although these regulations primarily target illegal logging and deforestation risk, integrating genetic tools into traceability systems may strengthen compliance, transparency, and supply-chain accountability.
Against this background, the present study pursued two main objectives. First, it aimed to characterize the extent and distribution of genetic variability in four coppice chestnut stands of the Lazio region using 12 nuclear SSR loci, evaluating both diversity levels and population structure. Second, it sought to assess the feasibility of developing a genetic traceability framework for timber originating from Lazio sawmills. To this end, SSR profiles from Lazio populations were compared with published data from eight European populations [41], and an optimized CTAB–PEG protocol was developed to extract DNA from dried wood samples collected in Lazio, Calabria, and France. An integrated analytical framework combining Discriminant Analysis of Principal Components (DAPC), Bayesian clustering (STRUCTURE), and likelihood-based assignment and exclusion testing (GDA_NT 2021) was applied to evaluate provenance at both regional and Mediterranean scales.
By combining population genetic analysis with methodological optimization and applied assignment approaches, this study aims to provide both a scientific basis for the conservation and management of Lazio coppice chestnut forests and a preliminary yet operational model for macro-regional timber traceability. Such integration represents a promising step toward enhancing biodiversity conservation, supporting local forest-based value chains, and strengthening sustainable and transparent timber supply systems in Italy and across Europe.
2. Materials and Methods
2.1. Plant Materials, Sampling Sites, and Reference Populations
Four coppice chestnut stands of high environmental, ecological, and economic relevance were selected along a northwest–southeast transect across the Lazio region (Central Italy). The study sites were located in the Cimini, Sabatini, and Ernici Mountains, and the Alban Hills, corresponding to the municipalities of Viterbo (San Martino al Cimino, 560 m a.s.l.; 42.370°N, 12.128°E), Oriolo Romano (420 m a.s.l.; 42.157°N, 12.137°E), Rocca di Papa (680 m a.s.l.; 41.770°N, 12.703°E), and Fiuggi (747 m a.s.l.; 41.799°N, 13.221°E) (Table 1; Figure S1).
In each site, 40 stools were randomly selected at a minimum distance of 30 m from one another, starting from the central portion of each coppice stand to minimize edge effects. From each stool, 5–6 fully expanded leaves were collected from the lower branches of a single shoot. Samples were transported under refrigerated conditions and stored at −80 °C until DNA extraction.
To evaluate the genetic distinctiveness and discriminative power of the Lazio populations within a broader European context, genetic profiles for five of the twelve SSR loci analyzed in this study were retrieved from the literature for eight natural European chestnut populations [41]. These reference populations included three Spanish, two Italian (Piedmont and Sicily), two Greek, and one Turkish population. Their geographic origin and sample size are reported in Table 1.
This combined sampling design allowed the assessment of both regional genetic structure within Lazio and broader phylogeographic differentiation across the European distribution range of C. sativa.
2.2. DNA Extraction from Leaves
Total genomic DNA was extracted from 168 leaf samples (40 individuals × 4 populations plus 8 control samples) using the NucleoSpin® Plant II kit (Macherey-Nagel, Düren, Germany), following the manufacturer’s protocol. Approximately 100 mg of frozen leaf tissue per sample was manually ground in liquid nitrogen using a pre-chilled mortar and pestle to prevent DNA degradation. The homogenized tissue was suspended in lysis buffer (PL1) and incubated at 65 °C for approximately 1 h to ensure complete cell disruption. After centrifugation at 10,000 rpm to remove cellular debris, the supernatant was transferred to a filtration column for protein removal. The cleared lysate was then mixed with binding buffer (PC) to activate the silica membrane and loaded onto a purification column. Following centrifugation, the column was washed with the provided washing buffers to eliminate contaminants. Purified DNA was finally eluted in 50 µL of Milli-Q water into sterile 1.5 mL microcentrifuge tubes.
DNA integrity and concentration were evaluated by electrophoresis on a 1.2% (w/v) agarose gel stained with ethidium bromide (0.001%), using known concentrations of λ phage DNA as references, and by spectrophotometric analysis using a NanoDrop ND-1000 Bioanalyzer (Thermo Scientific, Waltham, MA, USA). All samples were subsequently diluted to a final concentration of 20 ng/µL and stored at −20 °C until PCR amplification.
2.3. Genetic Analysis Using SSR Molecular Markers
Genetic variability within and among chestnut populations from four representative areas of the Lazio region was assessed using 12 nuclear simple sequence repeat (SSR) loci [42,43]. These markers have been extensively applied for the genetic characterization of European chestnut germplasm, including Italian populations and cultivars [5,6,10,13,14,15,17,41,44]. The main characteristics of the selected loci, chosen for their high polymorphic information content (PIC) and broad chromosomal distribution (10 of the 12 chromosomes of the haploid C. sativa genome), are reported in Table S1.
Preliminary PCR amplifications were performed using non-fluorescent primers on randomly selected DNA samples to verify primer specificity and optimize amplification conditions. PCR products were visualized on 1.2% (w/v) agarose gels stained with ethidium bromide.
For genotyping, the forward primer of each locus was labeled with fluorescent dyes (6-FAM, HEX, or TAMRA; Eurofins Genomics, Ebersberg, Germany). PCR reactions were carried out in a final volume of 25 µL containing approximately 20 ng of genomic DNA, 10 µM of each primer, and 12 µL of GoTaq® Hot Start Colorless Master Mix (Promega), which includes deoxynucleotides, Mg2+, and Taq DNA polymerase. Thermal cycling consisted of an initial denaturation at 94 °C for 2 min, followed by 35 cycles of 94 °C for 30 s, locus-specific annealing temperatures ranging from 50 to 59 °C for 30 s, and extension at 72 °C for 1 min, with a final extension step at 72 °C for 5 min.
Amplification products were first checked on 1.2% agarose gels to confirm successful amplification and approximate fragment size. Precise allele sizing was performed by capillary electrophoresis using an ABI PRISM® 3500 Genetic Analyzer. Fragment analysis was conducted by an external service laboratory (C.I.B.I.A.C.I. Service Center for Biotechnology of Agricultural, Chemical and Industrial Interest). Electropherograms were analyzed using GeneMapper® software version 4.1, and allele sizes were determined relative to an internal ROX 400 size standard.
To ensure cross-study comparability, allele sizes were standardized against the European Chestnut Database for the 12 SSR markers. Eight reference DNA samples provided by the CNR IRET Institute (Porano, TR; Italy), characterized by known SSR profiles, were included as internal calibration controls to ensure consistency and reproducibility of genotypic data.
2.4. Statistical Data Analysis
2.4.1. Genetic Diversity Parameters of the SSR Loci
For the entire dataset comprising 160 genotypes, alleles at each of the 12 codominant SSR loci were scored based on fragment size (bp). Genetic diversity indices were calculated using PowerMarker v.3.25 [45] and GenAlEx v.6 [46]. The following parameters were estimated for each locus: number of alleles (Na), effective number of alleles (Ne), major allele frequency (MAF), Shannon’s information index (I), observed heterozygosity (Ho), expected heterozygosity (He), unbiased expected heterozygosity (uHe), inbreeding coefficient (F), and polymorphic information content (PIC) [47]. These indices were used to assess the level of genetic variability and marker informativeness across the Lazio populations.
2.4.2. Genetic Structure and Differentiation of the Lazio Populations
Genetic differentiation among the four Lazio chestnut populations was evaluated using Nei’s genetic distance [48] based on the 12 SSR loci. Cluster analysis was performed using the UPGMA (Unweighted Pair Group Method with Arithmetic Mean) algorithm implemented in PowerMarker v.3.25, and the resulting dendrogram was visualized using MEGA12 [49].
Population structure was investigated using a Bayesian clustering approach implemented in STRUCTURE v.2.3.4 [50]. Analyses were conducted under the admixture model with correlated allele frequencies. Each run consisted of a burn-in period of 100,000 iterations followed by 200,000 Markov Chain Monte Carlo (MCMC) iterations. The number of genetic clusters (K) was tested from K = 1 to K = 10, with 20 independent runs performed for each K value. The most likely number of clusters was determined using the ΔK statistic according to the Evanno method [51], in combination with Ln Pr(K) values, using STRUCTURE SELECTOR [52]. Individuals with a membership coefficient Q > 0.75 were assigned to the corresponding genetic cluster. STRUCTURE outputs were graphically visualized using CLUMPAK [53].
Genetic diversity within each Lazio population was calculated using GenAlEx v.6.5 by estimating Na, Ne, number of private alleles (Npa), Shannon’s index (I), Ho, He, uHe, and F. Analysis of molecular variance (AMOVA) was performed to partition genetic variation within and among populations, with significance tested using 999 permutations. The fixation index (Fst) and gene flow (Nm) were estimated, with Nm calculated from Fst according to the formula: Nm = [(1/Fst) − 1] / 4. Pairwise Fst, Nm, and Nei’s genetic distance matrices were also generated to assess population-level differentiation.
2.4.3. Comparative Analysis with European Chestnut Populations
To evaluate the genetic distinctiveness of the Lazio chestnut populations within a broader European framework, five SSR loci (CsCAT1, CsCAT3, CsCAT16, CsCAT6, and EMCs38) were selected from the 12 loci analyzed in this study. These loci were chosen because comparable genotypic data are available in the literature for eight natural European populations [41], including three Spanish, two Italian (Piedmont and Sicily), two Greek, and one Turkish population (Table 1). Genetic diversity across the 12 populations was assessed using allelic richness (AR), calculated with FSTAT v.2.9.3.2 [54]. Additional diversity parameters, including Na, Ne, Npa, Shannon’s information index (I), Ho, He, and uHe, were estimated using GenAlEx v.6 [46], following the same criteria described for the Lazio dataset.
Population structure across the 12 populations was inferred using STRUCTURE v.2.3.4 [50], applying the same admixture model with correlated allele frequencies described above. In this case, K values ranging from 1 to 13 were tested, corresponding to the number of analyzed populations plus one. For each K value, 20 independent runs were performed, each consisting of a burn-in period of 100,000 iterations followed by 200,000 MCMC iterations. The most likely number of genetic clusters was determined using the Evanno method [51], based on the ΔK statistic and supported by Ln Pr(K) values, using STRUCTURE SELECTOR [52]. Individuals with Q > 0.75 were assigned to the corresponding cluster. Graphical representation of STRUCTURE results was performed using CLUMPAK [53].
Genetic distances among the 12 populations were estimated using Nei’s genetic distance coefficient [48] based on the five SSR loci. UPGMA cluster analysis was conducted with PowerMarker v.3.25, and dendrograms were visualized using MEGA12, as described above.
2.5. Wood Discs Collection, DNA Extraction, and SSR PCR Amplification
2.5.1. Wood Sampling and Sample Preparation
Wood discs were collected from four sawmills: two located within the Lazio region (San Martino al Cimino and Rocca di Papa), one from Southern Italy (Calabria region), and one of French origin. The timber samples were labelled as MCt (Monti Cimini timber), RPt (Rocca di Papa timber), CALt (Calabria timber), and FRAt (France timber). The Lazio timber groups originated from harvesting areas corresponding to two of the natural populations analyzed in this study. For each sawmill, ten timber discs were sampled. Prior to DNA extraction, the outer bark and potentially contaminated surface layers were carefully removed using sterile blades. Sapwood tissue was collected from the inner portion of each disc to minimize contamination and environmental degradation effects. Wood shavings were obtained using sterile, single-use drill bits or a micro-planer. Approximately 100–200 mg of wood material per sample was collected in sterile 2 mL microcentrifuge tubes. All tools were cleaned with 10% bleach followed by 70% ethanol between samples to prevent cross-contamination. Wood material was then ground to a fine powder in liquid nitrogen using a pre-chilled mortar and pestle and stored at −20 °C until DNA extraction.
2.5.2. Evaluation of DNA Extraction Protocols from Timber
Given the known challenges associated with DNA extraction from dried wood, several extraction strategies were tested prior to selecting the final protocol. Conventional CTAB-based extraction [55] was initially evaluated, as well as phenol–chloroform–isoamyl alcohol purification methods. Column-based commercial kits commonly used for plant tissues (e.g., NucleoSpin Plant II, DNeasy Plant Mini Kit, and DNeasy PowerPlant Pro Kit) were also tested, including protocol modifications such as extended lysis time, increased buffer volumes, and the addition of 2.5% polyvinylpyrrolidone (PVP) to reduce polyphenolic inhibition. In addition, a combined protocol integrating CTAB extraction followed by silica-column purification was assessed. Extraction trials were performed using different amounts of wood powder, ranging from approximately 100 mg to larger quantities (1-5 g), depending on the tested method. Larger amounts were partially extracted in 50 mL Falcon tubes. Across preliminary tests, DNA yield was generally low and often not clearly visible on agarose gels, which is consistent with the degraded nature of wood-derived DNA. Therefore, extraction success was primarily evaluated based on PCR amplification using SSR primers, followed by gel electrophoresis of the amplicons.
2.5.3. Optimized DNA Extraction Protocol
The protocol that consistently yielded amplifiable DNA was a modified CTAB method [55] followed by polyethylene glycol (PEG) purification. Approximately 100 mg of wood powder was incubated in CTAB lysis buffer for 5 h. The lysate was extracted with chloroform–isoamyl alcohol, centrifuged, and DNA was precipitated from the supernatant with isopropanol at −20 °C overnight. The DNA pellet was washed with 70% ethanol, air-dried, and resuspended in 50 µL of Milli-Q water. To reduce further inhibitory compounds, an additional purification step using ammonium acetate (NH4OAc) and PEG precipitation was applied. Samples were adjusted to 100 µL with Milli-Q water, mixed with an equal volume of ammonium acetate, incubated on ice for 1 h, and centrifuged for 20 min. The supernatant was transferred to a new tube, and DNA was precipitated with an equal volume (~200 µL) of PEG 8000. After a second 1 h incubation on ice and high-speed centrifugation, the DNA pellet was washed with 70% ethanol, vacuum-dried, and resuspended in 30 µL of Milli-Q water. Using this optimized procedure, genomic DNA was successfully extracted from all 40 timber samples (10 per sawmill), yielding material suitable for downstream PCR amplification.
2.5.4. SSR Amplification and Genotyping of Timber DNA
PCR amplifications were carried out using the seven most informative SSR loci previously selected for their high polymorphism (CsCAT1, CsCAT2, CsCAT3, CsCAT6, CsCAT16, CsCAT17, and EMCs38). Reactions were performed under the same conditions adopted for leaf-derived DNA, with two specific modifications. First, bovine serum albumin (BSA) was added at a concentration of 0.5 µg/µL to mitigate potential inhibitory effects commonly associated with wood-derived DNA. Second, HOT FIREPol® Taq Polymerase (Solis BioDyne) was used instead of GoTaq, as it showed higher amplification efficiency in preliminary tests.
Under these optimized conditions, no significant amplification difficulties were observed. Clear and reproducible PCR products were obtained for all seven loci across all timber samples. Fragment analysis by capillary electrophoresis produced well-defined and interpretable peaks comparable in quality to those obtained from leaf-derived DNA. This allowed reliable allele scoring without evidence of systematic allelic dropout or peak ambiguity.
2.5.5. Quality Control and Data Curation
To ensure data reliability, negative extraction controls and PCR controls were included in all batches to monitor contamination. Amplification products were first evaluated by agarose gel electrophoresis to confirm expected fragment sizes and amplification success.
Allele calling was performed using the same binning criteria applied to leaf-derived samples. Only genotypes showing clear and reproducible peak patterns were retained. Given the robustness of the optimized extraction and amplification protocol, no systematic issues related to allelic dropout or peak misinterpretation were detected. Final timber genotypes were incorporated into the complete dataset and processed using the statistical procedures described in Section 2.6.
2.6. Genotype Assignment of Wood Samples
Genetic assignment analyses were conducted to verify whether timber samples corresponded to their declared geographic origin and to evaluate their genetic affinity to the selected reference populations using complementary multivariate, model-based, and likelihood-based approaches. Two datasets were considered. The first dataset comprised 160 individuals from four Lazio populations genotyped at seven SSR loci (40 individuals per population), together with 40 timber samples (10 per population) and was used to assess assignment at the regional scale. The second dataset included 369 individuals from eight European populations and the same four Lazio populations (Table 1), genotyped at five SSR loci and combined with the same 40 timber samples. This broader dataset enabled the evaluation of timber affiliation within a wider European and Mediterranean phylogeographic framework.
2.6.1. Discriminant Analysis of Principal Components (DAPC)
DAPC was conducted using the adegenet package (v2.1.3) in R (v4.0; R Development Core Team, 2020), following the methodology described by Jombart [56] and further developed for the analysis of genetically structured populations [57,58]. Genetic data were transformed into principal components, followed by k-means clustering to minimize within-group variation and maximize among-group differentiation. The number of retained principal components was selected to explain approximately 90% of the total genetic variation. The optimal number of genetic clusters was determined based on the Bayesian Information Criterion. DAPC was applied independently to the regional and European datasets. Timber samples were included without prior population assignment so that their position in the multivariate space directly reflected their genetic affinity to the reference populations.
2.6.2. Bayesian Clustering with STRUCTURE
Population structure and individual ancestry proportions were inferred using STRUCTURE v.2.3.4 [50] under an admixture model with correlated allele frequencies. For the Lazio dataset, K values ranging from 1 to 10 were tested, whereas for the European dataset K values from 1 to 17 were evaluated, corresponding to the number of analyzed reference populations and timber sawmills plus one. For each K value, 20 independent runs were performed, each consisting of a burn-in period of 100,000 iterations followed by 200,000 Markov Chain Monte Carlo iterations. The most likely number of genetic clusters was determined using the Evanno method [51], based on the ΔK statistic and Ln Pr(K) values calculated with STRUCTURE SELECTOR [52]. Individuals were considered confidently assigned to a cluster when their membership coefficient (Q) exceeded 0.75. STRUCTURE outputs were visualized using CLUMPAK [53]. Timber samples were treated as unknown individuals, and their assignment probabilities were evaluated relative to the inferred gene pools.
2.6.3. Bayesian Assignment and Exclusion Testing (GDA_NT 2021)
Population assignment was further evaluated using GDA_NT 2021 [59] under a Bayesian framework following [60]. For the reference populations, self-assignment accuracy was assessed using a leave-one-out procedure, and assignment success was expressed as the percentage of correctly reassigned individuals. Timber groups were treated as independent unknown samples (group size = 1) and assigned to reference populations using 1000 simulated groups. Allele frequencies were corrected by F-values, and the minimum number of biparental loci was set to 1, with biparental and maternal locus weights fixed at 0.5 according to default settings. Assignment results were evaluated using −log10 genotype likelihood values, assignment scores, and LOD-based exclusion probabilities. Lower −log10 likelihood values indicate higher probability of origin from a given population. Assignments were considered statistically reliable when high assignment scores coincided with low exclusion probabilities under the 95% threshold. This combined interpretation enabled discrimination between relative genetic affinity and absolute compatibility with the reference populations.
3. Results and Discussion
3.1. Genetic Diversity of Lazio Chestnut Coppice Stands Analyzed Using 12 SSR Loci
The main genetic parameters estimated for each of the 12 SSR loci used to analyze 160 individuals from four chestnut coppice populations in the Lazio region are reported in Table 2. All primer pairs amplified polymorphic loci, yielding a total of 110 alleles, with a mean of 9.17 alleles per locus (Na) and values ranging from 6.0 (CsCAT14 and EMCs25) to 14.0 (CsCAT3). Across the four populations, 13 private alleles were detected, 12 of which were classified as rare, occurring at allele frequencies below 5% (Table S2).
The effective number of alleles (Ne) showed a mean value of 4.301, ranging from 2.346 (EMCs25) to 6.830 (EMCs38). Major allele frequency (MAF) ranged from 0.203 (CsCAT2) to 0.547 (EMCs25), with an overall mean of 0.354. Shannon’s information index (I) averaged 1.599 and varied from 1.102 (EMCs25) to 2.132 (EMCs38). Observed heterozygosity (Ho) had a mean value of 0.516, with locus-specific values ranging from 0.213 (EMCs25) to 0.794 (CsCAT17), and it was consistently lower than both expected heterozygosity (He) and unbiased expected heterozygosity (uHe). In particular, He ranged from 0.568 (EMCs25) to 0.852 (EMCs38), while uHe from 0.575 (EMCs25) to 0.862 (EMCs38), with mean values of 0.738 (He) and 0.748 (uHe). The inbreeding coefficient (F) averaged 0.302 and ranged from 0.003 (CsCAT14) to 0.631 (EMCs32) (Table 2).
Overall, the genetic diversity observed in the Lazio coppice stands is comparable to, and in some cases higher than, that reported for European chestnut in previous studies on natural populations and cultivated material. For instance, the mean number of alleles per locus detected here (9.17) is consistent with Fernández-Cruz and Fernández-López [17], who reported an average of 11.4 alleles per locus using nine SSR loci across 904 individuals from 29 natural or naturalized stands, mainly in Spain, Italy, and Greece. Comparable allelic diversity was also reported by Bouffartigue et al. [10], who analyzed 520 individuals from 16 regions in France using 18 SSR loci (9.9 alleles per locus), and by Alessandri et al. [44], who examined 630 trees from natural stands and cultivated varieties in Spain and Italy using 16 SSR loci (13.25 alleles per locus).
Conversely, allelic richness in the Lazio populations exceeded values reported in studies focused on more restricted germplasm sets or local traditional material. Bini et al. [15] detected an average of 4.667 alleles per locus using 21 SSR loci in 55 accessions from four cultivated varieties of the Tuscan Apennines, and Beghè et al. [61] reported 4.7 alleles per locus using eight SSR loci in 54 ancient local ecotypes from the Northern Apennines. Higher allelic richness was also observed compared with studies by Martin et al. [12], who analyzed seven SSR loci in 94 individuals belonging to 26 presumed Italian traditional varieties (7.4 alleles per locus), by Marinoni et al. [62], who examined 68 chestnut individuals from Piedmont using 10 SSR loci (8.0 alleles per locus), and by Alessandri et al. [13], who analyzed 16 SSR loci in 134 accessions from the Tuscan–Emilian Apennines corresponding to 21 varieties (8.2 alleles per locus).
Differences among studies may partly reflect variation in sampling design and sample size, because increasing the number of individuals and varieties generally increases the total number of detected alleles. In this context, Ne provides an additional, frequency-weighted descriptor of diversity, representing the expected number of alleles in a population with uniform allele frequencies and the same level of heterozygosity [21,63].
The mean Ne observed here (4.301) was consistent with values reported in other studies and aligned with the high Na detected. For example, Mattioni et al. [18] reported a lower total number of alleles (7.6 alleles per locus) across 223 accessions from 10 Italian sites, but a comparable mean Ne (4.2), close to that obtained in the present study. The Ne value reported here was also higher than those observed by Bini et al. [15] and Beghè et al. [61], who reported 2.96 and 3.04 effective alleles per locus, respectively.
Taken together, these results indicate a high level of genetic diversity within the Lazio chestnut coppice stands, particularly considering the relatively limited geographic extent of the sampled areas.
The informativeness of the SSR marker set was further supported by polymorphic information content (PIC), which measures the discriminatory power of each locus. PIC values above 0.5 are considered highly informative, whereas values below 0.25 are regarded as poorly informative for population genetic characterization [64]. In this study, nine of the twelve loci showed PIC values greater than or very close to 0.7 (Table 2), indicating strong informativeness and supporting the marker-selection criteria adopted in comparable chestnut studies [44]. The mean PIC value (0.737) was comparable to Alessandri et al. [44], who reported an average PIC of 0.735 for 630 Italian and Spanish accessions, and higher than values reported by Bini et al. [15] (0.582) and by Alessandri et al. [13] (0.683). Within the marker set, EMCs38, CsCAT2, CsCAT17, and CsCAT3 were the most informative loci, showing the highest PIC values (0.874, 0.849, 0.833, and 0.794, respectively) together with high He values (0.873, 0.736, and 0.720, respectively) (Table 2), consistent with previous reports [14,15,44]. Notably, these loci also exhibited high allele numbers (10–14) and low major allele frequencies (MAF), further supporting their high variability and suitability for downstream analyses of genetic structure and assignment.
3.2. Genetic Structure and Differentiation of the Four Coppice Chestnut Populations from Lazio
The genetic structure of the 160 genotypes from the four Lazio coppice chestnut populations was investigated using the Bayesian clustering approach implemented in STRUCTURE v.2.3.4 [50]. Based on the Evanno method [51], the ΔK statistic supported a primary partition at K = 2 (ΔK = 12.57), while additional secondary peaks were detected at K = 4 (ΔK = 10.44) and K = 6 (ΔK = 9.91) (Figure S2), indicating a hierarchical structure with increasing subdivision at higher K values. Because K = 2 captured the main signal of differentiation and K = 4 provided finer resolution within the regional gene pool, both solutions were considered for interpreting ancestry patterns. At these K values, membership proportions were estimated at both the population and individual levels (Table 3; Table S3 and Figure 1), consistently showing variable admixture across stands.
At K = 2, San Martino al Cimino (IT02), Rocca di Papa (IT03), and Oriolo Romano (IT04) were predominantly associated with the first inferred gene pool (light blue), with mean Q values ranging from 0.652 (IT04) to 0.798 (IT02), whereas Fiuggi (IT05) showed the highest association with the second gene pool (orange; Q = 0.716) (Table 3). Applying the conservative assignment criterion (Q > 0.75) (Figure 1; Table S3), most individuals from IT02 were assigned to the first cluster (light blue) (31/40), with a smaller proportion assigned to the second cluster (orange) (5/40) and a residual fraction showing mixed ancestry (4/40). A similar pattern was observed in IT03, where 27 individuals belonged to the first cluster (light blue), 10 to the second (orange), and 3 displayed admixed ancestry. In IT04, 23 genotypes were assigned to the first gene pool (light blue) and 11 to the second (orange), while 6 individuals were classified as admixed. In contrast, IT05 showed the reverse trend, with 26 individuals assigned to the second cluster (orange), 8 to the first (light blue), and 6 displaying mixed ancestry.
Overall, these distributions indicate that the regional gene pool is structured but broadly shared among populations, with IT05 exhibiting the clearest shift toward the second gene pool.
The extent of admixture and internal subdivision became more evident at K = 4. Under this solution, IT02 showed its highest contribution from gene pool 1 (light blue; Q = 0.594), IT04 was most strongly associated with gene pool 3 (green; Q = 0.509), and IT05 was characterized by the highest contribution from gene pool 4 (purple; Q = 0.481) (Table 3; Table S3; Figure 1). Rocca di Papa (IT03) displayed the most admixed profile, with approximately two-thirds of its genetic composition derived from gene pools 2 (orange; Q = 0.394) and 4 (purple; Q = 0.358), and the remaining fraction attributable to the other two components (Table 3; Table S3; Figure 1). Taken together, the STRUCTURE results at K = 2 and K = 4 support a pattern of weak-to-moderate differentiation among Lazio stands combined with substantial shared ancestry and admixture, consistent with a connected regional gene pool.
These observations were corroborated by variance partitioning and differentiation statistics. AMOVA indicated that only 4% of the total genetic variation was explained by differences among populations, whereas 96% occurred within populations (Table 4). Consistently, the overall differentiation was low but significant (Fst = 0.038; p < 0.001), and the inferred gene flow was high (Nm = 7.371), supporting extensive connectivity among stands (Table 4).
Pairwise comparisons based on Fst, Nm, and Nei’s unbiased genetic distance (Nei uD) further detailed this pattern (Table S4). The strongest differentiation was detected between San Martino al Cimino (IT02) and Fiuggi (IT05) (Nei uD = 0.162), whereas the closest relationship occurred between IT02 and Rocca di Papa (IT03) (Nei uD = 0.064), which also showed the lowest Fst and highest Nm values (Fst = 0.020; Nm = 12.014). The largest divergence based on fixation index and migration estimates was observed between Fiuggi (IT05) and Oriolo Romano (IT04) (Fst = 0.047; Nm = 5.024). Overall, IT05 consistently emerged as the relatively more differentiated stand, as indicated by higher genetic distance and Fst values and lower Nm estimates (Table S4).
Distance-based clustering provided an additional, congruent representation of population relationships. UPGMA analysis using Nei’s coefficient (Nei, 1973) clustered the 40 genotypes per population and resolved three main groups, with IT02 and IT03 clustering together, IT04 occupying an intermediate position, and IT05 being the most distinct population (Figure S3). This dendrogram topology closely mirrors the STRUCTURE signal and the pairwise differentiation metrics, reinforcing the interpretation of a largely cohesive regional gene pool with modest internal structure.
The weak differentiation and high admixture detected across the Lazio coppice stands likely reflect a combination of biological traits and historical/management drivers. Chestnut is an obligate outcrossing species with synchronous flowering and efficient pollen and seed dispersal, which can sustain high gene flow in the absence of strong barriers [18]. In addition, the limited regional structuring is consistent with post-glacial expansion from a shared ancestral pool and with the proposed role of Central Italy as a glacial refugium for C. sativa [5,18,65]. Traditional coppice management in Lazio, characterized by low-intensity interventions and limited directional selection, may have further contributed to maintaining diversity and connectivity by favouring natural regeneration and gene exchange among stands [18,66]. In this context, the high admixture observed in STRUCTURE and the high within-population variance detected by AMOVA highlight the contribution of coppice systems to the conservation of genetic resources and suggest that conservation-oriented management may be important for preserving long-term adaptability and resilience of chestnut forests.
Finally, population-level diversity indices (Table S5) confirmed that all four stands maintain high genetic variability and broadly comparable diversity levels. Observed heterozygosity (Ho) ranged from 0.473 (IT05) to 0.550 (IT02), while expected heterozygosity (He) ranged from 0.711 (IT04) to 0.761 (IT05), and Ne values ranged from 3.915 (IT04) to 4.686 (IT05). These He values are comparable to those reported by Mattioni et al. [18], who analyzed several Central Italian chestnut populations using six SSR markers, a subset of the twelve markers applied here, and reported He values between 0.58 and 0.80. Because that study suggested that the high genetic diversity detected in this area supports the role of Central Italy as a potential chestnut refugium, the presence of relict ancient genotypes in the populations analyzed here cannot be excluded. Moreover, the He values obtained in the present study are consistent with those reported for other European chestnut populations [67,68], including Bulgarian stands analyzed by Lusini et al. [69], in which six populations analyzed using eight SSR markers showed He values ranging from 0.67 to 0.80.
As previously noted, the effective number of alleles (Ne) represents a more informative metric of genetic diversity than heterozygosity alone. The Ne range observed here is comparable to, or higher than, values previously reported for Spain and Italy [5] and for France, Spain, and Italy [18], and exceeds estimates reported for Bosnia and Herzegovina and Croatia [66], supporting the conclusion that Lazio coppice stands harbour high genetic diversity. Despite this overall variability, all populations showed positive inbreeding coefficients (F = 0.244–0.389) (Table S5), indicating moderate heterozygote deficit that may plausibly reflect fine-scale family structure linked to vegetative regeneration and spatial clustering of related stools (Wahlund effect), as well as the long-term demographic and management dynamics of coppice stands.
3.3. Genetic Diversity and Structure of Lazio and European Chestnut Populations
As previously indicated, the second objective of this study was to evaluate the feasibility of developing a genetic traceability system for timber originating from sawmills in the Lazio region using SSR markers. To this end, a literature survey provided genetic profiles for five of the twelve SSR loci employed in the present study, referring to individuals from eight European populations of C. sativa (three Spanish, two Italian, two Greek, and one Turkish) [41]. These data were compared with those obtained from the four Lazio populations analyzed here to assess their genetic distinctiveness using STRUCTURE and UPGMA clustering approaches.
STRUCTURE analysis performed on the four Lazio coppice chestnut populations (160 genotypes) and the eight European populations used for comparison (209 genotypes) supported K = 3 as the most likely number of clusters based on the five SSR markers (Figure S4). The first cluster included most genotypes from the three Spanish populations (SP03, SP02, SP06), the second cluster comprised most genotypes from the four Lazio populations (IT02–IT05), and the third cluster grouped the two Italian populations from Piedmont (IT08) and Sicily (IT01) together with the Greek (GR01, GR02) and Turkish (TR03) populations (Figure 2).
Population-level membership proportions (admixture coefficients, Q) for the three inferred gene pools are reported in Table 5. Using Q > 0.75 as the assignment threshold, all populations were clearly attributable to a single cluster, except for GR01, which showed evidence of introgression across genetic pools (Q below the threshold).
A more detailed evaluation of individual membership coefficients confirmed that admixture was present in several populations (Figure 2; Table S6). At Q > 0.75, all individuals from SP03 (31/31) were assigned to the first cluster (purple). In SP02, 24/29 individuals were assigned to cluster 1, 1/29 to cluster 2 (light blue), and 4/29 were classified as admixed; in SP06, 28/30 were assigned to cluster 1 and 2/30 were admixed. Within Lazio populations, IT02 showed 38/40 individuals assigned to cluster 2 (light blue) and 2/40 admixed; IT03 had 36/40 assigned to cluster 2 and 4/40 admixed; IT04 had 37/40 assigned to the second cluster and 3/40 admixed; IT05 had 35/40 assigned to the cluster 2 and 5/40 admixed. In the third group, IT08 showed 19/26 individuals assigned to cluster 3 (orange), 2/26 to cluster 2, and 5/26 admixed; IT01 showed 17/20 assigned to cluster 3, 1/20 to cluster 2, and 2/20 admixed. GR01 displayed the strongest heterogeneity (15/26 assigned to cluster 3, 2/26 to cluster 2, 1/26 to cluster 1, and 6/26 admixed), whereas GR02 was largely assigned to cluster 3 (22/24), with 1/24 assigned to cluster 2 and 1/24 admixed. TR03 showed 18/23 assigned to cluster 3, 2/23 to cluster 2, 1/23 to cluster 1, and 3/23 admixed.
The STRUCTURE results were further supported by cluster analysis based on genetic distances calculated using Nei’s coefficient [48]. UPGMA clustering of individual SSR profiles from the twelve populations yielded a dendrogram (Figure 3) that resolved three genetically distinct groups fully consistent with the Bayesian inference: (i) the Spanish populations (SP03, SP02, SP06); (ii) the Lazio populations (IT02–IT05); and (iii) the Piedmont and Sicily populations (IT08, IT01) together with the Greek and Turkish populations (GR01, GR02, TR03).
Genetic diversity indices indicated slightly higher values in western populations, particularly in the Spanish populations, compared with eastern ones, with the Lazio populations showing intermediate values (Table S7). It should be noted that the European populations included in this study for comparative purposes represent a subsample of those previously genotyped by Mattioni et al. [18], in which higher values of expected heterozygosity (He), effective number of alleles (Ne), and allelic richness (Ar) were observed in the central part of the species’ distribution range. Therefore, the comparatively higher levels of genetic diversity detected in western populations may reflect multiple colonization routes from different glacial refugia, as reported for other species [70], as well as the influence of anthropogenic factors.
Overall, Bayesian inference based on five SSR loci identified three main genetic groups among the twelve populations, broadly matching a geographic pattern. The full concordance between STRUCTURE and UPGMA supports the robustness of the inferred relationships and suggests distinct evolutionary trajectories and demographic histories, likely shaped by glacial refugia, geographic isolation, and local dispersal dynamics [5,18,65]. The four Lazio populations clustered cohesively within a single genetic group, supporting a high degree of regional gene pool homogeneity, and aligning with previous evidence of high intra-regional gene flow, low differentiation (Fst), and high heterozygosity (see section 3.2.). In contrast, the Spanish cluster showed a distinct genetic lineage with a clearer internal structure, whereas the third cluster (IT01, IT08, GR01, GR02, TR03) exhibited greater heterogeneity, plausibly reflecting introgression, persistence of local gene pools, and/or anthropogenic introductions. Admixed individuals were detected in multiple populations, particularly GR01, IT08, and TR03, consistent with secondary contact among genetic pools and/or recent human-mediated gene exchange [68,69].
3.4. Development and Optimization of DNA Extraction from Dried Wood and SSR Amplification for Timber Traceability
Extracting amplifiable DNA from dried woody tissues represents a critical step in the implementation of genetic traceability systems. Wood samples generally contain low quantities of highly fragmented DNA and elevated concentrations of inhibitory compounds, including polyphenols, tannins, lignin derivatives, and other extractives that can compromise PCR amplification efficiency [71]. In heartwood, the scarcity of living cells further reduces DNA yield and complicates standard amplification protocols. Consequently, specialized extraction and purification strategies are required, and no single method is universally effective because of species-specific biochemical variability.
As detailed in Section 2.5, multiple extraction protocols were evaluated before defining the optimized procedure. Conventional CTAB-based extraction, phenol–chloroform–isoamyl alcohol purification, commercial column-based kits, and combined CTAB–column workflows were tested. Preliminary extractions frequently resulted in low DNA yield and poor visibility on agarose gels, highlighting the intrinsic difficulty of working with dried wood matrices. Therefore, extraction success was primarily assessed based on downstream SSR amplification rather than gel visualization alone.
The final optimized protocol consisted of a modified CTAB extraction followed by PEG purification. Protocol refinement involved extending key incubation and precipitation steps to enhance DNA recovery from degraded and inhibitor-rich samples. Prolonged CTAB lysis improved cell disruption and solubilization of nucleic acids [72], while extended isopropanol and sodium acetate precipitation phases increased DNA recovery efficiency [73,74]. The subsequent PEG purification step contributed to reducing co-extracted contaminants and preferentially recovering higher-quality DNA fractions, a strategy widely used to improve DNA purity and PCR amplification from complex biological matrices and inhibitor-rich samples [75,76]. Although complete removal of polysaccharides and phenolic inhibitors is rarely achievable in woody substrates, amplification efficiency was further improved by using a high-performance polymerase (HOT FIREPol Taq polymerase) in combination with bovine serum albumin, which mitigates inhibitory effects on Taq polymerase activity and primer annealing [76,77]. Once these modifications were implemented, the protocol consistently yielded amplifiable DNA from all 40 timber samples. PCR amplification of the seven selected SSR loci produced clear and reproducible products. The effectiveness of the method is illustrated in Figure S5, showing agarose gel electrophoresis of PCR products obtained from wood samples of different origin and reference leaf tissue using primers for the SSR loci CsCAT1 and CsCAT3. Moreover, capillary electrophoresis revealed well-resolved and interpretable allele peaks comparable in quality to those obtained from leaf-derived DNA. Notably, no systematic issues related to allelic dropout or peak misinterpretation were observed across loci, confirming the robustness of the optimized workflow for timber-derived DNA.
Overall, the methodological adjustments applied to the CTAB protocol enabled reliable recovery of multilocus SSR genotypes from dried chestnut wood, thereby establishing a technically sound basis for the population structure and assignment analyses presented in the following sections.
3.5. Integrated Genetic Assignment of Timber Samples across Regional and European Scales
3.5.1. Regional Scale: Lazio Populations (Seven SSR Loci)
The integration of multivariate (DAPC), model-based (STRUCTURE), and Bayesian assignment (GDA_NT 2021) approaches provided a coherent framework for assessing timber origin at the regional scale. The regional genetic structure previously described in Section 3.2, characterized by moderate differentiation (Fst = 0.038) and high within-population variation (96% by AMOVA), represents the baseline against which timber assignment was evaluated.
DAPC analysis based on seven SSR loci (Figure 4) revealed substantial overlap among the four Lazio populations (IT02–IT05), confirming limited differentiation and shared ancestry within the region. Timber samples MCt and RPt, originating from sawmills located in the areas of IT02 (San Martino al Cimino) and IT03 (Rocca di Papa), respectively, clustered within the Lazio genetic group. Their distribution largely overlapped with individuals from the corresponding natural populations, showing no evident separation from the local gene pool and supporting their declared geographic origin. In contrast, CALt and FRAt formed clearly separated clusters, indicating genetic distinctiveness from the Lazio gene pool.
STRUCTURE analysis further refined these patterns. The ΔK method identified a primary peak at K = 2 and a secondary peak at K = 4 (Figure S6). At K = 2 (Figure 5; Tables S8–S9), the four Lazio populations exhibited mixed ancestry between the two gene pools (light blue and orange), with predominance of the first component, confirming substantial regional homogeneity and moderate differentiation among stands as reported in Section 3.2. MCt and RPt were predominantly assigned to the light blue cluster (100% and 90% at Q > 0.75, respectively), consistent with the main Lazio genetic background. Conversely, CALt and FRAt were entirely associated with the alternative cluster (orange), confirming their differentiation from the regional stands.
At K = 4, a finer internal subdivision emerged (Figure 5; Tables S8–S9). The Lazio populations were distributed mainly across the first (light blue) and second (orange) gene pools, with additional contributions from the third (purple) and fourth (green) components, reflecting subtle internal structuring rather than strong differentiation. Assignment rates decreased accordingly (Table S8-S9). Individuals from IT03, IT04, and IT05 showed the highest contribution from the first gene pool (light blue), ranging from 42.5% to 50%, whereas individuals from IT02 displayed a greater contribution from the second gene pool (orange), reaching 67.5%. Despite this finer structuring, MCt remained largely embedded within the Lazio genetic spectrum, with 80% of individuals confidently assigned to the second gene pool (orange). RPt exhibited a more admixed profile, with 50% assignment to the first gene pool (light blue) under the stricter threshold; however, its overall ancestry composition remained consistent with the genetic background of IT03. In contrast, CALt and FRAt maintained complete assignment to non-Lazio gene pools, primarily associated with the third (purple) and fourth (green) components, confirming their genetic distinctiveness even under finer partitioning.
The Bayesian assignment analysis implemented in GDA_NT 2021 provided formal statistical validation of these patterns. Leave-one-out self-assignment yielded an overall success rate of 66% (Table S10), consistent with moderate regional differentiation. IT05 showed the highest reassignment rate (75%), whereas IT03 showed the lowest (60%), supporting subtle but detectable differences among stands. Reciprocal misassignment between IT02 and IT03 (18% and 13%, respectively) further indicates close genetic affinity. Importantly, the overall reassignment rate of 66% exceeds the random expectation of 25% for four populations, demonstrating that the seven selected SSR loci provide meaningful discriminatory power at the regional scale.
Timber group assignment (Tables S11–S12) provided decisive evidence for traceability. MCt and RPt displayed the lowest −log10 genotype likelihood values for IT02 and IT03, respectively (Table S11), combined with assignment scores of 1.000 and negligible LOD-based exclusion probabilities (Table S12). These parameters jointly confirm correct geographic attribution. In contrast, CALt and FRAt showed high −log10 likelihood values and exclusion probabilities of 1.000 across all Lazio populations, indicating statistical incompatibility despite relative likelihood assignment. This distinction underscores the importance of interpreting likelihood and exclusion criteria jointly in forensic contexts.
Collectively, the concordance among DAPC, STRUCTURE, and GDA_NT 2021 demonstrates that MCt and RPt are genetically consistent with the Lazio stands, whereas CALt and FRAt are clearly differentiated at the regional scale.
3.5.2. Mediterranean Scale: Broader European Context (Five SSR Loci)
At the broader Mediterranean scale, timber assignment was evaluated against the genetic structure described in Section 3.3, where STRUCTURE identified three main gene pools corresponding to Iberian, Central Italian, and Eastern Mediterranean clusters.
DAPC analysis (Figure 6) resolved the same three principal assemblages. Spanish populations (SP02, SP03, SP06) formed a compact Iberian cluster, Lazio populations (IT02-IT05) grouped cohesively as a Central Italian component, and Greek (GR01, GR02), Turkish (TR03) populations clustered together with IT01 (Sicily) and IT08 (Piedmont), indicating a shared Eastern Mediterranean genetic background. MCt and RPt overlapped with the Lazio cluster, confirming their regional affiliation even in the expanded dataset. Calabria timber samples (CALt) showed partial overlap with the Eastern Mediterranean assemblage, whereas French timber samples (FRAt) were positioned outside the Lazio cluster and near the Iberian group, indicating affinity with Spanish populations.
STRUCTURE analysis corroborated the patterns observed in the multivariate analyses. The ΔK method showed a clear maximum at K = 3 (Figure S7), supporting the presence of three main gene pools (Figure 7; Tables S13–S14), consistent with the results presented in Section 3.3. Spanish populations (SP03, SP02, and SP06) were predominantly associated with the first gene pool (purple), whereas the four Lazio populations (IT02–IT05) formed a coherent Central Italian component corresponding to the second gene pool (light blue). The Eastern Mediterranean populations (GR01, GR02, TR03) showed predominant membership in the third gene pool (orange), together with the Italian populations IT01 (Sicily) and IT08 (Piedmont), confirming the affinity among these populations previously highlighted by the DAPC analysis.
Timber samples MCt and RPt were fully assigned to the Central Italian cluster (light blue), consistent with their declared origin from Lazio and in agreement with both the DAPC results and the STRUCTURE analysis of Dataset 1. Calabria timber samples (CALt) exhibited predominant membership in the third gene pool (orange), aligning them with the Eastern Mediterranean genetic component. In contrast, French timber samples showed assignment toward the Iberian cluster, indicating genetic affinity with Spanish populations (Figure 7). These patterns were consistently observed in both the individual posterior membership coefficients (Table S14) and the mean population membership proportions (Table S13).
The GDA_NT 2021 analysis further clarified the genetic relationships observed in the clustering approaches. Leave-one-out self-assignment of the 12 reference populations yielded an overall success rate of 57% (Table S15), indicating moderate genetic differentiation across the dataset. Spanish populations showed the highest assignment accuracy (79–84%) and limited misassignment outside the Iberian Peninsula. In contrast, the Lazio populations (IT02–IT05) exhibited lower reassignment rates (40–55%) and substantial reciprocal misassignment (Table S15), reflecting weak internal structure. The other two Italian populations, IT01 from Sicily and IT08 from Piedmont, showed comparatively low assignment accuracy, suggesting admixture and/or incomplete representation of regional genetic diversity within the reference set. Greek populations displayed moderate differentiation (65–71%), while the Turkish population showed partial affinity with Eastern Greece (Table S15).
Against this background, the assignment of timber samples provides the most relevant evidence for traceability. The two Lazio timber groups, MCt and RPt, were unambiguously assigned to their geographically corresponding populations, IT02 and IT03, respectively. This is supported by the lowest −log10 genotype likelihood values relative to those populations (Table S16), assignment scores equal to 1.000, and very low LOD-based exclusion probabilities (Table S17). Because lower −log10 likelihood values indicate higher probability of origin, and because exclusion probabilities remained below the 95% threshold, these results provide strong statistical support for correct geographic attribution. Together, the likelihood, score, and exclusion parameters demonstrate that SSR-based Bayesian assignment can reliably identify the most probable source population when the reference dataset adequately represents regional genetic diversity, even in areas of moderate internal differentiation such as Lazio.
The Calabria timber group showed the lowest −log10 likelihood value for IT01 (Table S16), indicating highest relative probability of origin from that Southern Italian population. However, the exclusion probabilities reported in Table S17 were high across reference populations, indicating incomplete statistical compatibility under the 95% LOD criterion. Considering the geographic proximity between Calabria and Sicily and the documented genetic connectivity among Southern Italian chestnut populations [5], this assignment likely reflects regional affinity within the southern gene pool rather than precise local origin. The result also highlights the importance of including geographically comprehensive reference populations for Southern Italy.
The France timber group showed the lowest −log10 likelihood value for the Spanish population SP02 (Table S16), indicating highest relative likelihood of origin within the Iberian gene pool. However, as shown in Table S17, exclusion probabilities were high for all reference populations, suggesting that none of the sampled populations fully explain its multilocus genotype. Given the absence of French reference populations in the dataset and the known genetic continuity between Southwestern France and Northern Spain [5,6,10], this outcome should be interpreted as evidence of affinity with the Iberian cluster rather than definitive geographic attribution.
3.5.3. Forensic and Regulatory Implications of the Integrated Genetic Assignment Framework
The convergence of DAPC, STRUCTURE, and GDA_NT 2021 across regional and European scales highlights the applied potential of multilocus SSR-based traceability in C. sativa. The integration of multivariate clustering, model-based ancestry inference, and Bayesian exclusion testing establishes a hierarchical validation strategy that enhances the evidentiary reliability of genetic provenance assessment, in line with best-practice recommendations for forensic timber identification [22,23].
The consistent attribution of MCt and RPt to IT02 and IT03 across all analytical approaches demonstrates the strength of this integrated framework. DAPC and STRUCTURE independently placed these samples within the Central Italian gene pool, while GDA_NT_2021 provided formal statistical support through the combined interpretation of low −log10 genotype likelihood values, assignment scores equal to 1.000, and negligible LOD-based exclusion probabilities. Together, these metrics provide strong evidence suitable for regulatory and legal contexts. In contrast, CALt and FRAt, although clustering with Eastern Mediterranean and Iberian groups, respectively, were excluded under the 95% LOD threshold, illustrating the conservative and precautionary nature of likelihood-based exclusion testing.
These findings are directly relevant to international timber trade regulations. Under the European Union Timber Regulation [39,40], operators are required to verify the legality and origin of timber products. In this framework, genetic assignment offers an independent biological tool capable of validating declared provenance and identifying inconsistencies between documentation and material evidence.
Methodologically, the three approaches provide complementary strengths. DAPC offers a model-free visualization of genetic structure without relying on Hardy–Weinberg assumptions [57]. STRUCTURE estimates probabilistic ancestry and detects hierarchical population structure under a Bayesian framework [50]. GDA_NT 2021, based on Rannala and Mountain [60], introduces formal likelihood and LOD-based exclusion testing, enabling evaluation of absolute genetic compatibility rather than relative affinity.
The SSR markers employed in this study represent a cost-effective and operationally accessible solution for timber traceability. Microsatellites are technically established and sufficiently polymorphic to resolve major phylogeographic gene pools in C. sativa [5,10,17,41,44]. When supported by well-sampled and geographically representative reference populations, SSR-based assignment can provide reliable and legally defensible provenance inference. Although high-density SNP panels and next-generation sequencing approaches may offer finer resolution, they generally require greater financial investment and analytical infrastructure. For many regulatory applications aimed at distinguishing well-defined regional gene pools, multilocus SSR datasets offer an appropriate balance between analytical power and operational feasibility.
Nonetheless, several limitations must be considered. Assignment accuracy depends critically on the completeness and geographic representativeness of the reference dataset. The high exclusion probabilities observed for CALt and FRAt likely reflect unsampled source populations rather than methodological shortcomings. Incomplete reference coverage remains a recognized constraint in forensic wood identification [23]. Furthermore, while SSR loci effectively discriminate among major gene pools, their resolving power decreases at fine regional scales characterized by high gene flow and shared management history, as observed among Lazio populations. Clustering approaches identify relative affinities but do not constitute definitive proof of origin; exclusion-based testing provides a more conservative framework but may also reject samples when the true source population is absent from the reference dataset.
Overall, the integrated application of DAPC, STRUCTURE, and GDA_NT 2021 demonstrates a scientifically rigorous and regulatorily relevant approach for timber origin verification in C. sativa. When supported by comprehensive reference datasets, SSR-based genetic tools offer a robust, scalable, and legally defensible pathway for strengthening timber traceability and supporting sustainable forest governance.
4. Conclusions
This study provides an integrated evaluation of genetic diversity and timber traceability potential in coppice chestnut stands of the Lazio region. The analysis of 12 nuclear SSR loci revealed high intra-population genetic variability, with allelic richness and heterozygosity comparable to, or exceeding, those reported for European C. sativa populations. Despite moderate differentiation among stands, extensive admixture and high within-population diversity indicate strong genetic connectivity, consistent with the species’ outcrossing biology, historical management practices, and the role of Central Italy as a post-glacial refugial area.
The substantial genetic variability observed in Lazio coppice systems represents a key resource for adaptive resilience under climate change, pathogen pressure, and environmental stress. These findings emphasize the importance of management strategies that preserve reproductive heterogeneity and maintain ecological connectivity, while carefully monitoring inbreeding levels associated with vegetative regeneration dynamics.
Beyond population-level insights, the study demonstrates the feasibility of a multilocus SSR-based framework for timber traceability. Although fine-scale discrimination within Lazio remains challenging due to regional genetic homogeneity, clear macro-regional differentiation was observed among Central Italian, Iberian, and Eastern Mediterranean gene pools. Even with a limited shared marker set, Lazio populations were genetically distinguishable from other European regions, supporting the applicability of molecular tools for origin verification at national and European scales.
A key outcome of this work is the demonstration that reliable timber traceability requires an integrated analytical approach. The combined use of DAPC, STRUCTURE, and GDA_NT 2021 provides complementary perspectives on genetic relationships: multivariate visualization of clustering patterns, probabilistic inference of ancestry proportions, and formal likelihood-based assignment and exclusion testing. While each method offers distinct insights, their concordant interpretation strengthens the robustness and credibility of provenance assessment, particularly in regulatory and forensic contexts.
The successful optimization of a CTAB–PEG-based DNA extraction protocol further confirms that stable multilocus genotypes can be obtained from dried wood material, overcoming a major technical constraint for operational traceability. Although the system developed here remains preliminary, it establishes a scientifically robust foundation for future implementation.
To achieve an operational and legally robust traceability system, future efforts should expand the number of informative markers, increase geographic sampling coverage, and develop a validated, georeferenced European reference database. The integration of genetic resource conservation with a multi-method molecular traceability framework thus represents a promising pathway to enhance sustainability, transparency, and competitiveness in European chestnut timber supply chains while contributing to broader efforts aimed at combating illegal timber trade.
Supplementary Materials
The following supporting information can be downloaded at the website of this paper posted on Preprints.org. Figure S1: Map showing the four locations of coppice chestnut forests in the selected areas of the Lazio region considered in this study. Figure S2: Estimation of the optimal number of genetic clusters for the 160 individuals belonging to the four coppice chestnut populations from the Lazio region according to the Evanno method [51]. The graph on the right shows DeltaK [mean(|L’’(K)|) / sd(L(K))] for each K value. Figure S3: UPGMA dendrogram of genetic relationships among the four coppice chestnut populations from the Lazio region. Figure S4: Estimation of the optimal number of clusters for 369 individuals from the four Lazio coppice chestnut populations and eight European populations used for comparison, based on the Evanno method [51]. The graph on the right shows the ΔK values [mean(|L’’(K)|) / sd(L(K))] for each K. Figure S5: Agarose gel (1.2%) electrophoresis of PCR amplification products obtained from DNA extracted from woody tissue of different origin (samples 1–10) and from leaf tissue (sample 11) used as a control. Lanes 1–3: Lazio, Rocca di Papa; lanes 4–5: Calabria; lanes 6–7: France; lanes 8–10: Lazio, San Martino al Cimino; lane 11: control leaf sample; M: molecular marker (100 bp DNA ladder). Figure S6: Estimation of the optimal number of genetic clusters for 160 individuals from four coppice chestnut populations of the Lazio region and 40 timber samples from four sawmills, based on seven SSR loci, using the Evanno method [51]. The right panel shows ΔK values [mean (|L’’(K)|) / sd(L(K))] for each K. Figure S7: Estimation of the optimal number of genetic clusters for 369 individuals from four Lazio coppice chestnut populations, eight European and Mediterranean populations, and 40 timber samples from four sawmills, based on five SSR loci, using the Evanno method [51]. The right panel shows ΔK values [mean(|L’’(K)|) / sd(L(K))] for each K. Table S1: Characteristics of the 12 SSR loci used in this study. Table S2: Private SSR alleles detected in four Lazio chestnut coppice stands in homozygous (Hom) and heterozygous (Het) states. Numbers in brackets indicate the individuals carrying each allele. Table S3: Posterior membership coefficients (Q) obtained from STRUCTURE analysis of 160 individuals belonging to four coppice chestnut stands from the Lazio region at K = 2 and K = 4. Table S4: Pairwise comparison among the four coppice chestnut populations from the Lazio region based on Nei’s unbiased genetic distances (Nei uD) and Fst and Nm indices. Table S5: Genetic diversity of coppice chestnut populations from four selected areas of the Lazio region based on 12 SSR loci. Npa = number of private alleles; Na = number of alleles per locus; Ne = effective number of alleles; I = Shannon’s information index; Ho = observed heterozygosity; He = expected heterozygosity; uHe = unbiased expected heterozygosity; F = inbreeding coefficient. Table S6: Posterior membership coefficients (Q) obtained from STRUCTURE analysis of 369 individuals from four Lazio coppice chestnut populations and eight European populations at K = 3. Table S7: Genetic diversity parameters of the four Lazio coppice chestnut populations and the eight European populations used for comparison, calculated based on five SSR loci. NI = number of individuals; Npa = number of private alleles; Na = number of alleles per locus; Ne = effective number of alleles; I = Shannon’s information index; Ho = observed heterozygosity; He = expected heterozygosity; uHe = unbiased expected heterozygosity; F = inbreeding coefficient; Ar = allelic richness. Table S8: Bayesian population structure analysis of four coppice chestnut stands (Lazio region: IT02–IT05) and 40 timber samples from four sawmills (MCt, RPt, CALt, FRAt) using seven SSR loci. Inferred gene pools at K = 2 and K = 4. Membership coefficients (Q) are reported for each cluster, with the highest value highlighted in bold. Table S9: Posterior membership coefficients (Q) from STRUCTURE analysis of 160 individuals from four coppice chestnut stands (Lazio region: IT02–IT05) and 40 timber samples from four sawmills (MCt, RPt, CALt, FRAt) using seven SSR loci at K = 2 and K = 4. Table S10: Self-assignment success of the four Lazio populations based on seven SSR loci and detailed assignment percentages among populations inferred using the Bayesian method reported in [60] implemented in [59]. Table S11: −log10 genotype likelihood values of the four timber groups relative to the four Lazio reference populations. Table S12: Assignment scores and LOD-based exclusion probabilities of the four timber groups relative to the four Lazio reference populations. Table S13: Bayesian population structure analysis of 12 European and Mediterranean natural populations (SP02, SP03, SP06, IT01–IT05, IT08, GR01, GR02, TR03) and timber samples from four sawmills (MCt, RPt, CALt, FRAt) using five SSR loci. Inferred gene pools at K = 3. Membership cofficients (Q) are reported for each cluster, with the highest value highlighted in bold. Table S14: Posterior membership coefficients (Q) from STRUCTURE analysis of 369 individuals from 12 European and Mediterranean natural populations (SP02, SP03, SP06, IT01–IT05, IT08, GR01, GR02, TR03) and 40 timber samples from four sawmills (MCt, RPt, CALt, FRAt) using five SSR loci at K = 3. Table S15: Self-assignment success of the 12 European and Mediterranean populations based on seven SSR loci and detailed assignment percentages among populations inferred using the Bayesian method of [60] implemented in [59]. Table S16: −log10 genotype likelihood values of the four timber groups relative to the 12 reference populations. Table S17: Assignment scores and LOD-based exclusion probabilities of the four timber groups relative to the 12 reference populations.
Author Contributions
Conceptualization, M.C., E.K and. F.C.; methodology, A.-R.P and M.M.; software, M.C, M.M., and A.-R-P.; validation, M.C., E.K., M.M., and A.-R.P.; formal analysis, M.M., A.-R.P., and E.K.; investigation, M.C., E.K., M.M., and A.-R.P.; resources, M.C. and F.C.; data curation, M.C., E.K., M.M., and A.-R.P.; writing—original draft preparation, M.M. and M.C.; writing—review and editing, M.M., M.C., and E.K.; visualization, M.M and A.-R.P.; supervision, M.C. and F.C.; project administration, F.C. and M.C.; funding acquisition, M.C. E.K., and F.C. All authors have read and agreed to the published version of the manuscript.”.
Funding
Research carried out with PRS-Lazio funds, 2014-2020, through a public tender adopted by Executive Decision n. G11180 of 21/09/2021, Measure 16, Sub-measure 16.2, Type of operation 16.2.1 “Support for pilot projects and the development of new products, practices, processes and technologies”. Application n. 24250029758, Project “Innovative tools for boosting the chestnut ecosystem services” - Code project F89H23000080009.
Data Availability Statement
The data contained within the present article and in its Supplementary. Materials are freely available upon request to the corresponding author.
Acknowledgments
The authors thank Dr. Claudia Mattioni (IRET—Research Institute on Terrestrial Ecosystems, National Research Council, Porano, Italy) for providing the reference DNA samples used as internal calibration controls, essential for ensuring the standardization and reproducibility of the genotypic data. The authors also thank Dr. Giovanna Ciaffi (Assistant Professor of Economics, Department of Human and Social Sciences, DiSUS, e-Campus University) for performing the Discriminant Analysis of Principal Components (DAPC) and for contributing to the interpretation of the results obtained from the Bayesian assignment and exclusion analyses carried out using GDA_NT 2021. The authors are grateful to the members of the Interdepartmental Centre of Biotechnology Services of Agricultural, Chemical and Industrial Interest (C.I.B.I.A.C.I., Florence (FI), Italy) for their assistance with genotyping laboratory work. Finally, the authors are grateful to the forest owners and sawmills who provided the samples for the development of the study.
Conflicts of Interest
The authors declare no conflicts of interest.
References
- Conedera, M.; Tinner, W.; Krebs, P.; de Rigo, D.; Caudullo, G. Castanea sativa in Europe: Distribution, Habitat, Usage and Threats. In European Atlas of Forest Tree Species; San-Miguel-Ayanz, J., de Rigo, D., Caudullo, G., Houston Durrant, T., Mauri, A., Eds.; Publications Office of the European Union: Luxembourg, 2016; pp. 78–79. [Google Scholar]
- Food and Agriculture Organization of the United Nations (FAO). Global Forest Resources Assessment 2020—Main Report; FAO: Rome, Italy, 2020. [Google Scholar]
- Conedera, M.; Krebs, P.; Tinner, W.; Pradella, M.; Torriani, D. The cultivation of Castanea sativa (Mill.) in Europe: From its origin to its diffusion on a continental scale. Veget. Hist. Archaeobot. 2004, 13, 161–179. [Google Scholar] [CrossRef]
- Krebs, P.; Conedera, M.; Pradella, M.; Torriani, D.; Felber, M.; Tinner, W. Quaternary refugia of the sweet chestnut (Castanea sativa Mill.): An extended palynological approach. Veget. Hist. Archaeobot. 2004, 13, 145–160. [Google Scholar] [CrossRef]
- Mattioni, C.; Martin, M.A.; Pollegioni, P.; Cherubini, M.; Villani, F. Microsatellite markers reveal a strong geographical structure in European populations of Castanea sativa (Fagaceae): Evidence for multiple glacial refugia. Am. J. Bot. 2013, 100, 951–961. [Google Scholar] [CrossRef] [PubMed]
- Pereira-Lorenzo, S.; Bischofberger, Y.; Conedera, M.; Piattini, P.; Crovadore, J.; Chablais, R.; Rudow, A.; Hatt, S.; Ramos-Cabrer, A.M.; Barreneche, T.; Lefort, F. Reservoir of the European chestnut diversity in Switzerland. Biodivers. Conserv. 2020, 29, 2217–2234. [Google Scholar] [CrossRef]
- Villani, F.; Pigliucci, M.; Cherubini, M. Evolution of Castanea sativa Mill. in Turkey and Europe. Genet. Res. 1994, 63, 109–116. [Google Scholar] [CrossRef]
- Martin, M.A.; Mattioni, C.; Cherubini, M.; Taurchini, D.; Villani, F. Genetic diversity in European chestnut populations by means of genomic and genic microsatellite markers. Tree Genet. Genomes 2010, 6, 735–744. [Google Scholar] [CrossRef]
- Jarman, R.; Mattioni, C.; Russell, K.; Chambers, F.M.; Bartlett, D.; Martin, M.A.; et al. DNA analysis of Castanea sativa (sweet chestnut) in Britain and Ireland: Elucidating European origins and genepool diversity. PLoS ONE 2019, 14, e0222936. [Google Scholar] [CrossRef] [PubMed]
- Bouffartigue, C.; Debille, S.; Fabreguettes, O.; et al. Two main genetic clusters with high admixture between forest and cultivated chestnut (Castanea sativa Mill.) in France. Ann. For. Sci. 2020, 77, 74. [Google Scholar] [CrossRef]
- Botta, R.; Marinoni, D.; Beccaro, G.; Akkak, A.; Bounous, G. Development of a DNA typing technique for the genetic certification of chestnut cultivars. For. Snow Landsc. Res. 2001, 76, 425–428. [Google Scholar]
- Martin, M.A.; Mattioni, C.; Cherubini, M.; Taurchini, D.; Villani, F. Genetic characterization of traditional chestnut varieties in Italy using microsatellite (simple sequence repeat) markers. Ann. Appl. Biol. 2010, 157, 37–44. [Google Scholar] [CrossRef]
- Alessandri, S.; Krznar, M.; Ajolfi, D.; Ramos Cabrer, A.M.; Pereira-Lorenzo, S.; Dondini, L. Genetic diversity of Castanea sativa Mill. accessions from the Tuscan-Emilian Apennines and Emilia Romagna region (Italy). Agronomy 2020, 10, 1319. [Google Scholar] [CrossRef]
- Cavallini, M.; Lombardo, G.; Binelli, G.; Cantini, C. Assessing the genetic identity of Tuscan sweet chestnut (Castanea sativa Mill.). Forests 2022, 13, 967. [Google Scholar] [CrossRef]
- Bini, L.; Gori, M.; Nin, S.; Natale, R.; Meacci, E.; Giordani, E.; Biricolti, S. Assessing the genetic variability of sweet chestnut varieties from the Tuscan Apennine Mountains (Italy). Agronomy 2023, 13, 1947. [Google Scholar] [CrossRef]
- Pereira-Lorenzo, S.; Ramos-Cabrer, A.M.; Barreneche, T.; Mattioni, C.; Villani, F.; Díaz-Hernández, M.B. Database of European chestnut cultivars and definition of a core collection using simple sequence repeats. Tree Genet. Genomes 2017, 13, 114. [Google Scholar] [CrossRef]
- Fernandez-Cruz, J.; Fernandez-Lopez, J. Genetic structure of wild sweet chestnut (Castanea sativa Mill.) populations in northwest Spain and their differences with other European stands. Conserv. Genet. 2016, 17, 949–967. [Google Scholar] [CrossRef]
- Mattioni, C.; Martin, M.A.; Chiocchini, F.; Cherubini, M.; Gaudet, M.; Pollegioni, P.; Velichkov, I.; Jarman, R.; Chambers, F.M.; Paule, L.; et al. Landscape genetics structure of European sweet chestnut (Castanea sativa Mill.): Indications for conservation priorities. Tree Genet. Genomes 2017, 13, 39. [Google Scholar] [CrossRef]
- Gasparini, P.; Di Cosmo, L.; Floris, A.; De Laurentis, D. Italian National Forest Inventory—Methods and Results of the Third Survey. In Springer Tracts in Civil Engineering; Springer: Cham, Switzerland, 2022. [Google Scholar] [CrossRef]
- Caré, O.; Kuchma, O.; Hosius, B.; Voth, W.; Thurm, E.A.; Leinemann, L. Patterns of genetic variation and the potential origin of sweet chestnut (Castanea sativa Mill.) stands far from its natural northern distribution edge. Silvae Genet. 2023, 72, 200–210. [Google Scholar] [CrossRef]
- Allendorf, F.W.; Luikart, G.H.; Aitken, S.N. Conservation and the Genetics of Populations, 2nd ed.; Blackwell Publishing: Malden, MA, USA, 2012; 624p. [Google Scholar]
- Lowe, A.J.; Cross, H.B. The application of DNA methods to timber tracking and origin verification. IAWA J. 2011, 32, 251–262. [Google Scholar] [CrossRef]
- Dormontt, E.E.; Boner, M.; Braun, B.; Breulmann, G.; Degen, B.; Espinoza, E.; Gardner, S.; Guillery, P.; Hermanson, J.C.; Koch, G.; et al. Forensic timber identification: It’s time to integrate disciplines to combat illegal logging. Biol. Conserv. 2015, 191, 790–798. [Google Scholar] [CrossRef]
- Vlam, M.; de Groot, G.A.; Boom, A.; Copini, P.; Laros, I.; Veldhuijzen, K.; Zakamdi, D.; Zuidema, P.A. Developing forensic tools for an African timber: Regional origin is revealed by genetic characteristics, but not by isotopic signature. Biol. Conserv. 2018, 220, 262–271. [Google Scholar] [CrossRef]
- Deguilloux, M.F.; Pemonge, M.H.; Petit, R.J. Novel perspectives in wood certification and forensics: Dry wood as a source of DNA. Proc. R. Soc. B Biol. Sci. 2002, 269, 1039–1046. [Google Scholar] [CrossRef]
- Degen, B.; Ward, S.E.; Lemes, M.R.; Navarro, C.; Cavers, S.; Sebbenn, A.M. Verifying the geographic origin of mahogany (Swietenia macrophylla King) with DNA fingerprints. Forensic Sci. Int. Genet. 2013, 7, 55–62. [Google Scholar] [CrossRef]
- Jolivet, C.; Degen, B. Use of DNA fingerprints to control the origin of sapelli timber (Entandrophragma cylindricum) at the forest concession level in Cameroon. Forensic Sci. Int. Genet. 2012, 6, 487–493. [Google Scholar] [CrossRef] [PubMed]
- Nithaniyal, S.; Newmaster, S.G.; Ragupathy, S.; Krishnamoorthy, D.; Vassou, S.L.; Parani, M. DNA barcode authentication of wood samples of threatened and commercial timber trees within the tropical dry evergreen forest of India. PLoS ONE 2014, 9, e107669. [Google Scholar] [CrossRef]
- Tnah, L.H.; Lee, S.L.; Ng, K.K.S.; Faridah, Q.Z.; Faridah-Hanum, I. Forensic DNA profiling of tropical timber species in Peninsular Malaysia. For. Ecol. Manag. 2010, 259, 1436–1446. [Google Scholar] [CrossRef]
- Degen, B.; Blanc-Jolivet, C.; Stierand, K.; Gillet, E. A nearest neighbour approach by genetic distance to the assignment of individual trees to geographic origin. Forensic Sci. Int. Genet. 2017, 27, 132–141. [Google Scholar] [CrossRef]
- Chaves, C.L.; Degen, B.; Pakull, B.; Mader, M.; Honorio, E.; Ruas, P.; Tysklind, N.; Sebbenn, A.M. Assessing the ability of chloroplast and nuclear DNA gene markers to verify the geographic origin of jatoba (Hymenaea courbaril L.) timber. J. Hered. 2018, 109, 543–552. [Google Scholar] [CrossRef] [PubMed]
- Finch, K.N.; Cronn, R.C.; Ayala Richter, M.C.; Blanc-Jolivet, C.; Correa Guerrero, M.C.; de Stefano Beltrán, L.; García-Dávila, C.R.; Honorio Coronado, E.N.; Palacios-Ramos, S.; Paredes-Villanueva, K.; et al. Predicting the geographic origin of Spanish cedar (Cedrela odorata L.) based on DNA variation. Conserv. Genet. 2020, 21, 625–639. [Google Scholar] [CrossRef]
- Honorio Coronado, E.N.; Blanc-Jolivet, C.; Mader, M.; García-Dávila, C.R.; Aldana Gomero, D.; del Castillo Torres, D.; Flores Llampazo, G.; Hidalgo Pizango, G.; Sebbenn, A.M.; Meyer-Sand, B.R.; et al. SNP markers as a successful molecular tool for assessing species identity and geographic origin of trees in the economically important South American legume genus Dipteryx. J. Hered. 2020, 111, 346–356. [Google Scholar] [CrossRef]
- Blanc-Jolivet, C.; Liesebach, M. Tracing the origin and species identity of Quercus robur and Quercus petraea in Europe: A review. Silvae Genet. 2015, 64, 182–193. [Google Scholar] [CrossRef]
- Schroeder, H.; Cronn, R.; Yanbaev, Y.; Jennings, T.; Mader, M.; Degen, B.; Kersten, B. Development of molecular markers for determining continental origin of wood from white oaks (Quercus L. sect. Quercus). PLoS ONE 2016, 11, e0158221. [Google Scholar] [CrossRef] [PubMed]
- Tereba, A.; Woodward, S.; Konecka, A.; Borys, M.; Nowakowska, J.A. Analysis of DNA profiles of ash (Fraxinus excelsior L.) to provide evidence of illegal logging. Wood Sci. Technol. 2017, 51, 1377–1387. [Google Scholar] [CrossRef]
- Teani, A.; de Dato, G. Log traceability and supply chain verification by DNA markers in Fagus sylvatica L. in Italy. Ann. Silvic. Res. 2022, 47, 95–103. [Google Scholar] [CrossRef]
- Fatima, T.; Srivastava, A.; Hanur, V.S.; Srinivasa Rao, M. An effective wood DNA extraction protocol for three economically important timber species of India. Am. J. Plant Sci. 2018, 9, 139–149. [Google Scholar] [CrossRef]
- European Parliament and Council. Regulation (EU) No 995/2010 of the European Parliament and of the Council of 20 October 2010 laying down the obligations of operators who place timber and timber products on the market (EU Timber Regulation). Off. J. Eur. Union 2010, L295, 23–34. [Google Scholar]
- European Parliament and Council. Regulation (EU) 2023/1115 of the European Parliament and of the Council of 31 May 2023 on the making available on the Union market and export from the Union of certain commodities and products associated with deforestation and forest degradation (EU Deforestation Regulation). Off. J. Eur. Union 2023, L150, 206–247. [Google Scholar]
- Castellana, S.; Martin, M.Á.; Solla, A.; Alcaide, F.; Villani, F.; Cherubini, M.; Neale, D.; Mattioni, C. Signatures of local adaptation to climate in natural populations of sweet chestnut (Castanea sativa Mill.) from southern Europe. Ann. For. Sci. 2021, 78, 27. [Google Scholar] [CrossRef]
- Buck, E.J.; Hadonou, M.; James, C.J.; Blakesley, D.; Russell, K. Isolation and characterization of polymorphic microsatellites in European chestnut (Castanea sativa Mill.). Mol. Ecol. Notes 2003, 3, 239–241. [Google Scholar] [CrossRef]
- Marinoni, D.; Akkak, A.; Bounous, G.; Edwards, K.J.; Botta, R. Development and characterization of microsatellite markers in Castanea sativa (Mill.). Mol. Breed. 2003, 11, 127–136. [Google Scholar] [CrossRef]
- Alessandri, S.; Ramos-Cabrer, A.M.; Martín, M.A.; Mattioni, C.; Pereira-Lorenzo, S.; Dondini, L. Genetic characterization of Italian and Spanish wild and domesticated chestnut trees. Sci. Hortic. 2022, 295, 110882. [Google Scholar] [CrossRef]
- Liu, K.; Muse, S.V. PowerMarker: An integrated analysis environment for genetic marker analysis. Bioinformatics 2005, 21, 2128–2129. [Google Scholar] [CrossRef]
- Peakall, R.; Smouse, P.E. GenAlEx 6: Genetic analysis in Excel. Population genetic software for teaching and research. Mol. Ecol. Notes 2006, 6, 288–295. [Google Scholar] [CrossRef]
- Weber, J.L. Informativeness of human (dC–dA)n·(dG–dT)n polymorphisms. Genomics 1990, 7, 524–530. [Google Scholar] [CrossRef]
- Nei, M. The theory and estimation of genetic distance. In Genetic Structure of Populations; Morton, N.E., Ed.; University Press of Hawaii: Honolulu, HI, USA, 1973; pp. 45–54. [Google Scholar]
- Kumar, S.; Stecher, G.; Li, M.; Knyaz, C.; Tamura, K. MEGA X: Molecular Evolutionary Genetics Analysis across computing platforms. Mol. Biol. Evol. 2018, 35, 1547–1549. [Google Scholar] [CrossRef]
- Pritchard, J.K.; Stephens, M.; Donnelly, P. Inference of population structure using multilocus genotype data. Genetics 2000, 155, 945–959. [Google Scholar] [CrossRef]
- Evanno, G.; Regnaut, S.; Goudet, J. Detecting the number of clusters of individuals using the software STRUCTURE: A simulation study. Mol. Ecol. 2005, 14, 2611–2620. [Google Scholar] [CrossRef] [PubMed]
- Li, Y.-L.; Liu, J.-X. StructureSelector: A web-based software to select and visualize the optimal number of clusters using multiple methods. Mol. Ecol. Resour. 2018, 18, 176–177. [Google Scholar] [CrossRef]
- Kopelman, N.M.; Mayzel, J.; Jakobsson, M.; Rosenberg, N.A.; Mayrose, I. CLUMPAK: A program for identifying clustering modes and packaging population structure inferences across K. Mol. Ecol. Resour. 2015, 15, 1179–1191. [Google Scholar] [CrossRef]
- Goudet, J. FSTAT (Version 2.9.3.2): A Program to Estimate and Test Gene Diversities and Fixation Indices; University of Lausanne: Lausanne, Switzerland, 2002; Available online: https://www2.unil.ch/popgen/softwares/fstat.htm.
- Doyle, J.J.; Doyle, J.L. A rapid DNA isolation procedure for small quantities of fresh leaf tissue. Phytochem. Bull. 1987, 19, 11–15. [Google Scholar]
- Jombart, T. adegenet: A R package for the multivariate analysis of genetic markers. Bioinformatics 2008, 24, 1403–1405. [Google Scholar] [CrossRef] [PubMed]
- Jombart, T.; Devillard, S.; Balloux, F. Discriminant analysis of principal components: A new method for the analysis of genetically structured populations. BMC Genet. 2010, 11, 94. [Google Scholar] [CrossRef]
- Jombart, T.; Ahmed, I. adegenet 1.3-1: New tools for the analysis of genome-wide SNP data. Bioinformatics 2011, 27, 3070–3071. [Google Scholar] [CrossRef]
- Degen, B. GDA-NT 2021: A computer program for population genetic data analysis and assignment. Conserv. Genet. Resour. 2022. [Google Scholar] [CrossRef]
- Rannala, B.; Mountain, J.L. Detecting immigration by using multilocus genotypes. Proc. Natl. Acad. Sci. USA 1997, 94, 9197–9201. [Google Scholar] [CrossRef]
- Beghè, D.; Ganino, T.; Dall’Asta, C.; Silvanini, A.; Cirlini, M.; Fabbri, A. Identification and characterization of ancient Italian chestnut cultivars using nuclear microsatellite markers. Sci. Hortic. 2013, 164, 50–57. [Google Scholar] [CrossRef]
- Marinoni, D.; Akkak, A.; Beltramo, C.; Guaraldo, P.; Boccacci, P.; Bounous, G.; Ferrara, A.M.; Ebone, A.; Viotto, E.; Botta, R. Genetic and morphological characterization of chestnut (Castanea sativa Mill.) germplasm in Piedmont (north-western Italy). Tree Genet. Genomes 2013, 9, 1017–1030. [Google Scholar] [CrossRef]
- Petit, R.J.; El Mousadik, A.; Pons, O. Identifying populations for conservation on the basis of genetic markers. Conserv. Biol. 1998, 12, 844–855. [Google Scholar] [CrossRef]
- Botstein, D.; White, R.L.; Skolnick, M.; Davis, R.W. Construction of a genetic linkage map in man using restriction fragment length polymorphisms. Am. J. Hum. Genet. 1980, 32, 314–331. [Google Scholar]
- Mattioni, C.; Cherubini, M.; Micheli, E.; Villani, F.; Bucci, G. Role of domestication in shaping Castanea sativa genetic variation in Europe. Tree Genet. Genomes 2008, 4, 563–574. [Google Scholar] [CrossRef]
- Skender, A.; Kurtović, M.; Pojskic, N.; Kalamujic-Stroil, B.; Hadziabulic, S.; Gasi, F. Genetic structure and diversity of European chestnut (Castanea sativa Mill.) populations in the western Balkans: On a crossroad between east and west. Genetika 2017, 49, 613–626. [Google Scholar] [CrossRef]
- Poljak, I.; Idžojtić, M.; Šatović, Z.; Ježić, M.; Ćurković-Perica, M.; Simovski, B.; Acevski, J.; Liber, Z. Genetic diversity of the sweet chestnut (Castanea sativa Mill.) in Central Europe and the western part of the Balkan Peninsula and evidence of marron genotype introgression into wild populations. Tree Genet. Genomes 2017, 13, 18. [Google Scholar] [CrossRef]
- Cuestas, M.I.; Mattioni, C.; Martín, L.M.; Vargas-Osuna, E.; Cherubini, M.; Martín, M.A. Functional genetic diversity of chestnut (Castanea sativa Mill.) populations from southern Spain. For. Syst. 2017, 26, eSC06. [Google Scholar] [CrossRef]
- Lusini, I.; Velichkov, I.; Pollegioni, P.; Chiocchini, F.; Hinkov, G.; Zlatanov, T.; Cherubini, M.; Mattioni, C. Estimating the genetic diversity and spatial structure of Bulgarian Castanea sativa populations by SSRs: Implications for conservation. Conserv. Genet. 2014, 15, 283–293. [Google Scholar] [CrossRef]
- Petit, R.J.; Hampe, A. Some evolutionary consequences of being a tree. Annu. Rev. Ecol. Evol. Syst. 2006, 37, 187–214. [Google Scholar] [CrossRef]
- Méndez Cea, B.; Cobo Simón, I.; Pérez González, A.; García García, I.; Linares, J.C.; Gallego Rodríguez, F.J. DNA extraction and amplification from Pinaceae dry wood. Silvae Genet. 2019, 68, 55–57. [Google Scholar] [CrossRef]
- Singh, M.; Sodhi, K.K.; Paliwal, A.; Sharma, S.; Randhawa, G. Efficient DNA extraction procedures for processed food derivatives—A critical step to ensure quality for GMO analysis. Food Anal. Methods 2021, 14, 2249–2261. [Google Scholar] [CrossRef]
- Lade, B.D.; Patil, A.S.; Paikrao, H.M. Efficient genomic DNA extraction protocol from medicinally important Passiflora foetida containing high levels of polysaccharides and polyphenols. SpringerPlus 2014, 3, 457. [Google Scholar] [CrossRef] [PubMed]
- Viljoen, C.D.; Booysen, C.; Sreenivasen Tantuan, S. The suitability of using spectrophotometry to determine the concentration and purity of DNA extracted from processed food matrices. J. Food Compos. Anal. 2022, 112, 104689. [Google Scholar] [CrossRef]
- Paithankar, K.R.; Prasad, K.S. Precipitation of DNA by polyethylene glycol and ethanol. Nucleic Acids Res. 1991, 19, 1346. [Google Scholar] [CrossRef]
- Arbeli, Z.; Fuentes, C.L. Improved purification and PCR amplification of DNA from environmental samples. FEMS Microbiol. Lett. 2007, 272, 269–275. [Google Scholar] [CrossRef] [PubMed]
- Hedman, J.; Rådström, P. Overcoming inhibition in real-time diagnostic PCR. In PCR Detection of Microbial Pathogens; Wilks, M., Ed.; Humana Press: Totowa, NJ, USA, 2013; pp. 17–48. [Google Scholar] [CrossRef]
Figure 1.
Bar plots of mean membership proportions (Q) for the 160 genotypes from the four coppice chestnut populations of the Lazio region at K = 2 and K = 4, obtained through STRUCTURE analysis and graphically displayed using the CLUMPAK software [53]. Each vertical bar represents one individual, and each cluster is indicated by a different color. For K = 2: Cluster 1, light blue; Cluster 2, orange. For K = 4: Cluster 1, light blue; Cluster 2, orange; Cluster 3, green; Cluster 4, purple.

Figure 2.
Bar plot of average membership proportions (Q) for 369 individuals from four Lazio coppice chestnut populations and eight European populations at K = 3, inferred using STRUCTURE and visualized with CLUMPAK [53]. Each vertical bar represents one individual, and clusters are shown in different colors: Cluster 1 (purple), Cluster 2 (light blue), and Cluster 3 (orange).

Figure 3.
UPGMA dendrogram of genetic relationships among Lazio and European chestnut populations.

Figure 4.
Discriminant Analysis of Principal Components (DAPC) of four coppice chestnut populations of the Lazio region (IT02, IT03, IT04, IT05) and timber samples from four sawmills (MCt, RPt, CALt, FRAt) based on seven SSR loci. The scatterplot shows individual genotypes projected onto the first two discriminant functions. Points represent individuals, and inertia ellipses illustrate group dispersion. The inset panels report the PCA eigenvalues (left) and the discriminant analysis (DA) eigenvalues (right).

Figure 5.
Bar plots of individual membership proportions (Q) for 160 genotypes from four coppice chestnut populations of the Lazio region (IT02, IT03, IT04, IT05) and 40 timber samples from four sawmills (MCt, RPt, CALt, FRAt), based on seven SSR loci at K = 2 and K = 4 inferred using STRUCTURE and visualized with CLUMPAK [53]. Each vertical bar represents one individual, and colors indicate inferred genetic clusters. At K = 2, Cluster 1 is shown in light blue and Cluster 2 in orange. At K = 4, Cluster 1 is light blue, Cluster 2 orange, Cluster 3 purple, and Cluster 4 green.

Figure 6.
Discriminant Analysis of Principal Components (DAPC) of 12 European and Mediterranean populations (SP02, SP03, SP06, IT02–IT05, IT08, IT01, GR01, GR02, TR03) and timber samples from four sawmills (MCt, RPt, CALt, FRAt) based on five SSR loci. The scatterplot displays individual genotypes projected onto the first two discriminant functions. Points represent individuals, and inertia ellipses indicate group dispersion. The inset panels show the PCA eigenvalues (left) and the discriminant analysis (DA) eigenvalues (right).

Figure 7.
Bar plot of individual membership proportions (Q) for 369 individuals from four Lazio coppice chestnut populations (IT02–IT05), eight European and Mediterranean populations (SP02, SP03, SP06, IT08, IT01, GR01, GR02, TR03), and 40 timber samples from four sawmills (MCt, RPt, CALt, FRAt). Analysis based on five SSR loci at K = 3, inferred using STRUCTURE and visualized with CLUMPAK [53]. Each vertical bar represents one individual. Colors indicate inferred genetic clusters: Cluster 1 (purple), Cluster 2 (light blue), Cluster 3 (orange).


Table 1.
Location, code, and number of individuals (N) of coppice chestnut populations from four selected areas of the Lazio Region, and eight natural European chestnut populations used for comparative purposes in this study.
Table 1.
Location, code, and number of individuals (N) of coppice chestnut populations from four selected areas of the Lazio Region, and eight natural European chestnut populations used for comparative purposes in this study.
| Country | Region | Population | Code | N | Reference |
| Italy | Lazio | San Martino al Cimino | IT02 | 40 | This study |
| Italy | Lazio | Rocca di Papa | IT03 | 40 | This study |
| Italy | Lazio | Oriolo Romano | IT04 | 40 | This study |
| Italy | Lazio | Fiuggi | IT05 | 40 | This study |
| Italy | Piedmont | Villar Pellice | IT08 | 26 | Castellana et al. [41] |
| Italy | Sicily | Madonie | IT01 | 20 | Castellana et al. [41] |
| Spain | Galicia | Costa Atlȧntica | SP03 | 31 | Castellana et al. [41] |
| Spain | Catalonia | Castanyet | SP02 | 29 | Castellana et al. [41] |
| Spain | Extremadura | Hervas | SP06 | 30 | Castellana et al. [41] |
| Greece | S-E-Macedonia | Holomontas | GR01 | 26 | Castellana et al. [41] |
| Greece | C-Macedonia | Hortiatis | GR02 | 24 | Castellana et al. [41] |
| Turkey | Black Sea | Hopa | TR03 | 23 | Castellana et al. [41] |
Table 2.
Genetic diversity parameters of the 12 SSR loci analyzed in 160 trees from chestnut coppice stands in the Lazio region, including number of alleles (Na), effective number of alleles (Ne), major allele frequency (MAF), Shannon’s information index (I), observed heterozygosity (Ho), expected heterozygosity (He), unbiased expected heterozygosity (uHe), inbreeding coefficient (F), and polymorphic information content (PIC).
| Locus | Na | Ne | MAF | I | Ho | He | uHe | F | PIC |
| CsCAT1 | 7.00 | 3.444 | 0.484 | 1.499 | 0.669 | 0.696 | 0.705 | 0.036 | 0.686 |
| CsCAT14 | 6.00 | 2.908 | 0.475 | 1.224 | 0.650 | 0.652 | 0.660 | 0.003 | 0.613 |
| CsCAT3 | 14.00 | 5.085 | 0.316 | 1.853 | 0.525 | 0.795 | 0.805 | 0.336 | 0.794 |
| CsCAT16 | 11.00 | 3.516 | 0.425 | 1.473 | 0.619 | 0.704 | 0.713 | 0.107 | 0.688 |
| CsCAT2 | 10.00 | 5.819 | 0.203 | 1.896 | 0.456 | 0.827 | 0.837 | 0.448 | 0.833 |
| CsCAT6 | 11.00 | 4.732 | 0.328 | 1.769 | 0.631 | 0.782 | 0.792 | 0.191 | 0.777 |
| CsCAT34 | 7.00 | 3.682 | 0.303 | 1.408 | 0.400 | 0.715 | 0.724 | 0.421 | 0.722 |
| CsCAT17 | 11.00 | 5.384 | 0.212 | 1.850 | 0.794 | 0.814 | 0.824 | 0.025 | 0.849 |
| CsCAT41 | 7.00 | 4.883 | 0.244 | 1.695 | 0.444 | 0.795 | 0.805 | 0.441 | 0.792 |
| EMCs32 | 7.00 | 2.984 | 0.469 | 1.287 | 0.250 | 0.662 | 0.670 | 0.631 | 0.650 |
| EMCs25 | 6.00 | 2.346 | 0.547 | 1.102 | 0.213 | 0.568 | 0.575 | 0.612 | 0.567 |
| EMCs38 | 13.00 | 6.830 | 0.237 | 2.132 | 0.538 | 0.852 | 0.862 | 0.370 | 0.874 |
| Mean | 9.17 | 4.301 | 0.354 | 1.599 | 0.516 | 0.738 | 0.748 | 0.302 | 0.737 |
| Total | 110.00 |
Table 3.
Population structure analysis using a Bayesian clustering approach. The analyzed populations derive their genetic structure from inferred gene pools (K = 2 or K = 4). The proportion of membership to each cluster is reported, with the main contribution highlighted in bold. Each population includes 40 individuals.
| Inferred Clusters | |||||||
| K=2 | K=4 | ||||||
| Pop | 1 | 2 | 1 | 2 | 3 | 4 | |
| IT02 | 0.798 | 0.202 | 0.594 | 0.165 | 0.119 | 0.121 | |
| IT03 | 0.700 | 0.300 | 0.237 | 0.394 | 0.211 | 0.158 | |
| IT04 | 0.652 | 0.348 | 0.135 | 0.130 | 0.509 | 0.226 | |
| IT05 | 0.284 | 0.716 | 0.107 | 0.358 | 0.054 | 0.481 | |
Table 4.
Analysis of molecular variance (AMOVA), fixation index (Fst), and gene flow (Nm) in the four coppice chestnut populations from the Lazio region. *** p-value <0.001.
Table 4.
Analysis of molecular variance (AMOVA), fixation index (Fst), and gene flow (Nm) in the four coppice chestnut populations from the Lazio region. *** p-value <0.001.
| Source | df | SS | MS | Est. Var. | % | Fst | Nm |
| Among Pops | 3 | 56.353 | 18.784 | 0.179 | 4% | ||
| Within Pops | 316 | 1417.488 | 4.486 | 4.486 | 96% | ||
| Total | 319 | 1473.841 | 4.664 | 100% | 0.038 *** | 7.371 |
Table 5.
Population structure analysis using a Bayesian clustering approach. Genetic structure is inferred from K = 3 gene pools. Membership proportions of the 12 populations in each cluster are reported, with the main contribution highlighted in bold.
Table 5.
Population structure analysis using a Bayesian clustering approach. Genetic structure is inferred from K = 3 gene pools. Membership proportions of the 12 populations in each cluster are reported, with the main contribution highlighted in bold.
| Inferred Clusters | ||||
| Pop | 1 | 2 | 3 | N individuals |
| SP03 | 0.960 | 0.020 | 0.019 | 31 |
| SP02 | 0.897 | 0.076 | 0.027 | 29 |
| SP06 | 0.934 | 0.018 | 0.048 | 30 |
| IT02 | 0.030 | 0.924 | 0.045 | 40 |
| IT03 | 0.032 | 0.908 | 0.060 | 40 |
| IT04 | 0.036 | 0.927 | 0.037 | 40 |
| IT05 | 0.077 | 0.878 | 0.045 | 40 |
| IT08 | 0.029 | 0.158 | 0.814 | 26 |
| IT01 | 0.055 | 0.085 | 0.860 | 20 |
| GR01 | 0.118 | 0.169 | 0.713 | 26 |
| GR02 | 0.011 | 0.082 | 0.907 | 24 |
| TR03 | 0.078 | 0.109 | 0.813 | 23 |
Disclaimer/Publisher’s Note: The statements, opinions and data contained in all publications are solely those of the individual author(s) and contributor(s) and not of MDPI and/or the editor(s). MDPI and/or the editor(s) disclaim responsibility for any injury to people or property resulting from any ideas, methods, instructions or products referred to in the content. |
© 2026 by the authors. Licensee MDPI, Basel, Switzerland. This article is an open access article distributed under the terms and conditions of the Creative Commons Attribution (CC BY) license (http://creativecommons.org/licenses/by/4.0/).
Copyright: This open access article is published under a Creative Commons CC BY 4.0 license, which permit the free download, distribution, and reuse, provided that the author and preprint are cited in any reuse.


