
Submitted:
30 March 2026
Posted:
31 March 2026
You are already at the latest version
Abstract
A nano-porous tubular ceramic membrane(TCM) is developed to recover water vapor and its significant amount of latent heat from flue gas to save water and reduce the acid dew point. The experimental and numerical investigation on both normal condensation(NCD) and capillary condensation(CCD) by insetting a horizontal TCM into membrane module. By taking user defined function(UDF) of Fluent14.5, source terms of governing equations are conducted to illuminate the NCD, capillary condensation and effects of the inertia force(Fi) on heat and mass transfer. Several cases with feed gas inlet velocity(Uin), mass fraction of non-condensable gas (Wcon), cooling water inlet temperature(Tcool) and time steps(t) are simulated, and the errors between experimental and numerical results are less than 1.14%. The results show that the thermal performance of TCM in the NCD is more significant than which in the CCD. The NCD proceeds significantly during flow in the TCM, while the CCD proceeds mainly in the backside of TCM(x-coordinate is larger than 500mm nearly). The Uin, Wcon and Tcool have a remarkable effect on thermal and mass-transfer characteristics.
Keywords:
ceramic nanoporous membrane
; capillary condensation (CCD)
; experiment
; CFD simulation
; heat and mass transfer
1. Introduction
Ceramic membrane tubes are widely utilized as porous media in various industrial applications, such as thermal power plants, due to their exceptional capability to extract and recover water vapor from flue gas[1]. As flue gas flows through the ceramic membrane tube, water vapor condenses due to changes in temperature or equilibrium pressure. The condensate permeates through the nanopores of the membrane wall and is removed by the cooling water flow, accompanied by significant latent heat transfer.
Recently, several researchers have investigated the heat transfer and water recovery performance of these membranes. In 2016, Chen et al.[2] experimentally examined the water recovery rate of a 50 nm pore-sized ceramic membrane tube under varying operational conditions, including cooling water temperature and flow rate. Their results indicated that the water recovery rate could reach a maximum of 2.5 kg/m²·h. Similarly, Hu et al.[3] compared the thermal characteristics of a 100 nm ceramic membrane tube with a fluorine plastic tube of identical dimensions. They reported that the heat transfer efficiency of the ceramic membrane tube was 1.3 to 2 times higher than that of the plastic tube under the same experimental conditions.
As a porous medium, the ceramic membrane tube facilitates two distinct condensation processes. The first, known as capillary condensation (CCD), occurs due to the alteration of the equilibrium pressure of water vapor within the membrane pores relative to the corresponding saturation pressure[4]. The second, termed normal condensation (NCD), results from forced convection heat transfer between the water vapor and the membrane surface driven by the temperature gradient across them. Due to the contribution of CCD, the condensation rate of ceramic membrane tubes[3,4] is typically 1.7 to 3 times greater than that of traditional condensing materials; consequently, CCD behavior has been extensively studied theoretically. Using the Young–Laplace equation, Uchytil[5] determined the critical pressure difference in the CCD process and correlated it with the mass transfer coefficient. Loimer[6] provided a more detailed analysis of the CCD mechanism, concluding that instantaneous pressure fluctuations were the primary factor affecting CCD. Furthermore, both the Joule–Thomson coefficient and the convection heat transfer coefficient were found to increase significantly with the assistance of CCD.
Numerous researchers have also conducted experimental and theoretical investigations into normal condensation (NCD)[7,8,9,10]. Fu et al.[7] studied the relationship between vapor content and latent heat flux during the condensation process, finding that a nitrogen mass fraction of approximately 5% led to a 13.7% decrease in the condensation rate. Bao et al.[8] simultaneously evaluated condensation heat transfer and water recovery performance. They observed that the condensation mass flux (ranging from 8 to 15.3 kg/m²·h) improved significantly with an increase in vapor mass fraction (from 0.12 to 0.2) but decreased as the nitrogen mass fraction increased (from 0.8 to 0.9). These findings suggest that the normal condensation process is significantly hindered by the presence of non-condensable gases.
In recent years, Computational Fluid Dynamics (CFD) has become a popular approach for studying the influence of non-condensable gases on NCD[11,12,13,14], owing to its time-saving potential and ability to provide detailed insights. Huang et al.[11] defined the resistance of non-condensable gas to heat transfer using a new dimensionless number: the suction effect. The authors reported that non-condensable gas accumulates near the wall surface, forming a boundary layer that resists vapor penetration. Additionally, the presence of non-condensable gas reduces the partial pressure of water vapor, thereby retarding the condensation process. Further studies have deeply investigated heat and mass transfer processes in the presence of non-condensable gas[7,11,12,13,14,15,16,17,18], developing relevant experimental correlations. Fu et al.[7] investigated variations in the diffusion coefficient using the analogy method, showing that the diffusion coefficient declines with increasing nitrogen mass fraction. Based on Knudsen’s theory, Caruso et al.[12] recently found that the increase in the Sherwood number was more pronounced due to the suction effect of non-condensable gas. Yi et al.[13] performed experiments focusing on non-condensable gas to evaluate heat flux variations. Numerical modeling of the mass transfer process has also been conducted; for instance, Behrang et al.[14] proposed a permeability model based on gas kinetic theory coupled with fractal techniques. They concluded that the condensation process leads to a decrease in permeability, attributing this trend to the remarkable suction effect of non-condensable gas.
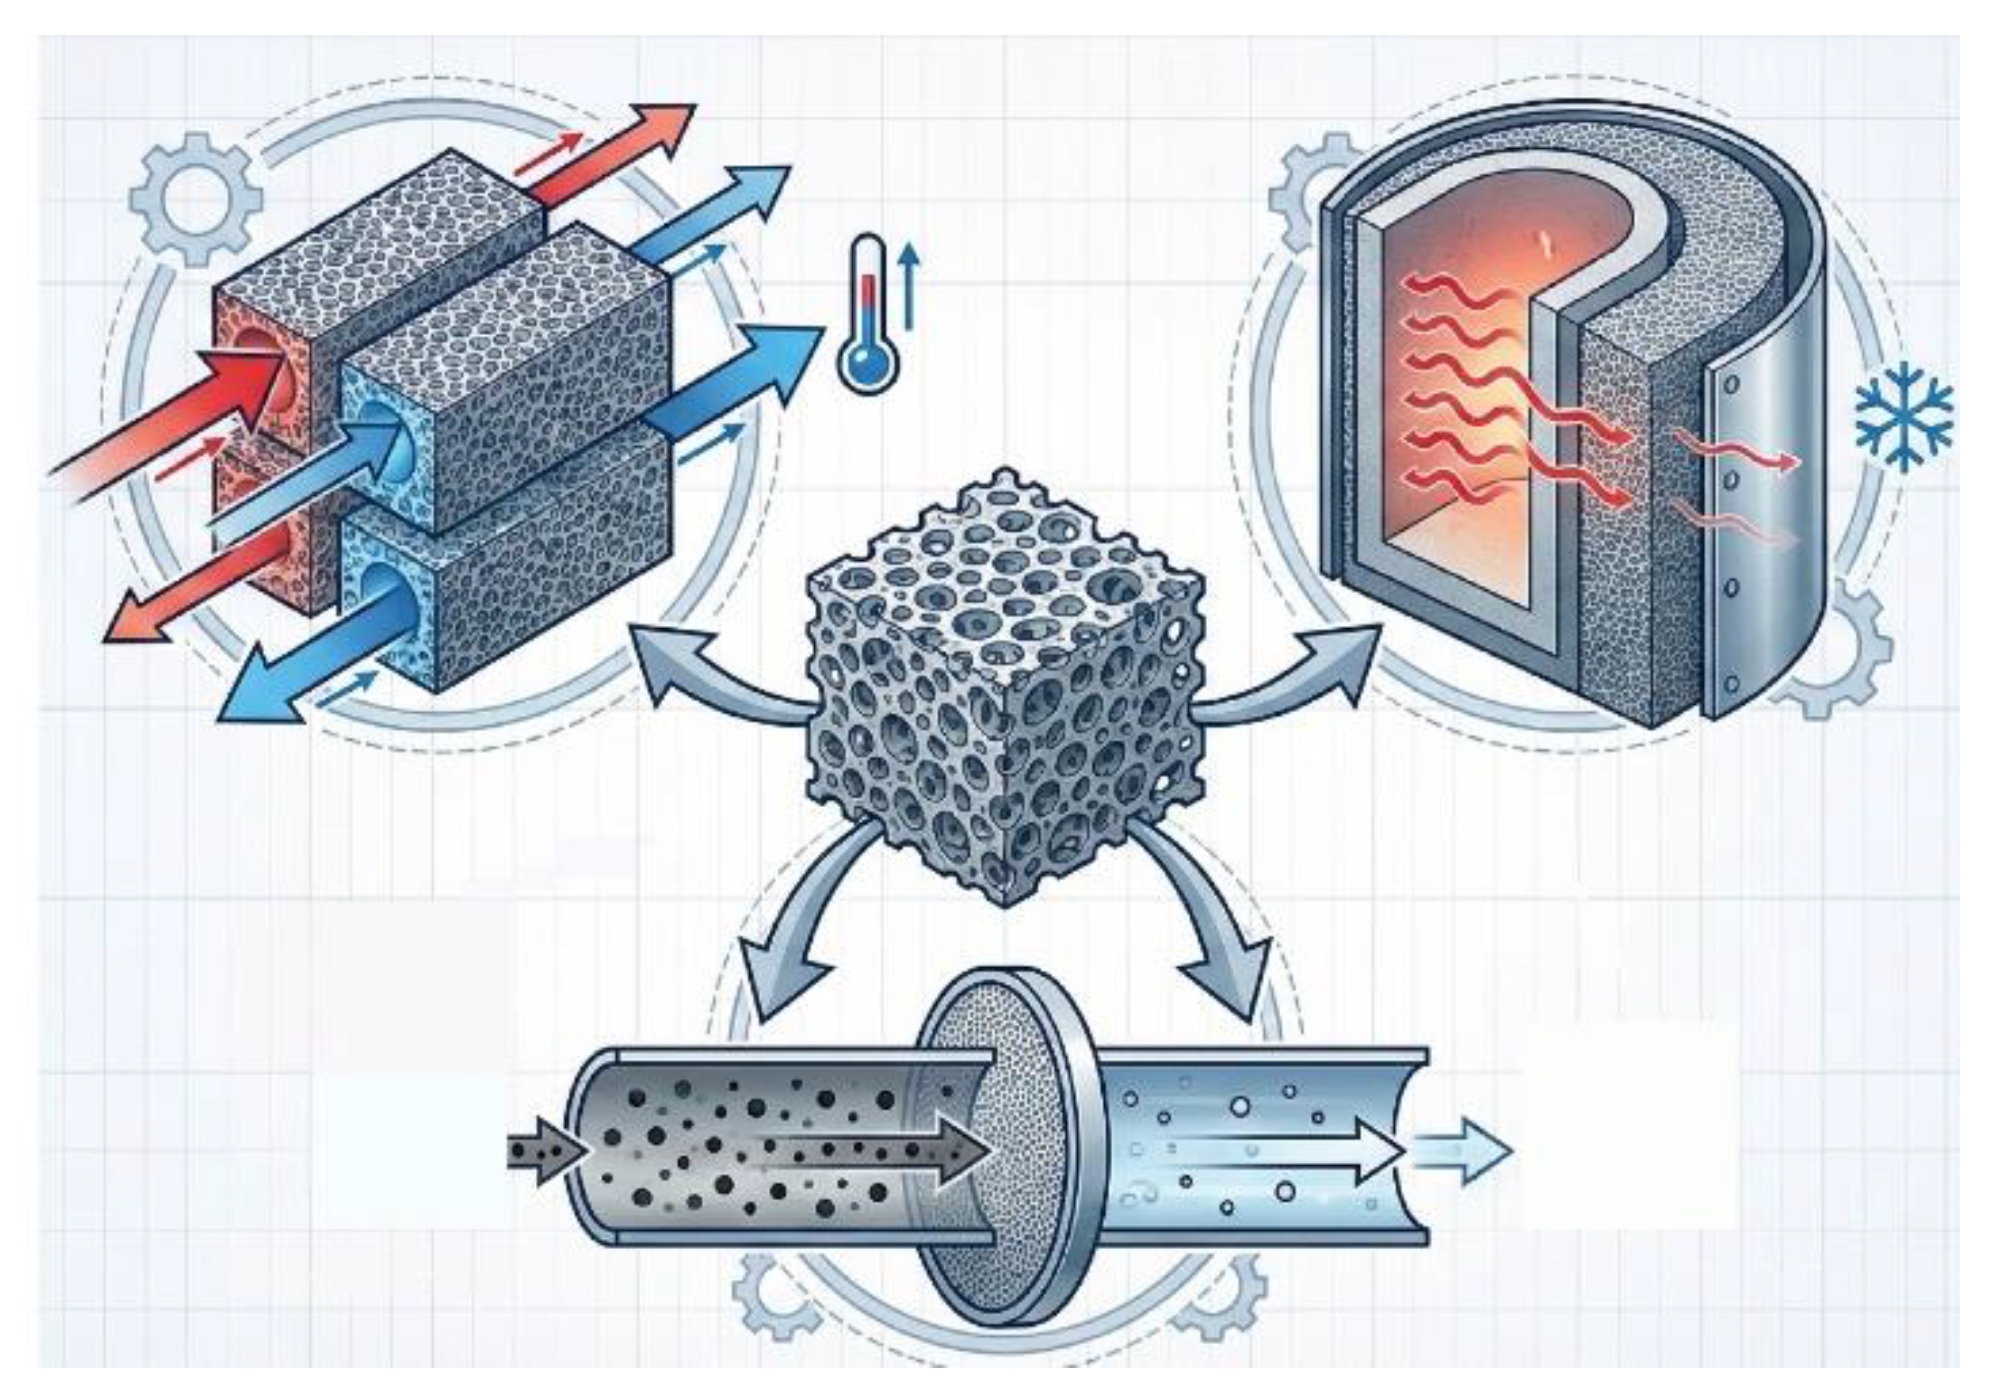
Figure 1.
Industrial applications of porous media.
Despite the extensive recent efforts in CFD-experimental studies on membrane condensation[19,20,21,22], the detailed transient mechanisms governing the multi-stage condensation process—particularly the distinction of two-phase flow characteristics between normal condensation (NCD) and capillary condensation (CCD)—remain poorly understood. To bridge this gap, this study aims to develop a macroscopic heat and mass transfer mathematical model containing heat source term expressions for different condensation behaviors (NCD and CCD). We address this gap through a combined numerical and experimental approach. Numerically, source terms representing the suction effect of non-condensable gas and inertia forces[23,24] were modeled using User-Defined Functions (UDFs) in Fluent 14.5, with fluid parameters derived from NIST 14.0. The significant novelty of this work lies in revealing the multi-level condensing mechanism induced by porous structures and thermal gradients within membrane walls. This study provides new physical insights into the underlying mechanisms driving the nonlinear and heterogeneous heat and mass transfer behaviors during condensation within porous media.
The distinction between NCD and CCD was investigated numerically and experimentally. It was found that the condensing behavior present within porous material is complex, with NCD and CCD forming synchronously once triggering conditions are met, e.g., when the relative partial pressure of water vapor is saturated. Additionally, the disparate onset conditions (e.g., wall temperature, inlet velocity, and fraction of non-condensable gas) for the two condensation behaviors induce irregular and nonlinear condensation heat and mass transfer within the porous ceramic membrane. The investigation focused on three key aspects: (1) the effects of feed gas inlet velocity on both condensation types; (2) the influence of non-condensable gas mass fraction; and (3) the thermal performance of the TCM under NCD conditions with varying cooling temperatures. The aim was to investigate the thermal performance on the membrane surface experimentally and analyze permeating behavior and capillary condensing heat-transfer characteristics within porous zones using CFD.
2. Experimental and Numerical Methods
2.1. Heat and Mass Transfer Mechanism
The experimental module consists of a horizontal, nanoporous tubular ceramic membrane (TCM) and digital gauges. The basic parameters of the TCM are obtained from the manufacturer’s specification. The inner diameter is 0.012m, the thickness is 0.0015m, and the length is 0.6m; the other performance parameters are listed in Table 1.
The vapor of feed gas may condense into liquid while flowing in two ways, namely, normal condensation (NCD) and capillary condensation (CCD). NCD occurs when the water vapor of feed gas condenses into liquid because of the heat transfer process between the feed gas and the membrane’s surface are cooled by cooling water, and then the condensate permeates through the TCM wall due to trans-membrane pressure difference. CCD occurs when the feed gas gets into the nanopores: the saturated pressure of water vapor varies sharply and instantaneously, and the water vapor condenses into liquid. The schematic of flow in the TCM is shown in Figure 2.
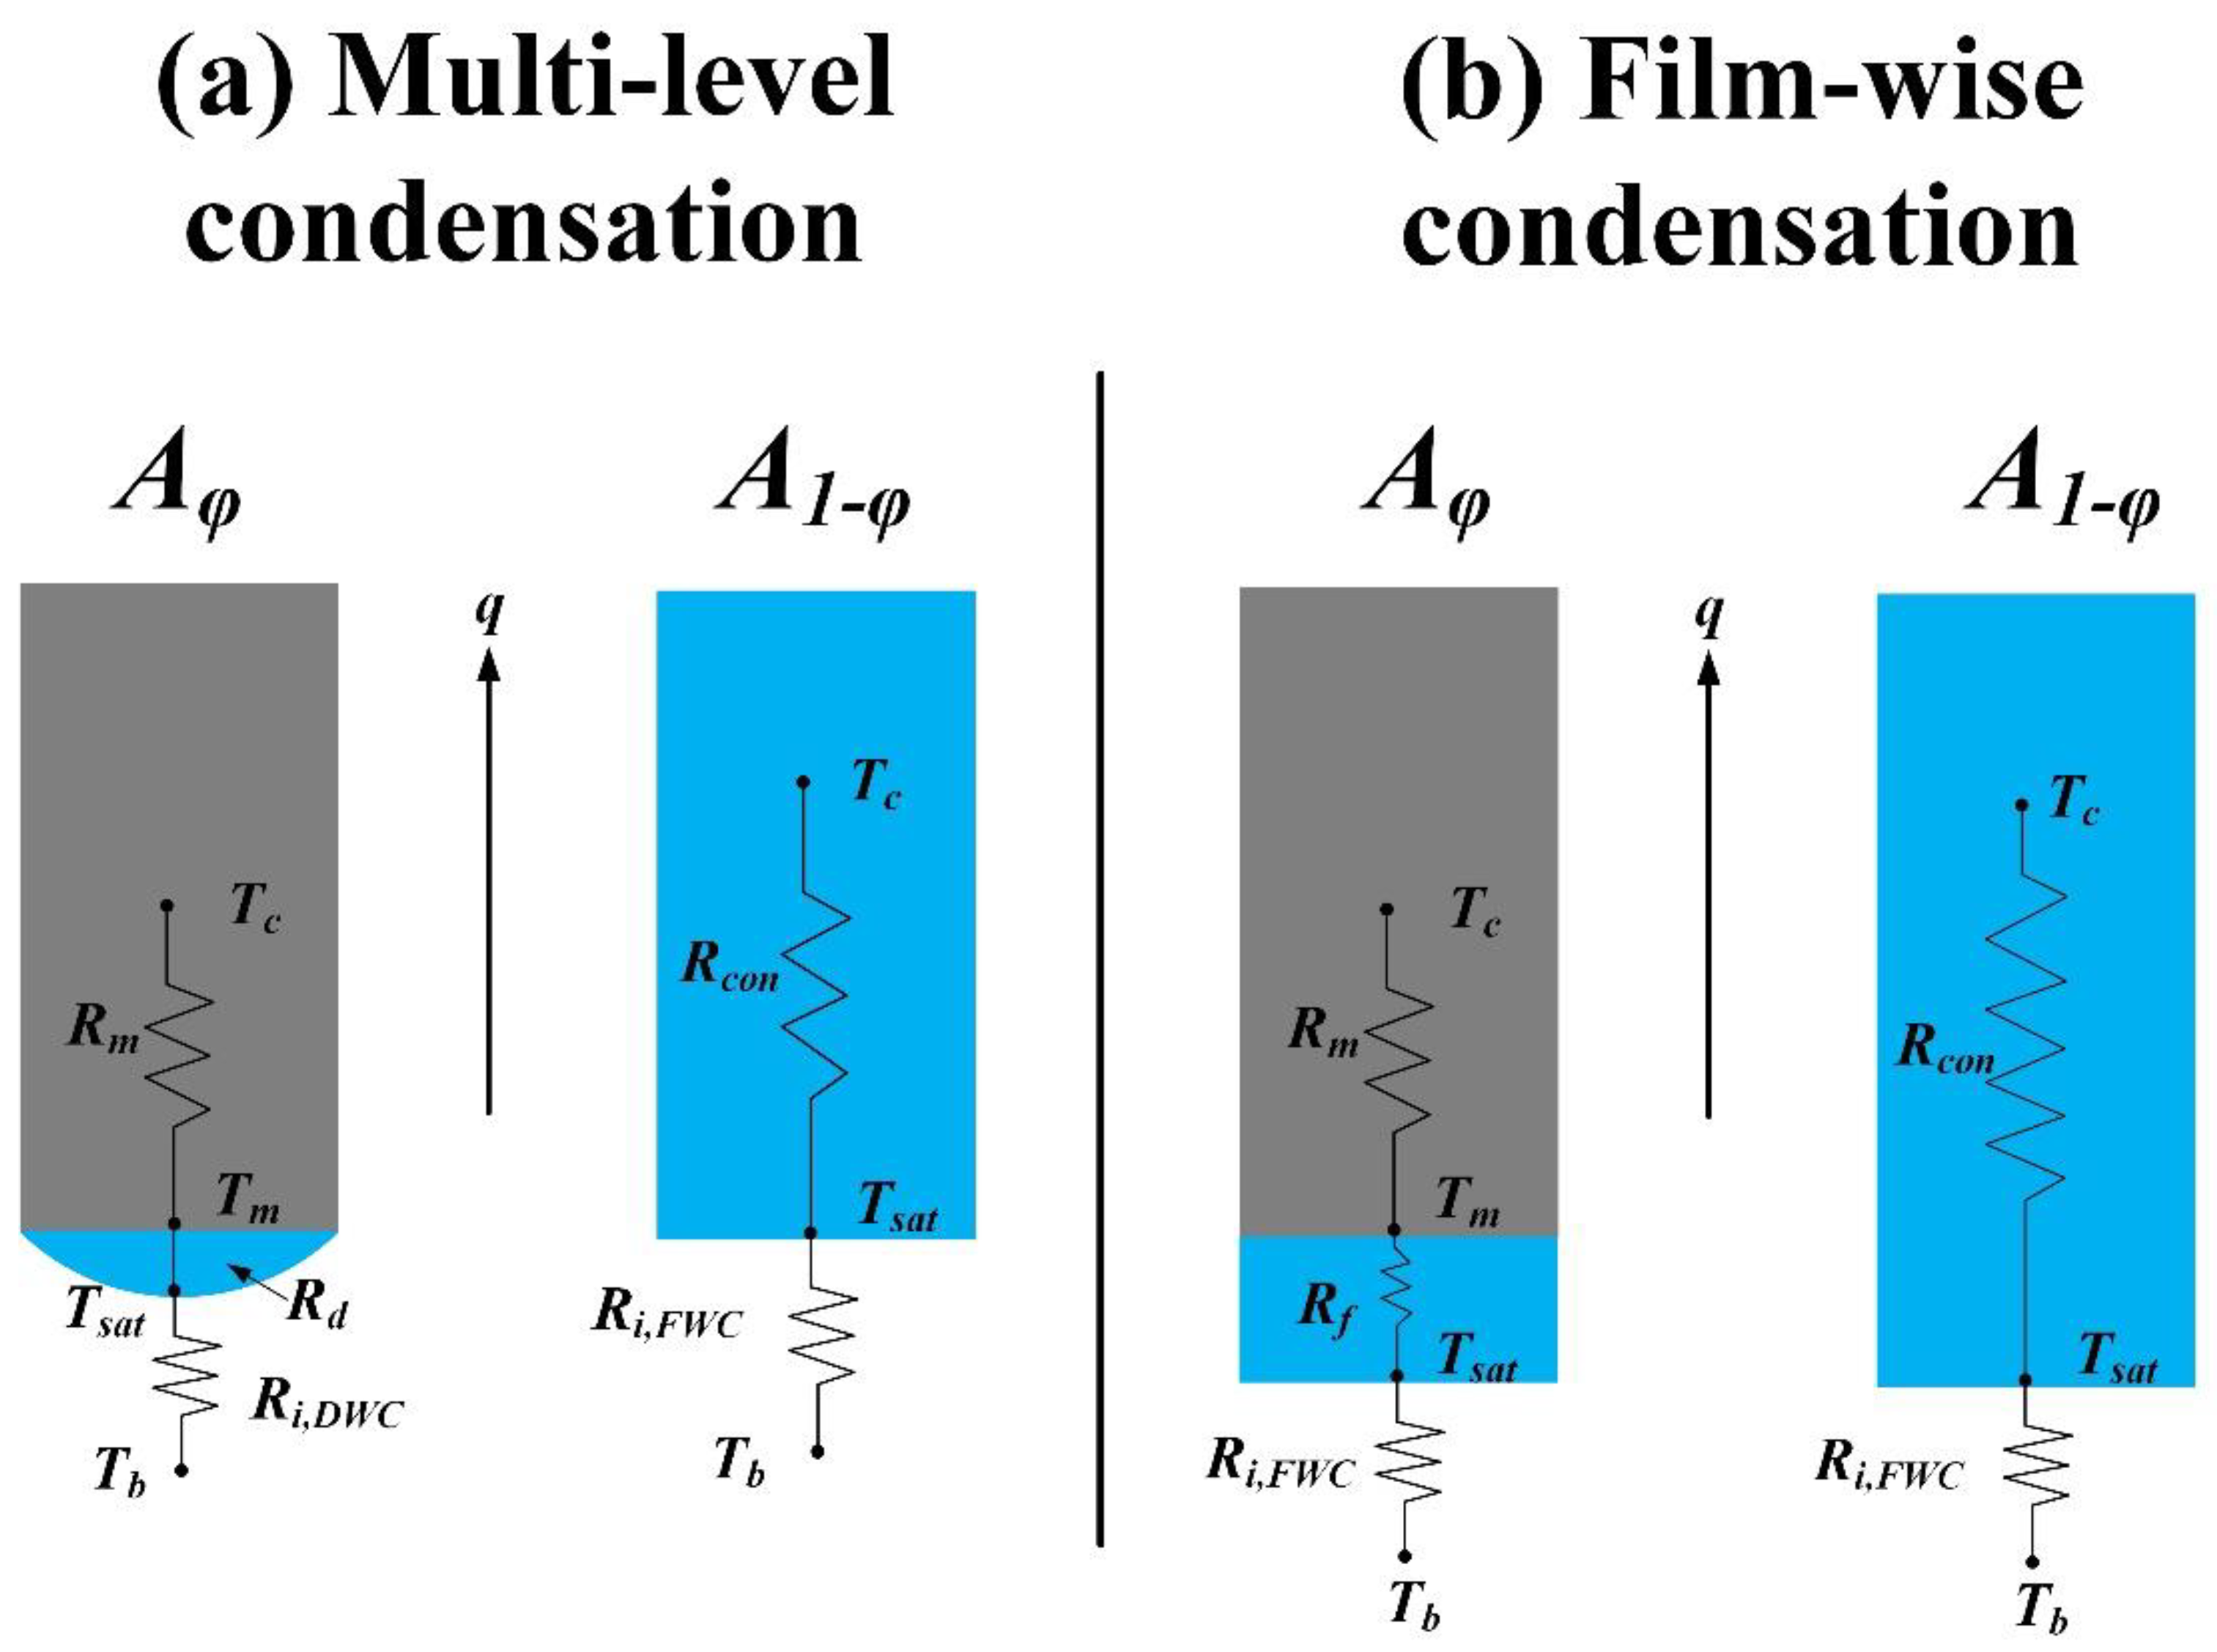
Phase-changing heat transfer performance on membrane can be controlled not only by condensing mode but also by thermal resistance caused by heterogeneous phase distribution. As depicted in Figure 2, three different types of thermal resistance occur near the wall, namely, membrane thermal resistance, droplet thermal resistance, and film thermal resistance. Conversely, thermal resistance during the film-wise condensation process only consists of membrane thermal resistance and condensate film thermal resistance. This can be attributed to the fact that a multi-level condensation process appears within the porous material, and heterogeneous condensate forms accumulate near porous zones.
Because the physical model was axisymmetric, a two-dimensional axisymmetric model and structured grids were used in this study, and we selected the top half of the TCM as the simulation domain. The mass and heat transfer from the gas mixture to the coolant was implemented into Fluent14.5 by adding source terms to the cells adjacent to the wall. To ensure the accuracy of our results, the near-wall grids were refined. This research focuses on the influences of condensing behaviors on thermal and mass-transfer characteristics within the ceramic membrane, rather than the wetting characteristics (e.g. contact angle and pore-size distribution) or other negligible conditions.
The overall ceramic membrane features a structural gradient macroscopically, and the characteristic pore size distribution within the specific local computational domain is relatively narrow. Therefore, assuming a uniform pore size for the local pore-scale simulation is a reasonable simplification. In addition, a constant contact angle is assumed because the temperature variation across the membrane interface under the current operating conditions is relatively small (less than 0.7 K). Within this moderate temperature range, the temperature-induced variations in fluid surface tension and local solid–liquid wettability are negligible compared to the dominant capillary and viscous forces. Neglecting thermal radiation, it can be concluded that the operating temperature of the membrane condensation process is relatively low (ranging from 293 to 362.17 K). Under these conditions, the total heat flux is overwhelmingly dominated by the latent heat of phase change and convective heat transfer. The radiative heat flux is orders of magnitude smaller and can thus be safely omitted without affecting the accuracy of the thermal transport analysis.
For the purpose of maintaining accuracy and computational node-saving, several reasonable assumptions are presented before simulation initialization as a similar numerical model[17]:
•Thermal radiation has a negligible effect on convective heat transfer.
•Condensation only occurs in the near-wall region of the TCM (the wall surface of the TCM).
•There is a unique contact angle throughout the whole TCM’s surface[22]; that is, the surface hydrophilicity of the TCM is uniform. Additionally, the pores within the TCM wall are all the same size.
While the aforementioned assumptions are necessary to maintain computational tractability, it is important to acknowledge how deviations from these idealized conditions might affect the predicted results. The real porous media inherently possess a pore size distribution rather than a strictly uniform pore size. A localized variation in pore size would induce non-uniform capillary pressure fields, potentially leading to preferential liquid flow paths (fingering effects) and localized liquid pooling. This deviation implies that our idealized model might slightly overestimate the overall condensation heat transfer coefficient, as localized flooding in real non-uniform pores would add additional thermal resistance.
A real condensing surface exhibits contact angle hysteresis (differences between advancing and receding contact angles) rather than a constant static contact angle. The presence of hysteresis would increase the adhesion force (pinning effect) on the liquid–vapor interface, delaying liquid removal from the porous structure. Consequently, the actual liquid film thickness might be greater than predicted, meaning that our current model likely yields a conservative estimate of thermal resistance.
Figure 3.
Introduction of thermal resistance on multi-level condensation and film-wise condensation process.
Figure 3.
Introduction of thermal resistance on multi-level condensation and film-wise condensation process.
Importantly, if thermal radiation were incorporated, it would act as a parallel heat transfer pathway, resulting in a marginal increase in the total predicted heat flux. However, given the low operating temperatures, this underestimation of the total heat flux is considered physically negligible.
2.2. Experimental Method and Tools
The sketch of experimental configuration is presented in Figure 4, in order to simulate the actual gas in the gas-fired power plant[19], and the nitrogen and water vapor are chosen and mixed in the gas mixing tank (NO.4) equipment before getting into the membrane module. In order to achieve higher mixing efficiency, the feed gas is introduced into the membrane module in the 1, 2 gas buffer tank (NO.1, 2) or the humidifier (NO.3) and is heated into fixed temperature in the thermostatic water tank (NO.5). The mass flow of feed gas and cooling water are controlled by a mass flow controller and a pump, respectively, and the cooling water’s temperature and pressure at the inlet and outlet of the membrane module are measured by digital temperature and vacuum gauges. The electric heater (NO.7) equipment plays a key role in the experimental configuration. In order to investigate the CCD, the electric heater is used to heat the cooling water so that the cooling temperature is always higher than the saturated temperature at fixed conditions. Without using the electric heater (NO.7), however, the cooling temperature is always lower than the saturated temperature, and we use the cooling water to investigate the NCD directly. The mass measurement of the drying pipe (NO.6) is used to obtain the values of recovery water mass. The mass difference measured by two water tanks can also verify the mass flux of recovery water. The measurement is carried out continuously every 10 minutes, and data is collected after 50 minutes.
2.3. Equations
NCD and CCD models are implemented into the FLUENT14.5 code using different numerical models of diffusion mass flux, and the basic parameters of feed gas and liquid condensation are referenced from the commercial software NIST 14.0.
According to the variation range of Knudsen numbers[3], both the feed gas and condensate get through the pores in the TCM as Knudsen flow and viscous flow during the CCD process, while only viscous flow exists during NCD. The distinction between NCD and CCD is presented in Table 2, and a schematic diagram of the flow in the TCM with the relevant symbols is depicted in Figure 5.
The Knudsen number is modeled as[3]:
where kB, T, ppore, d0, and δ represent the Boltzmann number, the average temperature, the average pressure in the pore region, the molecular diameter, and the thickness of the membrane, respectively. The Boltzmann number[13] is 1.38×10⁻²³, and the Knudsen number changes from 1.23×10⁻¹¹ to 1.28×10⁻¹¹ when the bulk temperature of feed gas increases from 362.17K to 373K. According to A.Berang[14], the pores of TCM are regarded as a slip flow regime. We assume that if the water vapor temperature (Tvap) is higher than the saturated temperature (Tsat), the feed gas will enter the pores of the TCM, and capillary condensation will subsequently occur.
Consequently, the diffusion mass flux (J) through the pores of the TCM is simply regarded as the sum of viscous flow and Knudsen flow:
where k0, Db, μ ,Mb, and Apore represent the permeability coefficient, the diffusion coefficient of feed gas, dynamic viscosity, the molar weight of feed gas, and the area of pores within the membrane, respectively. k0 and Deff are expressed as:
where rpore, ψ, φ, Dcon, and Wvap represent the radius of pores, porosity, the suction effect coefficient, the diffusive coefficient of the condensate, and the mass fraction of water vapor, respectively. Db and Dcon are calculated as follows:
where Mb and Mvap represent the mole weight of feed gas and water vapor, respectively. σ represents the characteristic size of the gas mixture (i.e. the effective collision diameter of the molecules in the mixture), and its value equals 30nm.
For NCD, the steady-state diffusion equation along the y-coordinate (distance from the middle of the membrane to the wall surface) can be calculated using Eq(7), (8), (9):
where mb, mvap, and Wvap represent the mass flux of the feed gas, mass flux, and the mass fraction of water vapor. We assume that the condensation interface is impermeable, and the non-condensable gas mass flux in the condensation interface should be zero:
With the assumption[14] that the diffusive coefficient of gas mixture Db is a function of the y-coordinate and the value of ρb can be obtained from NIST14.0, Eq(10) can be integrated between the gas mixture and condensation interface:
where y=δ represents the diffusion layer thickness.
In this study, the inertia effects[19,20,21] on heat convective transfer are evaluated[19], taking the thermophoretic force (Fth) into consideration.
where ρb represents the density of the feed gas mixture; its values are listed in Table 3. According to the research of I.Z.Famileh[20], Cm,Ct, and Cs are set as 1.14, 2.18, and 1.17, respectively.
NCD occurs outside the membrane if Tvap is lower than Tsat. CCD occurs in the pores of membranes, and not only is the Tvap higher than Tsat, but also the vapor partial pressure (pvap) is lower than the saturated pressure (psat) in the nanopores. Based on the conservation of mass, the general steady-state equation of continuity is given by:
where Smass in the CCD and NCD are expressed as Eq(15), (16), respectively:
if Tvap>Tsat, pvap<psat (15)
if Tvap<Tsat (16)
where Acell and vcell’ represent the area and volume of cells in the near-wall region, respectively. The steady-state species transport equation for the prediction of the variation in water vapor mass fraction is given as:
if Tvap>Tsat, pvap<psat (19)
if Tvap<Tsat (20)
The steady-state momentum conservation equation is expressed as:
The steady-state energy conservation equation is expressed as:
if Tvap>Tsat, pvap<psat (23)
if Tvap<Tsat (24)
where γ represents the latent heat; the values of γ are obtained from NIST 14.0. For a parameter R that is not directly measured but can be calculated using directly measured quantities (x1, x2, …, xi), i.e., R = f (x1, x2, …, xi), the uncertainty of R can be represented using the error propagation equation:
The processes of normal condensation, capillary condensation, and inertia effect on the thermal characteristics in the feed gas can be incorporated into the flow calculations via a User-Defined Function (UDF), which applies a customized source term in cells directly adjacent to the condensing walls. The source terms of governing equations are listed in Table 3.
2.4. Simulation Settings
A finite volume method is employed by solving the governing equations using Fluent14.5. The SIMPLEC scheme is appropriate when the Reynolds number is small, and we choose it for pressure treatment in this study. For the purpose of guaranteeing the second-order accuracy of the solution, second-order upwind schemes are selected to solve the governing equations. Because we built a structured grid in this paper, the QUICK discrete scheme was applied to momentum and energy equations. Moreover, the Reynolds number in this study was always lower than 1200, and the flow model selected was the laminar model. The simulation material was a gas mixture, consisting of nitrogen and water vapor. The species equation model was used to investigate the variation in vapor mass fraction.
A user-defined function (UDF) was utilized to solve the source terms in the energy conservation and continuity equations. The mass and energy source terms were implemented using the “DEFINE_SOURCE” macro. To prevent unphysical mass creation, the condensation source terms are conditionally activated at the fluid–solid interfaces within the porous structure based on local cell variables. Specifically, an if-statement in the UDF continuously checks the local temperature and vapor volume fraction. The condensation source is strictly activated only when the local temperature drops below the saturation temperature, and the cell contains condensable vapor. Conversely, it is deactivated when these physical conditions are not met. By providing the derivative of the source term with respect to the dependent variable, the diagonal dominance of the discretized matrix was enhanced. Furthermore, the under-relaxation factors for momentum and energy equations were reduced to 0.3 and 0.5, respectively, to dampen drastic oscillations during the initial condensation phase. A rigorous time-step sensitivity analysis was conducted. Given the complex gas–liquid interfacial dynamics and the fine mesh required for the porous domain, the Courant–Friedrichs–Lewy (CFL) condition dictates a strict time-step restriction. We evaluated three distinct time steps: 10-5, 0.5*10-5, and 10-6 s. The results indicated that time steps larger than 10-6 s led to non-physical velocity spikes and mass imbalance, whereas 10-5 s ensured that the global Courant number remained below 0.25, yielding stable and time-step-independent results.
It is important that simulating stability is achieved when time steps go beyond 2500; thus, we selected numerical data when numerical stability was reached. To save computational time, the boundary conditions of the physical model were set as symmetric boundary conditions by GAMBIT 2.4.6. Grid refinement was applied to the near-wall regions. The total number of cells was 28000, 49500, and 80410 respectively. Additionally, grid independence was checked before the calculations. All the operational conditions and geometric conditions are listed in Table 4.
3. Results and Discussion
3.1. Model Validation and Grid Independence
Grid independence was checked before the calculations; when the grid number reached 80410, it had a minor effect on the results of the numerical simulation. Additionally, grid refinement was applied to the near-wall regions. In order to validate the solution of the numerical simulation, a comparison between experimental and numerical results was conducted under the operational conditions shown in Table 3, and details are presented in Figure 6 and Figure 7.
The variation in outlet feed gas bulk temperature (Tb,out) with different inlet feed gas bulk temperature (Tb,in) during normal condensation (NCD) and capillary condensation (CCD) processes is shown in Figure 5, where two curves and the scattered points represent the numerical simulation and experimental data, respectively. The variation trend of the numerical simulation data was similar with that of the experimental data; the maximum and minimum error between them was 1.14% and 0.59%, respectively. The change in condensation rate was also researched in NCD and CCD but without comparing Tb,out. The main panel in Figure 7 reports the comparison of condensation rate in NCD between experimental (red dots) and numerical results (black line), while the insert in Figure 7 is used to verify the accuracy of condensation rate in CCD. As can be seen from the figure, the errors between CFD and experimental results were in the range of 3.8%~4.6%; therefore, the CFD data was reliable. Regarding the error analysis, a higher deviation in CCD mass flux (3.8%–4.6%) compared to bulk temperature is expected due to the complexity of the phase change process. While the Knudsen/viscous flow model (Equation 2) captures the dominant transport mechanisms, it assumes an idealized porous structure. In reality, micro-scale phenomena such as partial pore blocking by the condensate or non-uniform pore distribution may occur, which are challenging to fully resolve in a macroscopic CFD model. These factors affect mass transfer more significantly than bulk heat transfer, leading to the observed difference in accuracy. Nevertheless, the results remain well within the acceptable margin for engineering applications.
3.2. Effects of Inlet Velocity on Two Types of Condensation
In this part, the effects of feed gas inlet velocity (Uin) on two types of condensation processes were researched by analyzing the results of the experiment and the numerical simulation, respectively. In the experiment, the temperature difference of feed gas (ΔTb) between the inlet and outlet and the mass flux of water recovery (mre) were measured. Moreover, we analyzed the change in vapor mass fraction (Wvap) and radial velocity (Ur) using CFD. The experimental operational conditions were in accordance with those in CFD, where the initial parameters of vapor mass fraction (Wvap,0), inlet temperature (Tin), and the temperature of coolant water (Tcool) for NCD and CCD were set or controlled as 20%, 293K, and 362.17K (NCD) or 323K (CCD), respectively.
In order to achieve accurate results, every group of experiments was carried out five times under the same operational conditions, and the experimental data is presented in Figure 8, Figure 9, Figure 10 and Figure 11. It is shown that the values of ΔTb in NCD increased dramatically when Uin changed from 0.3 to 1.8m/s, but they leveled off when Uin became larger than 1.8m/s. The values of ΔTb in CCD, however, declined linearly with an increase in Uin, as depicted in Figure 9; i.e., the influence of velocity on the thermal performance of NCD is totally opposite to that of CCD. The numerical model in this research was fitted with current operating conditions during the numerical simulation.
Additionally, we measured mre (mass flux of water recovery) during the NCD and CCD processes. As shown in Figure 10, the values of mre in NCD were enhanced with an increase in Uin, and the maximum and minimum values of mre were 0.249 and 1.47kg/m2.h. Nevertheless, the values of mre in CCD decreased with increasing Uin (0.3 to 2.8m/s), as depicted in Figure 11. Compared with CCD, the ceramic membrane tube exhibited a distinct performance of heat and mass transfer at similar Uin when NCD occurred. This is primarily because normal condensation was relevant to heat transfer processes such as convection heat transfer and thermal conduction, which were significantly promoted by the high velocity of feed gas. During the capillary condensation process, however, the higher velocity would distort the boundary layer and hinder the performance of the ceramic membrane tube. Moreover, the water recovery amount was negative when the feed gas velocity was larger than 1m/s, which also meant that capillary condensation was not able to develop efficiently at comparatively higher inlet velocity (Uin>1m/s). The negative recovery rate can be explained by the fact that most condensate layers were attached to the membrane surface due to surface tension and wetting characteristics, and the water uptake capacity also causes the condensate to stagnate within porous zones instead of being recovered timely.
In the numerical simulation, we researched both the thermal and water recovery performance in the ceramic membrane tube with different inlet velocity (Uin). We took a section from every 100mm in the tubular ceramic membrane, as mentioned above and as shown in Figure 11 and Figure 12. Figure 11 shows the mass fraction of vapor (Wvap) distribution along the membrane tube versus Uin at fixed conditions during NCD. As the flow developed, the values of Wvap declined dramatically from the inlet (x=0). When the distance was larger than certain values (x=400), Wvap leveled off’ i.e. the normal condensation proceeded more predominantly in the front of the ceramic membrane tube (0~400mm) compared to its back (400~600mm).
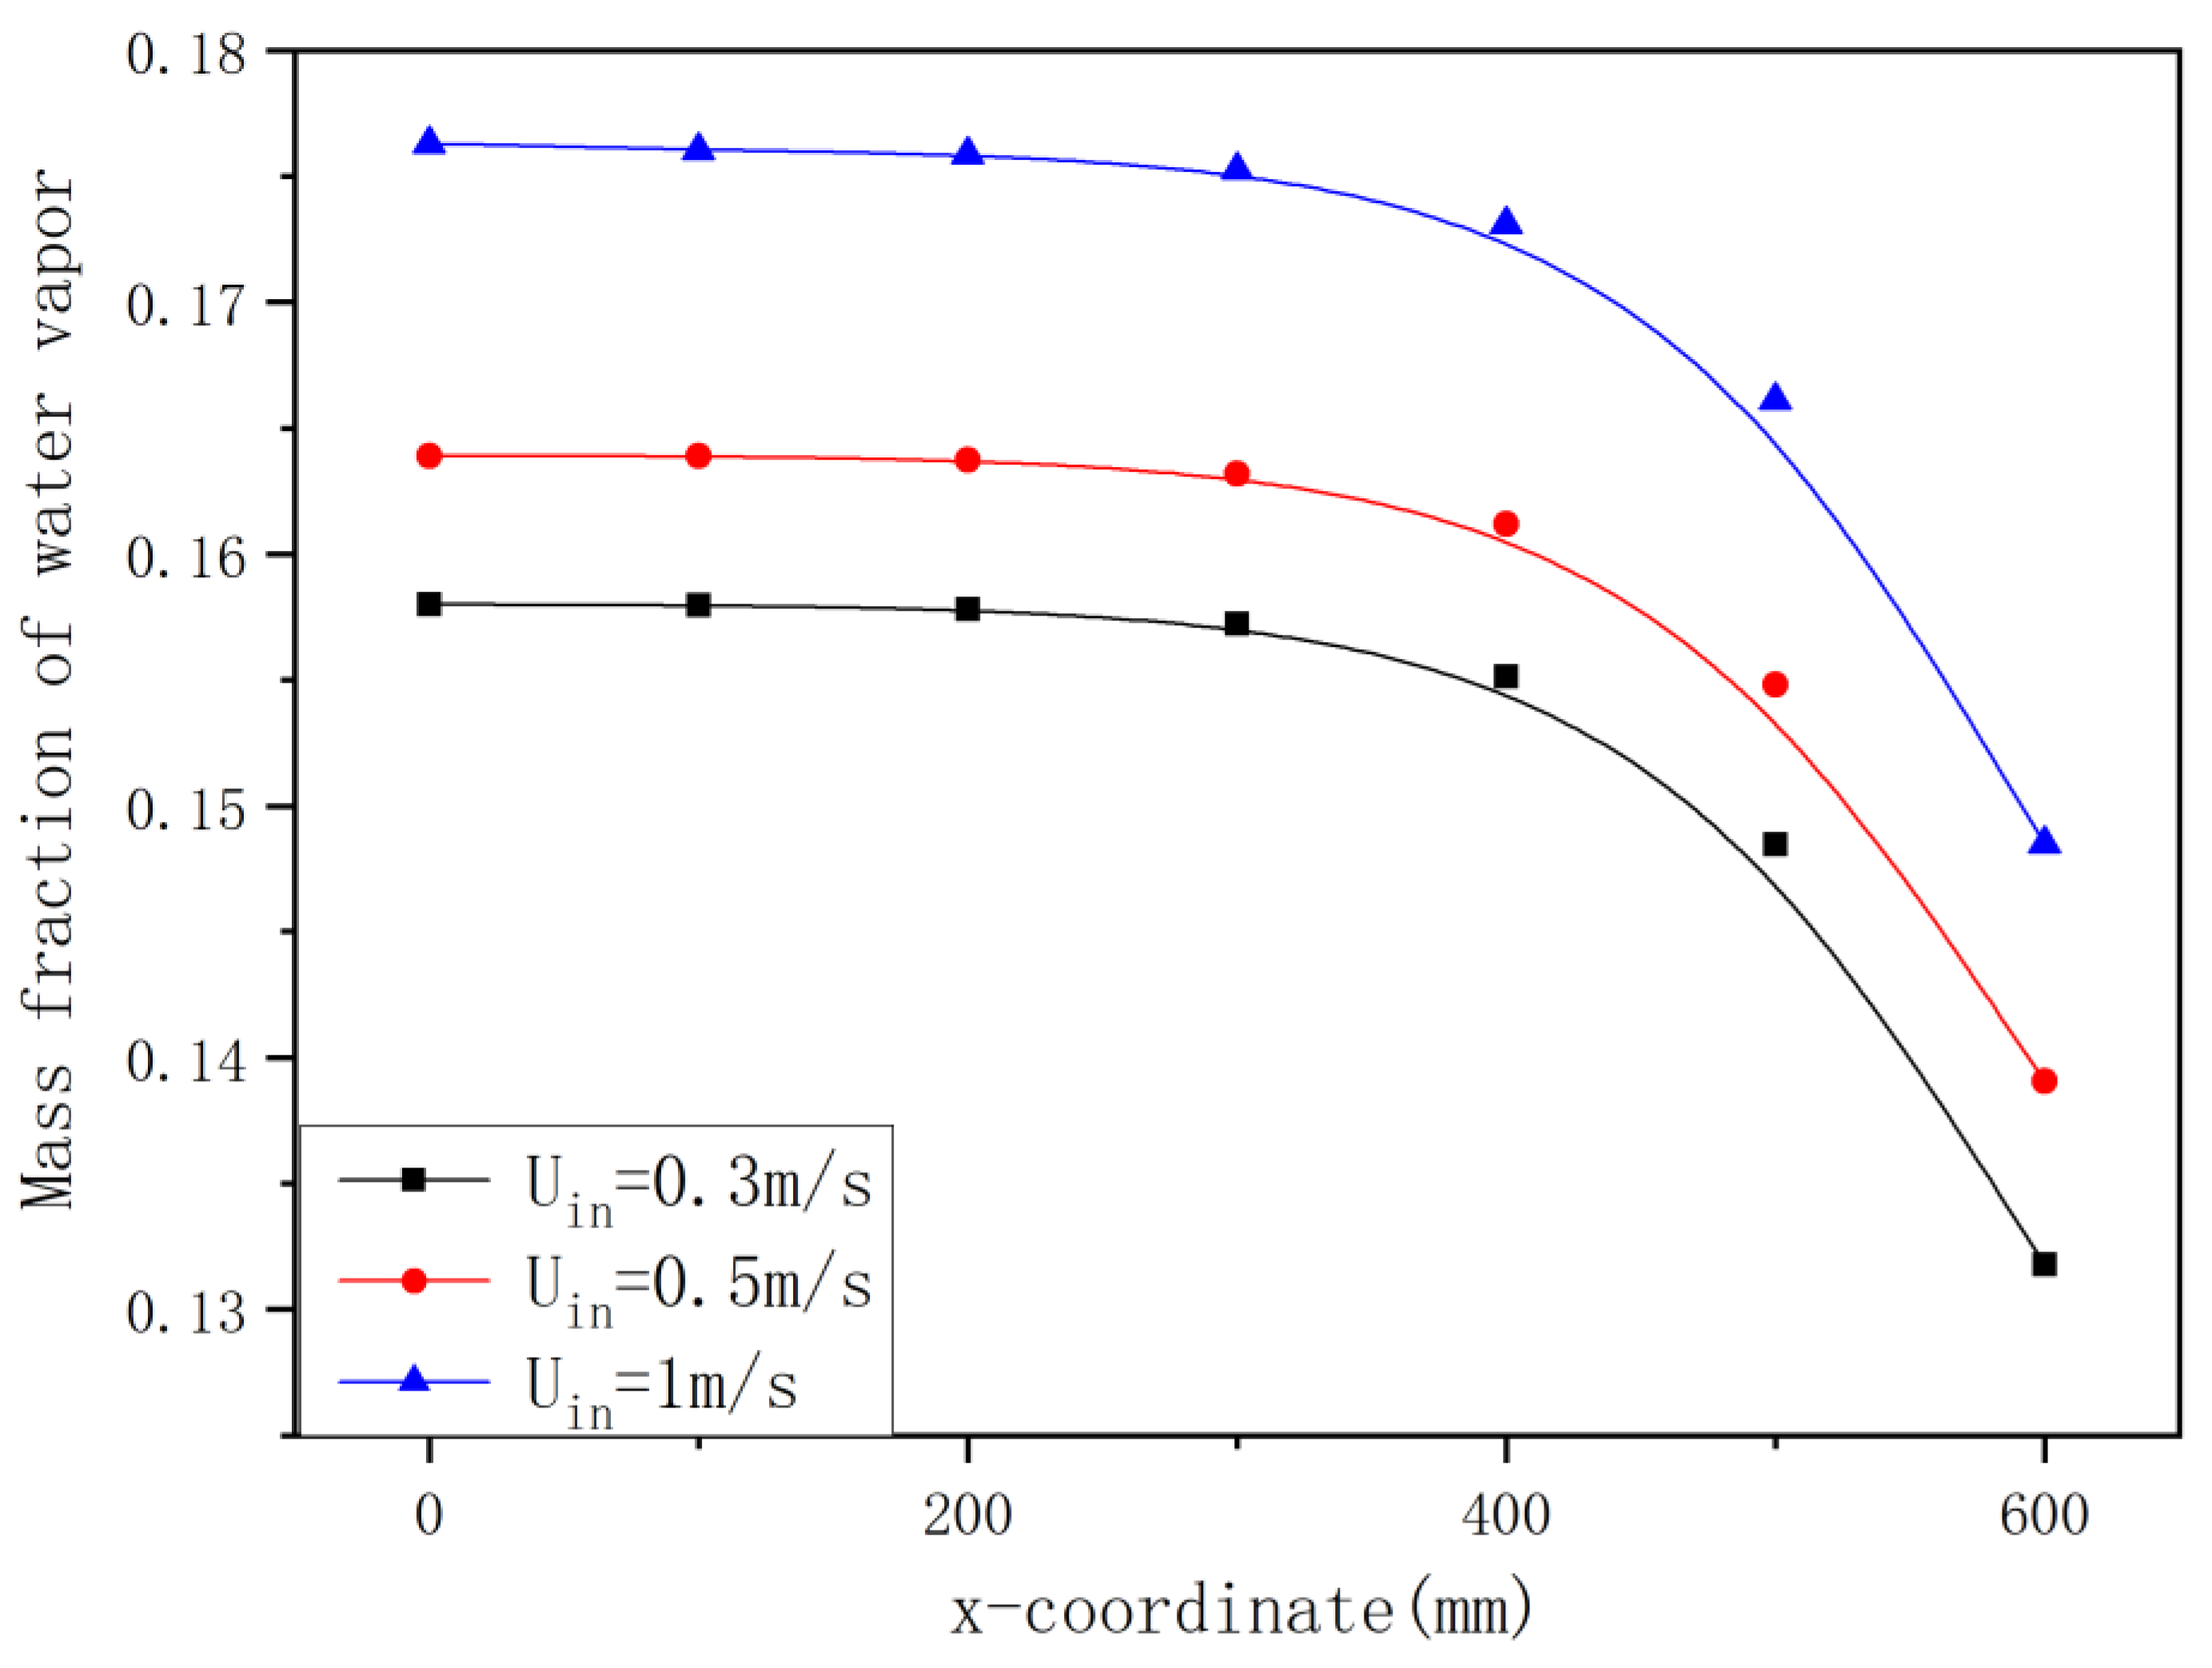
The change in mass fraction of water vapor (Wvap) could reflect the developing degree of capillary condensation (CCD); thus, we analyzed the variation in Wvap during the CCD process when Uin was 0.3, 0.5, and 1m/s. As shown in Figure 12, the variation in Wvap exhibited a nonlinear relationship with the x-coordinate in normal condensation. When the values of the x-coordinate changed from 0 to 450mm, Wvap barely changed. Nevertheless, when the x-coordinate was over 450mm, Wvap declined rapidly. Moreover, it was apparent that Wvap gradually increased as Uin increased (from 0.3m/s to 1m/s). Unlike in normal condensation, the mass fraction of water vapor only changed remarkably in the back of the ceramic membrane tube (400~600mm).
Figure 12.
Variation in Wvap with different Uin in normal condensation (Tin=362.17K; Tcool=293K; Wvap,0=20%).
Figure 12.
Variation in Wvap with different Uin in normal condensation (Tin=362.17K; Tcool=293K; Wvap,0=20%).
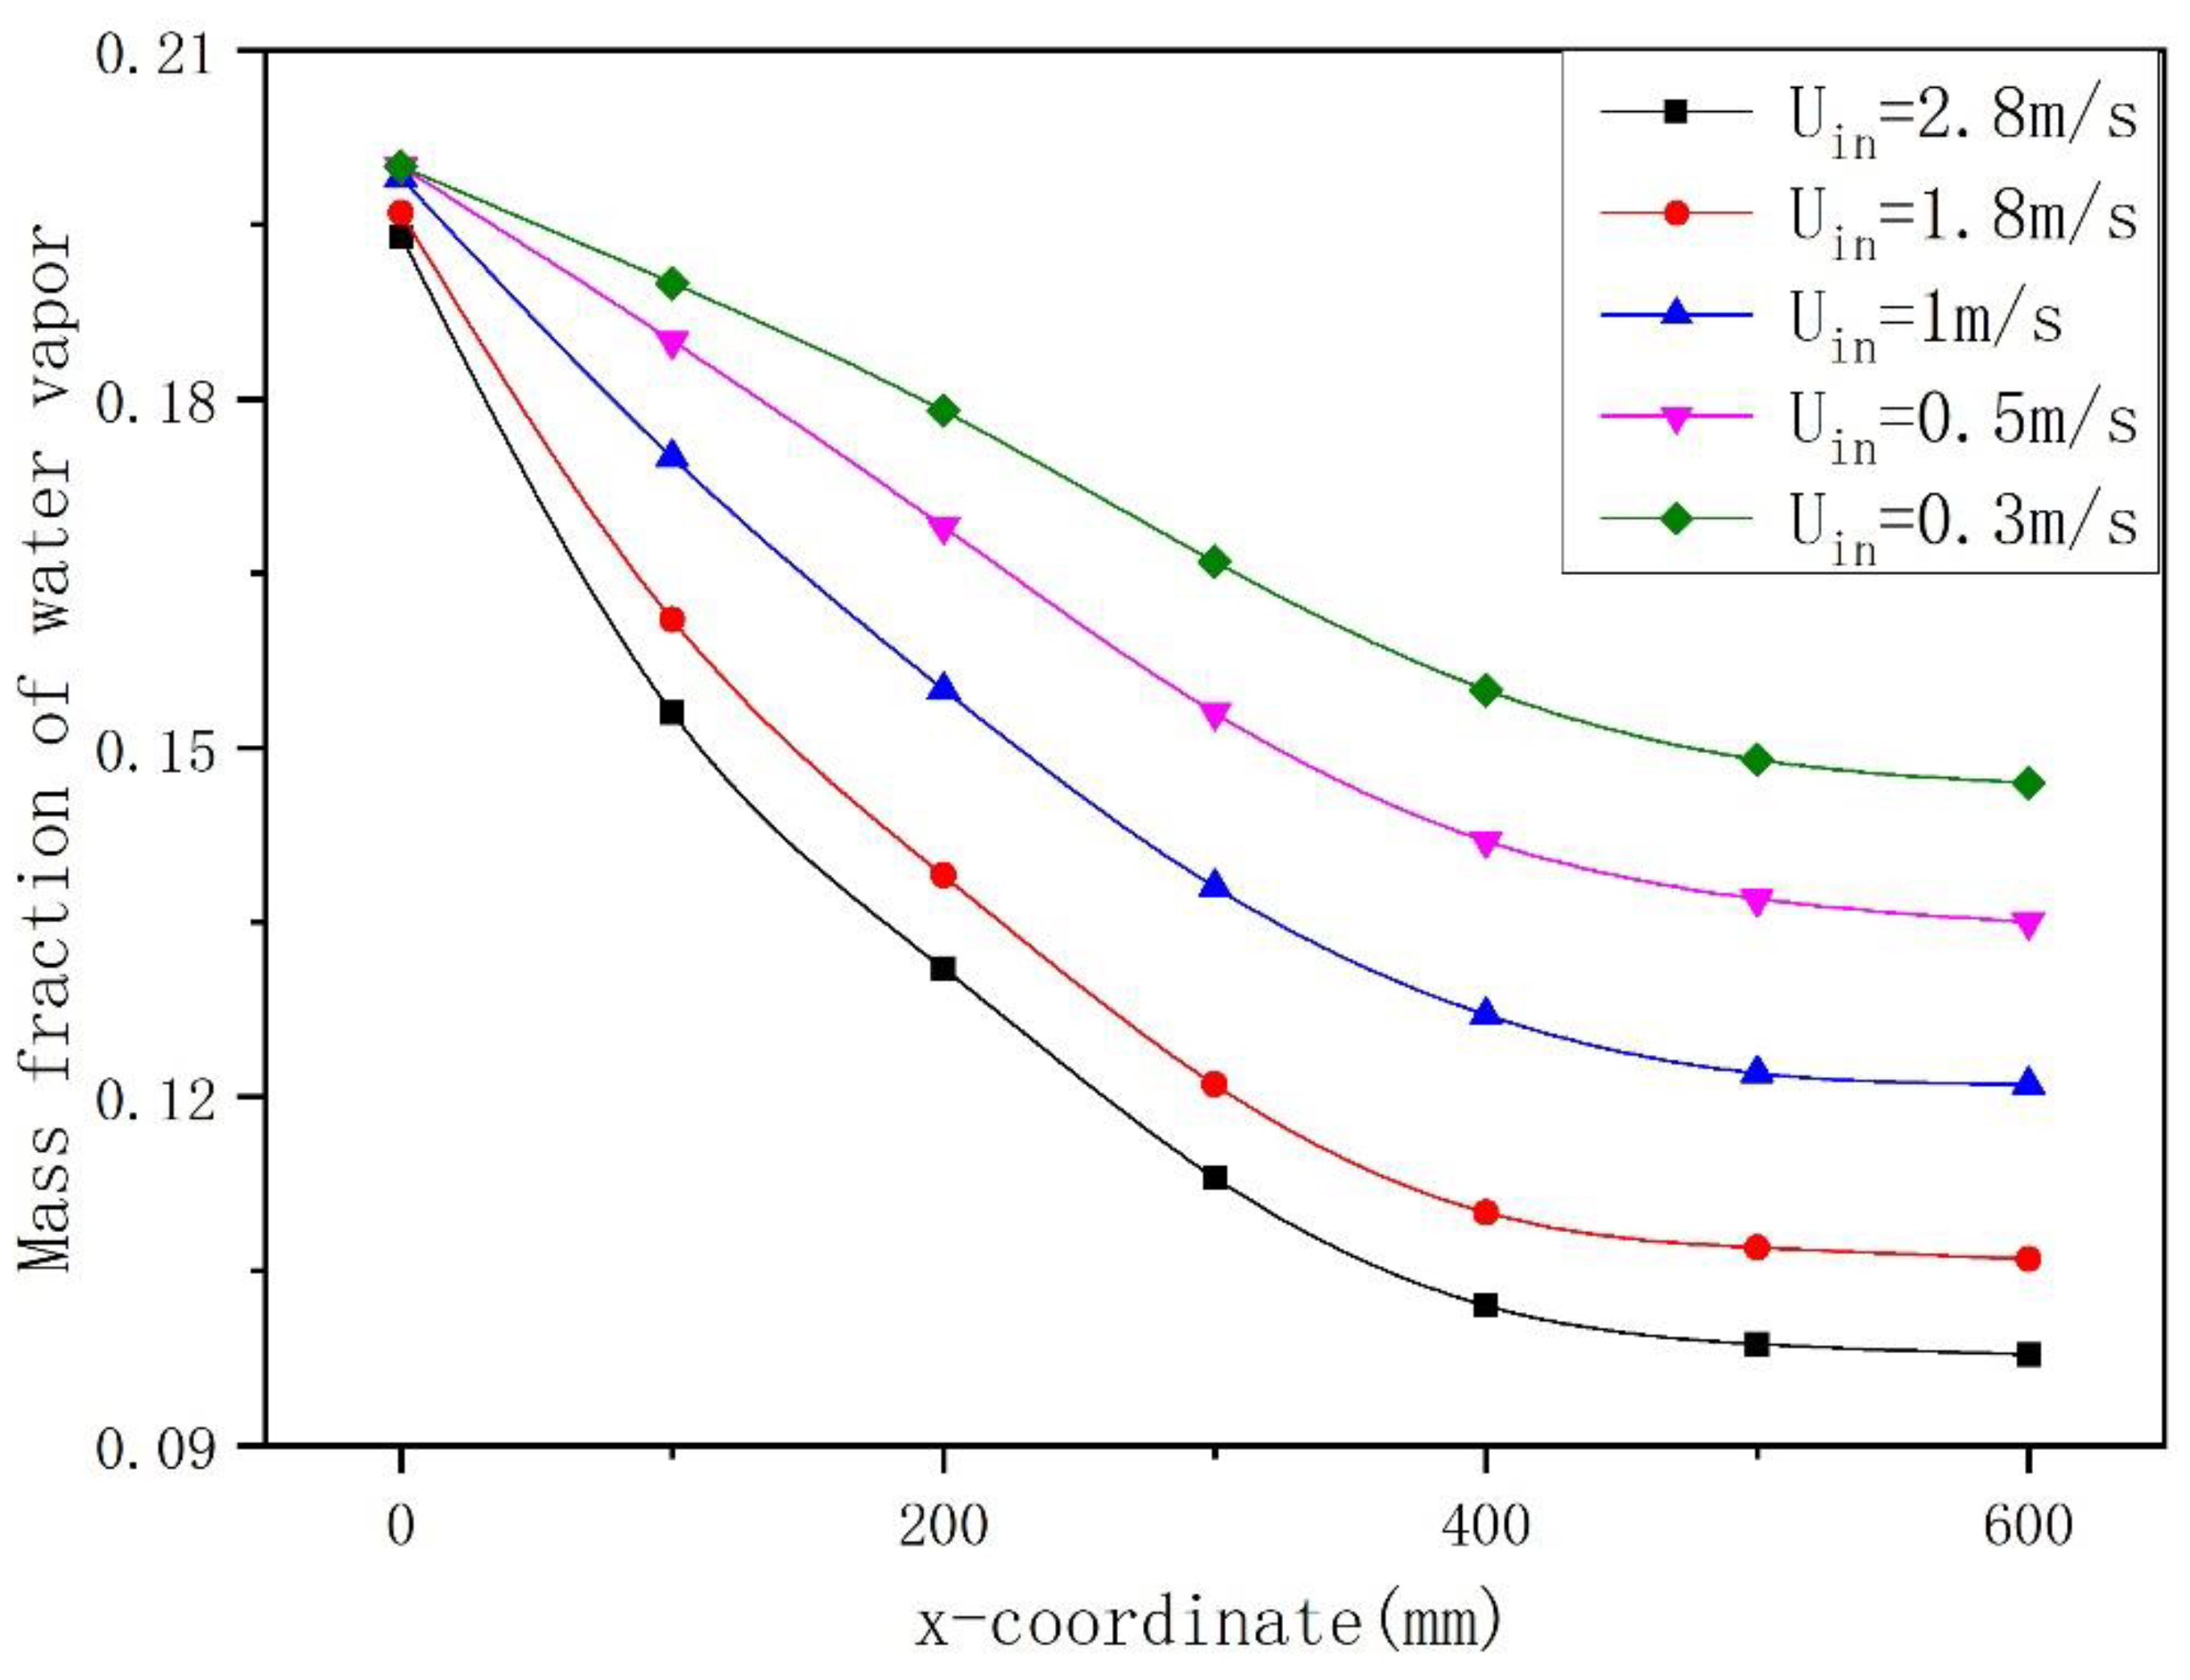
Figure 13.
Variation in Wvap with different Uin in capillary condensation (Tin=362.17K; Tcool=323K; Wvap,0=20%).
Figure 13.
Variation in Wvap with different Uin in capillary condensation (Tin=362.17K; Tcool=323K; Wvap,0=20%).
According to the analysis of J.Li[17], non-condensable gas could accumulate in the near-wall region of ceramic membrane tubes, and this behavior would constrain the water vapor to condense into liquid. In addition, the radial velocity of feed gas (Ur) had apparent influence on the non-condensable gas, especially at higher Ur. With increasing Ur, the accumulated non-condensable gas became distorted, and the condensation process was able to occur.
Figure 14 shows the change in Ur with different Uin during the NCD and CCD processes, respectively. Ur was directed radially inward (-) when it was opposite to the direction of gravity. As presented in Figure 14, all the curves showed a similar variation tendency; the absolute values of Ur declined dramatically from the inlet of the membrane tube and then leveled off up to its outlet. As seen in Figure 15, the absolute values of Ur were almost zero for some distance from the inlet. Nevertheless, as the x-coordinate approached 500mm, the absolute values of Ur increased rapidly (from 0 to 0.08m/s ).
The fluctuation depicted in the figure may be because the condensate adhering on the membrane wall is divided by three kinds of flow patterns: a flow pattern with a significant condensation heat and mass-transfer degree appearing in the front, one with an alleviating degree appearing in the middle, and one with a lower degree appearing in the back of the ceramic membrane. A similar conclusion was presented by Xie et al.[22], who found that the thermophoretic force pressed the condensate film onto the wall surface and the inertia force caused it to detach from the wall surface.
It can be concluded that the boundary layer would be squeezed as Ur increases, and both normal condensation (NCD) and capillary condensation (CCD) could proceed more efficiently. Therefore, NCD occurred significantly in the front of the TCM and slowed down gradually. However, CCD only appeared in the back of the TCM (the x-coordinate was larger than 500mm).
3.3. Effects of Wnon on Two Types of Condensation
The suction effect induced by non-condensable gas played an important role in thermal characteristics[11,17,19]. The fluid force balance in the pores within the nanoporous membrane can be obtained by considering capillary force (Fca) and friction (f) in Eq(25), (26), respectively, therefore yielding Eq(27):
where δ , t, σ, θ, and dpore represent the thickness of the TCM wall, time steps, surface tension, contact angle, and the diameter of pores within the TCM, respectively, and are listed in Table 1. The value of equilibrium time (t1) equaled 2.52×10⁻⁴ and was obtained from Eq(27); in other words, the fluid in the pores within the nanoporous membrane was in an equilibrium state of force when the simulation period was larger than t1(2.52×10⁻⁴). The operation parameters analyzed were the vapor mass fraction (Wvap), the inlet bulk temperature of feed gas (Tin), and the average suction effect coefficient (φa).
More than the suction effect, the existence of non-condensable gases would change the partial pressure of water vapor, and consequently the condensation process would be slowed down. The predominant occurrence of CCD in the downstream section can be attributed to the synergistic effects of velocity decay and pressure distribution. As the fluid travels downstream, the pressure drop alters the local thermodynamic state, while the concurrent velocity decay increases the residence time of the vapor species. At the pore scale, this prolonged residence time under favorable pressure conditions facilitates capillary condensation according to the Kelvin equation, leading to the observed downstream deposition. Because of the accumulation of condensation droplets, a short condensation section is attached onto the micropore wall and maintains the flow state. The attaching principle for condensates on membrane wall surfaces is essentially governed by synergistic effects between the capillary force and the viscosity force. Consequently, the condensate liquid tends to accumulate in the downstream section of the membrane, especially in the primary stage.
Figure 16 presents the variation in Wvap for different Wnon when Tin=362.17K, Tm=293K, Uin=1.8m/s, and Wvap,0 was 7.5%, 9%, 12%, 16%, and 20%, respectively. In Figure 15 and Figure 16, the left and right side of the contours represent the inlet and outlet of the ceramic membrane, respectively. Furthermore, the blue zones represent the vapor condensed into liquid, and the red zones represent the feed gas; the other zones represent the gradual process of condensation. The non-condensable gas mass fraction (Wcon) was calculated using Eq(28):
Due to the efficiency of water recovery in capillary condensation (CCD) being relatively low, we just selected 2%, 16%, and 20% as the values of Wvap. As shown in Figure 16, CCD only happened in the back of the ceramic membrane tube, which was consistent with the results in Section 3.2 of this paper.
In both the NCD and CCD processes, the phase-transition regions (blue zones) became longer with the decrease in non-condensable gas mass fraction (Wnon) at a fixed time. In order to account for this trend, it could be said that the suction effect and thermal resistance effect caused by non-condensable gas were more pronounced at higher Wcon, which was in accordance with the results in this research[13]. Additionally, the whole membrane tube was filled with phase-transition regions during the NCD process, while phase-transition regions only occurred in its back during the CCD process. This also explains why the mre of NCD was 1.2~3 times larger than that of CCD at fixed conditions.
Figure 15.
Variation in Ur with different Uin in capillary condensation (Tin=362.17K; Tcool=323K; Wvap,0=20%).
Figure 15.
Variation in Ur with different Uin in capillary condensation (Tin=362.17K; Tcool=323K; Wvap,0=20%).
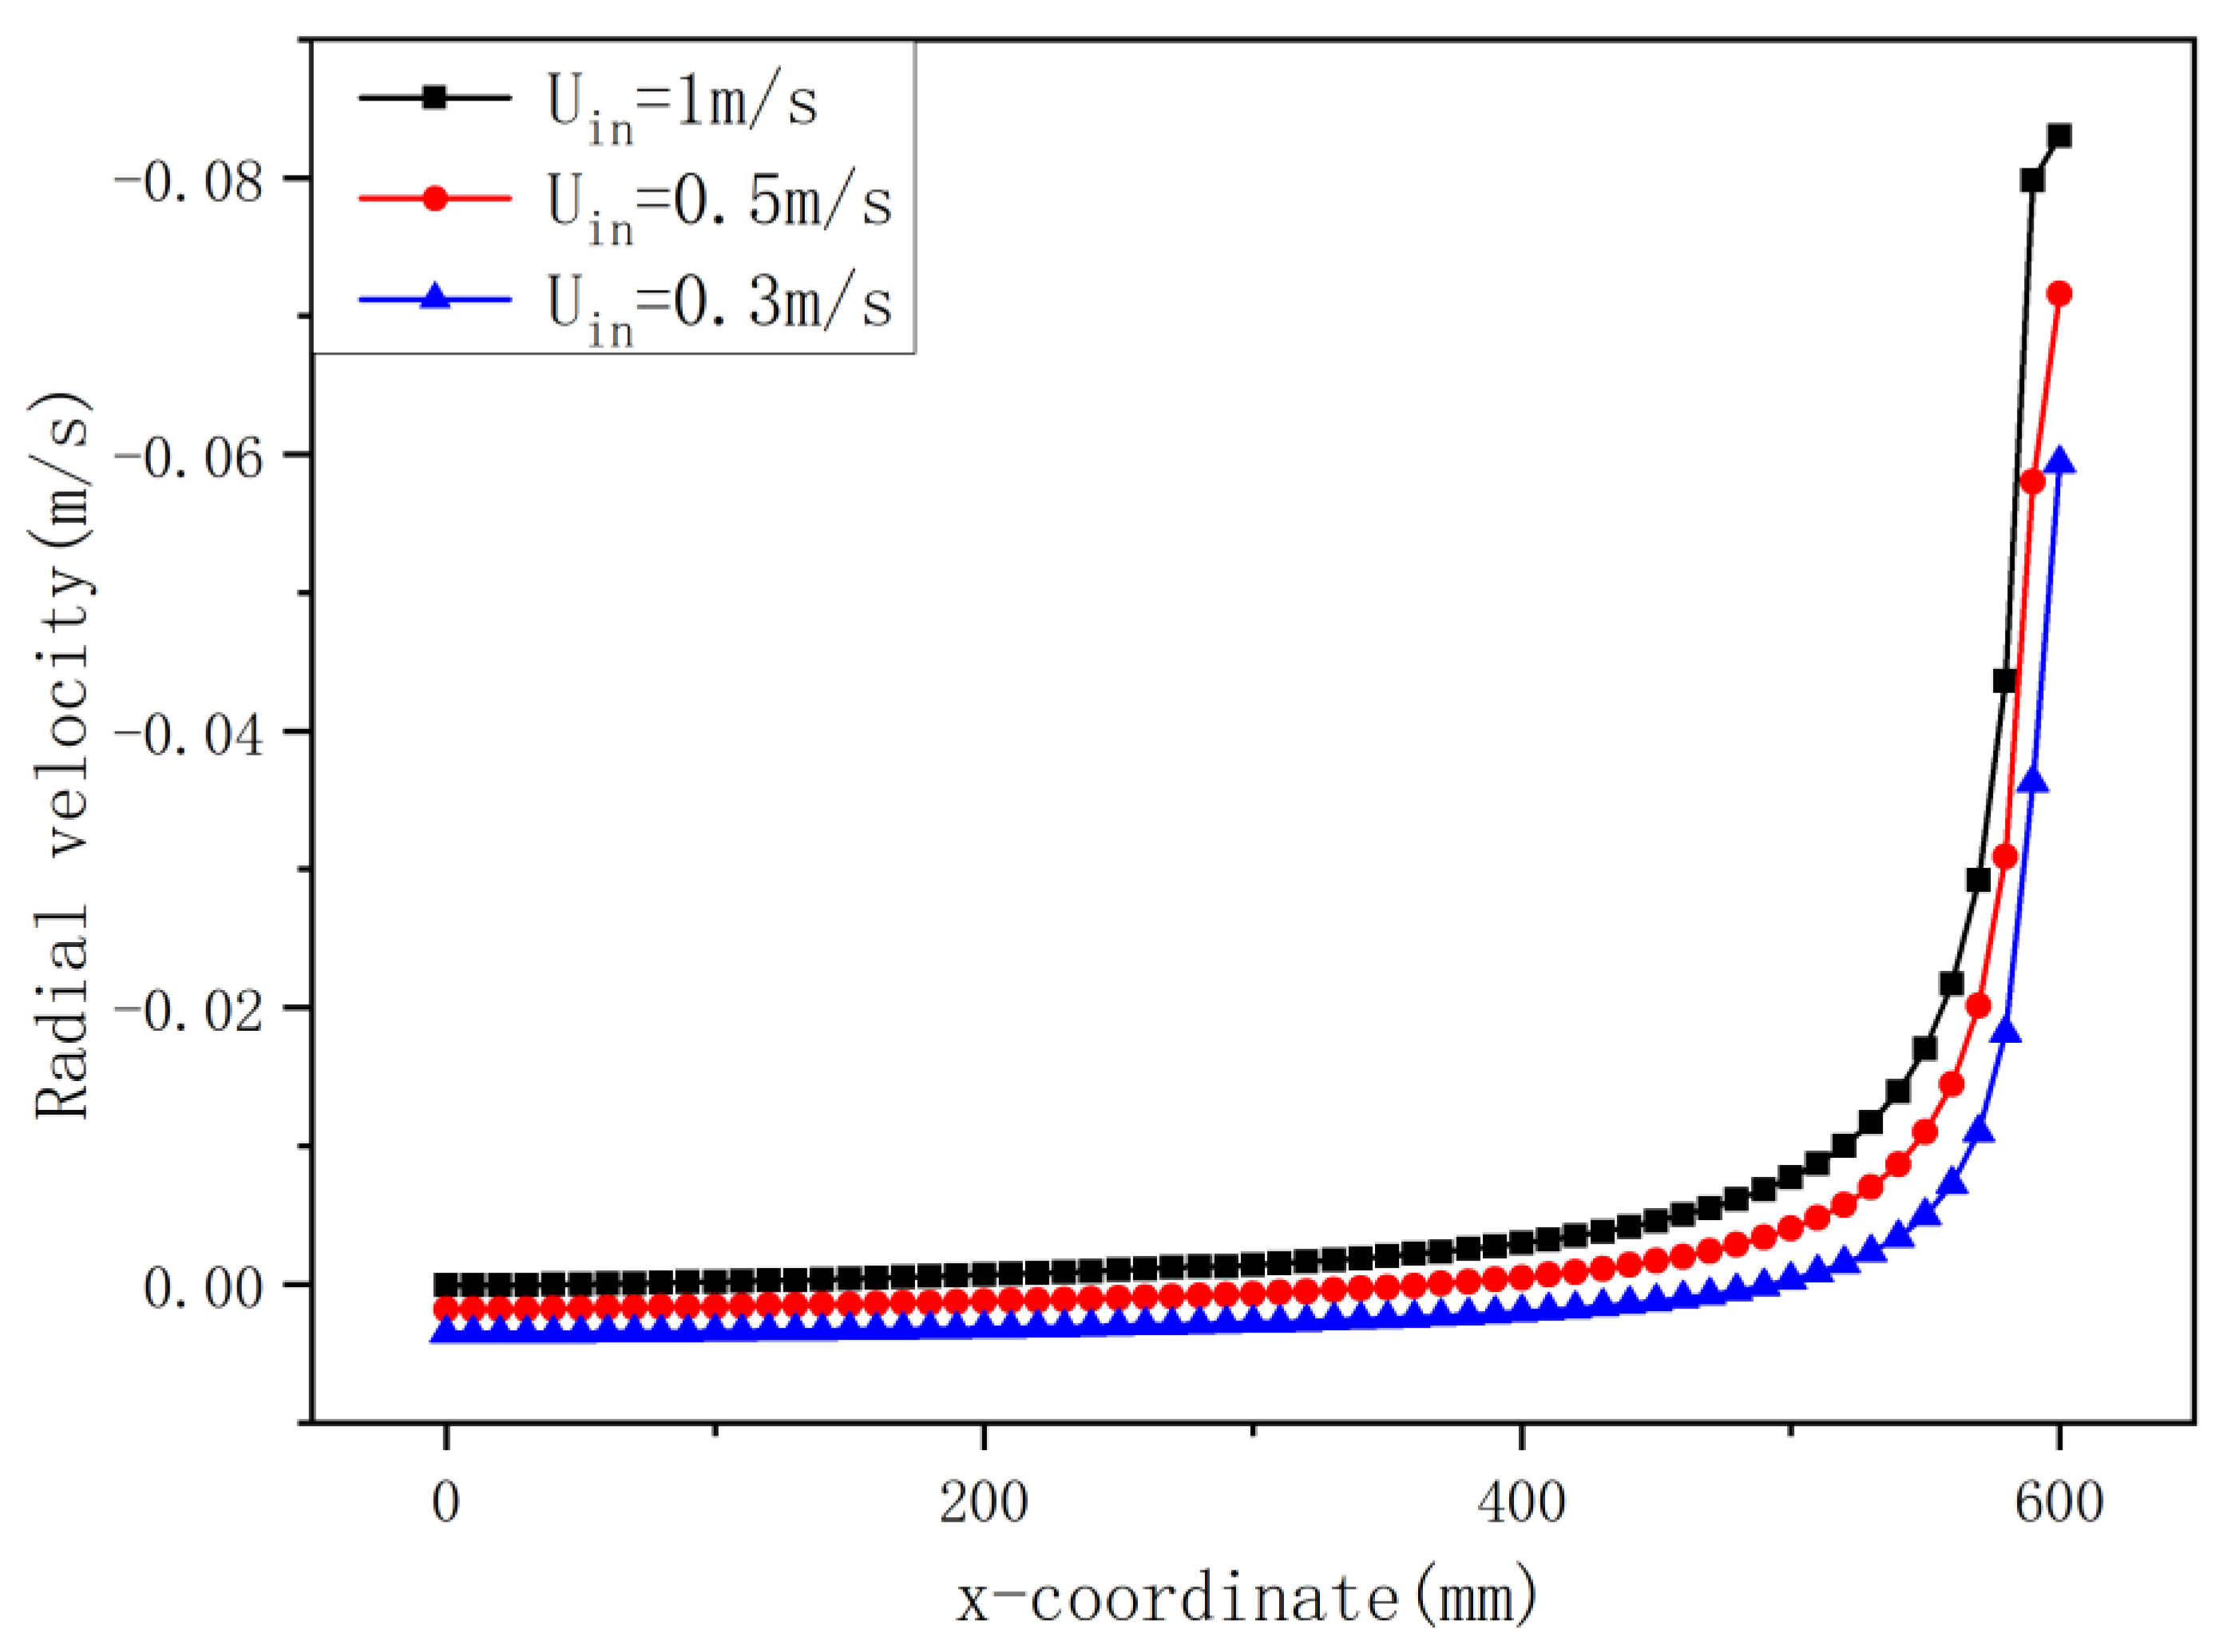
Figure 16.
Contours of water vapor with different Wvap in normal condensation (Tin=362.17K; Tcool=293K; Uin=1.8m/s; t=3.2s).
Figure 16.
Contours of water vapor with different Wvap in normal condensation (Tin=362.17K; Tcool=293K; Uin=1.8m/s; t=3.2s).
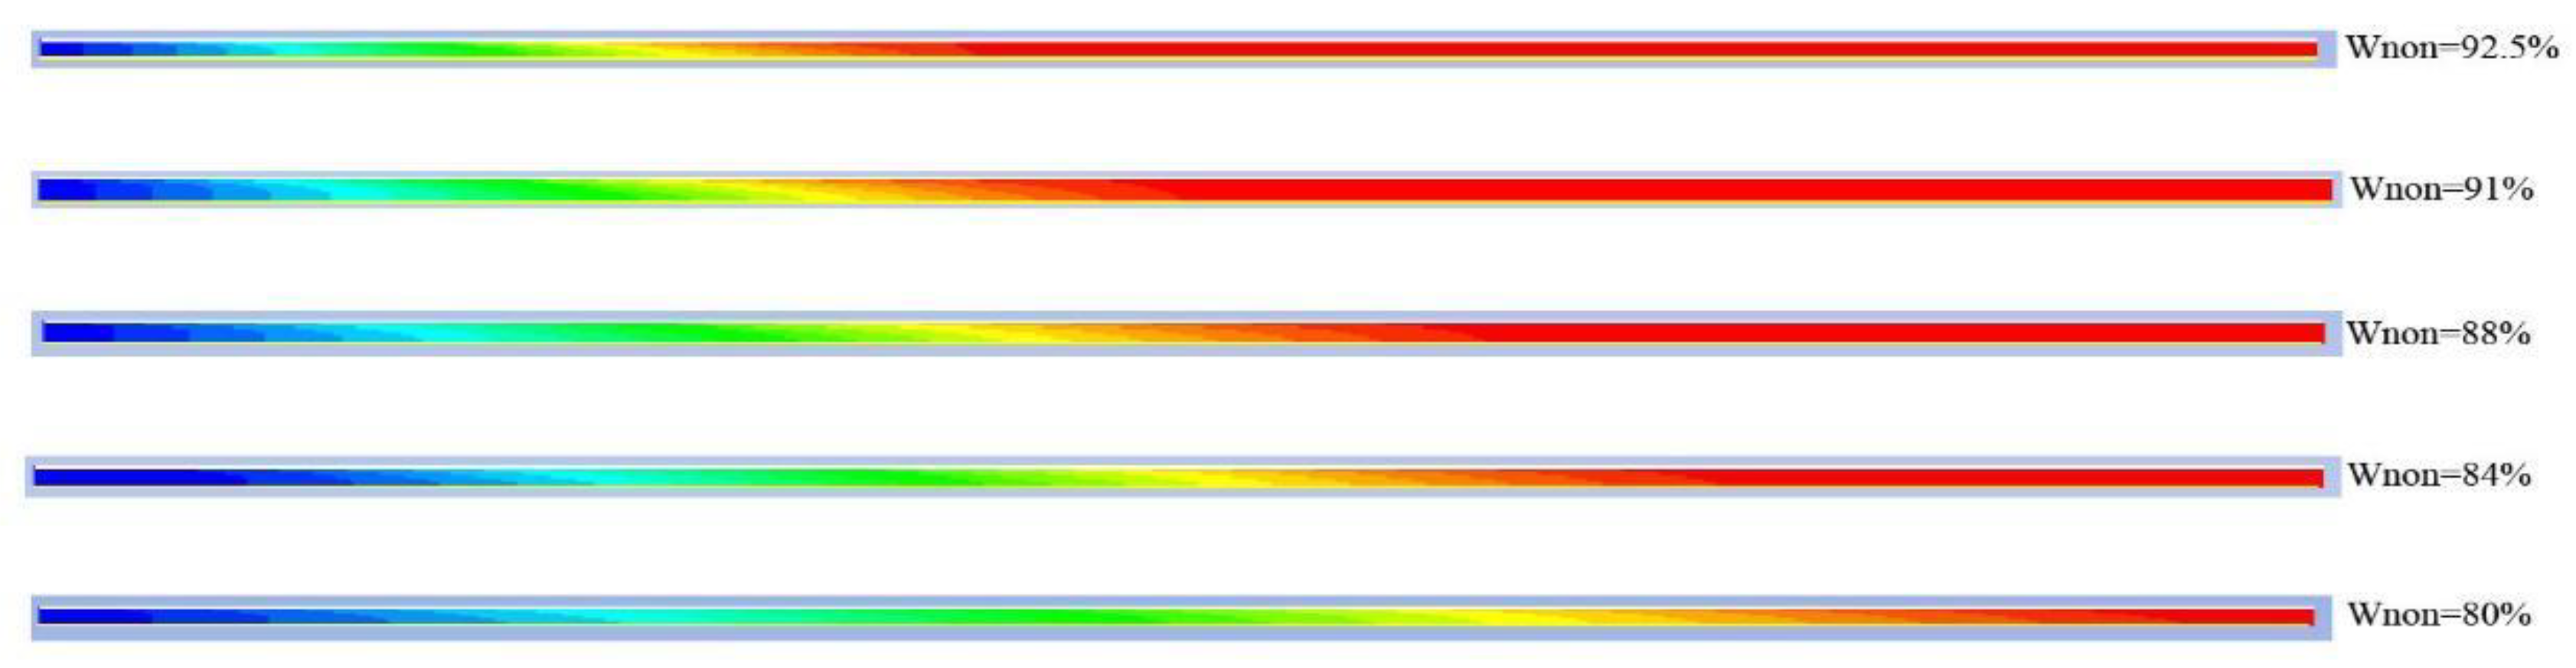
Figure 17.
Contours of water vapor with different Wvap in capillary condensation (Tin=362.17K; Tcool=323K; Uin=0.3m/s; t=3.2s).
Figure 17.
Contours of water vapor with different Wvap in capillary condensation (Tin=362.17K; Tcool=323K; Uin=0.3m/s; t=3.2s).

Figure 18 shows the variation in average suction effect coefficient (φa) with the increment of Wvap, where φa represents the average value of the suction effect coefficient during the flow. The results show a similar trend for different time steps (t) in which the highest and lowest values of φa occurred at Wvap=7.5% and Wvap=20%, respectively. This finding could be attributed to the fact that for each time step (t), the higher the value of Wvap, the lower the value of φa in the membrane. Additionally, φa declined dramatically with the passage of time. It could be further seen that the experimental proceeding time had a minor effect on φa at larger Wvap, such as 20%.
3.4. Effect of Tcool on Normal Condensation
Because the maximum Tcool heated by the electric heater (No.7 in the experimental module) was 323K and the Tsat was 315.29K at a fixed operational pressure, in order to guarantee that Tcool was always larger than Tsat when researching the capillary condensation, the variable range of Tcool was very limited. As a result, we only analyzed normal condensation in this part.
The condensation heat flux (qcon) and condensation mass flux (mcon) generated in the near-wall region can be calculated by Eq(30),(31):
where h and γ represent the convective heat transfer coefficient and latent heat, respectively.
The numerical data is shown in the following figures. The curves presented in Figure 19 and Figure 20 changed dramatically in the initial stage and then declined gradually until the end. Because the material of the membrane tube wall surface was hydrophilic, the phase transition on it could regarded as film-wise condensation, and the convective heat flux was relatively high. In addition, the values of qc and mcon were enhanced with the decrease in Tcool due to the fact that the heat transfer process was sensitive to the temperature difference between the feed gas and coolant water.
Figure 21 shows the convective heat transfer coefficient (h) distribution along the y-coordinate for different Tcool, where y=600mm represents the membrane wall surface (as depicted in Figure 1). As depicted in Figure 21, the forced convective heat transfer proceeded significantly in the near-wall region of the membrane tube. Furthermore, the variation tendencies of h along the y-coordinate for varied Tcool were completely different. At a fixed x-coordinate, h declined dramatically with increasing Tcool, which was indicative of the fact that the forced convective heat transfer process was sensitive to the temperature difference between the feed gas and cooling water.
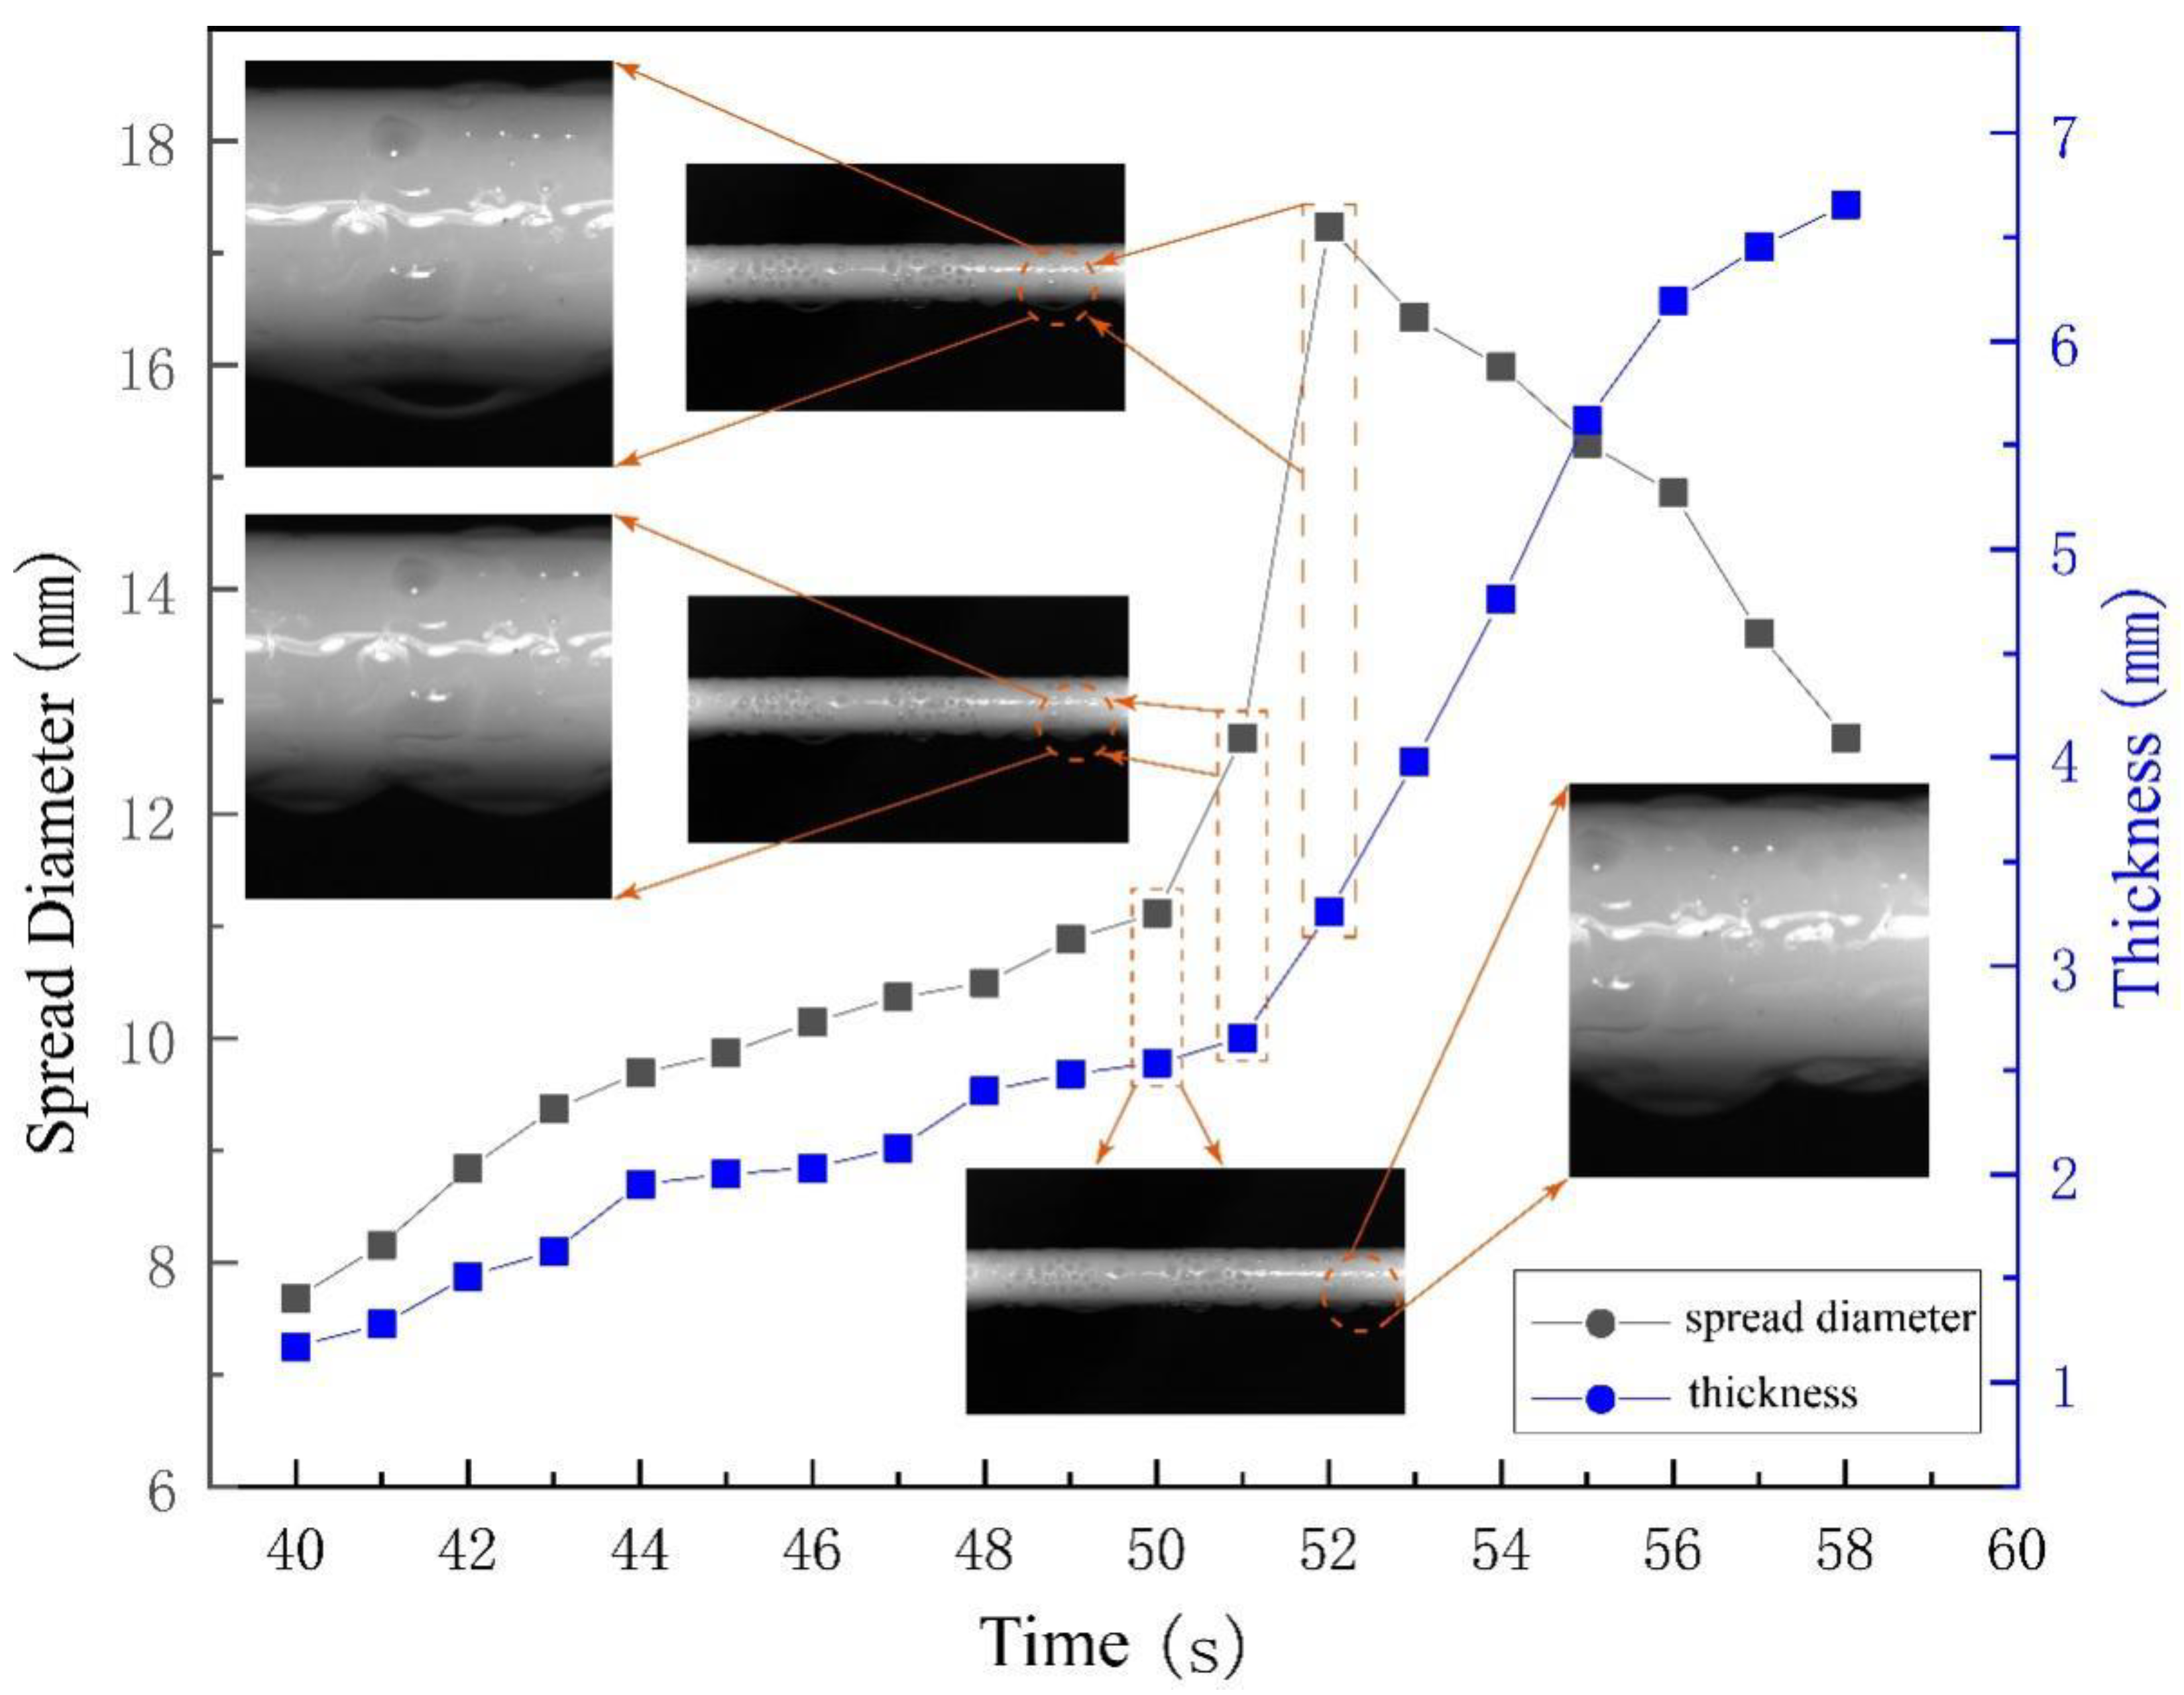
According to the results from the observational experiment, we also analyzed the variation in weight of water recovery (m’re) with different Tcool in five groups experimentally, and present the data in Figure 22. The results show a declining trend in which the highest and lowest m’re occurred at Tcool=285K and Tcool=302K, respectively. When Tcool increased from 285K to 302K, m’re with other conditions fixed increased by approximately 3.5 times. Typically, the thickness of the condensate film apparently increases with experimental time, and the maximum thickness reaches 6.63 mm after 60 s. This is because the multi-level condensation process is influenced by the distribution of condensate droplets and condensate films. Condensate morphology also reflects the intensity of the condensation heat and mass transfer process.
Figure 22.
m’re distribution along the ceramic tube versus Tcool (Tin=371.63 K; Uin=1.8m/s; time=10mins).
Figure 22.
m’re distribution along the ceramic tube versus Tcool (Tin=371.63 K; Uin=1.8m/s; time=10mins).
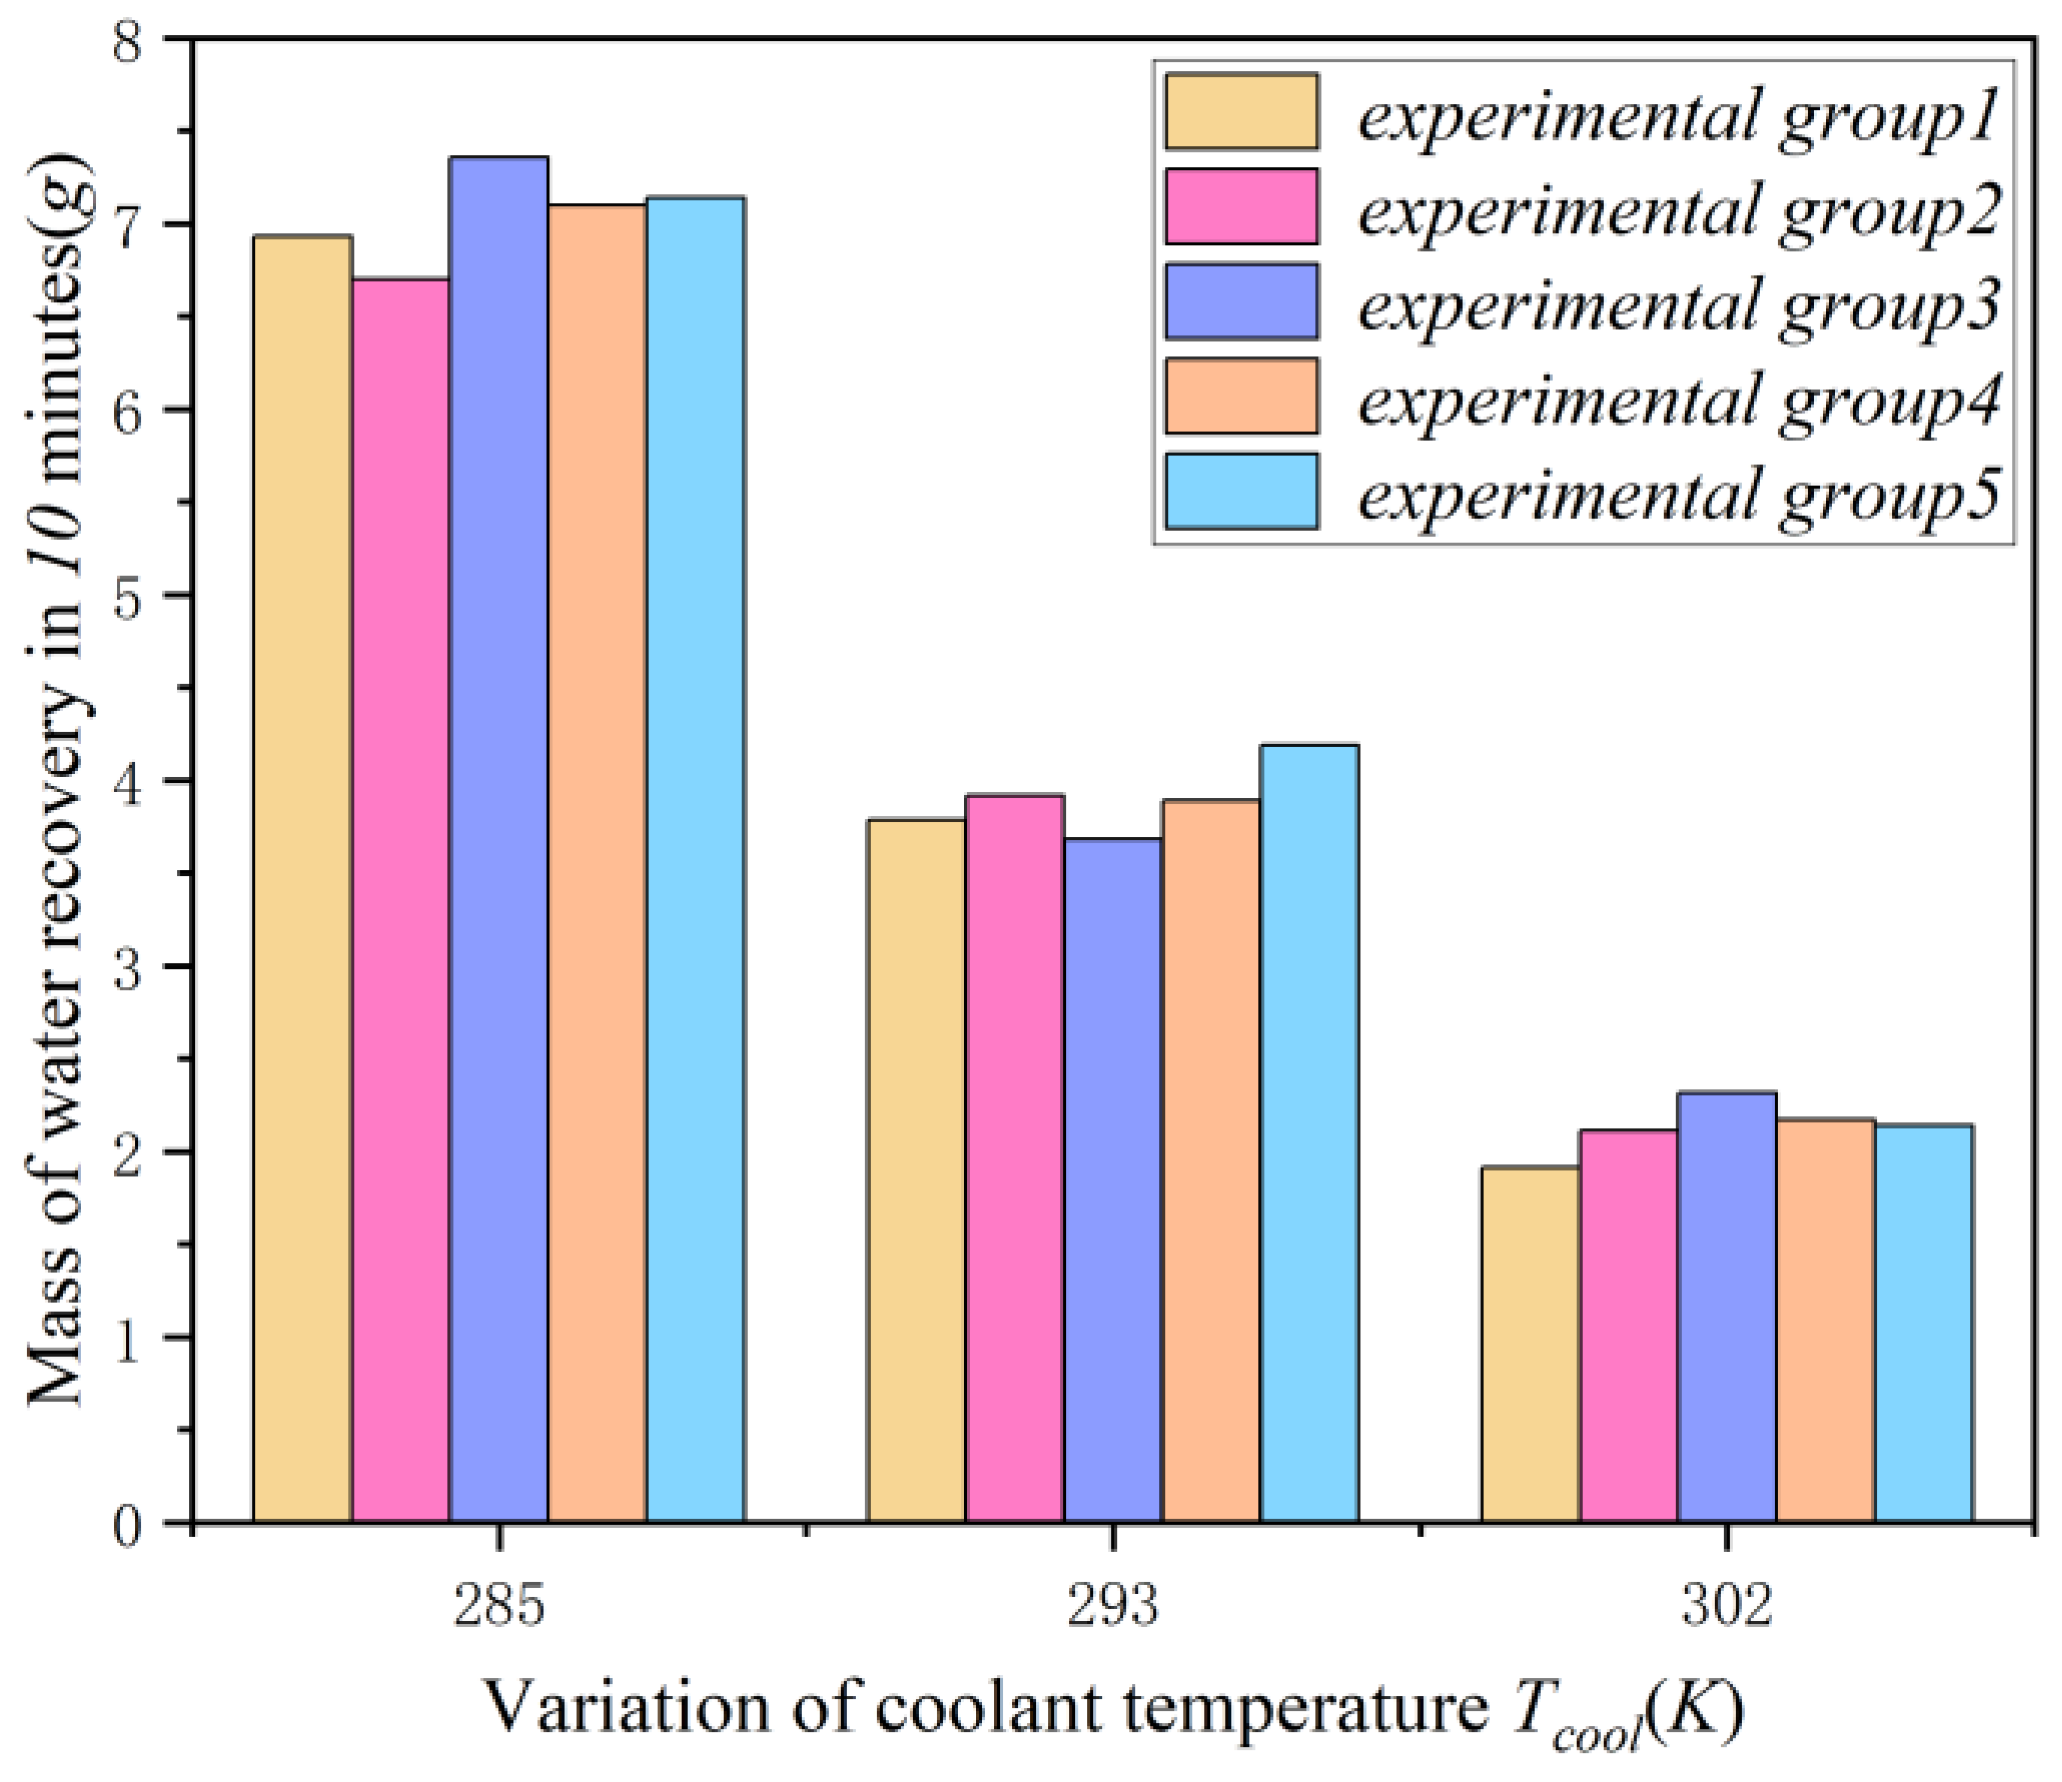
Figure 23.
m’re distribution along the ceramic tube versus Tcool (Tin=371.63 K; Uin=1.8m/s; time=10mins).
Figure 23.
m’re distribution along the ceramic tube versus Tcool (Tin=371.63 K; Uin=1.8m/s; time=10mins).
4. Conclusion
The thermal and mass transfer performance of the tubular transport membrane condenser (TCM) was systematically investigated through both numerical and experimental approaches. By analyzing the coupled effects of operational parameters—including inlet velocity, cooling water temperature, and non-condensable gas mass fraction—the main findings are as follows.
The developed numerical model demonstrated excellent agreement with the experimental data. The maximum relative errors were strictly controlled within 1.14% and 0.59% for the normal condensation (NCD) and capillary condensation (CCD) processes, respectively, ensuring high reliability for the flow and heat transfer predictions.
The NCD process occurred uniformly across the entire tube length. During this process, both the water recovery rate and the bulk temperature difference increased monotonically with inlet velocity (from 0.3 to 2.8 m/s), peaking at 1.47 kg/(m²·h) and 42.7 K, respectively. Conversely, the CCD process was predominantly localized in the downstream region (x=450–600 mm) due to the synergistic effects of pressure drop and velocity decay. Notably, CCD became highly inefficient for water recovery when the inlet velocity exceeded 1.0 m/s.
The impact of non-condensable gases was quantified using the average suction effect coefficient (φa). Both numerical and experimental results confirmed that a lower non-condensable gas mass fraction directly yields a reduced φa within the TCM. Furthermore, φa exhibited a sharp decline over time, although the experimental duration had a negligible impact when the initial vapor mass fraction was maintained at 20%.
The multi-stage condensation performance was highly sensitive to the cooling water temperature. Decreasing the cooling temperature from 302 K to 285 K led to an approximate 3.5-fold increase in the water recovery mass under constant operating conditions, underscoring the strong dependence of mass transfer on local thermal gradients.
Consequently, this fundamental exploration of two-phase flow characteristics and heat transport mechanisms during multi-stage condensation on porous surfaces provides critical insights for optimizing tubular TCMs. These findings pave the way for more efficient designs in industrial water harvesting and waste heat recovery, contributing broadly to global energy conservation and carbon reduction initiatives.
Acknowledgments
The authors are grateful for the support of “Key Projects of Jilin Province Science and Technology Development Plan” (grant no. 20250801123FG).
Nomenclature
| Notations | Subscripts |
| λ: thermal conductivity (W/m.K) | mass: mass conservation equation |
| h: convective heat transfer coefficient (W/K.m2) | vap: vapor |
| p: static pressure (Pa) | non: non-condensable gas |
| T: temperature (K) | sat: saturated state of flow |
| V: velocity vector | pore: the pores within the membrane |
| U: velocity magnitude (m/s) | per: permeation mass flux |
| R: specific gas constant | m: ceramic membrane tube |
| d: diameter (m) | con: condensation |
| A: area (m2) | re: mass flux of water recovery |
| v’: volume (m3) | all: overall |
| q: heat flux (kJ/m2s) | species: species conservation equation |
| D: diffusion coefficient (m2/s) | enr: energy conservation equation |
| t: time step (s) | r: radial |
| M: molar weight (kg/mol) | b: bulk of feed gas |
| m: mass flux (kg/m2.s) | cool: cooling water |
| m’: weight (g) | mom: momentum |
| J: diffusion mass flux (kg/m2.s) | 0: initial state |
| Kn: Knudsen number | eff: efficient diffusion coefficient |
| W: mass fraction | ca: capillary |
| f: friction (N) | th: thermophoretic force |
| F: force (N) | i: inertia force |
| x: distance along the ceramic tube (mm) | cell: cells in the near-wall region |
| kB: Boltzmann constant | in: inlet of membrane module |
| k0: permeability coefficient | out: outlet of membrane module |
| Cm,Ct,Cs: constant numbers | |
| Greek letters | |
| ρ: density (kg/m3) | δ: thickness (m) |
| µ: dynamic viscosity (Pa.s) | γ: latent heat (KJ/Kg) |
| σ: characteristic size of the gas mixture (nm) | φ: suction effect coefficient |
| Ψ: porosity | θ: contact angle (º) |
References
- Okafor, P.E.; He, C.B.; Tang, G.H. A critical review of superinsulation performance of ceramic nanofibrous aerogel for extreme conditions: Modeling, fabrication,applications, and outlook. Adv. Colloid Interf. Sci. 2025, 335, 103–352. [Google Scholar] [CrossRef] [PubMed]
- Zhou, Y. Effect of mass transfer on heat transfer of microporous ceramic membranes for water recovery. International Journal of Heat and Mass Transfer 2017, 112, 643–648. [Google Scholar] [CrossRef]
- Hu, H.W.; Tang, G.H.; Niu, D. Wettability modified nanoporous ceramic membrane for simultaneous residual heat and condensate recovery. Scientific Reports 2016, 6. [Google Scholar] [CrossRef] [PubMed]
- Gulfam, R.; Huang, T.E.; Lv, C.X. Condensation heat transfer on phase change slippery liquid-infused porous surfaces. Int. J. Heat Mass Transf. 2022, 185, 122–384. [Google Scholar] [CrossRef]
- Uchytil, P.; Loimer, T. Large mass flux differences for opposite flow directions of a condensable gas through an asymmetric porous membrane. Journal of Membrane Science 2014, 470, 451–457. [Google Scholar] [CrossRef]
- Loimer, T. Linearized description of the non-isothermal flow of a saturated vapor through a micro-porous membrane. Journal of Membrane Science 2007, 301, 107–117. [Google Scholar] [CrossRef]
- Fu, W. Numerical investigation of convective condensation with the presence of non-condensable gases in a vertical tube. Nuclear Engineering and Design 2016, 297, 197–207. [Google Scholar] [CrossRef]
- Bao, A.; Wang, D.; Lin, C. Nanoporous membrane tube condensing heat transfer enhancement study. International Journal of Heat and Mass Transfer 2015, 84, 456–462. [Google Scholar] [CrossRef]
- Hu, H.W.; Tang, G.H.; Niu, D. Wettability modified nanoporous ceramic membrane for simultaneous residual heat and condensate recovery. Scientific Reports 2016, 6. [Google Scholar] [CrossRef]
- Asfand, F.; Stiriba, Y.; Bourouis, M. CFD simulation to investigate heat and mass transfer processes in a membrane-based absorber for water-LiBr absorption cooling systems. Energy 2015, 91, 517–530. [Google Scholar] [CrossRef]
- Huang, J.; Zhang, J.; Wang, L. Review of vapor condensation heat and mass transfer in the presence of non-condensable gas. Applied Thermal Engineering 2015, 89, 469–484. [Google Scholar] [CrossRef]
- Caruso, G.; Di Maio, D. Vitale. Heat and mass transfer analogy applied to condensation in the presence of noncondensable gases inside inclined tubes. International Journal of Heat and Mass Transfer 2014, 68, 401–414. [Google Scholar] [CrossRef]
- Yi, Q. Visualization study of the influence of non-condensable gas on steam condensation heat transfer. Applied Thermal Engineering 2016, 106, 13–21. [Google Scholar] [CrossRef]
- Behrang, A. A theoretical study on the permeability of tight media; effects of slippage and condensation. Fuel 2016, 181, 610–617. [Google Scholar] [CrossRef]
- Zschaeck, G.; Frank, T.; Burns, A.D. CFD modelling and validation of wall condensation in the presence of non-condensable gases. Nuclear Engineering and Design 2014, 279, 137–146. [Google Scholar] [CrossRef]
- Wang, X.; Chang, H.; Corradini, M. A CFD study of wave influence on film steam condensation in the presence of non-condensable gas. Nuclear Engineering and Design 2016, 305, 303–313. [Google Scholar] [CrossRef]
- Li, J. CFD simulation of water vapour condensation in the presence of non-condensable gas in vertical cylindrical condensers. International Journal of Heat and Mass Transfer 2013, 57, 708–721. [Google Scholar] [CrossRef]
- Dehbi, A.; Janasz, F.; Bell, B. Prediction of steam condensation in the presence of noncondensable gases using a CFD-based approach. Nuclear Engineering and Design 2013, 258, 199–210. [Google Scholar] [CrossRef]
- Xue, Q.; Lim, Y.J.; Wang, R. Chemically robust hollow fiber thin-film composite membranes based on polyurea selective layers for nanofiltration under extreme pH conditions. J. Membr. Sci. 2026, 738, 124818. [Google Scholar] [CrossRef]
- Yao, G.S.; Xu, J.L.; Feng, Y.J. Solar-driven interfacial evaporation of a hanging liquid marble. Sol. Energy Mater. Sol. Cells 2022, 234, 111–430. [Google Scholar] [CrossRef]
- Lei, W.H.; Wang, M.R.; Lu, X.K. Reverse capillary trapping and self-removal of non-aqueous fluid from dead-end structures by nanoparticle suspension. J. FluidMech. 2025, 1009. [Google Scholar] [CrossRef]
- Xie, J.; She, Q.T.; Xu, J.L. Mixed dropwise-filmwise condensation heat transfer on biphilic surface. Int. J. Heat Mass Transf. 2020, 150, 119–273. [Google Scholar] [CrossRef]
- Farber, E M; Seraphim, N M; Tamakuwala, K; et al. Porous materials: The next frontier in energy technologies[J]. Science 2025, 390, eadn9391. [Google Scholar] [CrossRef] [PubMed]
- Li, L; Sun, X; Miao, J; et al. Gradient engineering in interfacial evaporation for water, energy, and mineral harvesting[J/OL]. Energy & Environmental Science 2025. [Google Scholar]
Figure 2.
Configuration and theory of the ceramic tube with nanoporous membrane.
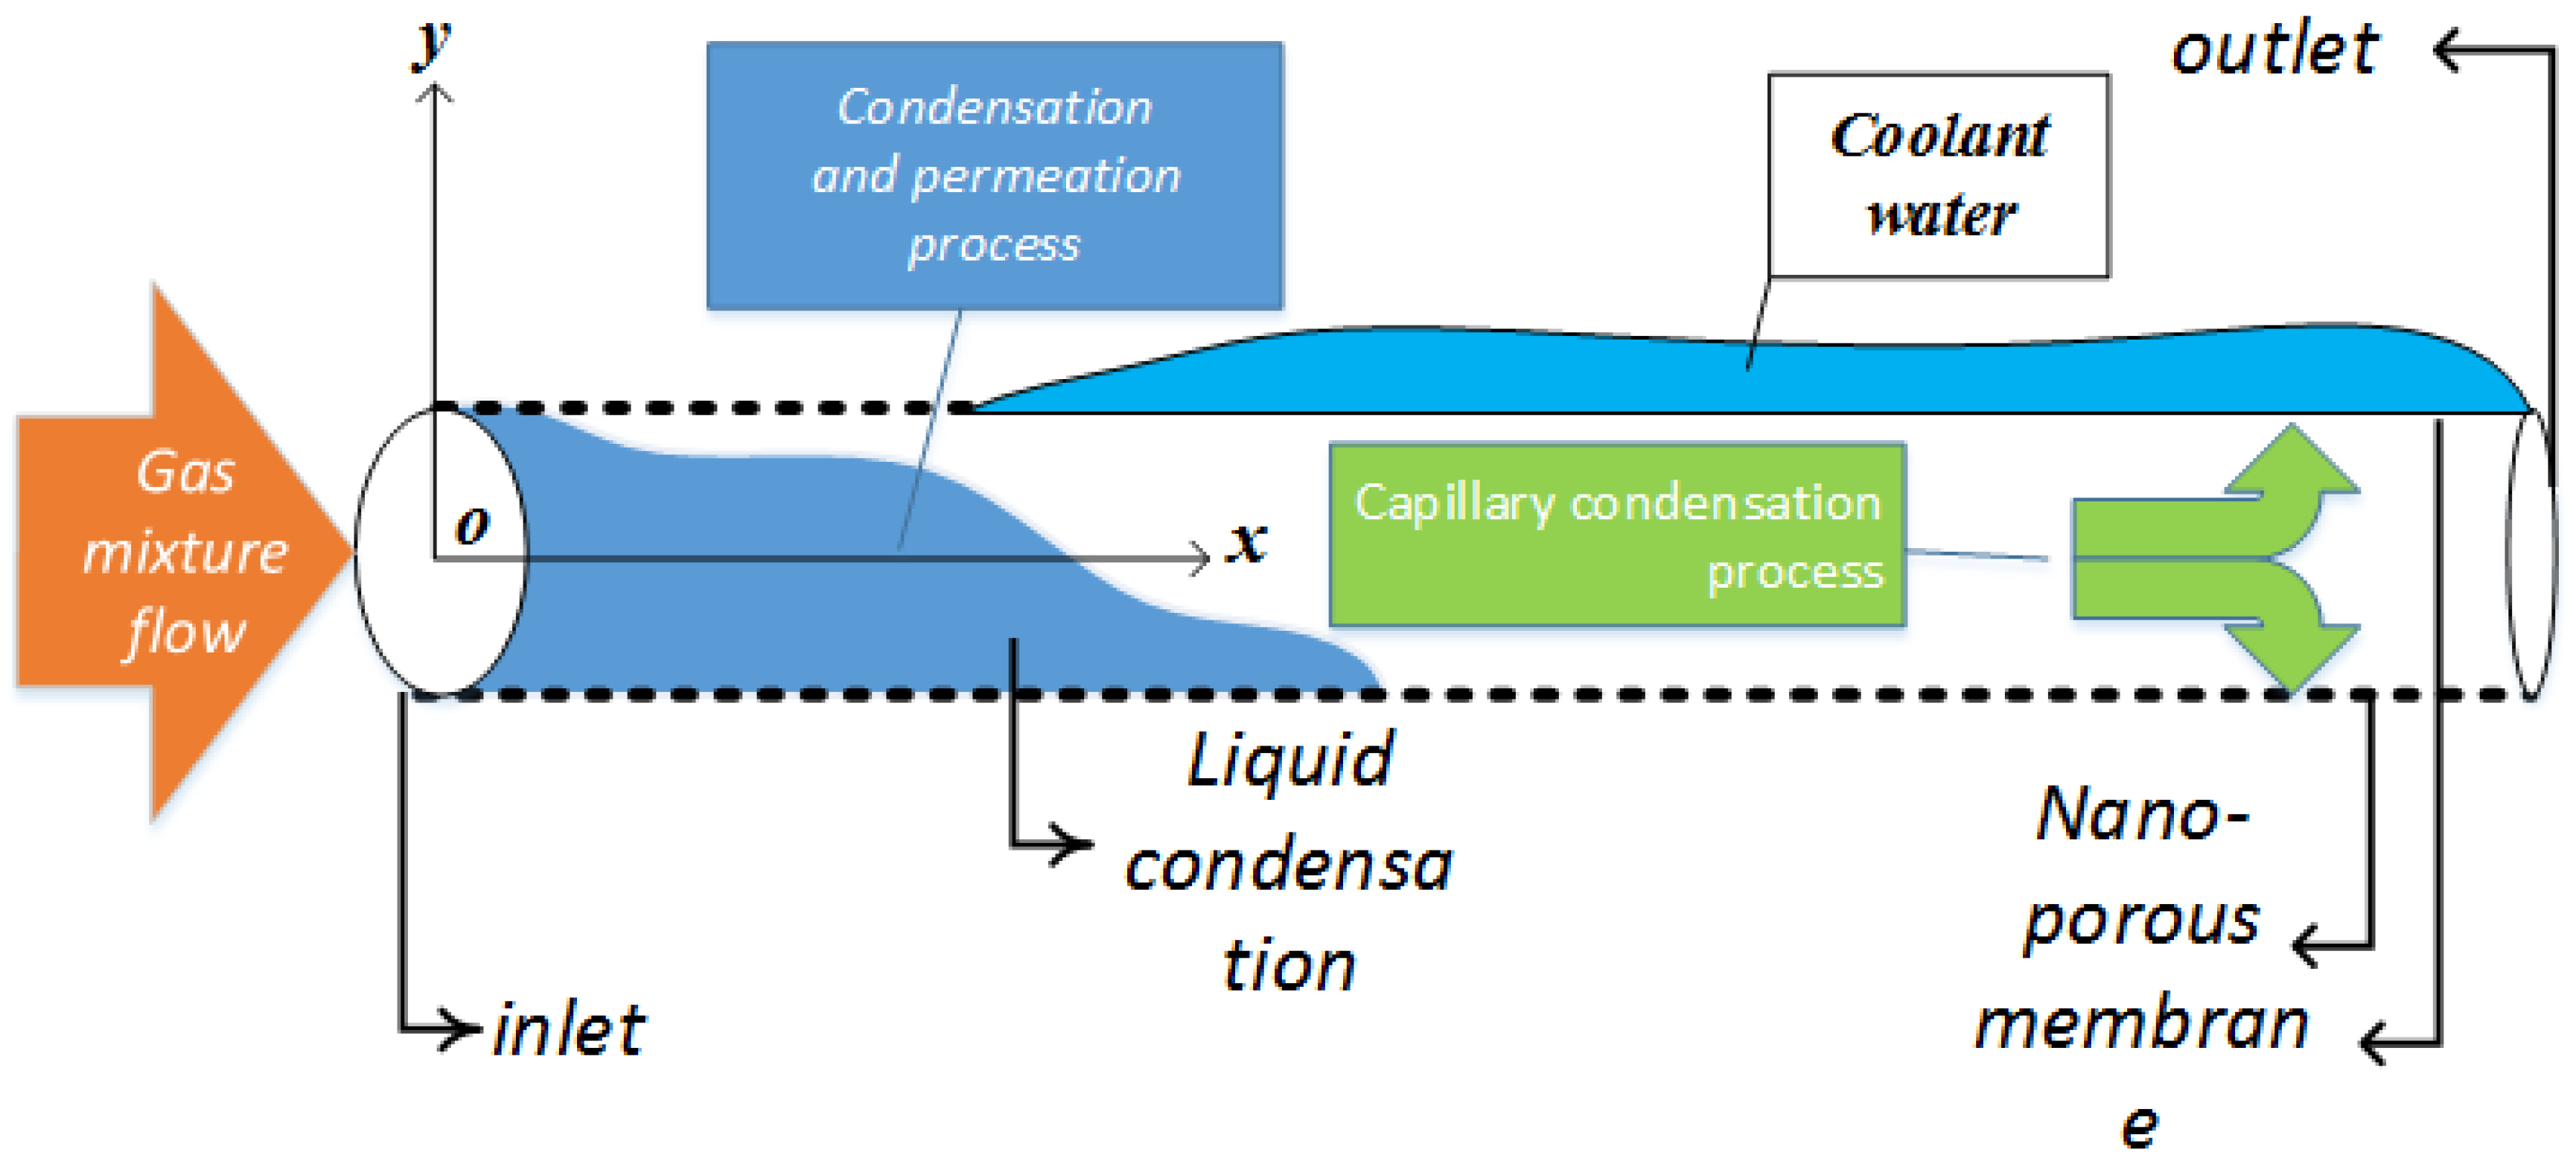
Figure 4.
Schematic diagram of experimental configuration.
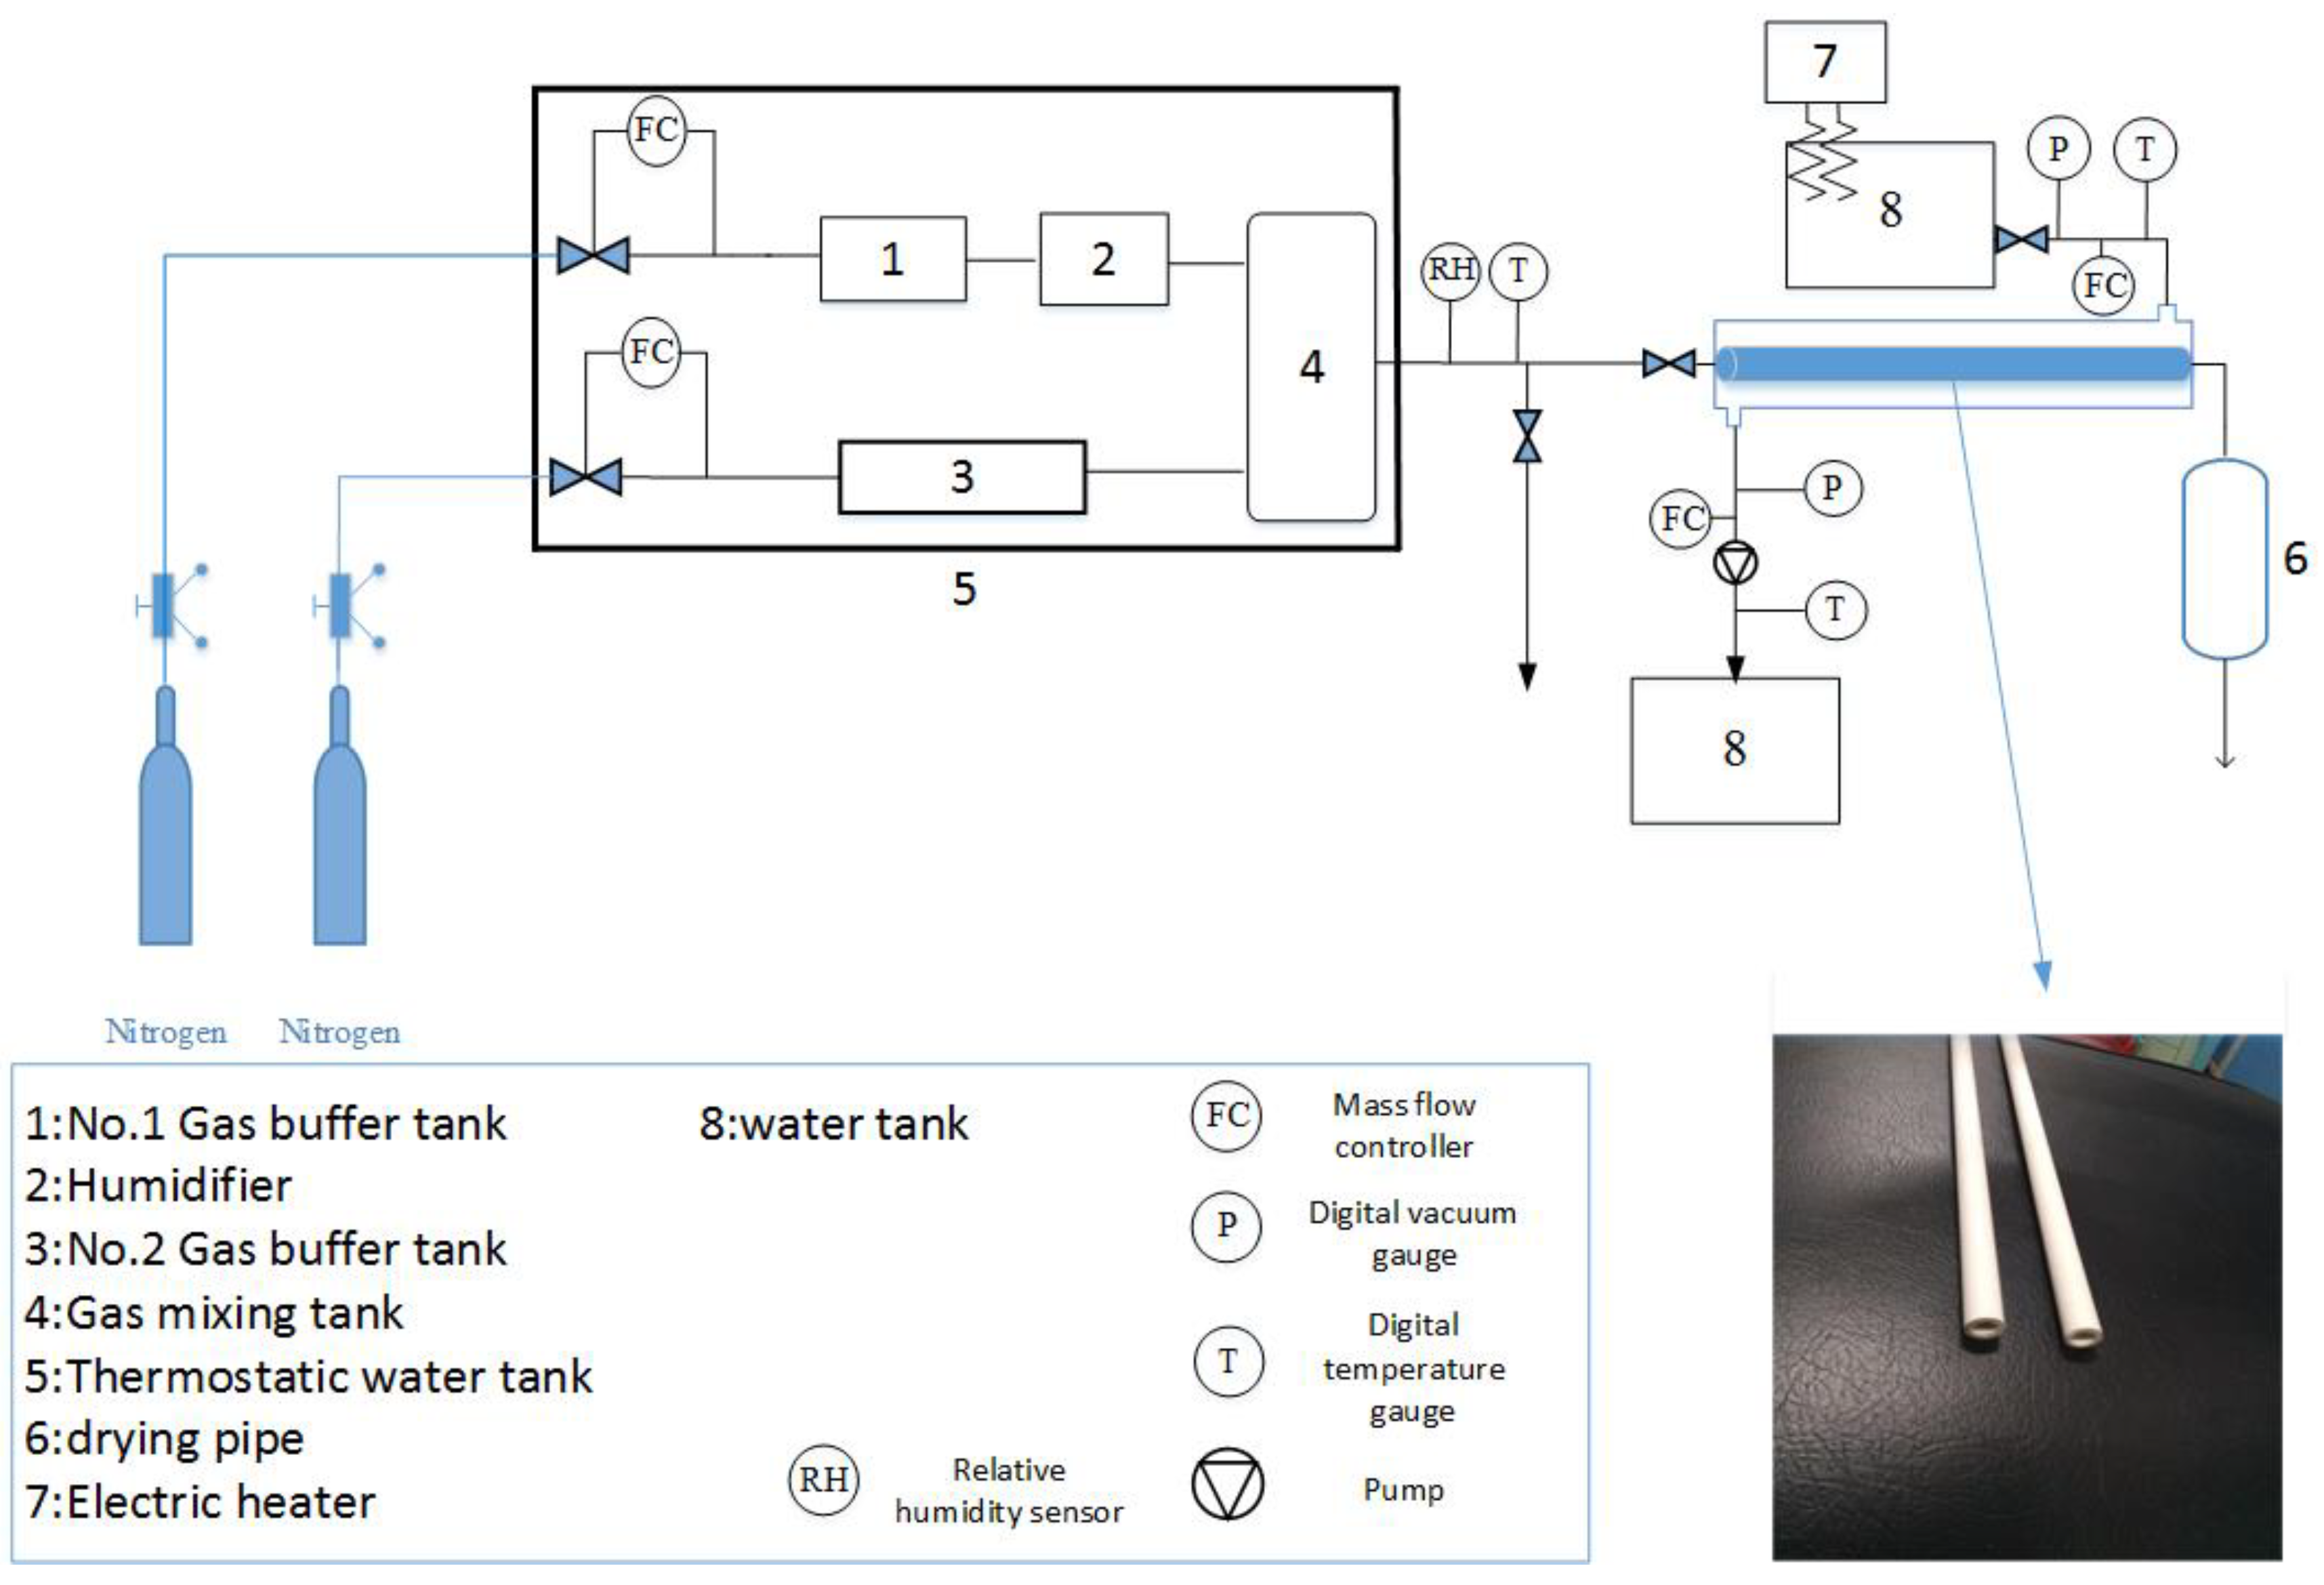
Figure 5.
Schematic diagram of experimental configuration.
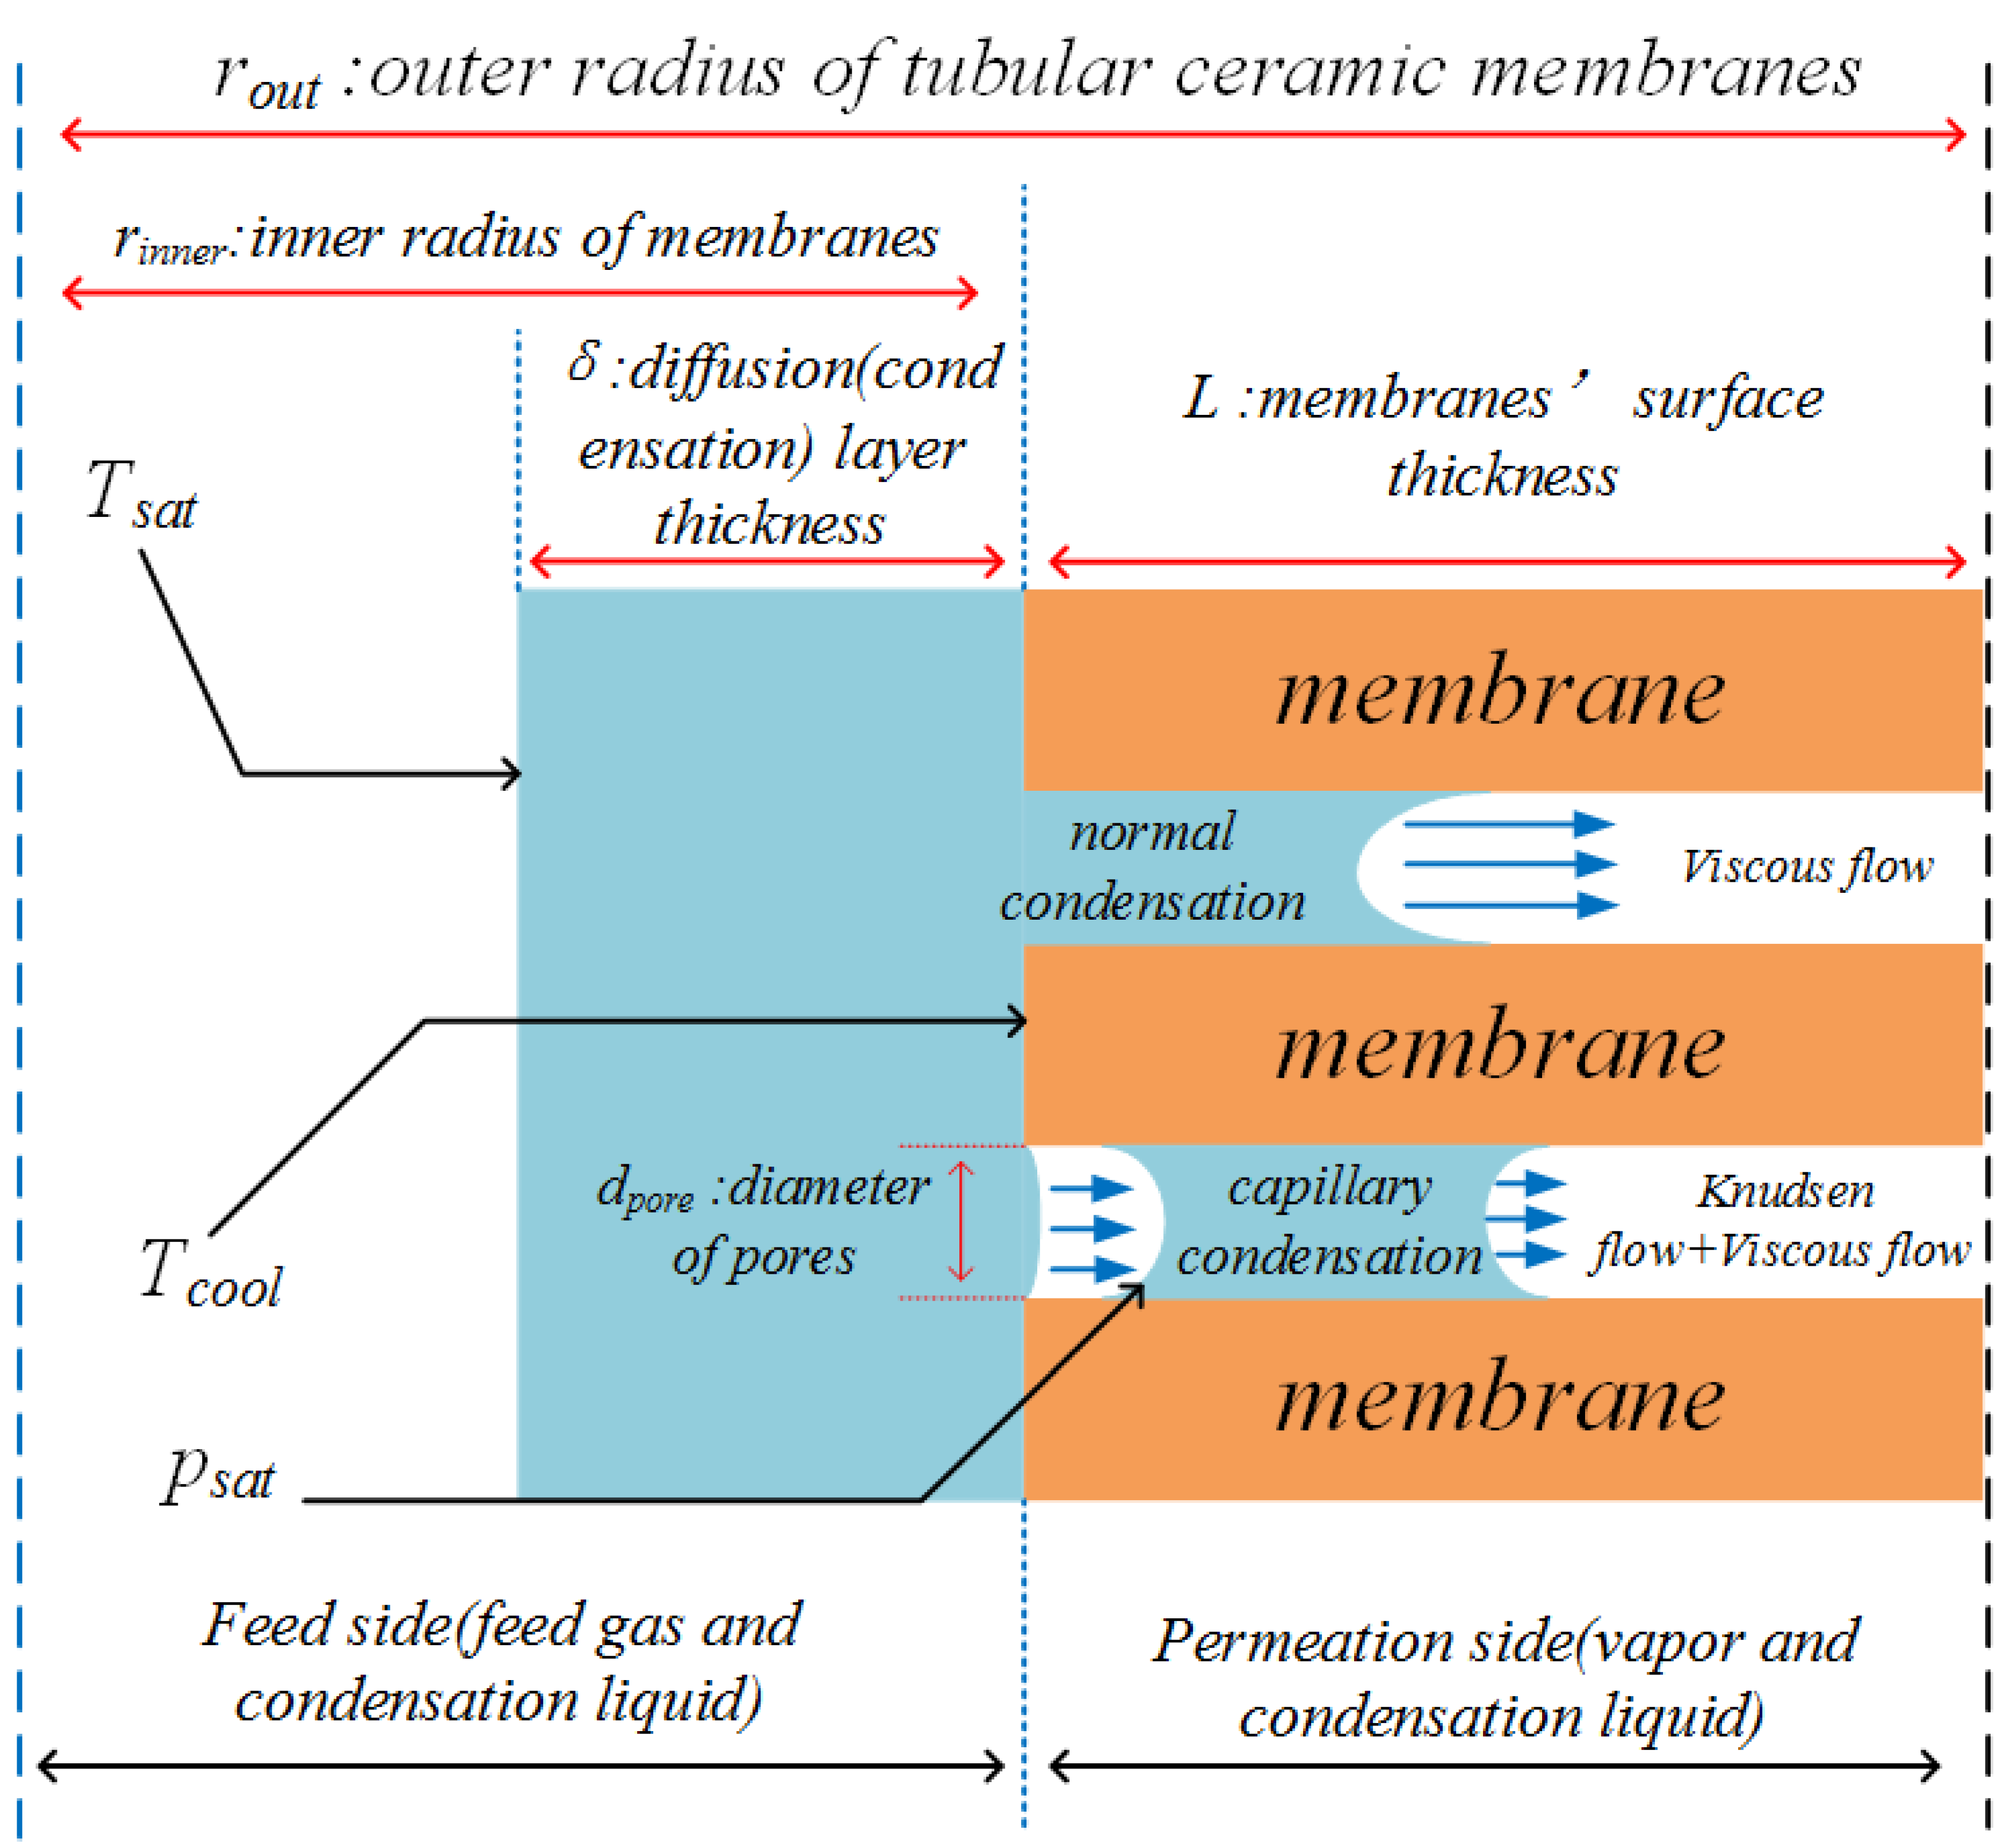
Figure 6.
Comparison between the experimental and numerical results from the simulation (Uin=2.8m/s; t=1.5E-2s; Wvap,0=7.5%).
Figure 6.
Comparison between the experimental and numerical results from the simulation (Uin=2.8m/s; t=1.5E-2s; Wvap,0=7.5%).
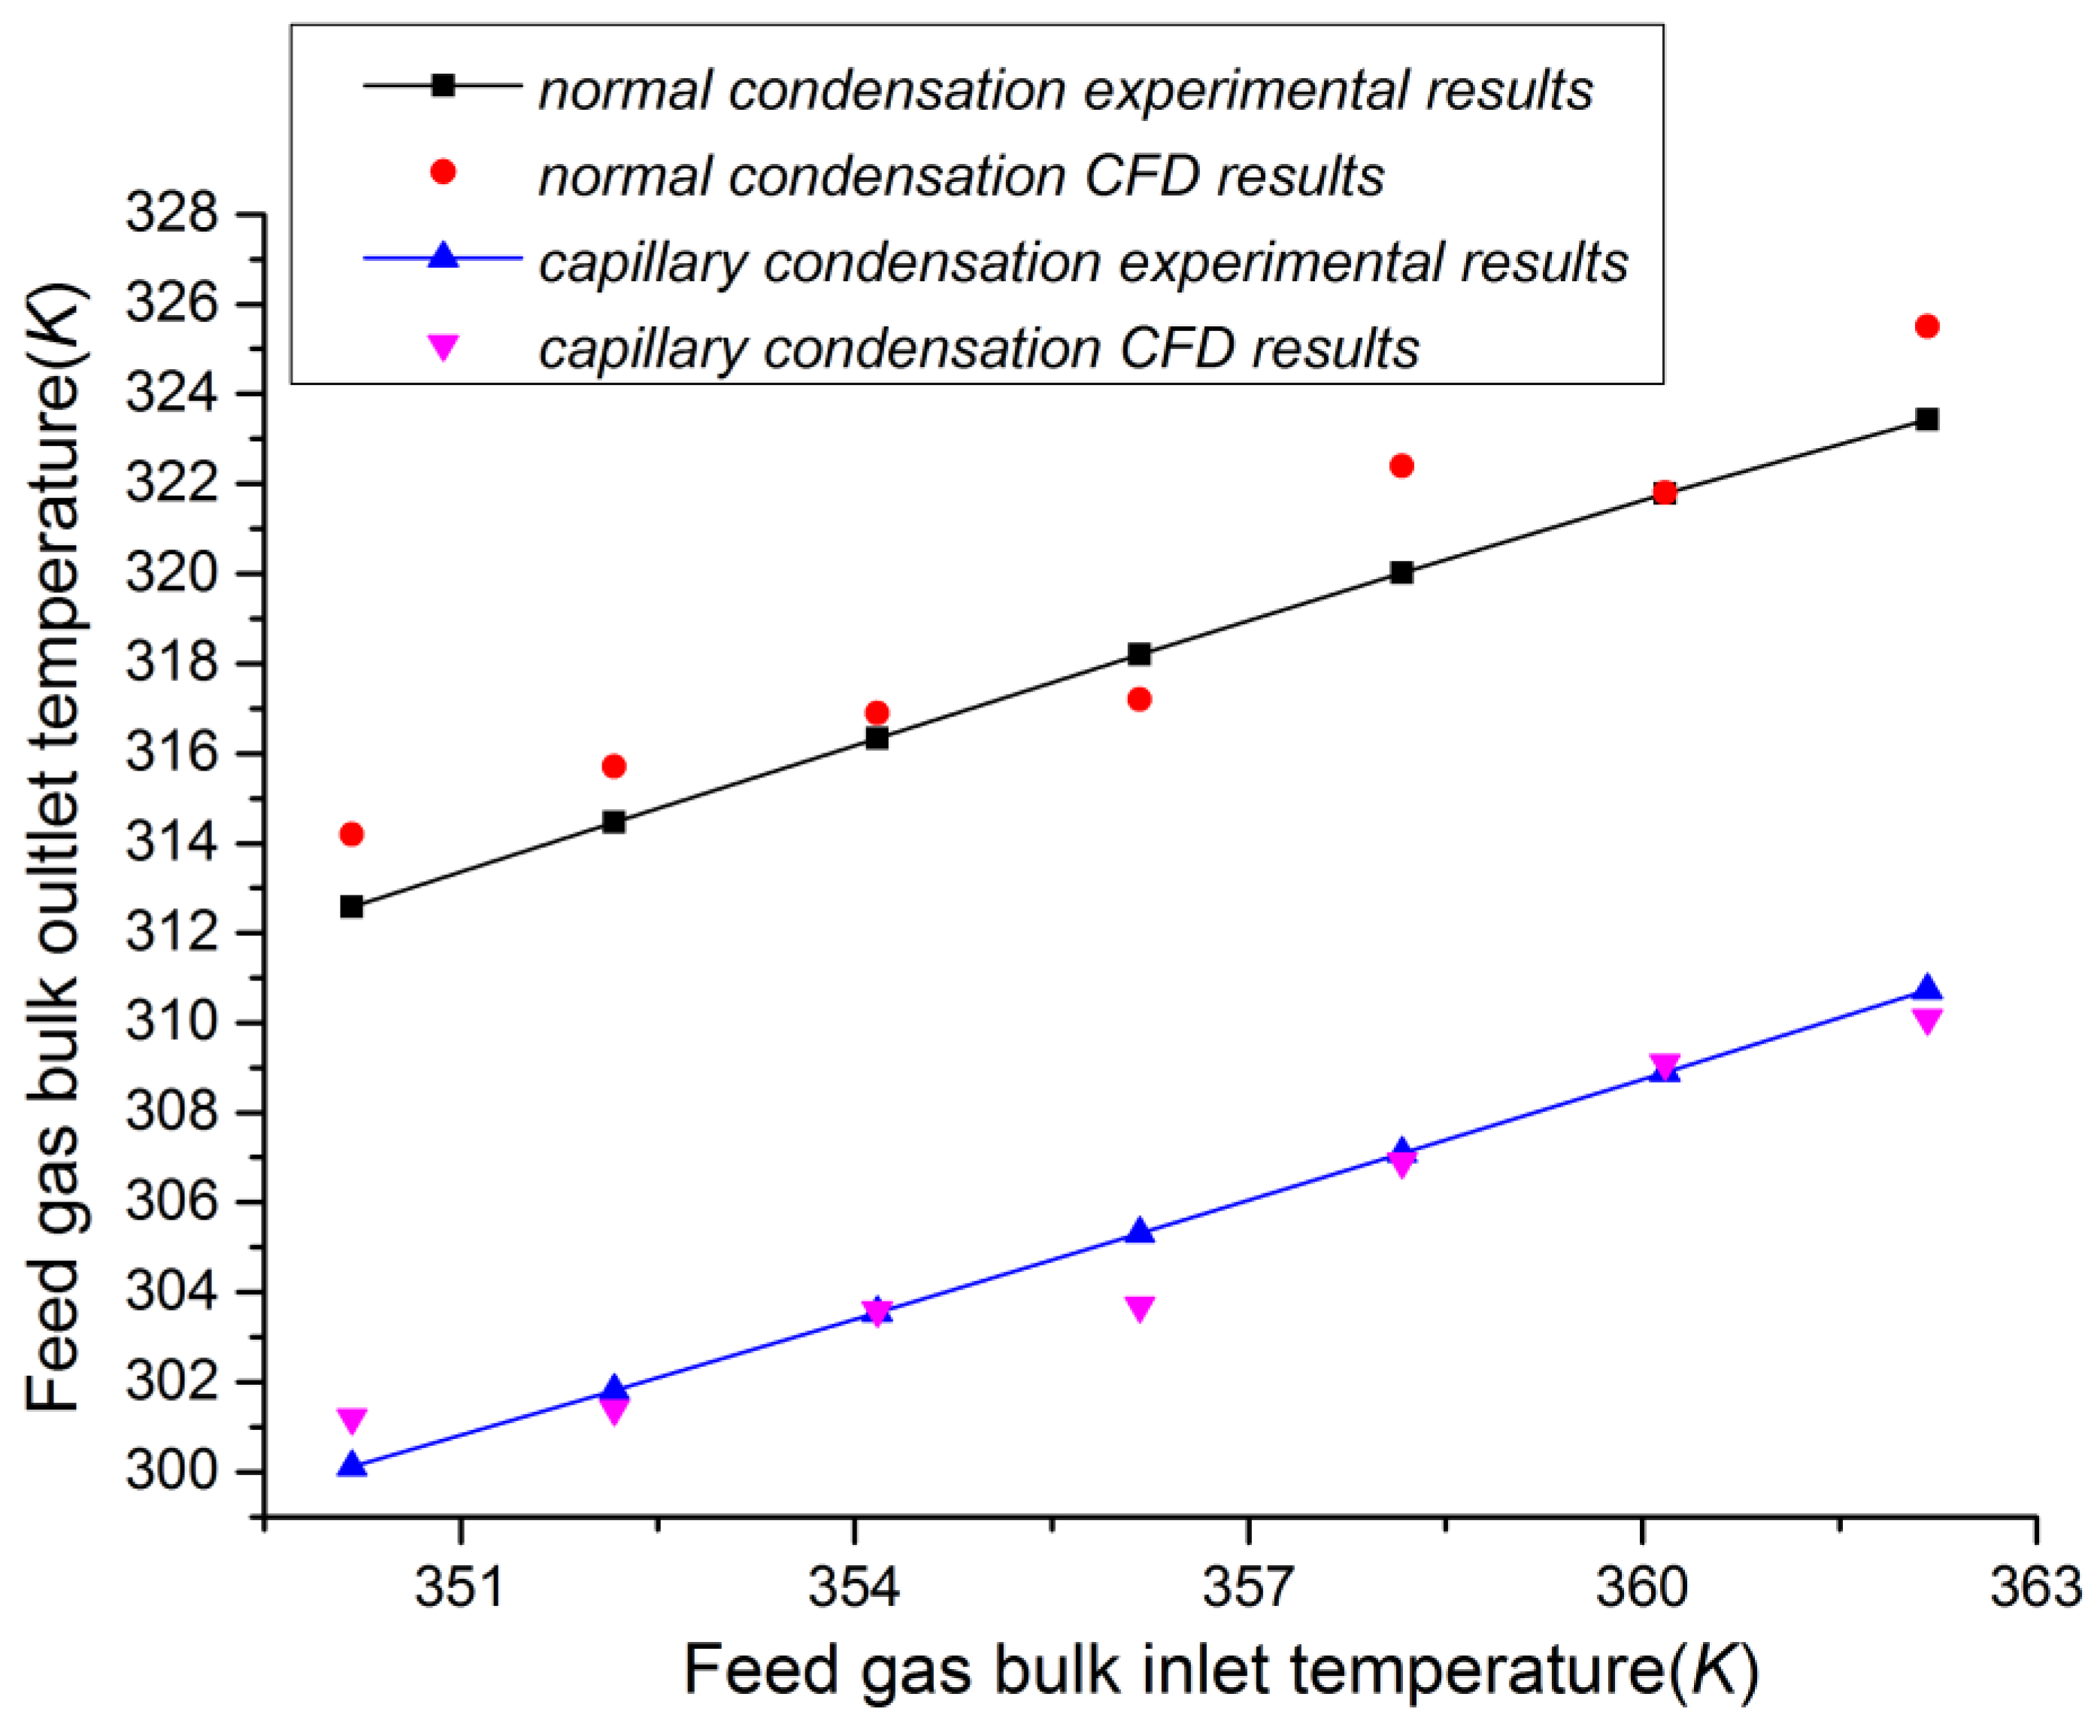
Figure 7.
Comparison between the experimental and numerical results from the simulation (Uin=2.8m/s; t=1.5E-2s; Wvap,0=7.5%).
Figure 7.
Comparison between the experimental and numerical results from the simulation (Uin=2.8m/s; t=1.5E-2s; Wvap,0=7.5%).
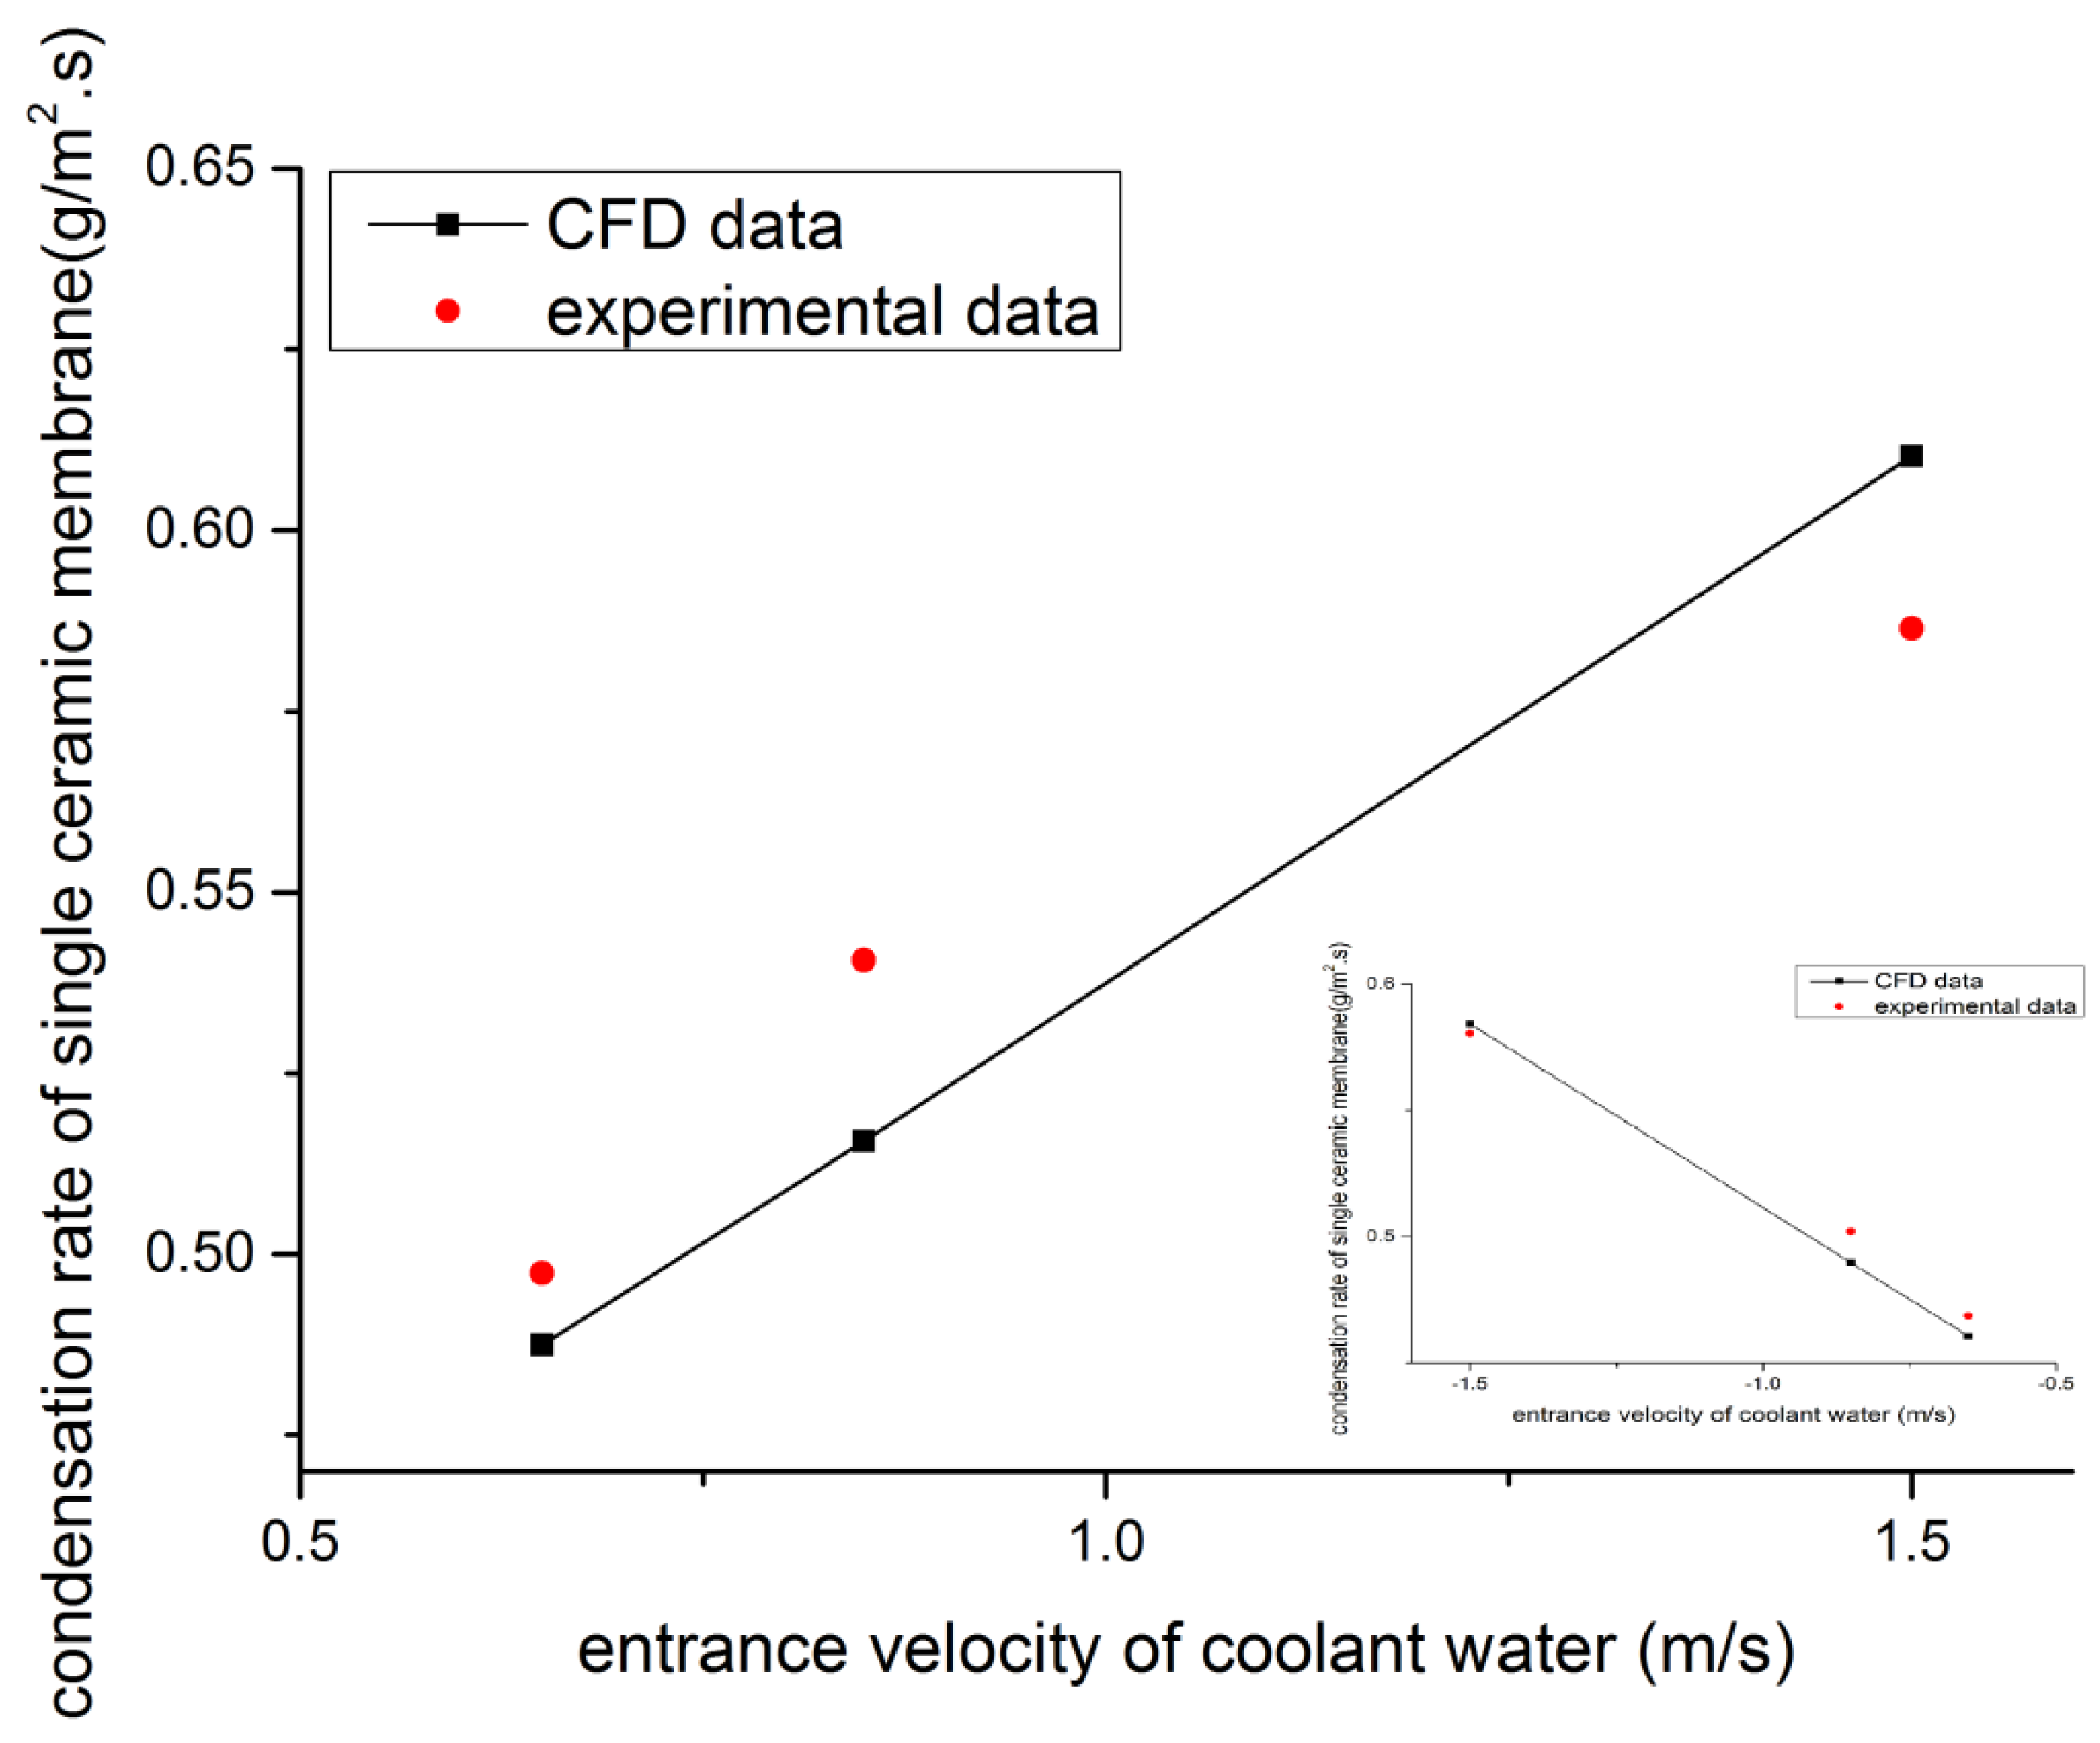
Figure 8.
Variation in ΔTb with different Uin in normal condensation (Tin=362.17K; Tcool=293K; Wvap,0=20%; time=10mins).
Figure 8.
Variation in ΔTb with different Uin in normal condensation (Tin=362.17K; Tcool=293K; Wvap,0=20%; time=10mins).
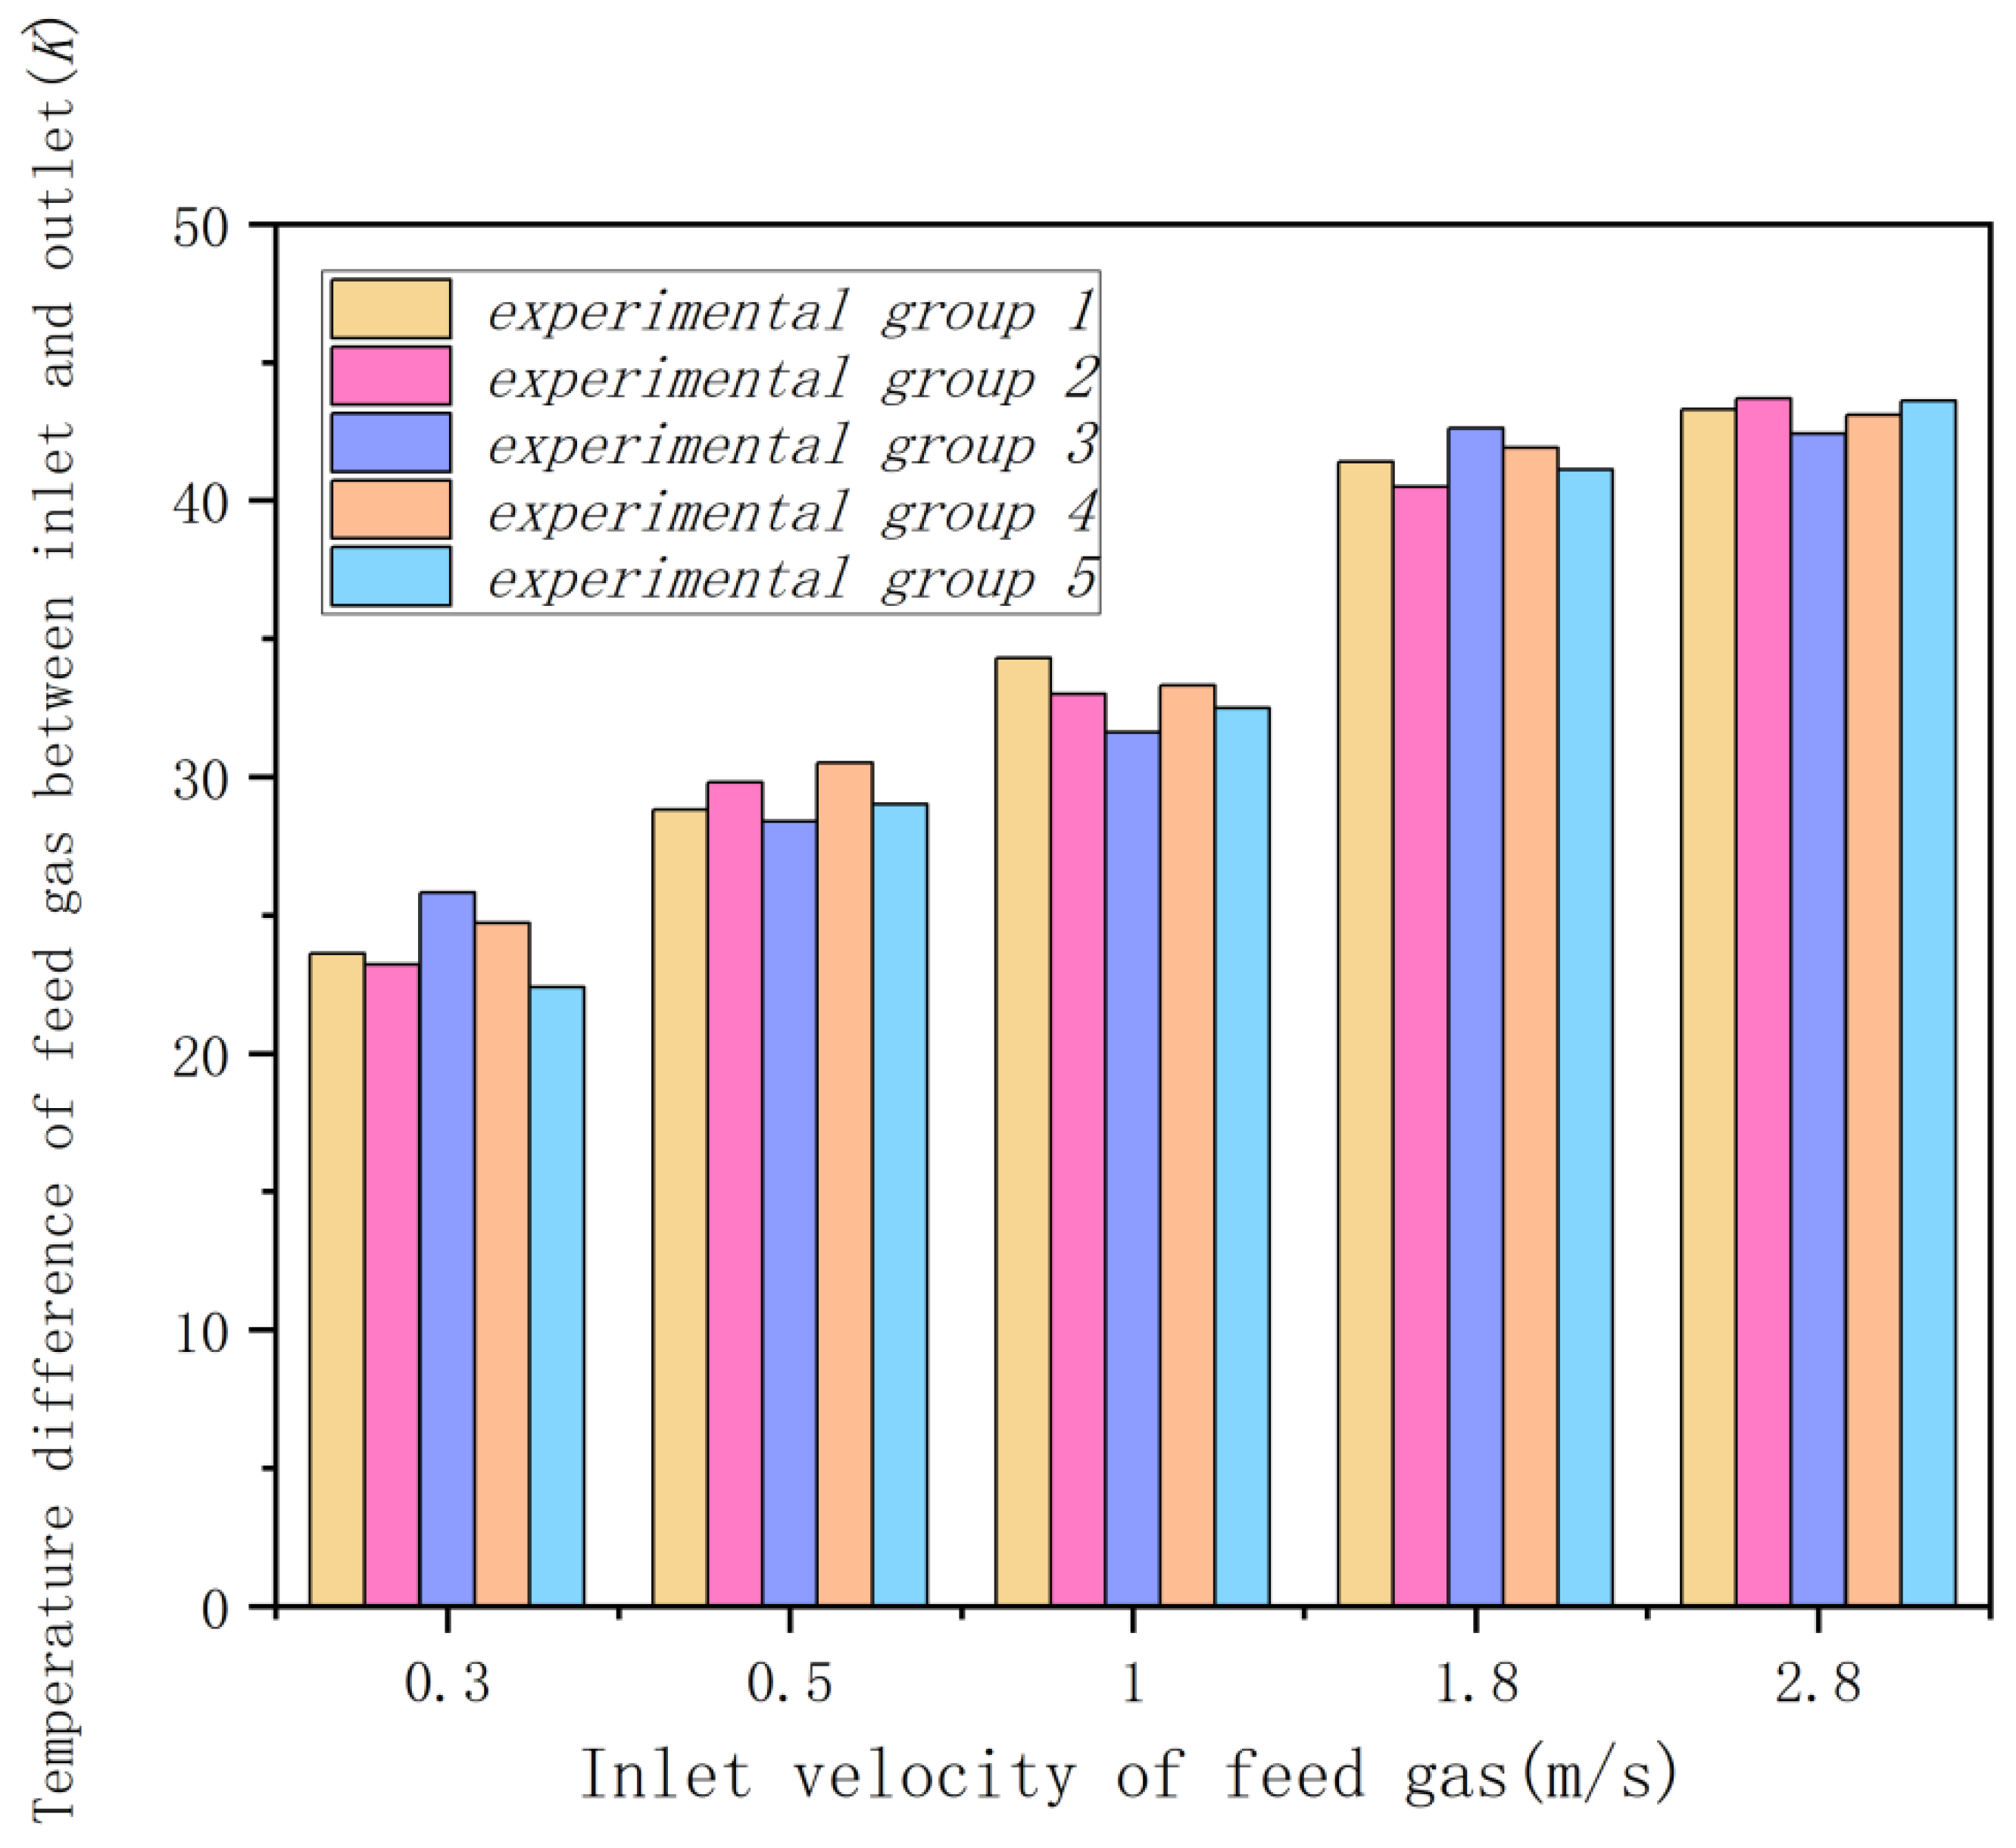
Figure 9.
Variation in ΔTb with different Uin in capillary condensation (Tin=362.17K; Tcool=323K; Wvap,0=20%; time=10mins).
Figure 9.
Variation in ΔTb with different Uin in capillary condensation (Tin=362.17K; Tcool=323K; Wvap,0=20%; time=10mins).
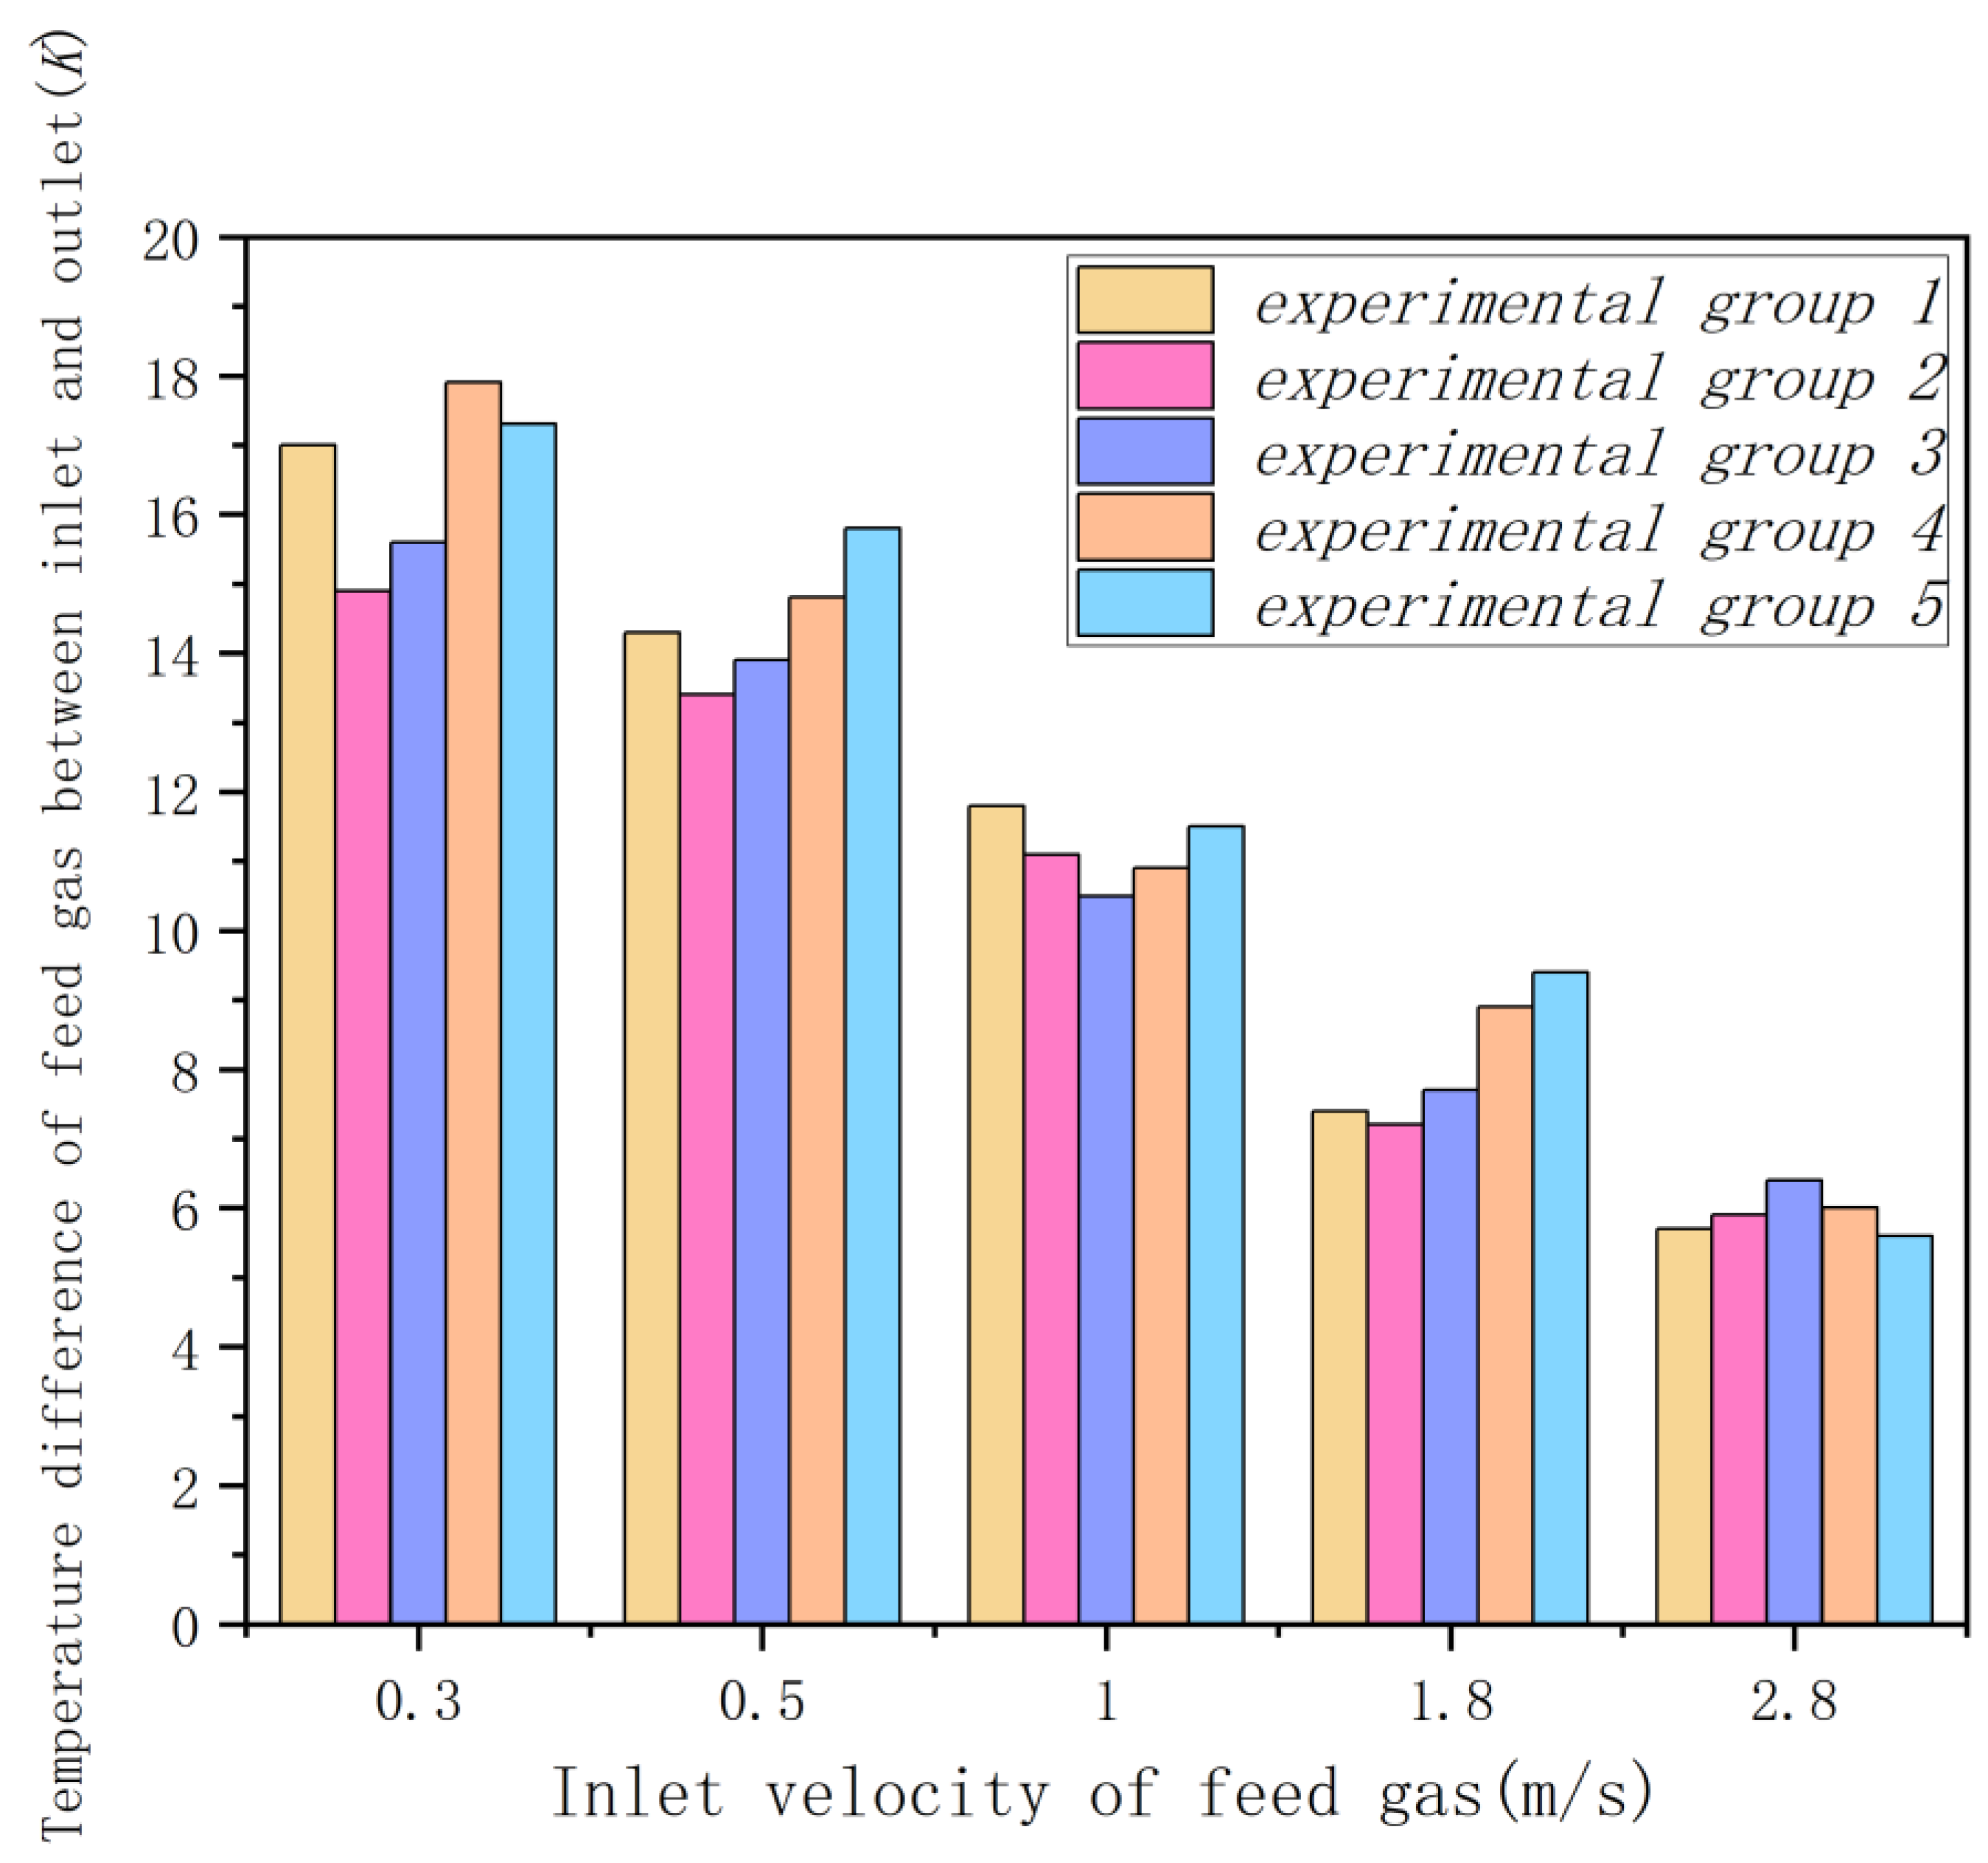
Figure 10.
Variation in mre with different Uin in normal condensation (Tin=362.17K; Tcool=293K; Wvap,0=20%; time=10mins).
Figure 10.
Variation in mre with different Uin in normal condensation (Tin=362.17K; Tcool=293K; Wvap,0=20%; time=10mins).
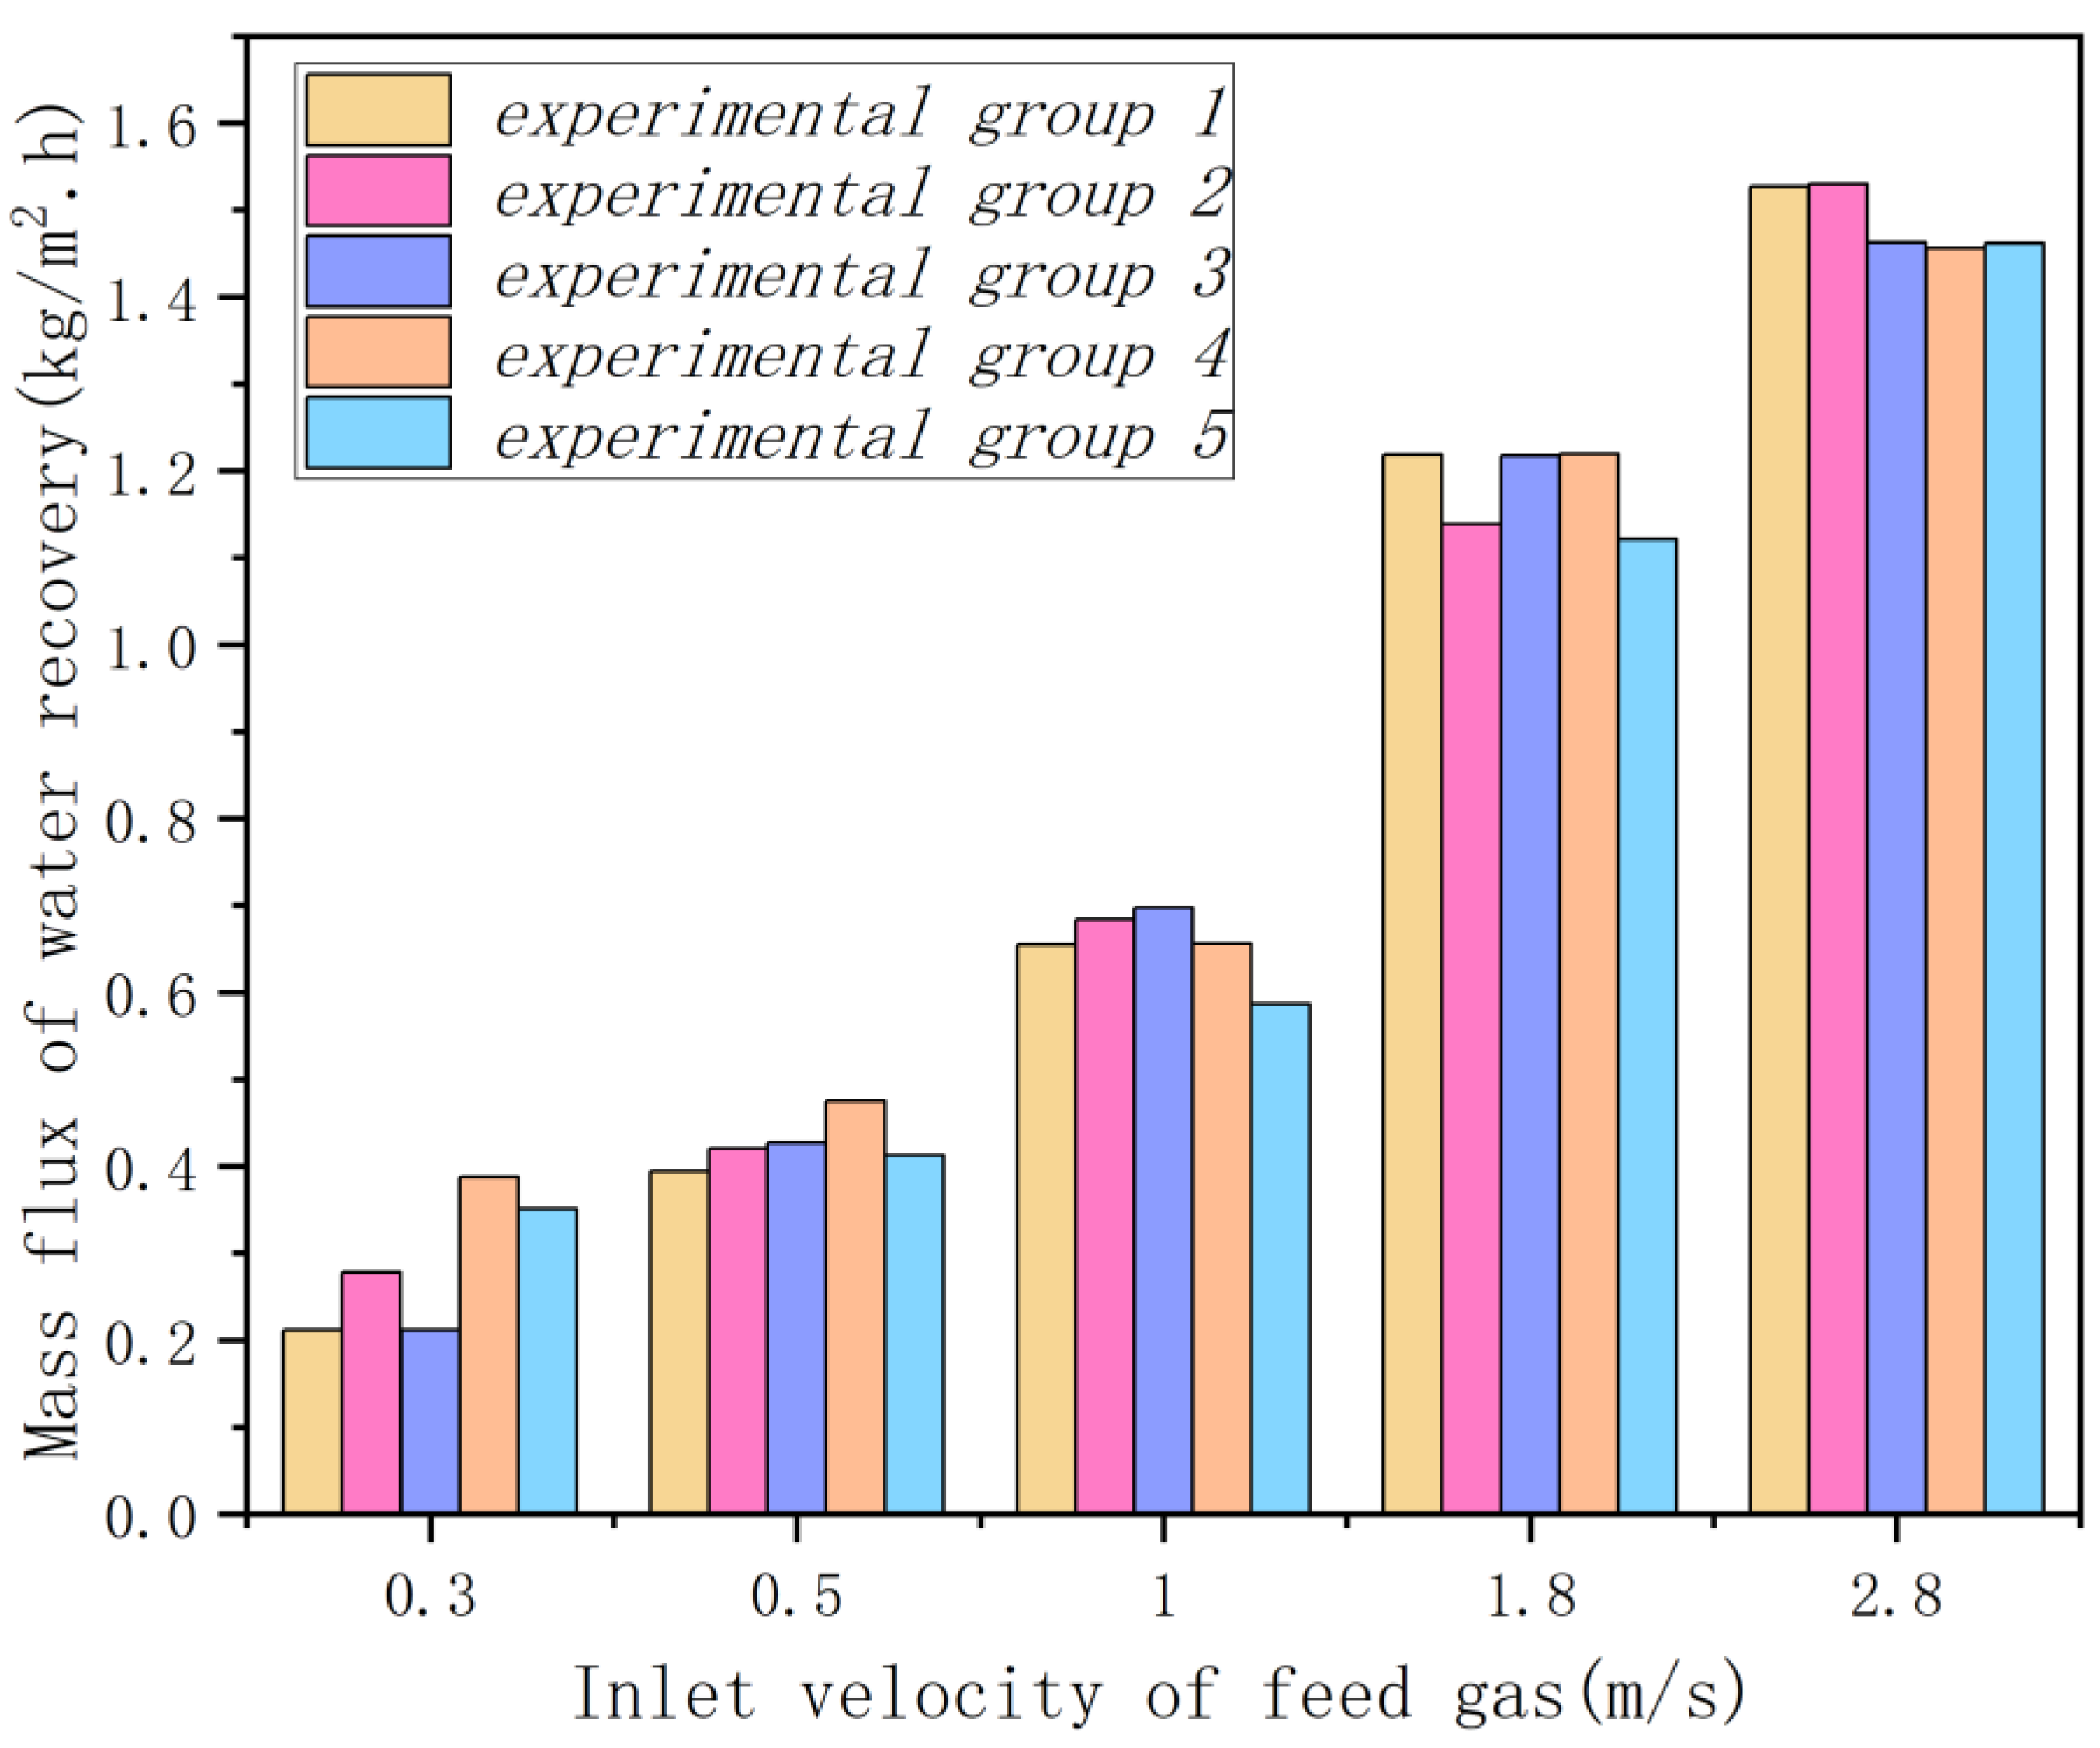
Figure 11.
Variation in mre with different Uin in capillary condensation (Tin=362.17K; Tcool=323K; Wvap,0=20%; time=10mins).
Figure 11.
Variation in mre with different Uin in capillary condensation (Tin=362.17K; Tcool=323K; Wvap,0=20%; time=10mins).
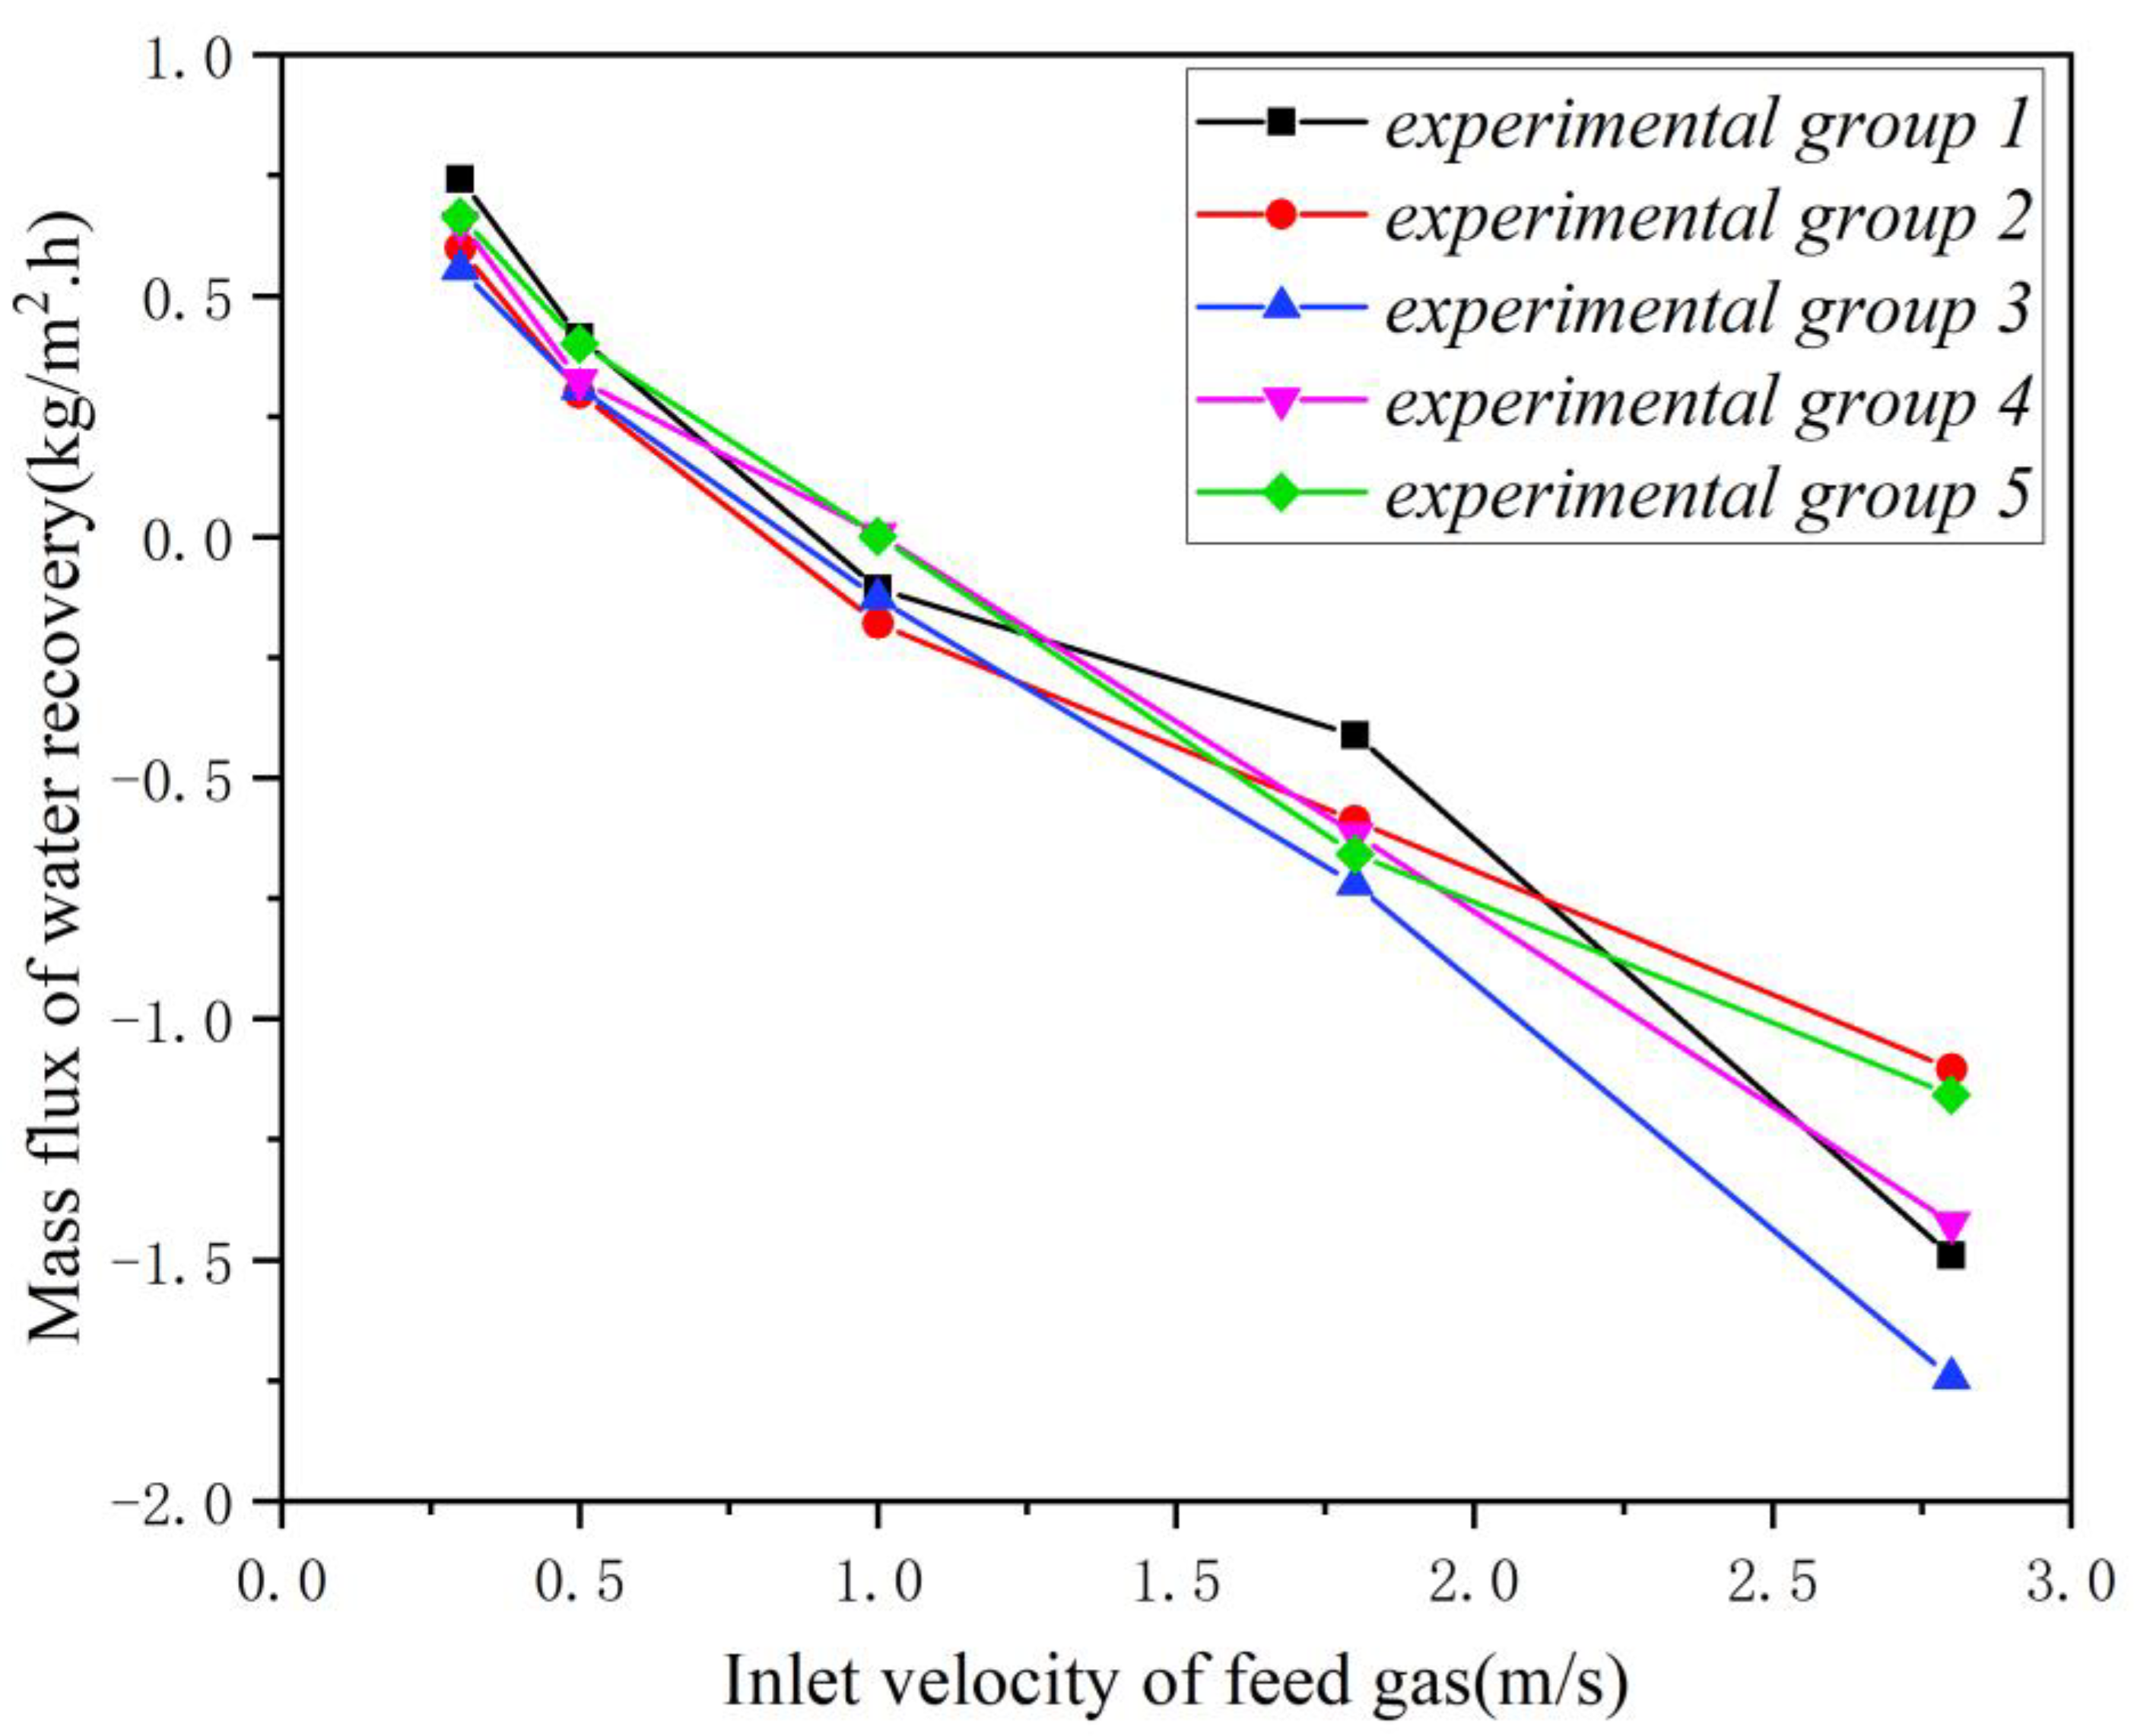
Figure 14.
Variation in Ur with different Uin in normal condensation (Tin=362.17K; Tcool=293K; Wvap,0=20%).
Figure 14.
Variation in Ur with different Uin in normal condensation (Tin=362.17K; Tcool=293K; Wvap,0=20%).
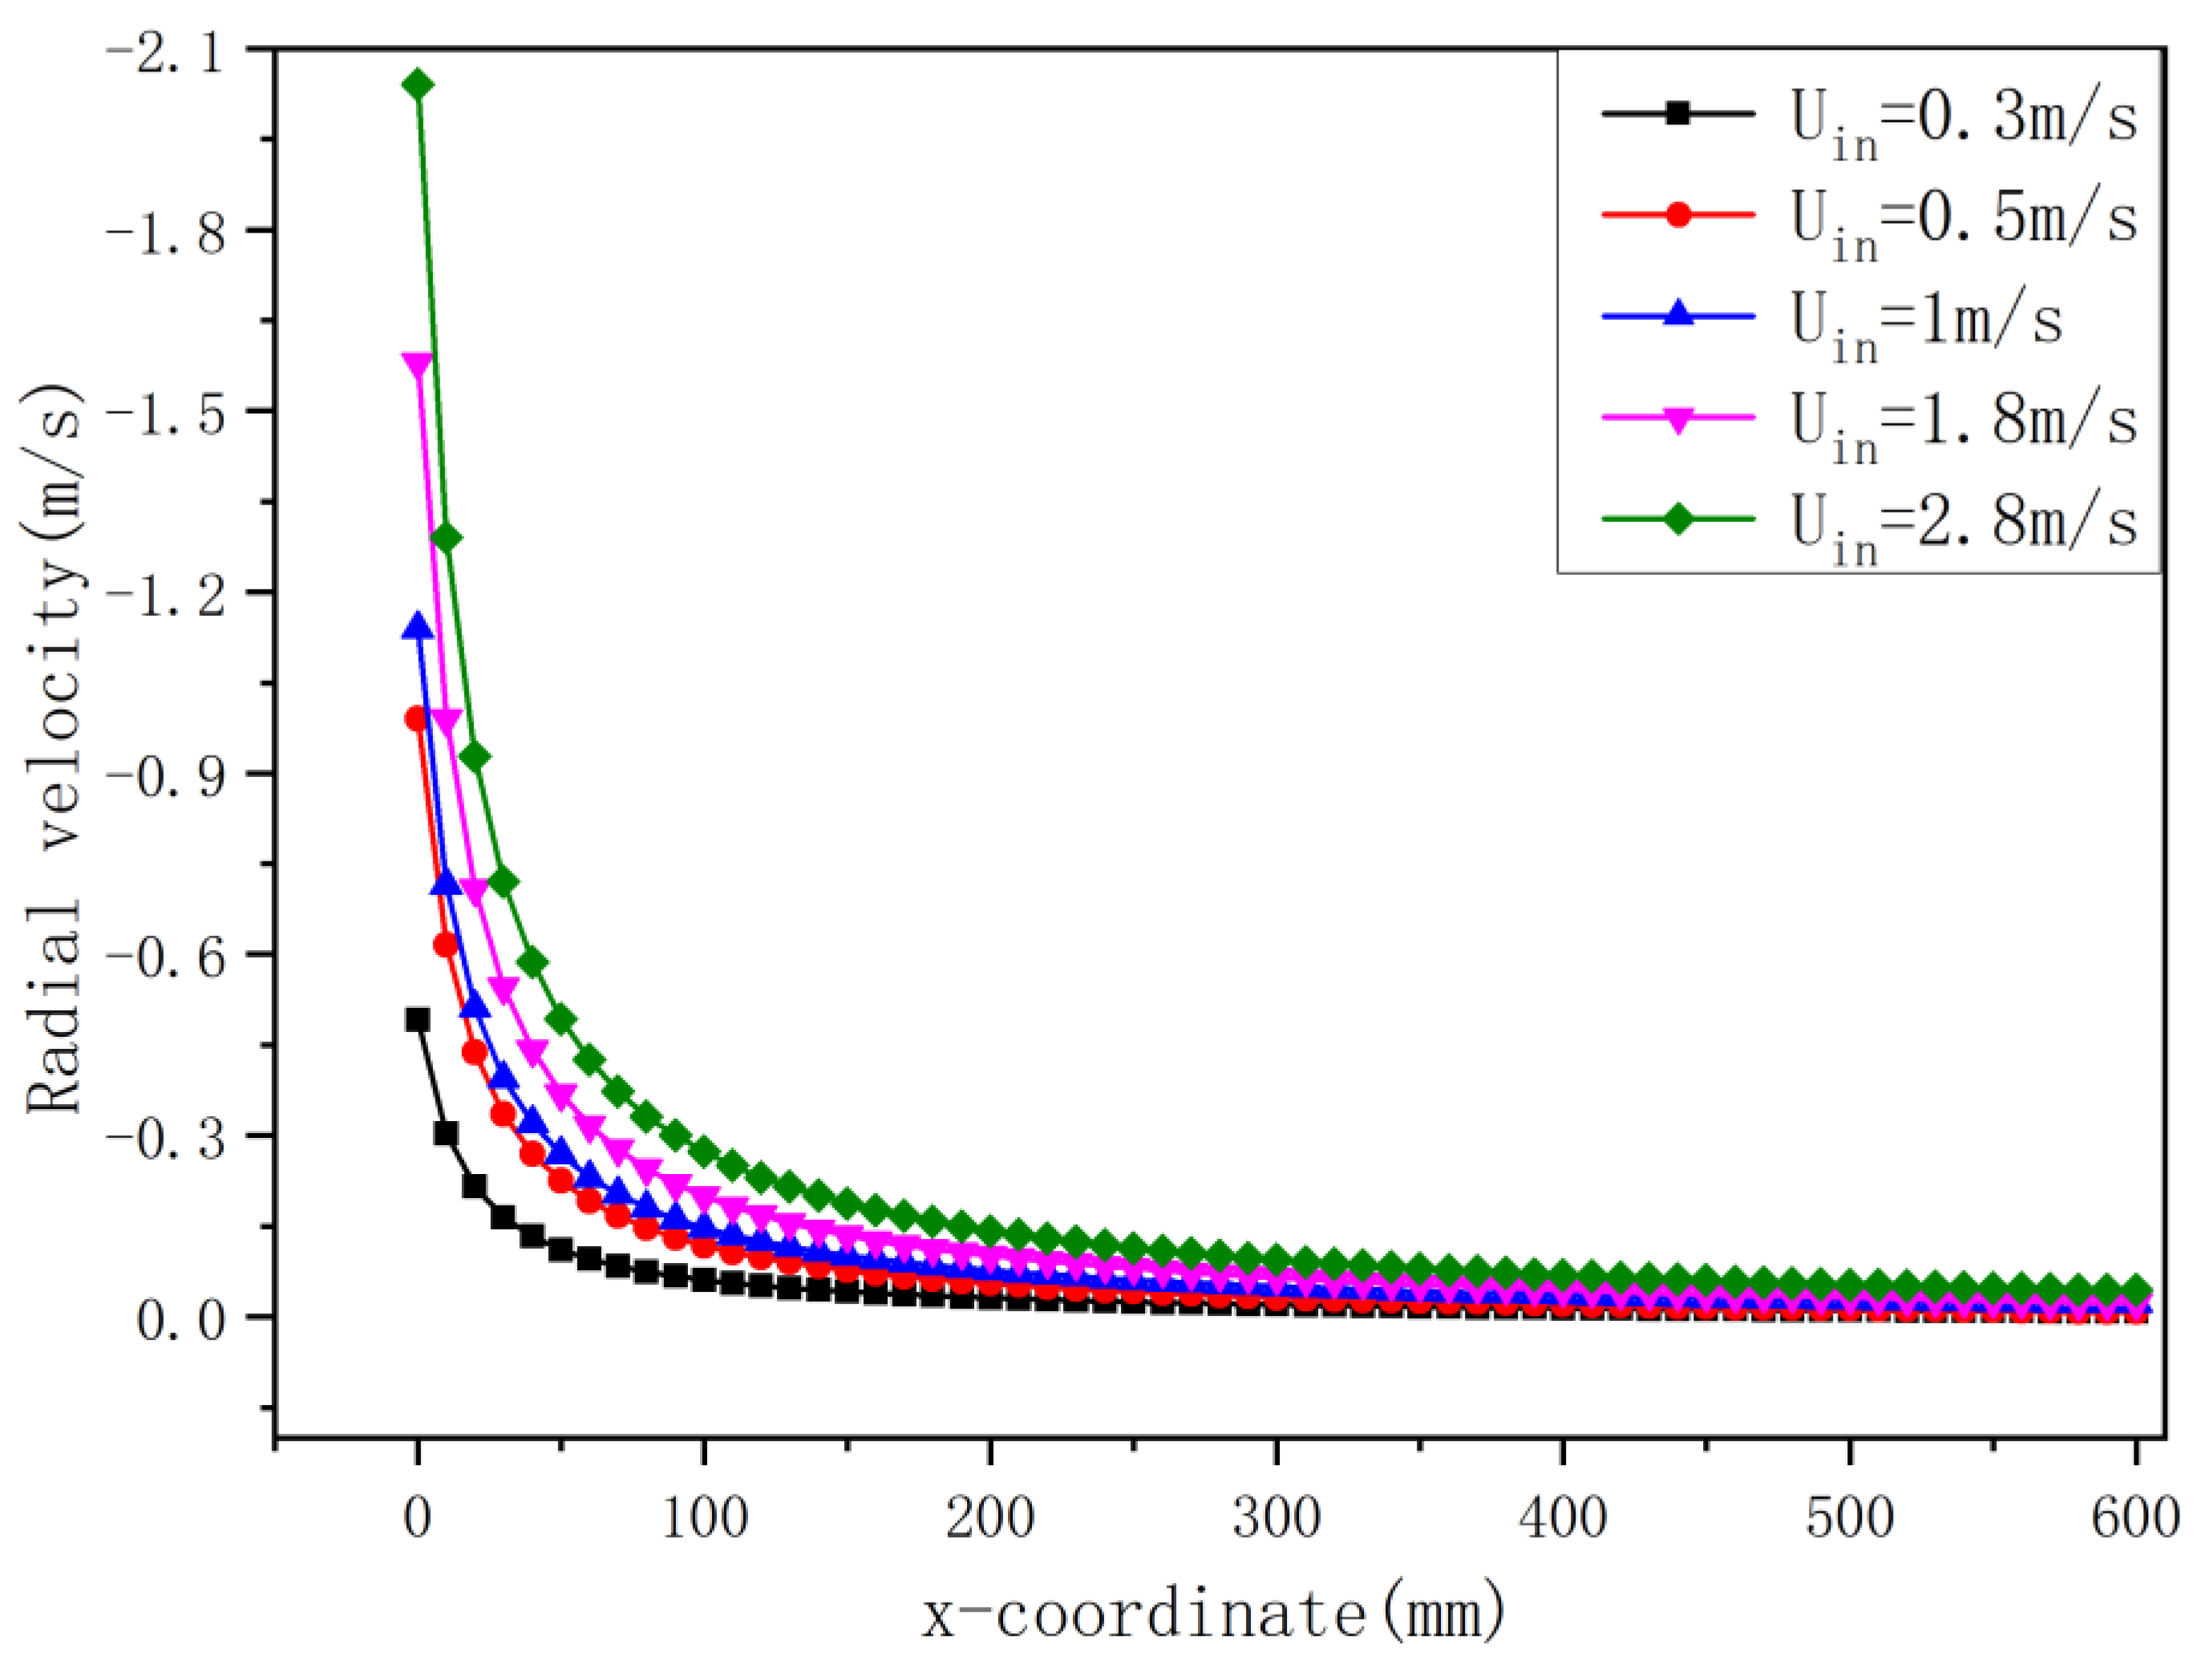
Figure 18.
φa distribution along the Wvap versus time (Tin=371.63 K; Tcool=293K; Uin=1.8m/s).
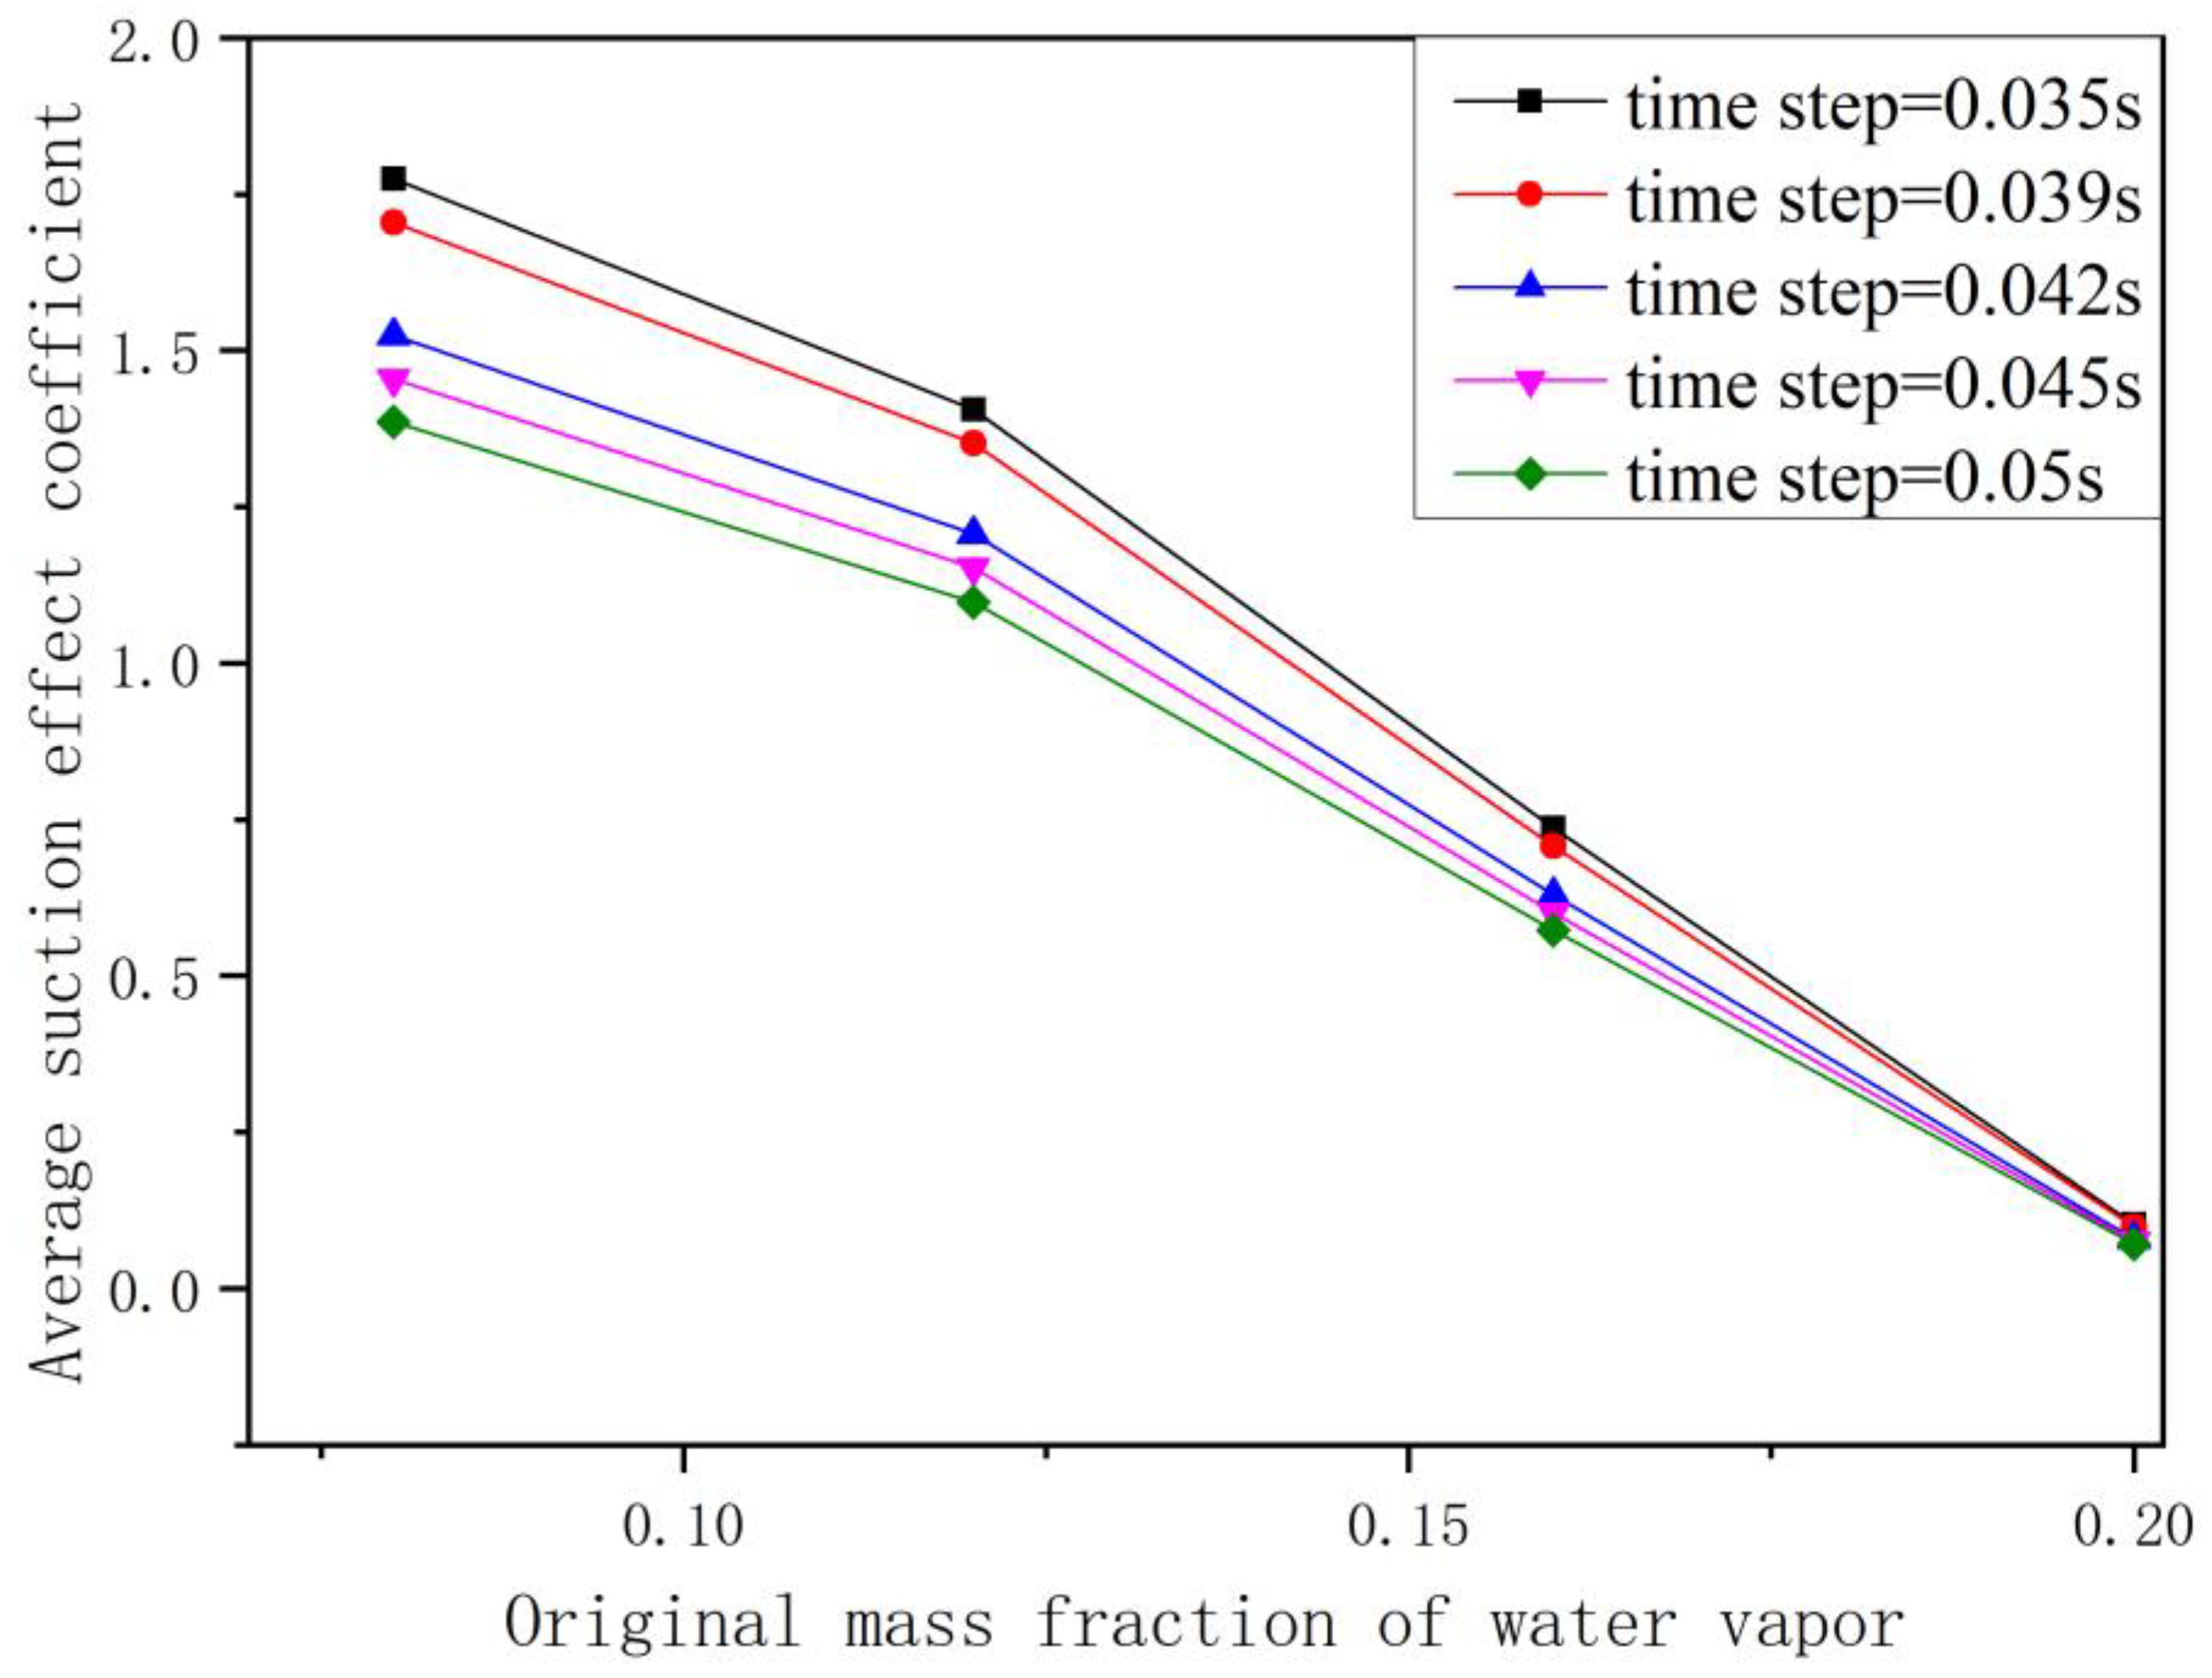
Figure 19.
qc distribution along the ceramic tube versus Tcool (Tin=371.63 K; Uin=1.8m/s; t=3.2s).
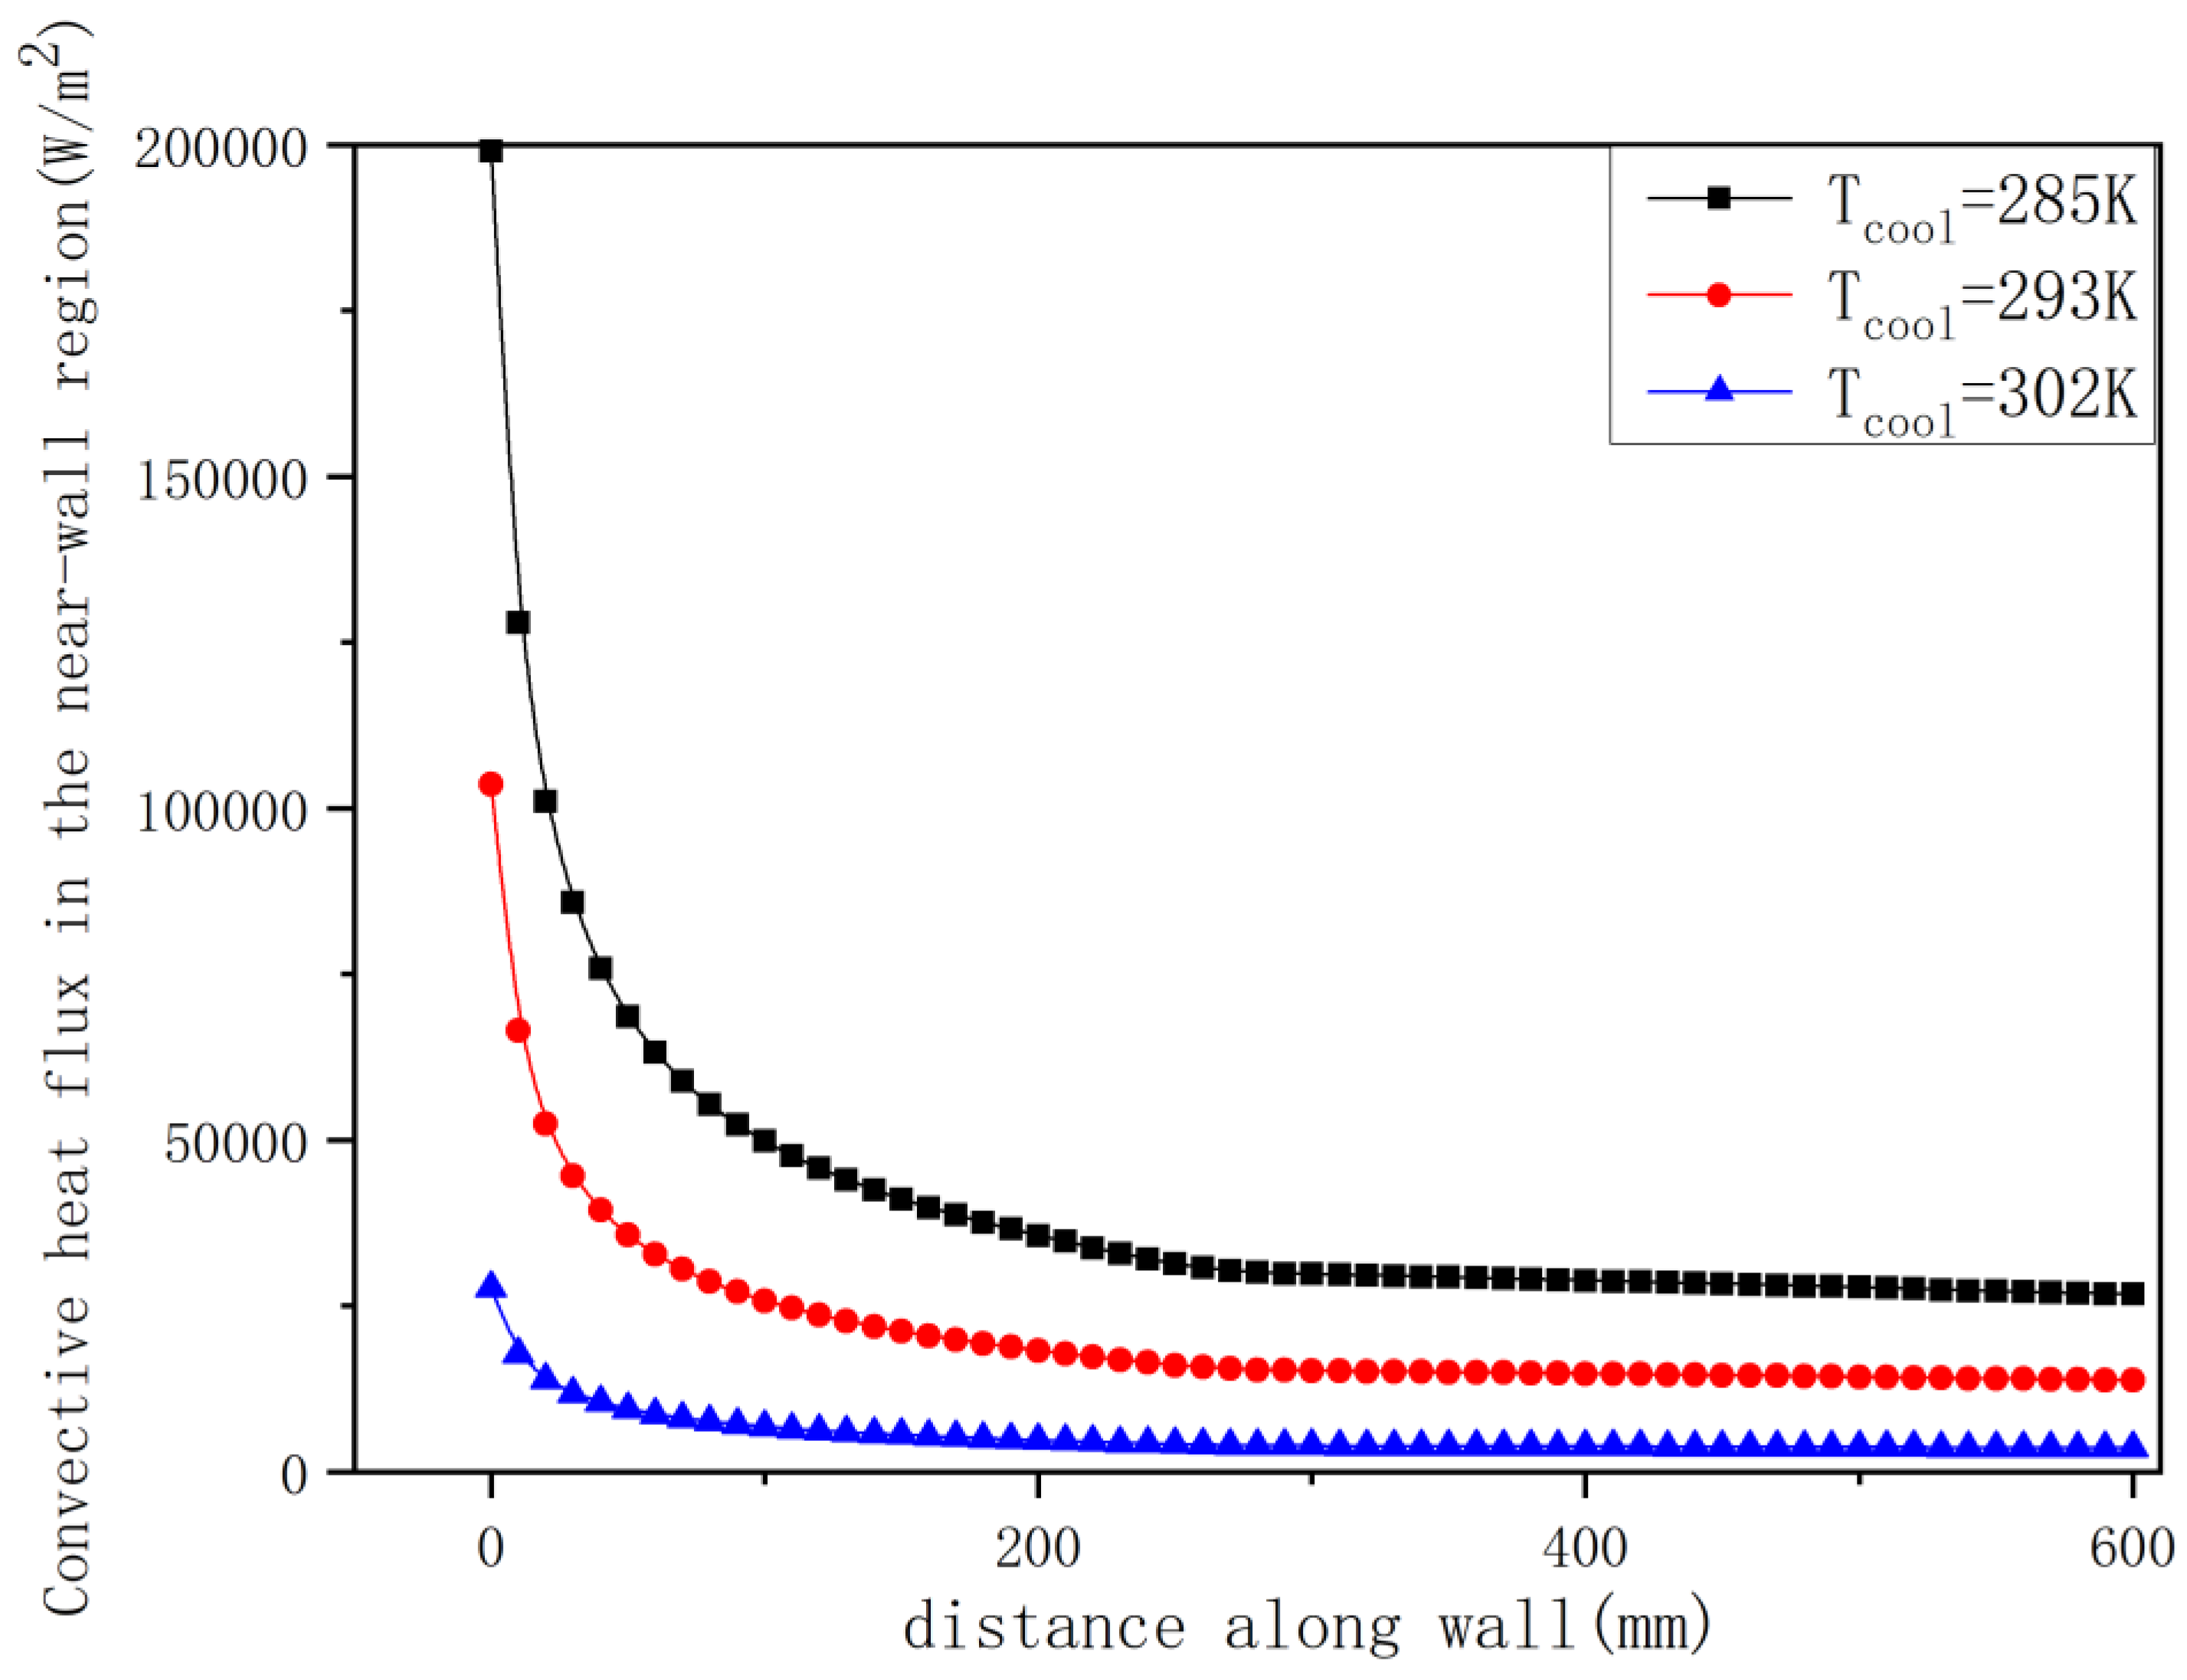
Figure 20.
mcon distribution along the ceramic tube versus Tcool (Tin=371.63 K; Uin=1.8m/s; t=3.2s).
Figure 20.
mcon distribution along the ceramic tube versus Tcool (Tin=371.63 K; Uin=1.8m/s; t=3.2s).
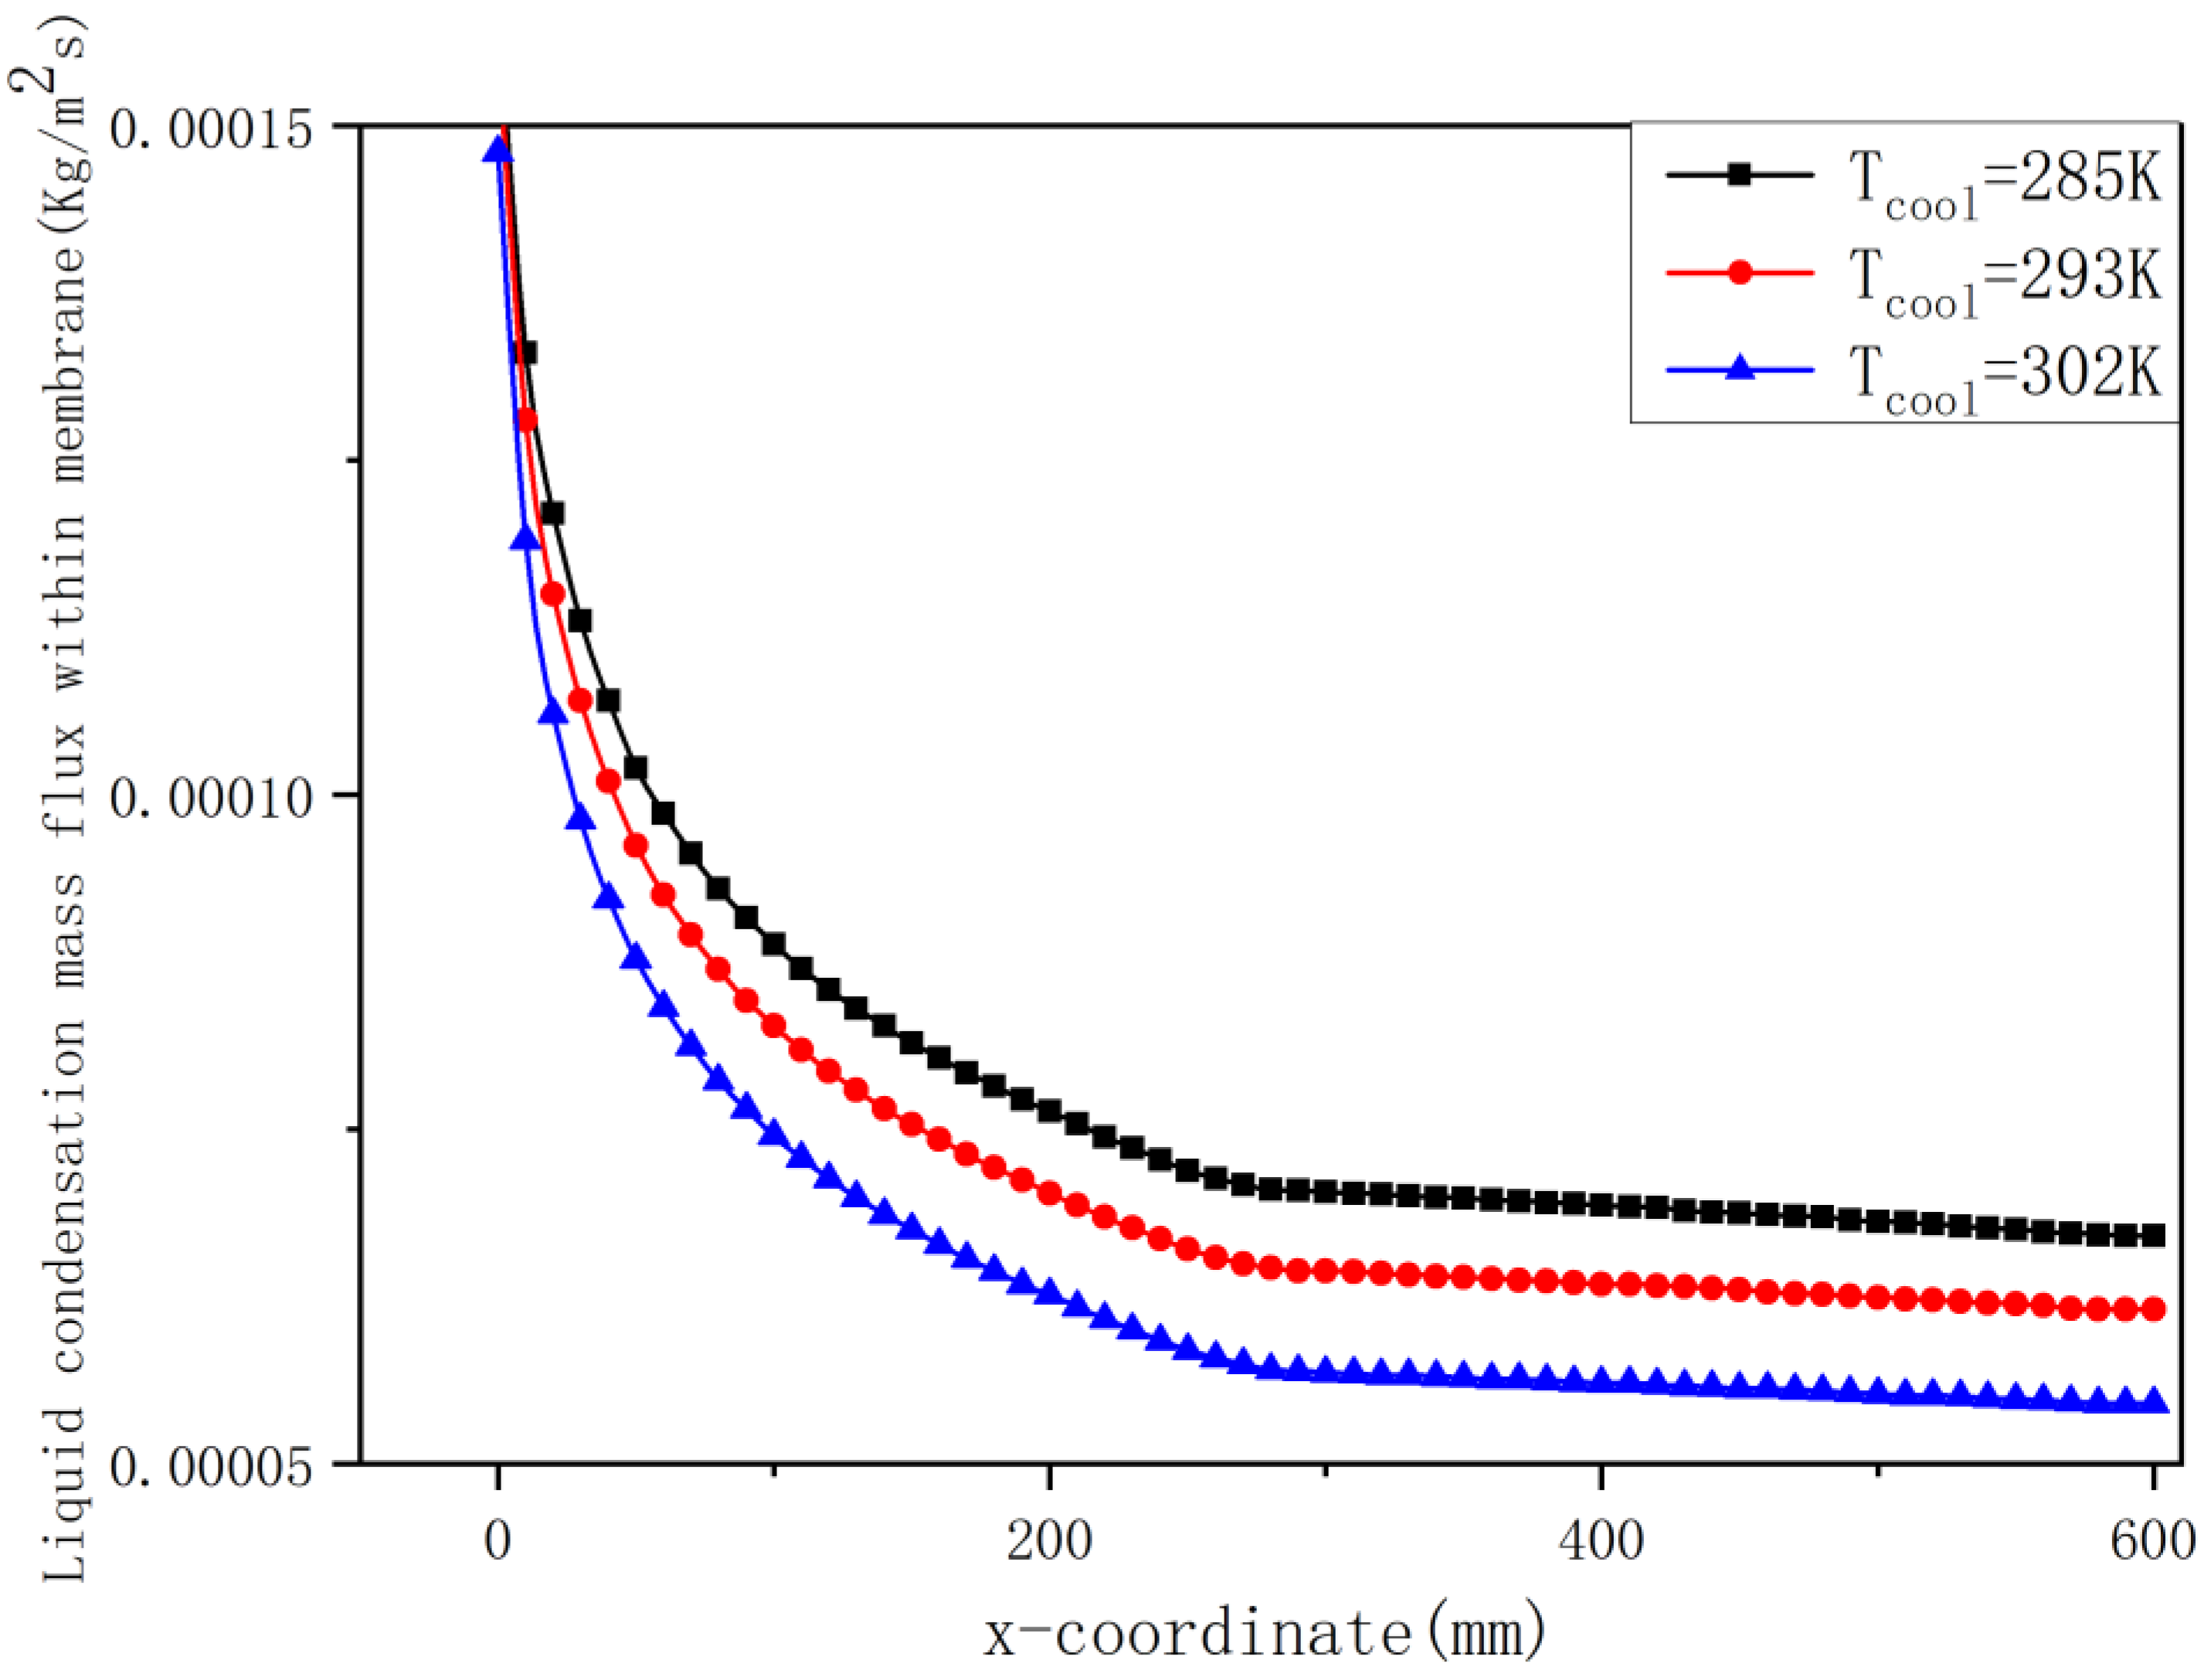
Figure 21.
h distribution along the ceramic tube versus Tcool (Tin=371.63 K; Uin=1.8m/s; time=10mins).
Figure 21.
h distribution along the ceramic tube versus Tcool (Tin=371.63 K; Uin=1.8m/s; time=10mins).
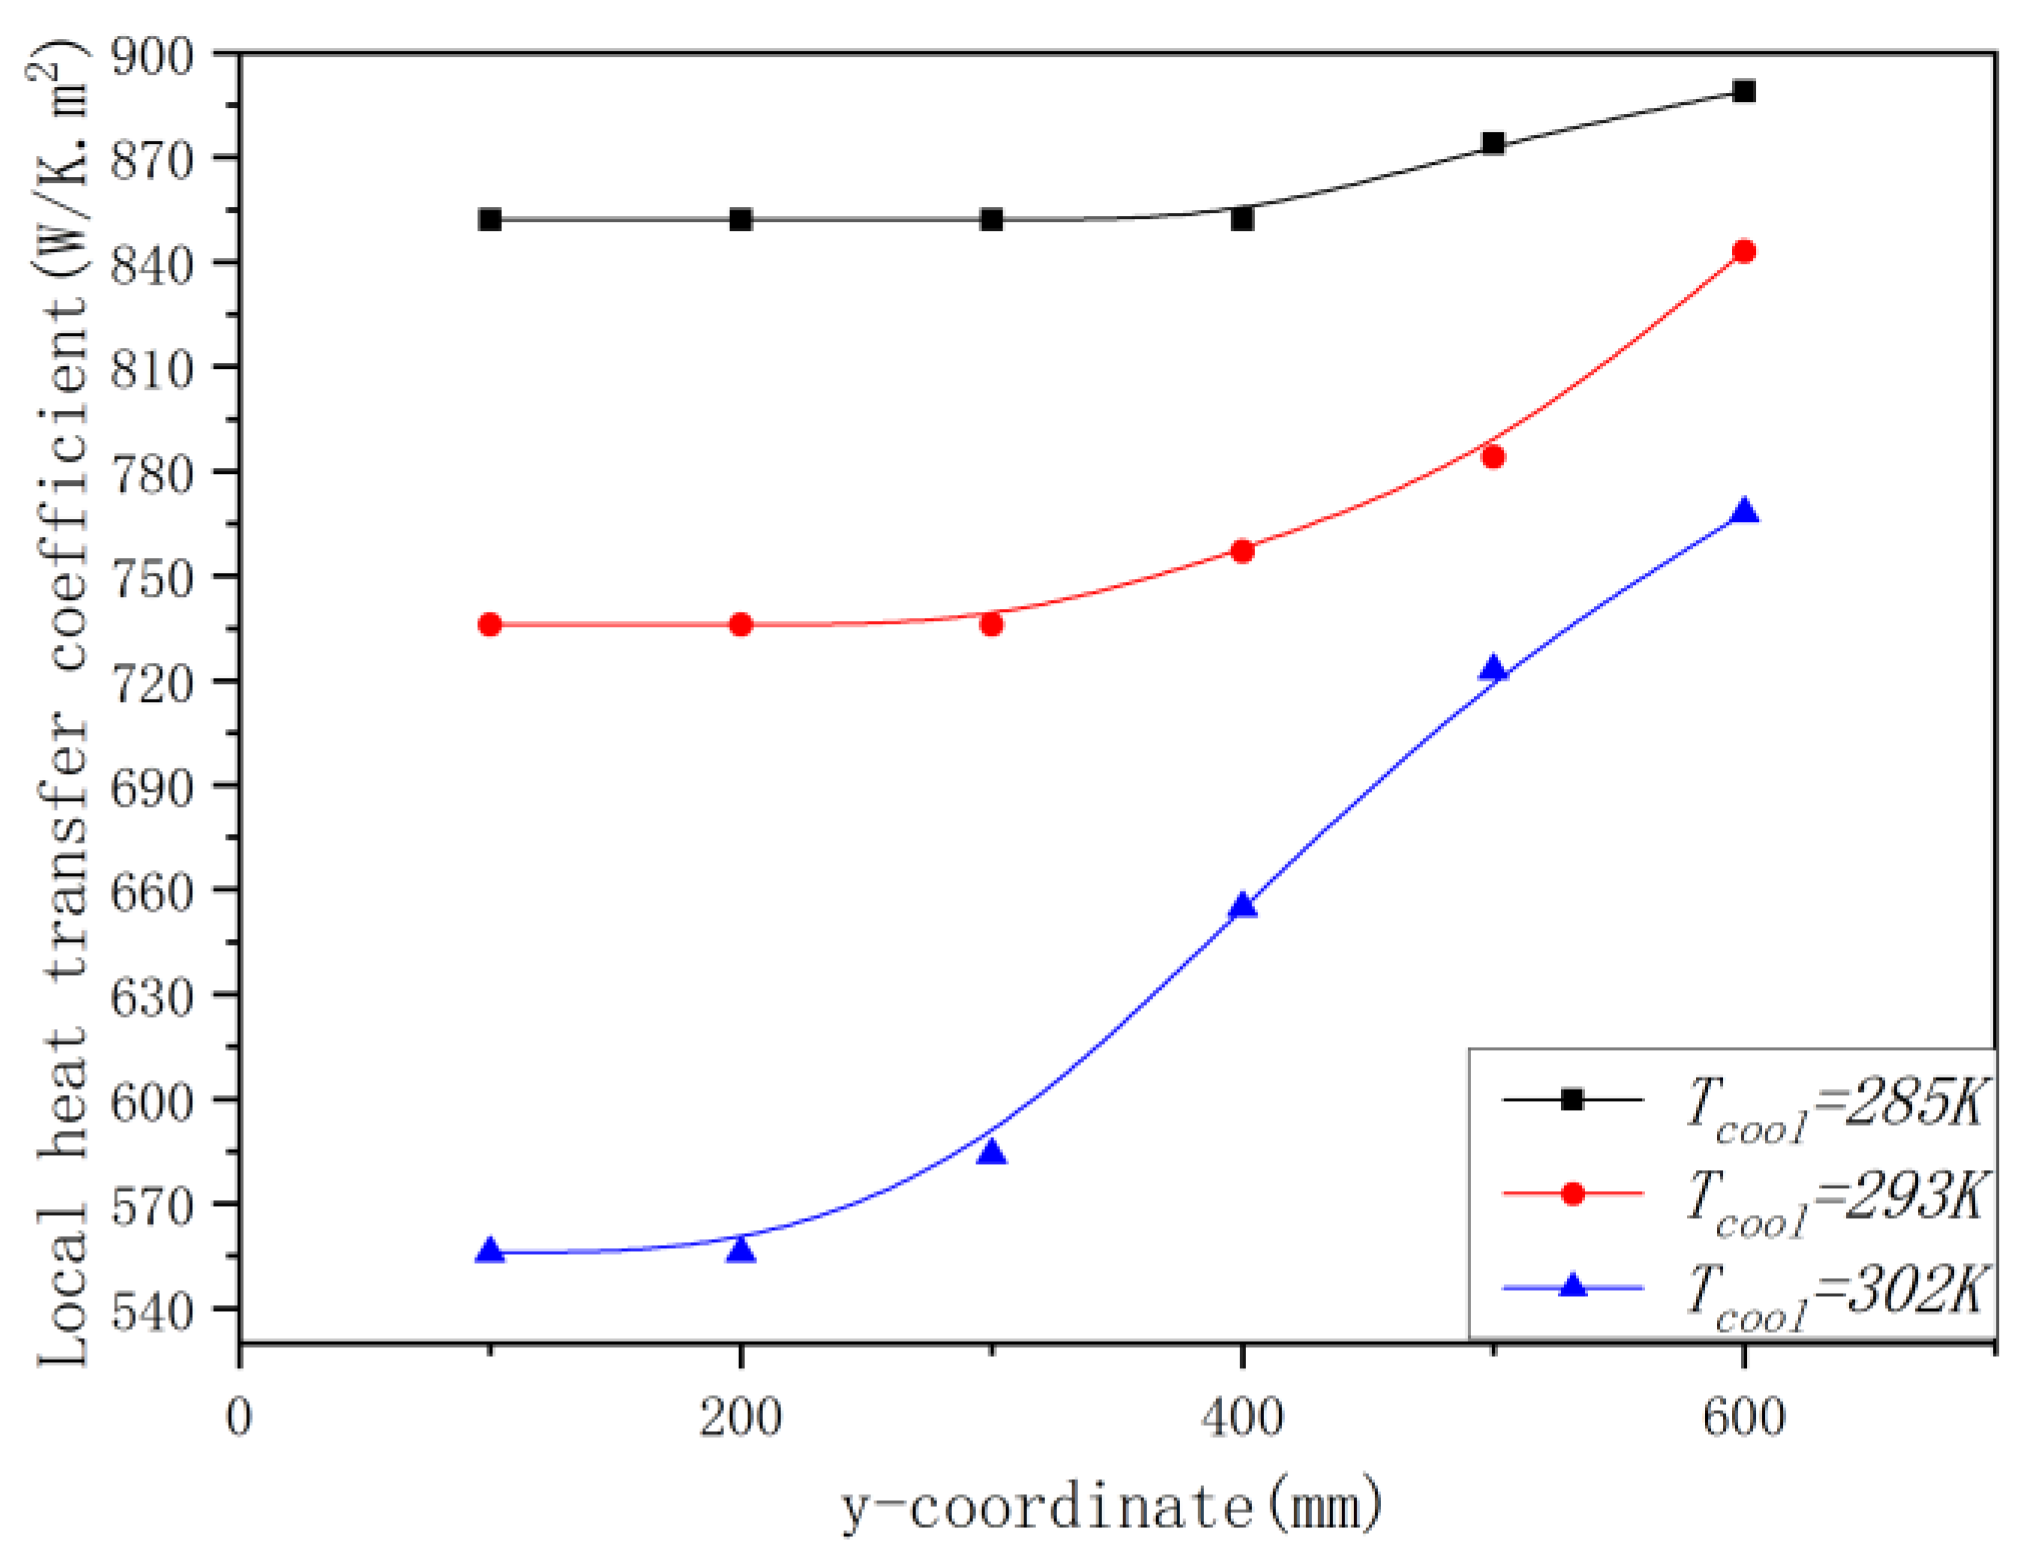

Table 1.
Basic parameters of the TCM.
| Length of tube (mm) | Radius of tube (mm) | Porosity of membrane | Tortuosity of membrane | Thickness of membrane (mm) | Contact angle (º) | Surface tension (N/m) | Diameter of pore in membrane (nm) |
| 600 | 6.02 | 40% | 2.8 | 1.5 | 33.7 | 0.0718 | 20 |
Table 2.
Distinction between the condensing behaviors.
| Normal Condensation | Capillary Condensation | |
| Scale | Macroscopic | Mesoscopic |
| Forming mechanism | Dalton’s Law of Partial Pressures | Laplace Law |
| Forming zone | Wetting surface on membrane wall | Porous zone within membrane |
Table 3.
Source terms of equations.
| Source term name | Expression |
|
Continuity equation source term |
(if Tvap>Tsat , pvap<psat) (if Tvap<Tsat) |
|
Species of vapor equation source term |
(if Tvap>Tsat , pvap<psat) (if Tvap<Tsat) |
|
Energy conservation equation source term |
(if Tvap>Tsat , pvap<psat) (if Tvap<Tsat) |
| Momentum conservation equation source term |
|
Table 4.
Operational and geometric conditions.
| Parameters | Basic value | Range |
| Velocity of gas mixture (m/s) | 0.3, 0.5, 1, 1.8, 2.8 | 0.3~2.8 |
| Tin (K) | 362.17 | NA |
| Tcool (K) | 293, 302, 313, 323 | 293~323 |
| Length of ceramic tube (mm) | 600 | NA |
| Inner diameter of ceramic tube (mm) | 12.04 | NA |
| Thickness of membrane (mm) | 1.5 | NA |
| Mean diameter of pores in membrane (nm) | 20 | NA |
| Porosity | 40% | NA |
| Tortuosity | 2.084 | NA |
| Vapor mass fraction | 7.5%, 9%, 12%, 16%, 20% | 7.5%~20% |
| Saturated pressure (Mpa) | 0.103, 0.131 | 0.103~0.131 |
| Saturated temperature (K) | 315.29, 336.17 | 315.29~336.17 |
Disclaimer/Publisher’s Note: The statements, opinions and data contained in all publications are solely those of the individual author(s) and contributor(s) and not of MDPI and/or the editor(s). MDPI and/or the editor(s) disclaim responsibility for any injury to people or property resulting from any ideas, methods, instructions or products referred to in the content. |
© 2026 by the authors. Licensee MDPI, Basel, Switzerland. This article is an open access article distributed under the terms and conditions of the Creative Commons Attribution (CC BY) license (http://creativecommons.org/licenses/by/4.0/).
Copyright: This open access article is published under a Creative Commons CC BY 4.0 license, which permit the free download, distribution, and reuse, provided that the author and preprint are cited in any reuse.