Submitted:
26 March 2026
Posted:
31 March 2026
You are already at the latest version
Abstract
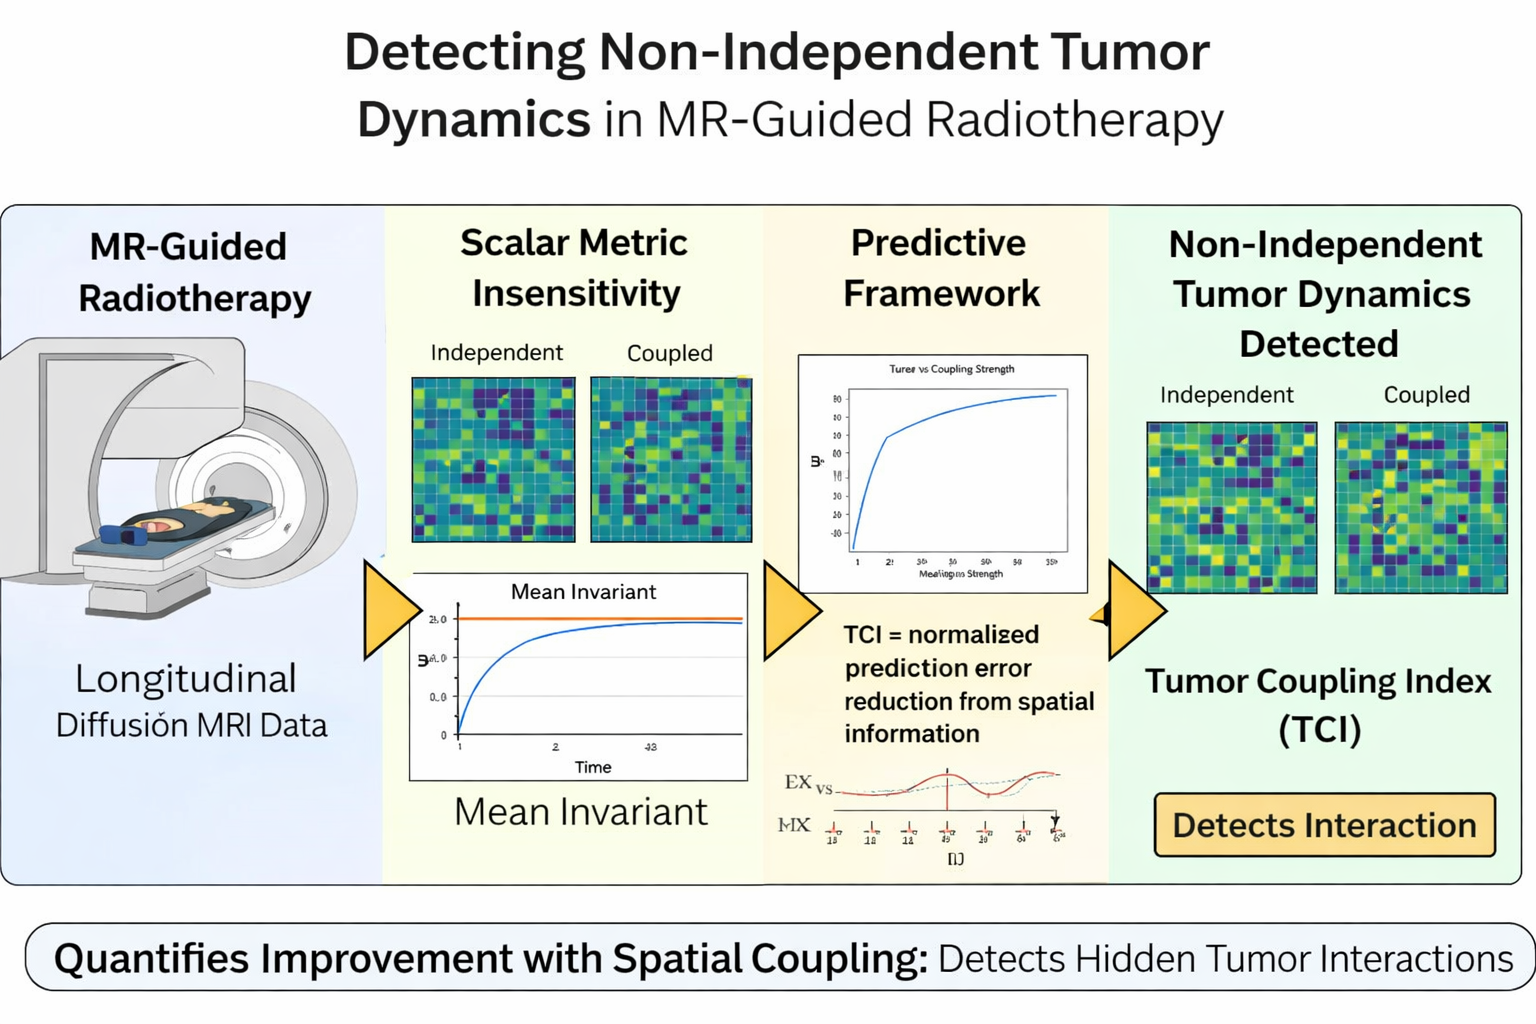
Radiotherapy response assessment commonly relies on scalar imaging metrics that may fail to capture spatially structured tumor dynamics. When tumor regions interact, such measures can obscure underlying coordination. We introduce a predictive framework to detect non-independent dynamics from longitudinal imaging data. The approach quantifies predictive improvement from spatial information using the Tumor Coupling Index (TCI), defined as the normalized reduction in prediction error between independent and spatial models. Simulations show that TCI remains near zero under independence, increases with spatial coupling, and collapses under randomization, demonstrating sensitivity and falsifiability. In contrast, conventional scalar metrics are insensitive to such structure. TCI provides a model-agnostic observable of non-independent tumor behavior, offering a principled approach for analyzing longitudinal imaging and potential applications in adaptive radiotherapy.
Keywords:
radiotherapy
; MR-Linac
; tumor dynamics
; spatial coupling
; predictive modeling
; diffusion MRI
; ADC
; dynamical systems
1. Introduction
1.1. Background and Motivation
Radiotherapy response assessment increasingly leverages quantitative imaging, particularly diffusion-weighted MRI and derived metrics such as the apparent diffusion coefficient (ADC), to monitor tumor evolution during treatment (Koh & Collins, 2007; Padhani et al., 2009). The emergence of MR-guided radiotherapy platforms (MR-Linac) enables repeated, high-resolution imaging throughout treatment, providing access to longitudinal, voxel-level data within routine clinical workflows (Lagendijk, 2014; Mutic & Dempsey, 2014; Raaymakers et al., 2017).
Despite this increase in data richness, clinical assessment remains largely based on scalar summaries, including mean ADC, volumetric measurements, or simple voxel-wise comparisons. These approaches reduce spatially distributed tumor behavior to aggregate quantities and implicitly assume that tumor regions evolve independently or that spatial heterogeneity can be adequately captured through aggregation (Padhani et al., 2009).
However, tumors are inherently spatially structured and interacting systems. Their evolution is shaped by heterogeneous vascularization, oxygen gradients, intercellular signaling, and mechanical constraints (Jain, 1987; Gatenby & Gillies, 2009; Greaves & Maley, 2012). Mathematical models of tumor growth and treatment response have long incorporated such effects through diffusion-like coupling and spatial interaction terms (Swanson et al., 2003; Enderling et al., 2014; Rockne et al., 2010; Hormuth et al., 2018). In these frameworks, coupling governs how information and influence propagate across the tumor and is essential for reproducing observed spatial patterns. Moreover, a few recent developments such as Rajan (2026), Mora & Bialek (2025), Pigozzi et al. (2026) imply that tumors may be best understood as adaptive, integrated dynamical systems, whose response to radiotherapy might depend not only on dose and intrinsic sensitivity, but also on history, interaction, and emergent organization.
1.2. Limitations of Existing Approaches
Despite their importance, spatial interaction parameters have not translated into clinical practice. A key limitation is that such parameters are typically not directly observable from imaging data. Instead, they are inferred through model fitting procedures that depend on strong assumptions regarding model structure, boundary conditions, and noise characteristics (O’Connor et al., 2017). These inverse problems are often ill-posed, sensitive to data quality, and difficult to validate in clinical settings.
At the same time, conventional imaging metrics are fundamentally limited in their ability to capture interaction. Scalar summaries compress spatial information, and even voxel-wise analyses typically treat locations independently. As a result, tumors with fundamentally different internal dynamics—independent versus strongly coupled—may exhibit similar aggregate trajectories.
This limitation is not only practical but also theoretical: for a broad class of spatially coupled systems, interaction terms do not influence global averages. Consequently, spatial coupling may remain unidentifiable from commonly used biomarkers, even when it plays a central role in tumor behavior.
This creates a critical gap between:
- mechanistic models, which explicitly incorporate interaction but are difficult to validate
- clinical metrics, which are robust but insensitive to spatial structure
1.3. A Predictive Perspective on Tumor Dynamics
To address this gap, we adopt a different perspective based on predictive observability.
The central idea is:
If tumor regions interact, then incorporating spatial information should improve prediction of future voxel states.
Rather than attempting to estimate unobservable parameters, we focus on the observable consequences of interaction. Specifically, we evaluate whether predictive performance improves when additional information—such as neighboring voxel values—is included.
This perspective is consistent with broader statistical and information-theoretic approaches in which structure is inferred through improvements in prediction (Granger, 1969; Schreiber, 2000). It shifts the problem from:
- modeling what generates the data
- to measuring what can be predicted from the data
Such an approach avoids strong mechanistic assumptions while remaining grounded in measurable quantities derived directly from imaging.
1.4. Contribution of This Work
We introduce a framework for detecting non-independent tumor dynamics based on predictive gain, quantified through the Tumor Coupling Index (TCI). The key contributions are:
-
Observable-based formulation:Spatial interaction is defined operationally through improvement in predictive performance rather than through explicit parameter estimation.
-
Quantitative metric:The Tumor Coupling Index provides a normalized measure of predictive gain attributable to spatial information.
-
Theoretical insight:We demonstrate that commonly used scalar metrics are inherently insensitive to spatial coupling, establishing a fundamental identifiability limitation.
-
Falsifiability:The framework is constructed such that the metric returns near-zero values under independent or randomized conditions, ensuring that detected structure is not spurious.
-
Simulation-based validation:Controlled experiments confirm that the proposed metric distinguishes independent and coupled systems and varies systematically with coupling strength.
1.5. Scope and Positioning
This work does not aim to identify specific biological mechanisms or estimate model parameters. Instead, it provides a minimal, model-agnostic method for detecting structured dynamics from longitudinal imaging data.
The proposed framework is intended to complement existing approaches by introducing interaction as an observable dimension of tumor response, alongside magnitude and dispersion.
1.6. Structure of the Paper
The remainder of the paper is organized as follows:
2. Theoretical Framework
2.1. Tumor as a Spatially Distributed Dynamical System
We consider a tumor observed through longitudinal MR-guided radiotherapy imaging as a discretized spatial system composed of voxels. Each voxel represents a localized tissue region characterized by an imaging-derived signal (e.g., apparent diffusion coefficient).
Let:
denote the observed signal at voxel at time . The full tumor state is given by:
The central question is whether the evolution of reflects independent voxel dynamics or spatially coupled behavior.
2.2. Baseline Model: Independent Tumor Dynamics
As a reference, we define a model in which each voxel evolves independently according to first-order relaxation dynamics:
where:
- is the equilibrium value
- is the local response rate
This formulation captures generic treatment response dynamics and assumes:
- no interaction between voxels
- purely local evolution
2.3. Spatially Coupled Dynamics
To incorporate interaction, we introduce a spatial coupling term:
where:
- is the coupling strength
- denotes neighboring voxels
The coupling term corresponds to a discrete Laplacian operator and induces:
- local smoothing
- information propagation across the tumor
2.4. Identifiability Limitation of Scalar Metrics
A commonly used clinical observable is the mean tumor signal:
Taking the time derivative and substituting the coupled dynamics:
The spatial coupling term cancels due to pairwise symmetry:
Key Result
Implication
Two systems with:
- identical local dynamics
- different spatial coupling
produce identical mean trajectories.
Therefore, spatial interaction is not identifiable from scalar summaries such as mean ADC.
2.5. From Identifiability to Observability
Although spatial coupling is not identifiable through aggregated measures, it affects how information propagates across space and time.
If , then:
depends not only on , but also on neighboring values.
This introduces predictive structure.
2.6. Predictive Observability Framework
We define a hierarchy of predictive models:
Independent model:
Spatial model:
Let prediction errors be:
2.7. Definition of Tumor Coupling Index (TCI)
We define:
Interpretation
- : independent dynamics
- : predictive gain → spatial interaction
2.8. Falsifiability
A valid observable must not produce false positives.
Under independence:
If structure is destroyed (e.g., shuffling):
2.9. Conceptual Synthesis
This framework establishes a shift:
- from estimating unobservable coupling parameters
- to measuring observable predictive consequences of interaction
Thus:
Spatial coupling becomes observable through predictive gain, even when it is not identifiable through conventional metrics.
3. Methods
3.1. Overview
The proposed framework detects non-independent tumor dynamics by evaluating improvements in predictive performance across a hierarchy of models with increasing dependency structure. The central idea is that if spatial or temporal dependencies exist, models incorporating such information will yield lower prediction error.
This section describes the simulation model, predictive modeling approach, definition of the Tumor Coupling Index (TCI), and evaluation procedures.
3.2. Simulation of Tumor Dynamics
To evaluate the framework under controlled conditions, tumor dynamics were simulated on a two-dimensional spatial grid representing discretized tumor voxels.
Let denote the signal at voxel and time . The system evolves according to:
where:
- controls decay (e.g., treatment effect)
- controls spatial coupling strength
- controls temporal dependence
- is a latent memory variable
- represents noise
- denotes the set of neighboring voxels
Simulations were performed on a regular grid (typically 25–50 × 25–50 voxels) over 80–100 time steps.
3.3. Simulation Scenarios
Four regimes were considered to isolate different forms of dependency:
- Independent:
- Temporal-only:
- Spatial-only:
- Combined:
These scenarios allow controlled evaluation of the framework’s sensitivity and specificity to different types of structure.
3.4. Data Preparation
For each simulation, voxel-level time series were extracted and used to construct supervised prediction datasets. For each voxel and time , the target variable is:
Predictor variables were constructed based on model class:
- Independent model:
- Temporal model:
- Spatial model:
Only local spatial neighborhoods (4-connectivity) were used to avoid introducing global information.
3.5. Predictive Models
All predictive models were implemented using linear regression. This choice was made to:
- ensure interpretability
- avoid overfitting
- provide a conservative estimate of predictive gain
Model performance was evaluated using mean squared error:
No explicit regularization was applied, as the primary objective was comparative evaluation across model classes rather than optimal prediction.
3.6. Tumor Coupling Index (TCI)
The Tumor Coupling Index (TCI) is defined as the normalized reduction in prediction error obtained by incorporating spatial information:
where:
- : error of the independent model
- : error of the spatial model
TCI is bounded above by 1 and approaches 0 when spatial information does not improve prediction.
3.7. Falsification Procedures
To test whether TCI detects genuine structure rather than artifacts, two perturbation strategies were applied:
- Temporal shuffling: voxel time series randomly permuted
- Spatial shuffling: voxel locations randomized at each time point
These operations destroy temporal and spatial dependencies while preserving marginal distributions.
A valid metric should satisfy:
- TCI ≈ 0 under shuffled conditions
3.8. Statistical Evaluation
All experiments were repeated across multiple independent simulations (typically n = 5–10). Results are reported as:
- mean TCI
- standard deviation across runs
This allows assessment of robustness and variability.
3.9. Parameter Settings
Unless otherwise specified, simulations used:
- (spatial regimes)
- (temporal regimes)
These values were chosen to ensure clear separation between independent and structured regimes while maintaining stability.
3.10. Implementation
All simulations and analyses were implemented in Python using NumPy and scikit-learn. The framework is computationally tractable and can be extended to larger datasets or alternative model classes.
4. Results
4.1. Detection of Non-Independent Dynamics Across Simulation Regimes
To evaluate the ability of the proposed framework to detect structured tumor dynamics, simulations were performed under four controlled regimes: (i) independent dynamics, (ii) temporal-only dependence, (iii) spatial-only coupling, and (iv) combined temporal and spatial interaction. The Tumor Coupling Index (TCI) was computed across multiple independent realizations (n = 5) to assess both central tendency and variability.
As shown in Figure 1, the independent regime yields TCI values near zero (mean ≈ 10⁻⁶), indicating that incorporating spatial information does not improve predictive performance when voxel dynamics are independent. The temporal-only regime similarly produces negligible TCI values, confirming that the current formulation is not sensitive to purely temporal dependencies in the absence of spatial interaction.
In contrast, the spatially coupled regime exhibits a substantial increase in TCI (mean ≈ 0.3–0.4), reflecting significant predictive gain when neighborhood information is incorporated. The combined regime (temporal + spatial) also produces elevated TCI values, though slightly reduced compared to the purely spatial case, consistent with partial overlap between temporal and spatial contributions under linear modeling.
Importantly, the separation between independent and spatial regimes spans several orders of magnitude, with no overlap in variability, demonstrating strong discriminative capability.
Bar plot showing mean TCI values for independent, temporal-only, spatial-only, and combined regimes. Error bars indicate standard deviation across independent simulations (n = 5). TCI remains near zero under independent and temporal-only conditions, while spatial and combined regimes show substantial increases, demonstrating sensitivity to spatial structure.
4.2. Falsifiability and Specificity of the Metric
To assess whether TCI detects genuine structure rather than statistical artifacts, structured datasets (spatial + temporal) were subjected to controlled perturbations designed to destroy dependencies. Two perturbations were considered: (i) temporal shuffling of voxel time series and (ii) spatial randomization of voxel locations at each time point.
As shown in Figure 2, the original structured system exhibits a high TCI (≈ 0.4–0.5), consistent with strong spatial coordination. However, both perturbations result in a collapse of TCI to near-zero values (≈ 10⁻⁴–10⁻³). This demonstrates that predictive gain is eliminated when structure is destroyed.
Crucially, randomized datasets do not produce elevated TCI values, confirming that the metric does not generate false positives under noise or randomization. This establishes the falsifiability condition of the framework.
Comparison of TCI values for original structured dynamics and perturbed datasets. Temporal shuffling and spatial randomization reduce TCI to near-zero values, demonstrating that the metric detects genuine dependencies and does not respond to spurious structure.
4.3. Dependence of TCI on Spatial Interaction Strength
The sensitivity of TCI to the degree of spatial interaction was evaluated by varying the coupling parameter across simulations. As shown in Figure 3, TCI increases monotonically with coupling strength.
At low values of , TCI remains near zero, indicating negligible predictive contribution from spatial information. As coupling increases, TCI rises sharply, reflecting increasing predictive value of neighboring voxel states. At higher coupling strengths, the increase begins to plateau, consistent with a regime in which voxel dynamics become highly correlated and additional spatial information becomes redundant.
This behavior demonstrates that TCI provides a continuous measure of interaction strength, rather than a binary indicator of structure.
Plot of TCI as a function of coupling parameter , with error bars representing standard deviation across simulations (n = 5). TCI increases monotonically with coupling strength and exhibits saturation at higher values, indicating sensitivity to the degree of spatial interaction.
4.4. Invariance of Mean-Based Metrics to Spatial Coupling
To contextualize the proposed framework, conventional scalar summaries were evaluated under identical simulation conditions. Specifically, the mean tumor signal was computed for both independent and spatially coupled systems.
As shown in Figure 4, mean trajectories are nearly identical across both regimes, despite substantial differences in underlying spatial dynamics. This behavior arises because the coupling term redistributes values across voxels without altering the global average, resulting in conservation of the mean signal.
Consequently, scalar metrics such as mean ADC are fundamentally insensitive to spatial interaction, even when strong coordination is present.
Temporal evolution of mean tumor signal for independent and spatially coupled systems. Despite strong spatial interaction, mean trajectories remain nearly identical, demonstrating that scalar summaries cannot detect spatial dependencies.
4.5. Spatial Patterns Reveal Qualitative Differences in Tumor Dynamics
The qualitative impact of spatial coupling is illustrated in Figure 5, which shows the final spatial distribution of the tumor signal for (a) independent and (b) strongly coupled systems. In the absence of coupling (), the spatial pattern remains heterogeneous, with voxel values evolving independently according to their local dynamics. This results in a patchy structure with persistent spatial variability. In contrast, under strong coupling (), the spatial distribution becomes smoother to an extent, reflecting coordinated evolution across neighboring voxels.
5. Discussion
5.1. Summary of Findings
The present study introduces a predictive framework for detecting non-independent tumor dynamics from longitudinal imaging data. The results demonstrate that predictive gain, as quantified by the Tumor Coupling Index (TCI), provides a robust and falsifiable observable of structured behavior.
First, the framework satisfies null consistency, with TCI values remaining near zero under independent dynamics. This confirms that the metric does not artificially detect structure when none is present. Importantly, the temporal-only regime also yields negligible TCI values, indicating that the current formulation is specifically sensitive to spatial dependencies rather than generic temporal correlations.
Second, the framework exhibits strong sensitivity to spatial interaction. Spatially coupled systems produce substantial increases in TCI, with clear separation from independent regimes across multiple orders of magnitude. This demonstrates that incorporating neighborhood information yields meaningful predictive improvement when underlying dynamics are structured.
Third, the framework satisfies a critical falsifiability condition. When temporal and spatial dependencies are destroyed through randomization, TCI values collapse to baseline levels. This confirms that the metric does not respond to spurious correlations or noise, but instead reflects genuine structure in the data.
Fourth, TCI exhibits a monotonic relationship with coupling strength, indicating that it provides a continuous measure of interaction rather than a binary indicator. This suggests that predictive gain can serve not only as a detector of structure but also as a quantitative descriptor of its magnitude.
Finally, the results establish a fundamental limitation of conventional imaging metrics. Mean tumor signal trajectories remain invariant under spatial coupling, demonstrating that scalar summaries are inherently insensitive to interaction effects. In contrast, the proposed framework reveals structure through differences in predictability, highlighting a complementary dimension of analysis.
5.2. Relation to Existing Theory
The proposed framework relates to existing work in tumor modeling, biological systems, and predictive inference, but differs in its focus on observable consequences of structure rather than explicit mechanistic modeling.
Spatial tumor growth models commonly incorporate interaction through diffusion-like coupling (Swanson et al., 2003; Rockne et al., 2010). While such models aim to estimate underlying parameters, the present approach instead detects interaction through its effect on predictive performance, avoiding identifiability challenges in clinical data.
The framework is also consistent with perspectives that view tumors as coordinated systems (Gatenby et al., 2009; Greaves & Maley, 2012; Osswald et al., 2015). However, TCI does not measure specific biological mechanisms, but provides an agnostic indicator of structured dependence that may arise from multiple processes.
Conceptually, the approach aligns with predictive and information-theoretic frameworks in which structure is inferred through improvements in prediction. Here, TCI serves as a normalized measure of predictive gain, computable directly from observed data.
Finally, the results highlight a key observability limitation: spatial interaction is not detectable through scalar summaries such as mean signal. By focusing on predictive improvement, the framework provides access to structure that is otherwise unobservable.
5.3. Clinical Implications
5.3.1. From Static Metrics to Dynamic Monitoring
Current radiotherapy assessment relies heavily on scalar summaries such as mean apparent diffusion coefficient (ADC), tumor volume, or simple voxel-wise changes. These approaches implicitly assume that tumor regions evolve independently or that spatial structure can be adequately captured through aggregation.
The results of this study demonstrate a fundamental limitation of such metrics: spatial interaction is not observable through mean-based summaries, even when strong coordination is present. This implies that clinically relevant information about tumor behavior may remain hidden under conventional analysis.
The proposed framework introduces an alternative perspective: tumor response can be evaluated not only by what changes, but by how predictable those changes are given spatial context.
In this sense, the Tumor Coupling Index (TCI) functions as a dynamic observable, capturing deviations from independent behavior rather than static signal magnitude.
5.3.2. TCI as a Monitoring Signal During Radiotherapy
Within MR-guided radiotherapy workflows, longitudinal imaging is routinely acquired across treatment fractions. This creates an opportunity to track tumor dynamics over time at voxel-level resolution.
The proposed framework can be integrated into this workflow as a monitoring signal, computed periodically from accumulated imaging data. Rather than replacing existing metrics, TCI provides an additional layer of information:
- Low TCI → dynamics consistent with independent or unstructured response
- Elevated TCI → presence of coordinated or structured behavior
This interpretation does not assume a specific biological mechanism, but instead identifies deviations from expected independent decay.
Such deviations may reflect clinically relevant phenomena, including:
- spatially coordinated resistance
- heterogeneous response patterns
- redistribution of tumor activity under treatment
Importantly, TCI is computed from standard imaging data and does not require additional acquisition or invasive measurement.
5.3.3. Potential Role in Adaptive Radiotherapy
A central goal of adaptive radiotherapy is to adjust treatment in response to observed tumor behavior. However, current adaptation strategies are typically driven by geometric changes (e.g., tumor shrinkage or deformation) rather than dynamical structure.
The results suggest that TCI could serve as an indicator of when tumor behavior deviates from expected response patterns, potentially informing adaptive decisions.
In addition to serving as an observable of non-independent dynamics, the Tumor Coupling Index (TCI) may provide a practical indication of confidence in conventional independence-based response models. Current radiotherapy assessment frameworks implicitly assume that tumor regions evolve independently, an assumption that underpins interpretation of scalar imaging metrics and predictive models. Within this context, low TCI values indicate that observed dynamics are consistent with this assumption, supporting continued reliance on standard models. Conversely, elevated TCI values suggest deviation from independent behavior, implying that model predictions based on independence may be less reliable. This can be interpreted as a reduction in confidence in standard model-based assessment, which may warrant closer monitoring or reassessment of treatment strategy. Formally, this can be expressed as an inverse relationship between model confidence and TCI (e.g., confidence ∝ 1/(1 + TCI)), emphasizing that TCI does not replace existing models but provides a complementary signal indicating when their underlying assumptions may be violated.
For illustrative purposes, different patterns of TCI evolution during treatment may be interpreted as follows:
-
Stable, low TCI:Dynamics consistent with approximately independent voxel behavior, suggesting that standard independence-based response models remain applicable.
-
Increasing TCI during treatment:Emergence of structured or coordinated dynamics, indicating a potential deviation from independence assumptions and warranting closer monitoring or reassessment of model-based interpretation.
-
Reduction in TCI following intervention:Decrease in coordinated dynamics, which may reflect disruption of structured behavior and could be consistent with effective treatment response, although this interpretation requires further validation.
-
Persistently elevated TCI despite apparent response:Continued presence of coordinated dynamics even when scalar metrics (e.g., mean ADC) suggest favorable response. This may indicate that independence-based models are overestimating treatment effectiveness, and that model predictions should be interpreted with reduced confidence.
-
Divergence between scalar metrics and TCI trends:Situations in which conventional metrics indicate stable or improving response, while TCI increases over time. Such divergence may signal a breakdown of underlying model assumptions, suggesting the need for incorporating spatially informed or alternative modeling approaches.
These interpretations remain hypothetical and require validation, but they illustrate how predictive observables could complement existing adaptation criteria.
5.3.4. Practical Considerations for Clinical Implementation
For clinical applicability, several practical constraints must be considered.
First, imaging data in radiotherapy is typically limited in temporal resolution, with relatively few time points per patient. The framework must therefore operate under short time series conditions, which may affect stability of predictive estimates. Second, imaging measurements such as ADC are subject to noise, registration error, and variability across acquisitions. Although the simulation results demonstrate robustness under controlled noise, real-world performance will depend on preprocessing quality and signal consistency. Third, interpretability is critical. Clinicians require metrics that can be understood and trusted without extensive modeling assumptions. The proposed framework addresses this by:
- using simple predictive models
- producing an output (TCI)
- avoiding reliance on unobservable parameters
However, careful validation and calibration will be necessary before clinical use.
5.4. Limitations
This study is based on controlled simulations and therefore represents a proof of principle rather than validation on clinical data. Real tumors may exhibit more complex dynamics and noise characteristics than those modeled here.
The Tumor Coupling Index (TCI) is model-dependent, relying on predictive improvement between chosen models. While simple linear models were used for robustness, they may not fully capture nonlinear dynamics, and results may vary with model choice.
The current formulation is primarily sensitive to spatial dependencies, with limited response to purely temporal effects. Extensions to better capture temporal structure remain an area for future work.
Importantly, TCI does not uniquely identify underlying biological mechanisms. Elevated values indicate non-independent dynamics, but multiple factors—including biological interaction, shared environment, or imaging artifacts—may contribute. TCI should therefore be interpreted as a measure of deviation from independent dynamics, rather than a direct indicator of biological interaction
Finally, clinical application may be affected by limited time points, noise, and registration errors in imaging data, which could impact stability and interpretation.
5.5. Future Work
Several directions emerge from the present study for extending and validating the proposed framework.
First, the most immediate priority is application to clinical datasets, particularly longitudinal MR-guided radiotherapy data. This will enable evaluation of TCI under realistic conditions, including limited time points, imaging noise, and patient-specific variability. Establishing whether TCI correlates with clinically relevant outcomes—such as treatment response, progression, or recurrence—will be essential for determining its practical utility.
Second, the framework can be extended to incorporate richer predictive models, including nonlinear or regularized approaches. While simple linear models were used here for interpretability and robustness, more expressive models may capture additional structure, particularly in systems exhibiting nonlinear or higher-order interactions. Careful evaluation will be required to balance improved sensitivity against the risk of overfitting.
Third, future work may explore explicit temporal modeling, enabling detection of memory-dependent dynamics that are not captured in the current spatially anchored formulation. This could include longer temporal histories, autoregressive structures, or hybrid spatiotemporal models.
Fourth, the relationship between TCI and underlying biological processes warrants further investigation. While the present framework does not attempt mechanistic interpretation, controlled studies may help clarify how different forms of interaction—such as diffusion, microenvironmental coupling, or treatment-induced heterogeneity—contribute to observed predictive structure.
6. Conclusion
This work introduces a predictive framework for detecting non-independent tumor dynamics using longitudinal imaging data. By quantifying predictive improvement with spatial information, the Tumor Coupling Index (TCI) provides a measurable signal of structured behavior. TCI remains near zero under independent dynamics, increases under spatial interaction, and collapses under randomization, demonstrating both sensitivity and falsifiability. In contrast, conventional scalar metrics fail to capture such structure. Rather than measuring specific biological mechanisms, TCI identifies deviations from independent behavior, offering a robust and computable observable of tumor dynamics.
Data Availability Statement
Simulation code and data are available upon request.
Conflicts of Interest
The authors declare no conflicts of interest.
References
- Enderling, H; Chaplain, MAJ. Mathematical modeling of tumor growth and treatment. Curr Pharm Des. 2014, 20(30), 4934–40. [Google Scholar] [CrossRef] [PubMed]
- Gatenby, RA; Silva, AS; Gillies, RJ; Frieden, BR. Adaptive therapy. Cancer Res. 2009, 69(11), 4894–903. [Google Scholar] [CrossRef] [PubMed]
- Granger, CWJ. Investigating causal relations by econometric models and cross-spectral methods. Econometrica 1969, 37(3), 424–38. [Google Scholar] [CrossRef]
- Greaves, M; Maley, CC. Clonal evolution in cancer. Nature 2012, 481(7381), 306–13. [Google Scholar] [CrossRef] [PubMed]
- Hormuth, DA, 2nd; Phillips, CM; Wu, C; Lima, EABF; Lorenzo, G; Kalpathy-Cramer, J; et al. Biologically-based mathematical modeling of tumor growth and treatment response. Br J Radiol. 2018, 91(1090), 20180447. [Google Scholar]
- Jain, RK. Transport of molecules in the tumor interstitium: a review. Cancer Res. 1987, 47(12), 3039–51. [Google Scholar] [PubMed]
- Koh, TS; Collins, DJ. Perfusion MRI: the journey of an imaging biomarker. Br J Radiol. 2007, 80 Spec No 1, S10–17. [Google Scholar]
- Lagendijk, JJ; Raaymakers, BW; van Vulpen, M. The magnetic resonance imaging-guided radiotherapy (MRIgRT) system: a short introduction. Front Oncol. 2014, 4, 210. [Google Scholar]
- Mitchell, J; et al. Tumors as adaptive, integrated dynamical systems: Implications for radiotherapy response and emergent resistance. J Theor Biol. 2024, 578, 111682. [Google Scholar]
- Mora, T; Bialek, W. Selective erasure of physiological memory in biological networks without topological alteration. Phys Rev E 2025, 111(2), 024401. [Google Scholar]
- Mutic, S; Dempsey, JF. The ViewRay system: magnetic resonance-guided and adaptive radiotherapy. Semin Radiat Oncol. 2014, 24(3), 196–9. [Google Scholar] [CrossRef] [PubMed]
- O’Connor, JP; Aboagye, EO; Adams, JE; Aerts, HJ; Barrington, SF; Beer, AJ; et al. Imaging biomarker roadmap for cancer studies. Nat Rev Clin Oncol. 2017, 14(3), 169–86. [Google Scholar] [CrossRef] [PubMed]
- Osswald, M; Jung, E; Sahm, F; Solecki, G; Venkataramani, V; et al. Brain tumour cells interconnect to a functional and resistant network. Nature 2015, 528(7580), 93–8. [Google Scholar] [CrossRef] [PubMed]
- Padhani, AR; Liu, G; Koh, DM; Chenevert, TL; Thoeny, HC; Takahara, T; et al. Diffusion-weighted magnetic resonance imaging as a cancer biomarker: consensus and recommendations. Neoplasia 2009, 11(2), 102–25. [Google Scholar] [CrossRef] [PubMed]
- Pigozzi, G; et al. Resistance and recurrence as dynamical phenomena: A framework for history-dependent tumor organization. Nat Commun. 2026, 17(1), 412. [Google Scholar]
- Raaymakers, BW; Jürgenliemk-Schulz, IM; Bol, GH; Glitzner, M; Kotte, ANTJ; van Asselen, B; et al. First patients treated with a 1.5 T MRI-linac: clinical proof of concept of a high-precision, real-time adaptive radiotherapy system. Phys Med Biol. 2017, 62(23), L41–50. [Google Scholar] [CrossRef] [PubMed]
- Rajan, DH; Lee, B; Albright, A; Tang, E; Ressler, K; Maravillas, A; et al. Stentor stipatus is a new unicellular species that demonstrates habituation and unique phototaxis. Sci Rep. 2026, 16, 4027, (Note: Initial findings/preprints circulating in late 2024/2025 under bioRxiv). [Google Scholar] [CrossRef] [PubMed]
- Rockne, R; Rockhill, JK; Mrugala, M; Spence, AM; Kalet, I; Hendrickson, K; et al. Predicting the efficacy of radiotherapy in individual glioblastoma patients in vivo: a mathematical modeling approach. Phys Med Biol. 2010, 55(12), 3271–85. [Google Scholar] [CrossRef] [PubMed]
- Schreiber, T. Measuring information transfer. Phys Rev Lett. 2000, 85(2), 461–4. [Google Scholar] [CrossRef] [PubMed]
- Swanson, KR; Rostomily, RC; Alvord, EC, Jr. Virtual and real brain tumors: using mathematical modeling to quantify glioma growth and invasion. J Neurol Sci. 2003, 216(1), 1–10. [Google Scholar] [CrossRef] [PubMed]
Figure 1.
Tumor Coupling Index (TCI) across simulation regimes.

Figure 2.
Falsification of TCI under structure-destroying perturbations.

Figure 3.
Dependence of TCI on spatial coupling strength.

Figure 4.
Invariance of mean tumor signal under spatial coupling.

Figure 5.
(Independent) Spatial heterogeneity persists in the absence of coupling and (Coupled) Spatial coupling induces coordinated homogenization of tumor dynamics.
Figure 5.
(Independent) Spatial heterogeneity persists in the absence of coupling and (Coupled) Spatial coupling induces coordinated homogenization of tumor dynamics.

Disclaimer/Publisher’s Note: The statements, opinions and data contained in all publications are solely those of the individual author(s) and contributor(s) and not of MDPI and/or the editor(s). MDPI and/or the editor(s) disclaim responsibility for any injury to people or property resulting from any ideas, methods, instructions or products referred to in the content. |
© 2026 by the authors. Licensee MDPI, Basel, Switzerland. This article is an open access article distributed under the terms and conditions of the Creative Commons Attribution (CC BY) license (http://creativecommons.org/licenses/by/4.0/).
Copyright: This open access article is published under a Creative Commons CC BY 4.0 license, which permit the free download, distribution, and reuse, provided that the author and preprint are cited in any reuse.


