Submitted:
25 March 2026
Posted:
27 March 2026
You are already at the latest version
Abstract
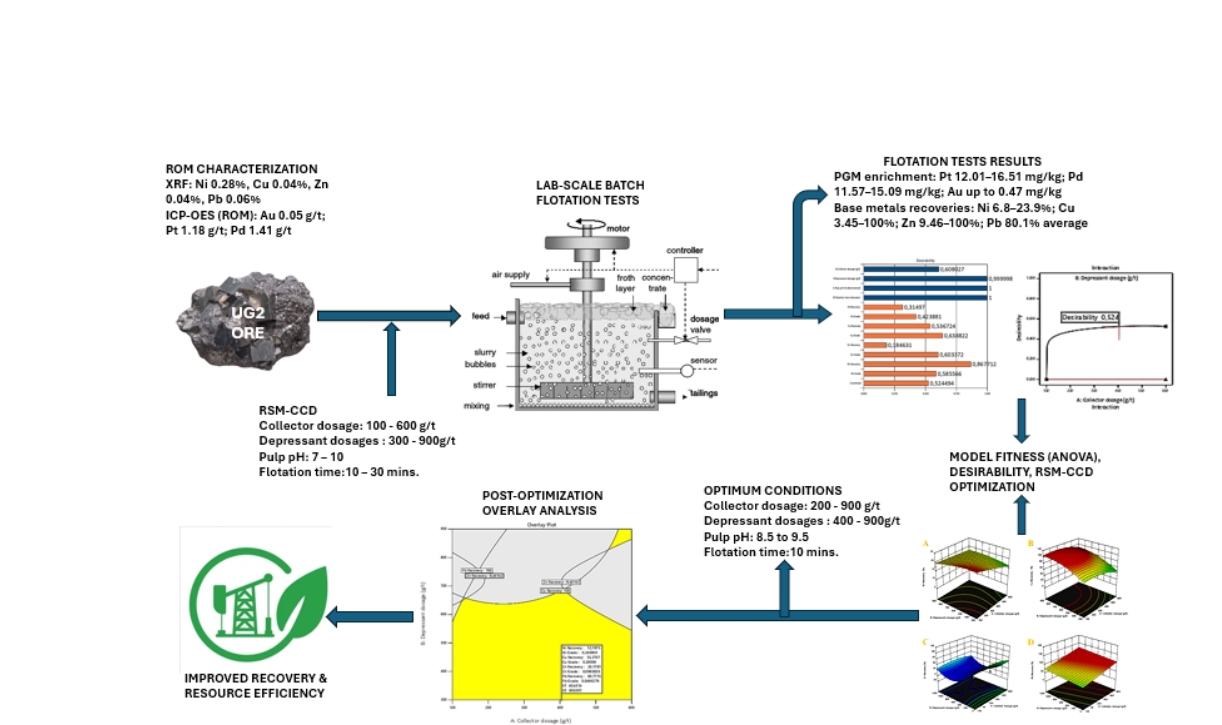
This study explores the optimized extraction of platinum group metals (PGMs), particularly platinum (Pt) and palladium (Pd), along with associated base metals (Ni, Cu, Zn, and Pb) from UG2 ore. An integrated approach combining advanced mineral characterization and statistical optimization via Response Surface Methodology (RSM) was employed. X-ray fluorescence (XRF) revealed metal contents: Ni (0.28%), Cu (0.04%), Zn (0.04%), Pb (0.06%), and major gangue components Si (17.65%), Fe (13.33%), and Cr (7.37%). Complementary X-ray diffraction (XRD) and scanning electron microscopy (SEM) confirmed mineral composition and textures favourable for flotation, while inductively coupled plasma optical emission spectroscopy (ICP-OES) indicated 0.05 g/t Au, 1.18 g/t Pt, and 1.41 g/t Pd in the run-of-mine sample. Optimization through a central composite design (CCD) identified ideal flotation conditions: collector dosages of 200 - 900 g/t, depressant dosages of 400 - 900g/t pulp pH of 8.5 to 9.5, and flotation time of approximately 10 minutes. Recoveries ranged from 6.8- 23.91% (Ni), 3.45- 100% (Cu), 9.46-100% (Zn), and averaged 80.10% (Pb). Post- flotation ICP-OES analysis demonstrated significant enrichment of PGMs, with Pt ranging between 12.01 to 16.51 mg/kg, Pd between 11.57 to 15.09 mg/kg, and gold peaking at 0.47 mg/kg for optimal runs. These findings highlight the effectiveness of integrating characterization techniques with statistical design to enhance PGM and associated base metals recovery, offering tailored solutions for improved economic viability and resource efficiency.
Keywords:
UG2 ore
; platinum group metals
; base metals
; Response Surface Methodology (RSM)
; chemical flotation
1. Introduction and Background
The UG2 reef is a geological complex formation composed primarily of chromite interspaced with silicates and sulphides [1,2]. This intricate mineral assemblage directly influences both the economic potential of the ore and the challenges associated with its processing [3]. Chromite, in particular, complicates flotation by promoting the recovery of gangue minerals, thereby reducing the yield of platinum group metals (PGMs) and associated base metals [4]. Addressing these challenges requires a detailed understanding of the ore’s mineralogical properties and the application of advanced characterization techniques [5,6]. Information obtained from these techniques is vital for optimizing flotation parameters, as the effectiveness of flotation depends significantly on the size and morphology of the processed particles [7].
This study integrates analytical methods with advanced experimental design tools such as Central Composite Design (CCD) of Response Surface Methodology (RSM), to optimize recovery strategies and concentrate quality in UG2 ore flotation [8]. Chemical flotation remains one of the most widely employed methods for the separation of valuable minerals from the gangue [9]. However, the process is inherently complex in UG2 ore, where reagent-mineral interactions strongly influence recovery outcomes [4,10]. Recent advancements in flotation chemistry, including the development of selective collectors and modifiers, have shown promise in improving the recovery of PGMs and associated base metals while minimizing chromite recovery [11].
The novelty of this study lies in its innovative approach to the design and optimization of chemical flotation experiments through the application of Response Surface Methodology (RSM) approach from Design Expert software. This study sets itself apart from earlier RSM-based flotation optimization efforts by employing a Central Composite Design (CCD) approach, allowing for a more nuanced examination of input variables and their interactions specific to UG2 ore. Unlike previous studies [12,13,14], this research focuses on the unique mineralogical characteristics of UG2 ore to enhance recovery rates and concentrate quality. Additionally, it integrates real-time feedback mechanisms and advanced statistical analyses, facilitating robust validation and optimization. By incorporating machine learning techniques, the study aims to uncover non-linear relationships among variables, ultimately providing more effective strategies for UG2 ore flotation.
The RSM CCD statistical tool enables the identification of optimal conditions for PGMs and base metals recovery [12,15,16]. Beyond improving economic viability, the research contributes to sustainable mining practices by fostering a deeper understanding of the ore’s complex mineralogy. The findings of this study are expected to have significant implications for the field of mineral processing and could pave the way for more efficient and environmentally friendly methods of recovery of PGMs in the Bushveld Complex and beyond [17].
2. Methodology
2.1. Materials
The study utilized a run-of-mine (ROM) UG2 ore subsampled from one of the PGMs concentrators in Limpopo, South Africa. The ore was characterized by a complex composition, primarily consisting of 20-25% chromite, 2-5% chalcopyrite, 1-3% sphalerite, 0.5-1% galena, and 1-2% magnetite. Silicates and other gangue minerals, predominantly quartz, accounted for the remaining 60-75% of ore sample. The ore had a density of approximately 3.5 t/m³ and moisture content ranging between 2-5%. In the flotation process, sodium isobutyl xanthate (SIBX) served as the primary collector, effectively binding to sulphide minerals for enhanced separation [18]. Methyl Isobutyl Carbinol (MIBC) was used as a frother to stabilize bubbles and improve mineral recovery [19]. Copper sulphate (Cu₂SO₄) acted as an activator to enhance the flotation response of less amenable sulphide minerals [20]. The pulp pH was adjusted using sodium hydroxide (NaOH) and hydrochloric acid (HCl), which influence collector effectiveness and mineral behaviour [21]. Lastly, carboxymethyl cellulose (CMC) was used as a depressant to inhibit unwanted minerals, improving concentrate purity [22]. All reagents were sourced from Merck (Pty) Ltd., and they were of ACS grade. X-ray fluorescence (XRF) analysis utilized the pellet method with Sasol wax as a binding agent for sample preparation, and lithium tetraborate served as a fusion reagent for X-ray diffraction (XRD) phase identification. Scanning Electron Microscopy (SEM) required conductive coatings of gold or carbon to enhance imaging quality. For fire assay analysis, a mixture of nickel sulphide, silica, borax and soda ash was utilized to accurately determine PGMs content.
2.2. Ore Preparation and Characterization
Initially, the ore was subjected to crushing using a jaw crusher followed by a roll crusher for further particle size reduction and homogeneity. Following crushing, representative samples were collected to ensure that the analysis accurately reflected the ore body’s composition. Once that was complete, the next step involved splitting the bulk sample into smaller, more manageable portions using a riffle splitter. The split samples were then subjected to pulverization using a pulverizing machine, which ground the ore to a fine particle size of less than 75 microns. The pulverized material was prepared for various analytical techniques: for XRF analysis, the fine powder was pressed into pellets after binding with Sasol wax. Data providing elemental concentrations was processed using Microsoft windows ZSX software from the XRF Rigaku Primus II machine. In XRD analysis, the pulverized sample was further ground using a pestle and mortar and placed in a 2mm-thick aluminium plate and analysed using a Rigaku Ultima IV machine to identify mineral phases present in the ore.
For SEM analysis, the fine particles were mounted on conductive stubs and coated with a thin layer of carbon to improve imaging quality. High-resolution images were captured using a JSM-7001F SEM to examine the surface morphology and texture of the ore particles. Fire assay pulverized samples were mixed with fluxes such as nickel sulfide (2,03g), silica (19,55g), borax (9,78g), and soda ash (10.01g) and subjected to high temperatures (approximately 1000 ℃) in a furnace to extract precious metals. The resulting lead button was separated from the slag and underwent cupellation, and the final bead was used for hydrochloric acid leaching. The analysis of the acid-leached UG2 sample was conducted using a high-performance ICP-OES (Agilent 5100 SVDV model) to quantify platinum group metals (PGMs). This thorough preparation process was critical for obtaining reliable data that informed the subsequent flotation tests.
2.3. Design of Flotation Experiments (DOE)
The flotation experiments were designed using Design-Expert software, employing Response Surface Methodology (RSM) with a Central Composite Design (CCD) to optimize both recovery and grade of valuable products. Four independent variables – collector dosage, depressant dosage, pulp pH, and flotation time – were systematically investigated for their influence on overall recovery and grade (Table 1 defines these variables and their respective levels). An experimental design matrix was generated, incorporating factorial, axial, and centre points, to capture potential non- linear effects. Flotation experiments were then conducted according to this randomized design (Table 2), with recovery rates and mineral grades recorded as response variables. To streamline the analysis and reduce variability in the flotation system, certain parameters, such as impeller speed (constant impeller speed ensures consistent mixing and particle suspension) and airflow rate (airflow rate maintains uniform froth formation and bubble behaviour) were held constant. The collected data were analysed using the software’s modelling tools to visualize factor-response relationships. Optimization tools identified ideal conditions for maximizing recovery and grade. Finally, validation experiments performed under these optimal conditions confirmed the accuracy of the model, with results thoroughly documented.
2.4. Flotation Experiments
The flotation of UG2 ore was conducted using a systematic approach to maximize the recovery of valuable minerals. After milling 500g of the crushed ore using a ball mill, the ore was mixed with water to create a 30% w/v slurry, and the pH was adjusted to the target range specified by the DOE using dilute hydrochloric acid (HCl) or sodium hydroxide (NaOH) to optimize mineral surface characteristics. Copper Sulphate (Cu₂SO₄) was added as an activating reagent at a constant dosage of 200 g/t, followed by varying levels of Sodium Isobutyl Xanthate (SIBX) collector based on Table 2 to enhance the hydrophobicity of target minerals. Carboxymethyl cellulose (CMC) depressant was also added at varying dosages based on the DOE, and Methyl Isobutyl Carbinol (MIBC) frother was constantly introduced at 100 g/t to promote bubble stability and froth formation. The slurry was conditioned for 5 minutes before flotation in a 2.5-liter Denver flotation cell, where air was introduced at a flow rate of 1.0 L/min. Flotation tests were conducted at varying times of 10, 20, and 30 minutes, under controlled conditions of agitation speed of 1200 RPM and temperature of 25 °C. Post-flotation, the froth was collected and analysed for concentrate grade using XRF and ICP-OES. The remaining tailings were also assessed. These steps were repeated 30 times following the order indicated in Table 2 as per the design of experiments.
3. Results and Discussion
3.1. UG2 Ore Characterization
The UG2 ore sample used in the flotation experiments had a particle size distribution of 80% passing 75 μm, corresponding to an optimised milling time of approximately 32 minutes. The elemental composition of the sample as determined by XRF is shown in Table 3.
The data revealed a complex assemblage of elements with implications for both mineral processing and economic evaluation. Silicon (Si) is the most dominant element at 17.65%, followed by iron (Fe) at 13.33%, which contributes to the ore’s magnetic properties. Aluminium (Al) and magnesium (Mg) measured at 7.80% and 3.48%, respectively, suggest a significant clay or aluminosilicate component. The presence of these aluminosilicates can significantly affect reagent adsorption and froth stability during flotation. Aluminosilicates tend to have high surface area and can absorb collectors and frothers, potentially leading to decreased availability of these reagents for the target minerals [23]. Chromium (Cr) present at 7.37% enhances the ore’s industrial value given its role in stainless steel production. Trace concentrations of nickel (Ni), copper (Cu), lead (Pb), and zinc (Zn) (0.28%, 0.04%, 0.06%, and 0.04% respectively), further underscores the economic potential of the deposit. Minor levels of phosphorus (P, 0.02%) and sulphur (S, 0.08%) may present environmental challenges during downstream processing. Notably, PGMs were not detected in this analysis, likely due to their low concentrations or encapsulation in complex matrices, as previously noted by [10]. To address this limitation, complementary ICP-OES analysis was undertaken to provide a more comprehensive assessment of the PGM content. The ore contained Pt, Pd and Au at concentrations of 1.18 ± 0.01 g/t, 1.41 ± 0.03 g/t and 0.05 ± 0.01 g/t, respectively. The mineralogical phase of the ore obtained from the XRD analysis is shown in Figure 1.
Key mineral phases which may influence flotation performance includes chromite, magnesiochromite, and anorthite. Chromite has a known tendency to report to the concentrate, which can lead to contamination of the PGMs yield. In contrast, magnesiochromite can behave similarly to chromite but may offer better selectivity under certain flotation conditions. The presence of anorthite may interfere with flotation efficiency and hinder the selective recovery of valuable minerals. Other peaks indicate the presence of ferrosilite and covellite which points to potential copper recovery, while enstatite peaks suggest thermal stability in processing conditions. Although not directly applicable to flotation, the thermal stability of enstatite may influence the behaviour of the ore under high-temperature conditions, facilitating effective metal extraction during smelting or other thermal treatments. Additionally, the presence of nickel sulphides indicate opportunities for concurrent nickel recovery alongside PGMs. The identification of quartz as a gangue material poses challenges, as it may negatively impact flotation efficiency, underscoring the importance of understanding its interactions with valuable minerals. SEM results, shown in Figure 2 and EDS Table 4, further revealed phases containing PGMs, highlighting the need for effective liberation strategies to maximize recovery of these metals.
Spectrum 1 indicates high sulphur content (22.49%), suggesting sulphide minerals like pentlandite, along with significant nickel and iron levels. It also shows trace copper (1.15%), indicative of chalcopyrite. Precious metals, including palladium (0.08%), platinum (0.93%), and gold (0.93%), are also evident as fine inclusions within the sulphide matrix. Spectrum 2 features high chromium content indicating chromite, with accompanying magnesium and iron, suggesting olivine or spinel. Aluminium and silicon may indicate feldspar or clay minerals. The low palladium content (0.12%) signifies potential palladium-bearing minerals, underscoring the ore’s economic importance. Spectrum 3 shows substantial aluminium and silicon, indicating feldspar predominance, while darker regions may represent amphibole or biotite and other iron-rich minerals. This complex mineral assemblage informs the ore’s texture and potential processing behaviour, underscoring its economic significance.
3.2. UG2 Ore Flotation Results
The flotation test results, illustrated below present a comprehensive view of the recovery rates (Figure 3) and grades (Figure 4) for nickel (Ni), copper (Cu), zinc (Zn), and lead (Pb) from UG2 ore across 30 tests.
Nickel recovery rates ranged from 6.81% to 23.85%, influenced by factors such as mineralogy, reagent performance, and operational parameters, with low rates below 10% indicating ineffective flotation conditions. Copper recovery displayed a wider range, from 3.45% reaching close to 100%, where optimal conditions led to perfect separation, suggesting favorable floatability, although significant drops highlighted potential issues with reagents or ore variability. Zinc recovery was more challenging, averaging 16.58% due to complex mineralogy, indicating the need for further optimization. Lead recovery varied significantly, achieving up to 100% in some tests, but averaging around 80.10%, revealing the need for refined operational parameters for consistency. Overall, tailored strategies are crucial for maximizing recovery rates across all metals.
Nickel exhibits the most favorable results in terms of grade among the analyzed metals, with ranges from 0.23 to 0.49%, particularly in Run 7, where optimal conditions led to high concentrations. However, variations in grades across other runs suggest inconsistencies influenced by ore characteristics or flotation conditions, presenting opportunities for optimization. Copper grades vary from 0.08 to 0.41%, with lower grades indicating potential inefficiencies in flotation techniques. Zinc grades are moderate, ranging from 0.039 to 0.139%, highlighting the need for operational adjustments to enhance purity. Lead grades pose the greatest challenge, with many runs achieving minimal grades and a maximum of only 0.085%, signaling a need to reevaluate flotation parameters to balance recovery and purity. Overall, while nickel shows strong potential, copper recovery remains inconsistent, and significant challenges exist for zinc and lead, emphasizing the importance of continuous monitoring and optimization for improved metal purity and economic returns from flotation.
3.3. Response Surface Methodology (RSM) Optimization
RSM provided a robust analytical framework for this study, facilitating the systematic exploration and optimization of critical flotation variables, including collector dosage, depressant dosage, pulp pH and flotation time. The application of RSM enabled the identification of significant interactions among these parameters, highlighting the combined influence on flotation efficiency.
3.3.1. Model Fitness and Statistical Analysis
3.3.3.1. Goodness of Fit Statistical Analysis
Evaluating statistics is essential for assessing model performance, as they quantify how effective the model explains variability in recovery rates and grades. The fit statistics for nickel, copper, zinc, and lead recoveries, presented in Table 5, provide a rigorous assessment of the RSM model’s effectiveness in flotation analysis.
The R² values indicate that the model explains 61.44%, 56.05%, 53.54%, and 31.25% of variability in recoveries for Ni, Cu, Zn, and Pb, respectively. While moderate fits are noted for nickel, copper, and zinc, the low R² for lead signifies unexplained variability, indicating a need for additional factors or interactions not captured by the current model. Adjusted R² values are also low (0.2546 for nickel, 0.1503 for copper, 0.1019 for zinc, and 0.2025 for lead), pointing to possible overfitting and the necessity for model simplification. Negative predicted R² values for nickel, copper, and zinc further raise concerns regarding predictive reliability, whereas the positive predicted R² for lead reflects only marginal predictive capacity. Adequate precision values ranging from 4.88 to 5.65 suggest that the model provides reasonable indication of response. Refinement through the inclusion of the additional relevant variables or reassessment of experimental conditions is essential to enhance predictive accuracy and optimize flotation performance.
The analysis of fit statistics for nickel, copper, zinc, and lead grades, presented in Table 6, offers further insights into the RSM model’s performance. These results highlight the model’s capacity to explain variability in grade outcomes and complement the recovery analysis, there by offering a more comprehensive evaluation of flotation efficiency.
The R² values of 0.5390 (Ni) , 0.7006 (Cu), 0.5371 (Zn) , and 0.5626 Pb indicated varied explanatory power, with copper showing the strongest fit and lead requiring refinement. Adjusted R² values are notably low for nickel (0.1087) and zinc (0.1050), suggesting overfitting and limited reliability. Negative predicted R² values for nickel, copper, zinc, and lead further question the model’s robustness, while adequate precision values (4.50 to 7.05) provide only moderate confidence. Overall, these results underscore the need for model refinement through inclusion of additional variables and improved experimental design.
3.3.3.2. Analysis of Variance (ANOVA) of the Overall Model
Table 7 and Table 8 presents the analysis of variance (ANOVA) for the recovery and grades of nickel, copper, zinc, and lead from UG2 ore flotation. ANOVA was employed to identify significant differences among group means and to evaluate the impact of key factors - collector dosage (A), depressant dosage (B), pulp pH (C), and flotation time (D) - on recovery rates and metal grades.
For nickel recovery, the overall model was not significant, though flotation time was influential (F-value = 7.26, p-value = 0.0167), with a favourable lack of fit indicating good data alignment. Copper recovery also lacked overall significance, but the interaction between depressant dosage and flotation time (BD, F-value = 4.76, p-value = 0.0455), and the quadratic term for depressant dosage (B², F-value = 4.96, p-value = 0.0417), were significant, with an adequate lack of fit. Zinc recovery was non-significant overall, yet depressant dosage and its quadratic term were significant (F-value = 5.36, p-value = 0.0351; F-value = 9.36, p-value = 0.0079), though the significant lack of fit indicated the need for additional factors. Lead recovery showed a significant model (F-value = 2.84, p-value = 0.0454), driven largely by flotation time (F-value = 7.87, p-value = 0.0096), with a non-significant lack of fit supporting model adequacy.
The nickel grade model was non-significant, with a significant lack of fit (F-value = 8.26, p-value = 0.0155) indicating poor representation of factors affecting Ni grade. In contrast, the copper grade model was significant (F-value = 2.51, p-value = 0.0441), driven by pulp pH (C) and flotation time (D) and the interaction between collector dosage and flotation time (AB) (F-value = 5.98, p-value = 0.0273), though its lack of fit suggests missing factors. The zinc grade model was again non-significant overall, with all individual factors yielding non-significant results, and its lack of fit not significant (F-value = 0.4133, p-value = 0.8902), indicating adequate alignment but limited predictive capacity. The lead grade model also lacked overall significance, though flotation time (D) was significant (F-value = 4.81, p-value = 0.0445), with a non- significant lack of fit supporting model accuracy. Overall, copper and lead grades show meaningful factor effects, while nickel and zinc grade models fail to capture variability, highlighting the need for refinement.
3.3.3.3. Empirical Model Equations
The empirical model equations (1 – 8) were developed using CCD to predict the recovery and grade of Ni, Cu, Zn and Pb as functions of collector dosage (A), depressant dosage (B), pulp pH (C), and flotation time (D). These equations employed coded variables, with high and low levels designated as +1 and -1, respectively. This coding framework enables response prediction at defined factor levels and facilitates direct comparison of coefficients, thereby quantifying the relative influence of each parameter on the metal recovery and grade.
% Ni Recovery = + 15,00 - 0,6826A + 0,2264B + 0,6169C + 1,82D + 1,37AB - 1,22AC - 0,2715AD + 0,0446BC - 0,8591BD + 0,5839CD - 0,0664A² - 0,8203B² + 1,25C² +0,7903D² [1]
% Ni Grade = + 0,3033 - 0,0032A + 0,0055B - 0,0165C - 0,0165D - 0,0222AB + 0,0150AC + 0,0241AD + 0,0020BC + 0,0174BD - 0,0128CD + 0,0153A² + 0,0096B² + 0,0003C² - 0,0022D² [2]
% Cu Recovery = + 88,58 - 1,30A + 8,66B + 3,88C - 1,99D + 1,27AB - 6,60AC + 1,24AD + 6,22BC - 13,61BD - 4,75CD - 8,59A² - 10,61B² + 1,46C² - 2,79D² [3]
% Cu Grade = + 0,2281 - 0,0196A + 0,0089B - 0,0281C - 0,0297D - 0,0363AB + 0,0205AC + 0,0247AD - 0,0103BC + 0,0259BD - 0,0249CD + 0,0073A² + 0,0159B² - 0,0101C² - 0,0028D² [4]
% Zn Recovery = + 12,96 - 0,8455A - 7,16B + 1,01C + 0,9437D + 0,5978AB - 0,6425AC - 0,2726AD - 0,2396BC - 0,5824BD - 0,2061CD - 1,94A² + 8,85B² - 1,09C² - 1,29D² [5]
% Zn Grade = + 0,0692 - 0,0032A - 0,0048B - 0,0003C - 0,0072D - 0,0101AB + 0,0083AC + 0,0042AD - 0,0031BC + 0,0048BD - 0,0093CD + 0,0007A² + 0,0075B² - 0,0029C² - 0,0036D² [6]
% Pb Recovery = + 83,33 + 12,37A + 4,29B - 4,29C - 20,71D - 6,44AB - 6,06AC + 18,56AD + 6,06BC + 6,44BD + 6,06CD + 5,24A² + 5,24B² - 7,26C² - 7,26D² [7]
% Pb Grade = + 0,0301 + 0,0015A + 0,0002B - 0,0011C - 0,0077D - 0,0078AB + 0,0086AC + 0,0016AD - 0,0040BC + 0,0079BD - 0,0022CD + 0,0022A² + 0,0015B² - 0,0025C² - 0,0029D² [8]
The empirical model equations 1, 3, 5, and 7 described recoveries, while 2, 4, 6 and 8 addressed grade. Positive coefficients indicated that increasing a factor enhances recovery or grade, whereas negative coefficients denote a detrimental effect. For instance, a negative coefficient for collector dosage (A) in the nickel recovery model equation suggests excessive dosage reduces recovery, while a positive coefficient for flotation time reflects the benefit of extended flotation. Collectively, these model equations provide a predictive framework for optimising flotation by identifying how parameter adjustments influence both recovery and product quality.
3.3.3.4. Model Fitting Shown Through Predicted vs Actual Plots for Recovery and Grade
The predicted versus actual plots (Figure 5: recovery and Figure 6: grade) illustrate the empirical model’s performance for Ni, Cu, Zn, and Pb during UG2 ore flotation. Experimental data points cluster near the diagonal line for most plots, confirming that the models effectively capture the underlying trends in the data and validated the optimised equations. This agreement demonstrates the accuracy of the predictions and highlights the model’s utility in evaluating flotation efficiency.
3.3.2. Interaction Plots
The interaction plots (Figure 7) illustrate the effects of collector dosage (A) and depressant dosage (B) on the recovery and grade of Ni, Cu, Zn, and Pb during the flotation of UG2 ore. These parameters were selected due to their critical influence on mineral attachment and separation efficiency, as evidenced by statistical analysis.
Ni and Cu recoveries improved with higher collector levels and balanced depressant dosages, while Zn is highly sensitive to dosage variation and Pb peaks at higher collector dosages. A desirability value of 0.524 indicates moderate model fit, indicating potential for refinement. The grade plots for Ni and Zn highlight trade-offs between recovery and quality. These findings emphasize the need for balanced parameter adjustment to optimize flotation efficiency.
3.3.3. Desirability Histogram
Figure 8 shows the desirability histogram showing the influence of flotation parameters on Ni, Cu, Zn and Pb recovery and grade, with the combined desirability score reflecting overall model performance.
Collector dosage achieved a moderate desirability score of 0.608, indicating potential for recovery improvement. Depressant dosage scores exceptionally high at 0.999, suggesting well-calibrated levels for effective flotation, while pulp pH and flotation time achieve perfect scores of 1, confirming optimal conditions. In contrast, nickel recovery (0.315) and nickel grade (0.424) highlight critical areas needing enhancement. Copper recovery (0.537) and zinc recovery (0.185) also indicate moderate performance, requiring further adjustments. Lead recovery (0.868) and lead grade (0.585) reflected favourable conditions but required ongoing monitoring. The combined desirability score of 0.524 underscores the need for strategic parameter refinement to improve overall flotation efficiency.
3.3.4. Ramps-Based Parameter Analysis
The ramp analysis (Figure 9) provides insights from graphical multi-objective optimization of Ni, Cu, Zn and Pb from UG2 ore. An optimal collector dosage of ~400 g/t markedly improved Cu and Pb recoveries, while depressant dosage beyond ~300 g/t shows limited benefit, indicating inefficiency at higher levels. Maintaining pulp pH between 8.5 – 9.5 is critical for maximising recovery, with an optimal flotation time of ~10 minutes to avoid diminishing returns. Ni recovery is strongly influenced by collector dosage and flotation time, Cu recovery requires fine-tuning, and Zn recovery remains suboptimal, highlighting the need for further optimization. Pb recovery is highly sensitive to operational changes, necessitating strict control. While Ni grade remains consistently high, variable Cu and Zn grades emphasize the importance of balancing recovery with product quality.
3.3.5. Three-Dimensional (3-D) Analysis Using Surface Plots
The results below present the 3D surface and contour plots, which visually represent the complex interactions among key operational parameters in the flotation process.
The 3D surface plots in Figure 10 highlight the critical influence between collector and depressant dosages on metal recovery. Nickel recovery peaks at ~ 200 g/t collector and 600 g/t depressant but declines sharply at higher depressant levels. Copper shows nearly 100% recovery within the 600-900 g/t depressant range. Zinc exhibits complex interactions with recoveries dropping below 20% when dosages are higher. Zinc’s poor performance at higher depressant dosages can be attributed to increased competition for surface sites, leading to unwanted inhibition of zinc flotation. Additionally, high dosages can alter pulp pH and chemistry, negatively affecting the zinc surface properties and interactions with collectors [24]. Lead recovery reaches 90-100% at ~750 g/t collector but falls sharply with reduced dosages. Overall, these plots confirm the delicate balance required for efficient extraction and validate RSM findings on parameter interactions and operational boundaries.
The 3D surface plots in Figure 11 illustrate the grade responses of nickel, copper, zinc, and lead. Nickel grades peak at ~ 0.37% within a depressant dosage range of 700–900 g/t, dropping below 0.25% at lower dosages. Copper achieves ~ 0.35% grade at collector dosages below 100 g/t with 700–900 g/t depressant. The zinc grade reaches ~ 0.1% at 400–600 g/t collector and 400 g/t depressant, but grades decline sharply when dosages are imbalanced. Lead shows an inverse trend, with peak grades (~ 0.05%) at collector dosages below 100 g/t and depressant dosages of 750–900 g/t.
3.3.6. Perturbation Curves
The perturbation curves in Figure 12 illustrate how recoveries and grades respond to changes in key flotation variables for UG2 ore. Deviations from baseline conditions reveal distinct sensitivities: nickel recovery peaks within optimal collector dosage and pH ranges but declines sharply beyond these thresholds, highlighting the need for precise reagent control. Copper recovery is highly sensitive to depressant dosage, while zinc remains relatively stable with collector changes but responds more to depressant, pH, and time adjustments. Lead recovery shows marked sensitivity to pH and flotation time, reinforcing the importance of balanced operating conditions. Overall, the curves emphasize the complex interplay of reagents and process variables, guiding operators toward dosage strategies that maximize yields and grades while maintaining efficiency and sustainability.
3.3.7. Post-Optimization Overlay Plot
The overlay plot in Figure 13 provides a holistic view of the interaction between collector and depressant dosages, underscoring their critical role in optimizing both recoveries and grades.
Distinct behaviours are evident across metals: Ni recovery increases with higher collector dosages, but at the expense of copper and zinc grades, reflecting competitive extraction dynamics. Copper recovery remains relatively stable, while lead recovery shows limited sensitivity to dosage changes. The highlighted yellow operational zone identifies conditions where high recoveries coincide with acceptable grades, emphasizing the importance of balanced dosage selection. These findings confirm that optimizing one metal can compromise another, reinforcing the overlay plot’s value as a strategic tool for guiding mineral processing decisions that balance efficiency, profitability, and sustainability.
3.4. Post-Flotation Determination of the Key PGMs Grades Using ICP-OES
ICP-OES analysis from the optimized UG2 flotation runs (Table 9) shows significant enrichment of platinum (12.01–16.51 mg/kg) and palladium (11.57–15.09 mg/kg), while gold remains comparatively low at 0.47 mg/kg. Compared to initial ore values (Pt 1.18 g/t, Pd 1.41 g/t), flotation has effectively concentrated the target PGMs, confirming the efficiency of the optimized reagent conditions.
4. Conclusion
This research has clarified the complex interdependencies governing the extraction of PGMs and base metals from UG2 ore. By integrating advanced characterization techniques with a central composite response surface methodology (RSM), the study systematically explored key flotation parameters and identified optimal conditions for achieving high recoveries and grades. The findings demonstrate the effectiveness of tailored reagent strategies, while also revealing persistent challenges in recovering metals such as zinc, lead, and certain PGMs. These limitations highlight the need for continued innovation in flotation approaches, including improved reagent formulations and operational protocols. Importantly, the study underscores the value of statistical design tools like RSM in optimizing mineral processing operations. Overall, this work establishes a strong foundation for understanding mineral – process interactions in UG2 ore and points to future research on advanced flotation techniques and reagent systems that can enhance recovery, profitability, and sustainability in PGMs extraction.
Acknowledgments
The authors gratefully acknowledge the National Research Foundation (NRF) (Grant number 132291) for their financial support in this research. Special thanks are extended to the UJ DFC Analytical and Mineral Processing Laboratories for supplying the necessary equipment and resources that enabled the successful completion of this research.
Conflicts of Interest
On behalf of all authors, the corresponding author states that there is no conflict of interest.
References
- C. McLaren and J. de Villiers , “The platinum group chemistry and mineralogy of the UG-2 chromitite layer of the Bushveld Complex,” Economic Geology , vol. 77, no. 6, pp. 1348-1366, 1982. [CrossRef]
- L. Cabri, “The Geology, Geochemistry, Mineralogy and Mineral Beneficiation of Platinum-Group Elements,” Canadian Institute of Mining, Metallurgy and Petroleaum, vol. 97, no. 7, pp. 1609-1612, 2002. [CrossRef]
- C. O’Connor and T. Alexandrova , “The Geological Occurrence, Mineralogy, and Processing by Flotation of Platinum Group Minerals (PGMs) in South Africa and Russia,” Minerals , vol. 11, no. 1, p. 54, 2021. [CrossRef]
- K. Corin, B. McFadzean, N. Shackleton and C. O’Connor, “Challenges Related to the Processing of Fines in the Recovery of Platinum Group Minerals (PGMs),” MInerals , vol. 11, no. 5, p. 533, 2021. [CrossRef]
- M. Valenta and H. Mapheto, “Application of fundamentals in optimizing platinum concentrator performance,” The Journal of the Southern African Institute of Mining and Metallurgy , vol. 111, no. 2, pp. 93-101, 2011.
- R. Hennekam, T. Sweere, R. Tjallingii, G. Lange and G. Reichart, “Trace metal analysis of sediment cores using a novel X-ray fluorescence core scanning method,” Quaternary International , vol. 514, pp. 55-67, 2019. [CrossRef]
- G. Zheng , N. Nguyen, L. Ma and A. Nguyen, “Effect of particle shape and surface morphology on flotation: A new insight from the analysis of particle-bubble attachment,” Minerals Engineering , vol. 232, p. 109586, 2025. [CrossRef]
- K. Rawat, N. Sharma and V. Singh , “X-Ray Fluorescence and comparison with other analytical methods (AAS, ICP-AES, LA-ICP-MS, IC, LIBS, SEM-EDS and XRD),” in X-Ray Fluorescence in Biological Sciences: Principles, Instrumentation and Applications, V. Singh, J. Kawai and D. Tripathi, Eds., Wiley , 2022. [CrossRef]
- D. Hlotse, R. Mbaya and M. Shongwe, “Optimization of flotation conditions in the beneficiation of PGMs tailings,” Physicochemical Problems of Mineral Processing , vol. 59, no. 6, p. 176859, 2023. [CrossRef]
- N. Shackleton , “Surface characterization and flotation behaviour of the platinum and palladium arsenide, telluride and sulphide mineral species,” University of Cape Town, Faculty of Engineering & the Built Environment, Department of Chemical Engineering , Cape Town , 2007. http://hdl.handle.net/11427/5403.
- C. Vos, J. Davidtz and J. Miller, “Trithiocarbonates for PGM flotation,” The Journal of the Southern African Institute of Mining and Metallurgy , vol. 107, no. 1, pp. 23-28, 2007. https://journals.co.za/doi/epdf/10.10520/AJA0038223X_3249.
- E. Malenga, A. Mulaba-Bafubiandi and W. Nheta, “Application of the response surface method (RSM) based on central composite design (CCD) and design space (DS) to optimize the flotation and the desliming conditions in the recovery of PGMs from mine sludge,” Separation Science and Technology, vol. 58, no. 1, pp. 147-160, 2022. [CrossRef]
- M. Hay and R. Roy, “A case study of optimising UG2 flotation performance. Part 1: Bench, pilot and plant scale factors which influence Cr2O3 entrainment in UG2 flotation,” Minerals Engineering , vol. 23, no. 11-13, pp. 855-867, 2010. [CrossRef]
- M. Fernandez and W. Nheta, “Optimisation of Pulp Chemistry for the Recovery of Base Metals from Mine Tailings using Froth Flotation,” Instanbul, Turkey , 2024.
- C. O’Connor, “Investigations into the recovery of platinum group minerals from the Platreef ore of the Bushveld Complex of South Africa,” Platinum Metals Review , vol. 57, no. 4, pp. 302-309, 2013. [CrossRef]
- M. Arancibia-Bravo, F. Lucay, F. Sepulveda, L. Cortes and L. Cisternas, “Response Surface Methodology for Copper Flotation Optimization in Saline Systems,” Minerals , vol. 12, no. 9, p. 1131, 2022. [CrossRef]
- G. Mudd and R. Van Der Berg, “Platinum group metals: a unique case study in the sustainability of mineral resources,” Johannesburg, South Africa , 2010.
- L. Kloppers, W. Maree, O. Oyekola and G. Hangone , “Froth flotation of a Merensky Reef platinum bearing ore using mixtures of SIBX with a dithiophosphate and a dithiocarbonate,” Minerals Engineering , vol. 87, pp. 54-58, 2016. [CrossRef]
- Q. Huang , X. Yang and R. Honaker, “Evaluation of frother types for improved flotation revocery and selectivity,” Minerals , vol. 9, no. 10, p. 590, 2019. [CrossRef]
- M. Eitemaei and A. Nguyen, “Characterisation of sphalerite and pyrite surfaces activated by copper sulphate,” Minerals Engineering, vol. 100, pp. 223-232, 2017. [CrossRef]
- S. Farag, H. Ibrahim, A. Amr, M. Asker and A. El-Shafie, “Preparation and characterization of ion exchanger based on bacterial cellulose for heavy metal cation removal,” Egyptian Journal of Chemistry, vol. 62, no. Special Issue - Part 2, pp. 457-465, 2019.
- P. Gong, L. Ren, S. Bao, Y. Zhang, W. Qin and A. Nguyen, “Flotation separation mechanism of rutile and chlorite using CMC as depressant,” Minerals Engineering , vol. 217, p. 108957, 2024. [CrossRef]
- S. Farrokhpay and D. Bradshaw, “Effect of clay minerals on froth stability in mineral flotation - A review,” New Delhi, India , 2012.
- M. Eitemaei, M. Gharabaghi and M. Irannajad, “A review of zinc oxide mineral beneficiation,” Advances in Colloid and Interface Science , vol. 206, pp. 68-78, 2014. [CrossRef]
Figure 1.
Mineralogical composition of UG2 ore as determined by x-ray diffraction.

Figure 2.
Scanning Electron Micrograph of UG2 ore sample at 254x magnification showing different spectra.
Figure 2.
Scanning Electron Micrograph of UG2 ore sample at 254x magnification showing different spectra.

Figure 3.
% Recovery of base metals to the chemical flotation concentrates.

Figure 4.
% Grade of base metals that reported to the chemical flotation concentrates.

Figure 5.
Predicted vs actual plots for recovery of Ni (A), Cu (B), Zn (C) and Pb (D).

Figure 6.
Predicted vs actual plots for grade of Ni (A), Cu (B), Zn (C) and Pb (D).

Figure 7.
Interaction plots of collector (A) and depressant dosages.

Figure 8.
Desirability histogram for flotation parameters optimization.

Figure 9.
Graphical multi-objective optimisation with respective constraints.

Figure 10.
Surface plots showing recovery function of Ni (A), Cu (B), Zn (C) and Pb (D).

Figure 11.
Surface plots depicting grade function of Ni (A), Cu (B), Zn (C) and Pb (D).

Figure 12.
Perturbation curves for metal recovery and grade in UG2 ore flotation.

Figure 13.
Post-optimization overlay plot from confirmatory tests of RSM model.


Table 1.
Design of experiments methodological table for chemical flotation tests.
| FACTORS | LEVELS | UNITS | ||
|---|---|---|---|---|
| Coded Low (-1) | Mean | Coded High (+1) | ||
| Collector dosage | 100 | 350 | 600 | g/t |
| Depressant dosage | 300 | 600 | 900 | g/t |
| Pulp pH | 7 | 8.5 | 10 | |
| Flotation time | 10 | 20 | 30 | minutes |
Table 2.
RSM design table for flotation experiments.
| Run | Collector dosage (g/t) | Depressant dosage (g/t) | Pulp pH | Flotation time (minutes) |
| 1 | 350 | 600 | 8.5 | 20 |
| 2 | 350 | 0 | 8.5 | 20 |
| 3 | 600 | 300 | 7 | 30 |
| 4 | 600 | 300 | 10 | 30 |
| 5 | 600 | 300 | 10 | 10 |
| 6 | 350 | 600 | 8.5 | 20 |
| 7 | 100 | 300 | 7 | 10 |
| 8 | 100 | 900 | 10 | 10 |
| 9 | 600 | 900 | 7 | 10 |
| 10 | 100 | 300 | 10 | 10 |
| 11 | 600 | 900 | 10 | 10 |
| 12 | 350 | 600 | 8.5 | 20 |
| 13 | 350 | 600 | 8.5 | 20 |
| 14 | 350 | 600 | 8.5 | 20 |
| 15 | 600 | 300 | 7 | 10 |
| 16 | 350 | 600 | 5.5 | 20 |
| 17 | -150 | 600 | 8.5 | 20 |
| 18 | 350 | 600 | 8.5 | 20 |
| 19 | 350 | 600 | 8.5 | 0 |
| 20 | 600 | 900 | 7 | 30 |
| 21 | 600 | 900 | 10 | 30 |
| 22 | 100 | 900 | 10 | 30 |
| 23 | 100 | 300 | 10 | 30 |
| 24 | 350 | 600 | 8.5 | 40 |
| 25 | 100 | 900 | 7 | 10 |
| 26 | 350 | 600 | 11.5 | 20 |
| 27 | 100 | 300 | 7 | 30 |
| 28 | 850 | 600 | 8.5 | 20 |
| 29 | 350 | 1200 | 8.5 | 20 |
| 30 | 100 | 900 | 7 | 30 |
Table 3.
Elemental composition of UG2 ore as determined by XRF analysis.
| Elements | Na | Mg | Al | Si | P | S | K | Ca | Ti | V |
| % | 0.41 | 3.48 | 7.80 | 17.65 | 0.02 | 0.08 | 0.26 | 6.34 | 0.36 | 0.10 |
| Elements | Cr | Mn | Fe | Ni | Cu | Zn | Sr | Pb | As | Co |
| % | 7.37 | 0.47 | 13.33 | 0.28 | 0.04 | 0.04 | 0.02 | 0.06 | 0.01 | 0.02 |
Table 4.
EDS data for the micrograph of UG2 ore sample at 254x magnification.
| Spectrum | F | S | Fe | Ni | Cu | Pd | Er | Pt | Au | Probable Phases |
|---|---|---|---|---|---|---|---|---|---|---|
| 1 | 3.59 | 22.49 | 11.85 | 15.81 | 1.15 | 0.08 | 1.07 | 0.93 | 0.93 | Pyrrhotite, Pentlandite, Chalcopyrite, Nickel sulphides (e.g., Millerite, NiS), cooperite or other PGMs |
| Spectrum | Mg | Al | Si | Ca | Ti | Cr | Fe | Pd | Na | Probable Phases |
| 2 | 8.01 | 12.46 | 1.04 | 0.31 | 0.55 | 25.77 | 16.94 | 0.12 | Chromite, Olivine, Serpentine, Titanomagnetite, Aluminosilicates, Palladinite | |
| 3 | 16.61 | 24.95 | 8.22 | 2.78 | Plagioclase, Clay Minerals, Muscovite or Biotite, Calcite |
Table 5.
Recovery fit statistics for Ni, Cu, Zn, and Pb.
| Ni Recovery | Cu Recovery | Zn Recovery | Pb Recovery | |
|---|---|---|---|---|
| Std. Dev. | 3.30 | 24.96 | 15.15 | 36.15 |
| Mean | 15.93 | 72.16 | 16.58 | 80.10 |
| C.V. % | 20.74 | 34.60 | 91.35 | 45.13 |
| R² | 0.6144 | 0.5605 | 0.5354 | 0.3125 |
| Adjusted R² | 0.2546 | 0.1503 | 0.1019 | 0.2025 |
| Predicted R² | -0.2919 | -0.7375 | -1.6573 | 0.0127 |
| Adeq Precision | 5.5969 | 4.8835 | 5,5255 | 5.6461 |
Table 6.
Grade fit statistics for Ni, Cu, Zn, and Pb.
| Ni Grade | Cu Grade | Zn Grade | Pb Grade | |
|---|---|---|---|---|
| Std. Dev. | 0.0541 | 0.0595 | 0.0233 | 0.0172 |
| Mean | 0.3217 | 0.2364 | 0.0705 | 0.0286 |
| C.V. % | 16.81 | 25.15 | 33.03 | 60.15 |
| R² | 0.5390 | 0.7006 | 0.5371 | 0.5626 |
| Adjusted R² | 0.1087 | 0.4211 | 0.1050 | 0.1543 |
| Predicted R² | -1.5417 | -0.5952 | -0.5716 | -0.7099 |
| Adeq Precision | 5.2230 | 7.0478 | 4.5040 | 5.8642 |
Table 7.
Analysis of variance for Ni, Cu, Zn and Pb recovery.
| Source | F-value | P-value | ||||||
|---|---|---|---|---|---|---|---|---|
| Ni | Cu | Zn | Pb | Ni | Cu | Zn | Pb | |
| Model | 1.71 | 1.37 | 1.23 | 2.84 | 0.1577 | 0.2776 | 0.3443 | 0.0454 |
| A | 1.02 | 0.0653 | 0.0748 | 2.81 | 0.3274 | 0.8018 | 0.7882 | 0.1060 |
| B | 0.1128 | 2.88 | 5.36 | 0.3382 | 0.7417 | 0.1101 | 0.0351 | 0.5661 |
| C | 0.8371 | 0.5794 | 0.1064 | 0.3382 | 0.3747 | 0.4584 | 0.7488 | 0.5661 |
| D | 7.26 | 0.1522 | 0.0932 | 7.87 | 0.0167 | 0.7019 | 0.7644 | 0.0096 |
| AB | 2.76 | 0.0417 | 0.0249 | 0.1176 | 0.8409 | 0.8767 | ||
| AC | 2.19 | 1.12 | 0.0288 | 0.1592 | 0.3067 | 0.8675 | ||
| AD | 0.1081 | 0.0396 | 0.0052 | 0.7469 | 0.8450 | 0.9436 | ||
| BC | 0.0029 | 0.9936 | 0.0040 | 0.9577 | 0.3347 | 0.9504 | ||
| BD | 1.08 | 4.76 | 0.0237 | 0.3147 | 0.0455 | 0.8798 | ||
| CD | 0.4999 | 0.5794 | 0.0030 | 0.4904 | 0.4584 | 0.9573 | ||
| A² | 0.0111 | 3.25 | 0.4508 | 0.9176 | 0.0916 | 0.5122 | ||
| B² | 1.69 | 4.96 | 9.36 | 0.2130 | 0.0417 | 0.0079 | ||
| C² | 3.94 | 0.0933 | 0.1425 | 0.0656 | 0.7642 | 0.7111 | ||
| D² | 1.57 | 0.3418 | 0.1976 | 0.2294 | 0.5675 | 0.6630 | ||
| Lack of Fit | 0.3965 | 0.6956 | 53.49 | 0.7303 | 0.9001 | 0.7082 | 0.0002 | 0.7225 |
Table 8.
Analysis of variance for Ni, Cu, Zn and Pb grade.
| Source | F-value | P-value | ||||||
|---|---|---|---|---|---|---|---|---|
| Ni | Cu | Zn | Pb | Ni | Cu | Zn | Pb | |
| Model | 1.25 | 2.51 | 1.24 | 1.38 | 0.3345 | 0.0441 | 0.3398 | 0.2724 |
| A | 0.0847 | 2.61 | 0.4416 | 0.1821 | 0.7750 | 0.1274 | 0.5164 | 0.6756 |
| B | 0.2512 | 0.5328 | 1.03 | 0.0033 | 0.6235 | 0.4767 | 0.3255 | 0.9551 |
| C | 2.24 | 5.37 | 0.0029 | 0.1018 | 0.1553 | 0.0350 | 0.9580 | 0.7541 |
| D | 2.22 | 5.97 | 2.27 | 4.81 | 0.1567 | 0.0274 | 0.1524 | 0.0445 |
| AB | 2.69 | 5.98 | 3.00 | 3.27 | 0.1215 | 0.0273 | 0.1039 | 0.0907 |
| AC | 1.24 | 1.89 | 2.01 | 3.99 | 0.2832 | 0.1891 | 0.1763 | 0.0644 |
| AD | 3.18 | 2.76 | 0.5270 | 0.1363 | 0.0948 | 0.1172 | 0.4791 | 0.7172 |
| BC | 0.0219 | 0.4786 | 0.2748 | 0.8591 | 0.8844 | 0.4996 | 0.6078 | 0.3687 |
| BD | 1.65 | 3.02 | 0.6850 | 3.38 | 0.2184 | 0.1025 | 0.4208 | 0.0860 |
| CD | 0.9018 | 2.79 | 2.58 | 0.2621 | 0.3574 | 0.1153 | 0.1293 | 0.6162 |
| A² | 2.19 | 0.4155 | 0.0283 | 0.4313 | 0.1597 | 0.5289 | 0.8687 | 0.5213 |
| B² | 0.8726 | 1.97 | 2.82 | 0.1950 | 0.3650 | 0.1805 | 0.1139 | 0.6651 |
| C² | 0.0006 | 0.7905 | 0.4272 | 0.5797 | 0.9809 | 0.3880 | 0.5233 | 0.4582 |
| D² | 0.0468 | 0.0611 | 0.6624 | 0.8018 | 0.8316 | 0.8082 | 0.4284 | 0.3847 |
| Lack of Fit | 8.26 | 4.50 | 0.4133 | 0.6670 | 0.0155 | 0.0554 | 0.8902 | 0.7265 |
Table 9.
Key PGMs concentrations as determined by ICP-OES across 5 optimum runs.
| Element | Au (mg/kg) | Pt (mg/kg) | Pd (mg/kg) |
|---|---|---|---|
| Run 3 | 0.32 | 16.51 | 15.09 |
| Run 6 | 0.24 | 12.01 | 11.57 |
| Run 11 | 0.27 | 14.7 | 13.1 |
| Run 19 | 0.47 | 15.04 | 12.88 |
| Run 29 | 0.35 | 16.36 | 14.98 |
Disclaimer/Publisher’s Note: The statements, opinions and data contained in all publications are solely those of the individual author(s) and contributor(s) and not of MDPI and/or the editor(s). MDPI and/or the editor(s) disclaim responsibility for any injury to people or property resulting from any ideas, methods, instructions or products referred to in the content. |
© 2026 by the authors. Licensee MDPI, Basel, Switzerland. This article is an open access article distributed under the terms and conditions of the Creative Commons Attribution (CC BY) license (http://creativecommons.org/licenses/by/4.0/).
Copyright: This open access article is published under a Creative Commons CC BY 4.0 license, which permit the free download, distribution, and reuse, provided that the author and preprint are cited in any reuse.


