

Submitted:
24 March 2026
Posted:
26 March 2026
You are already at the latest version
Abstract
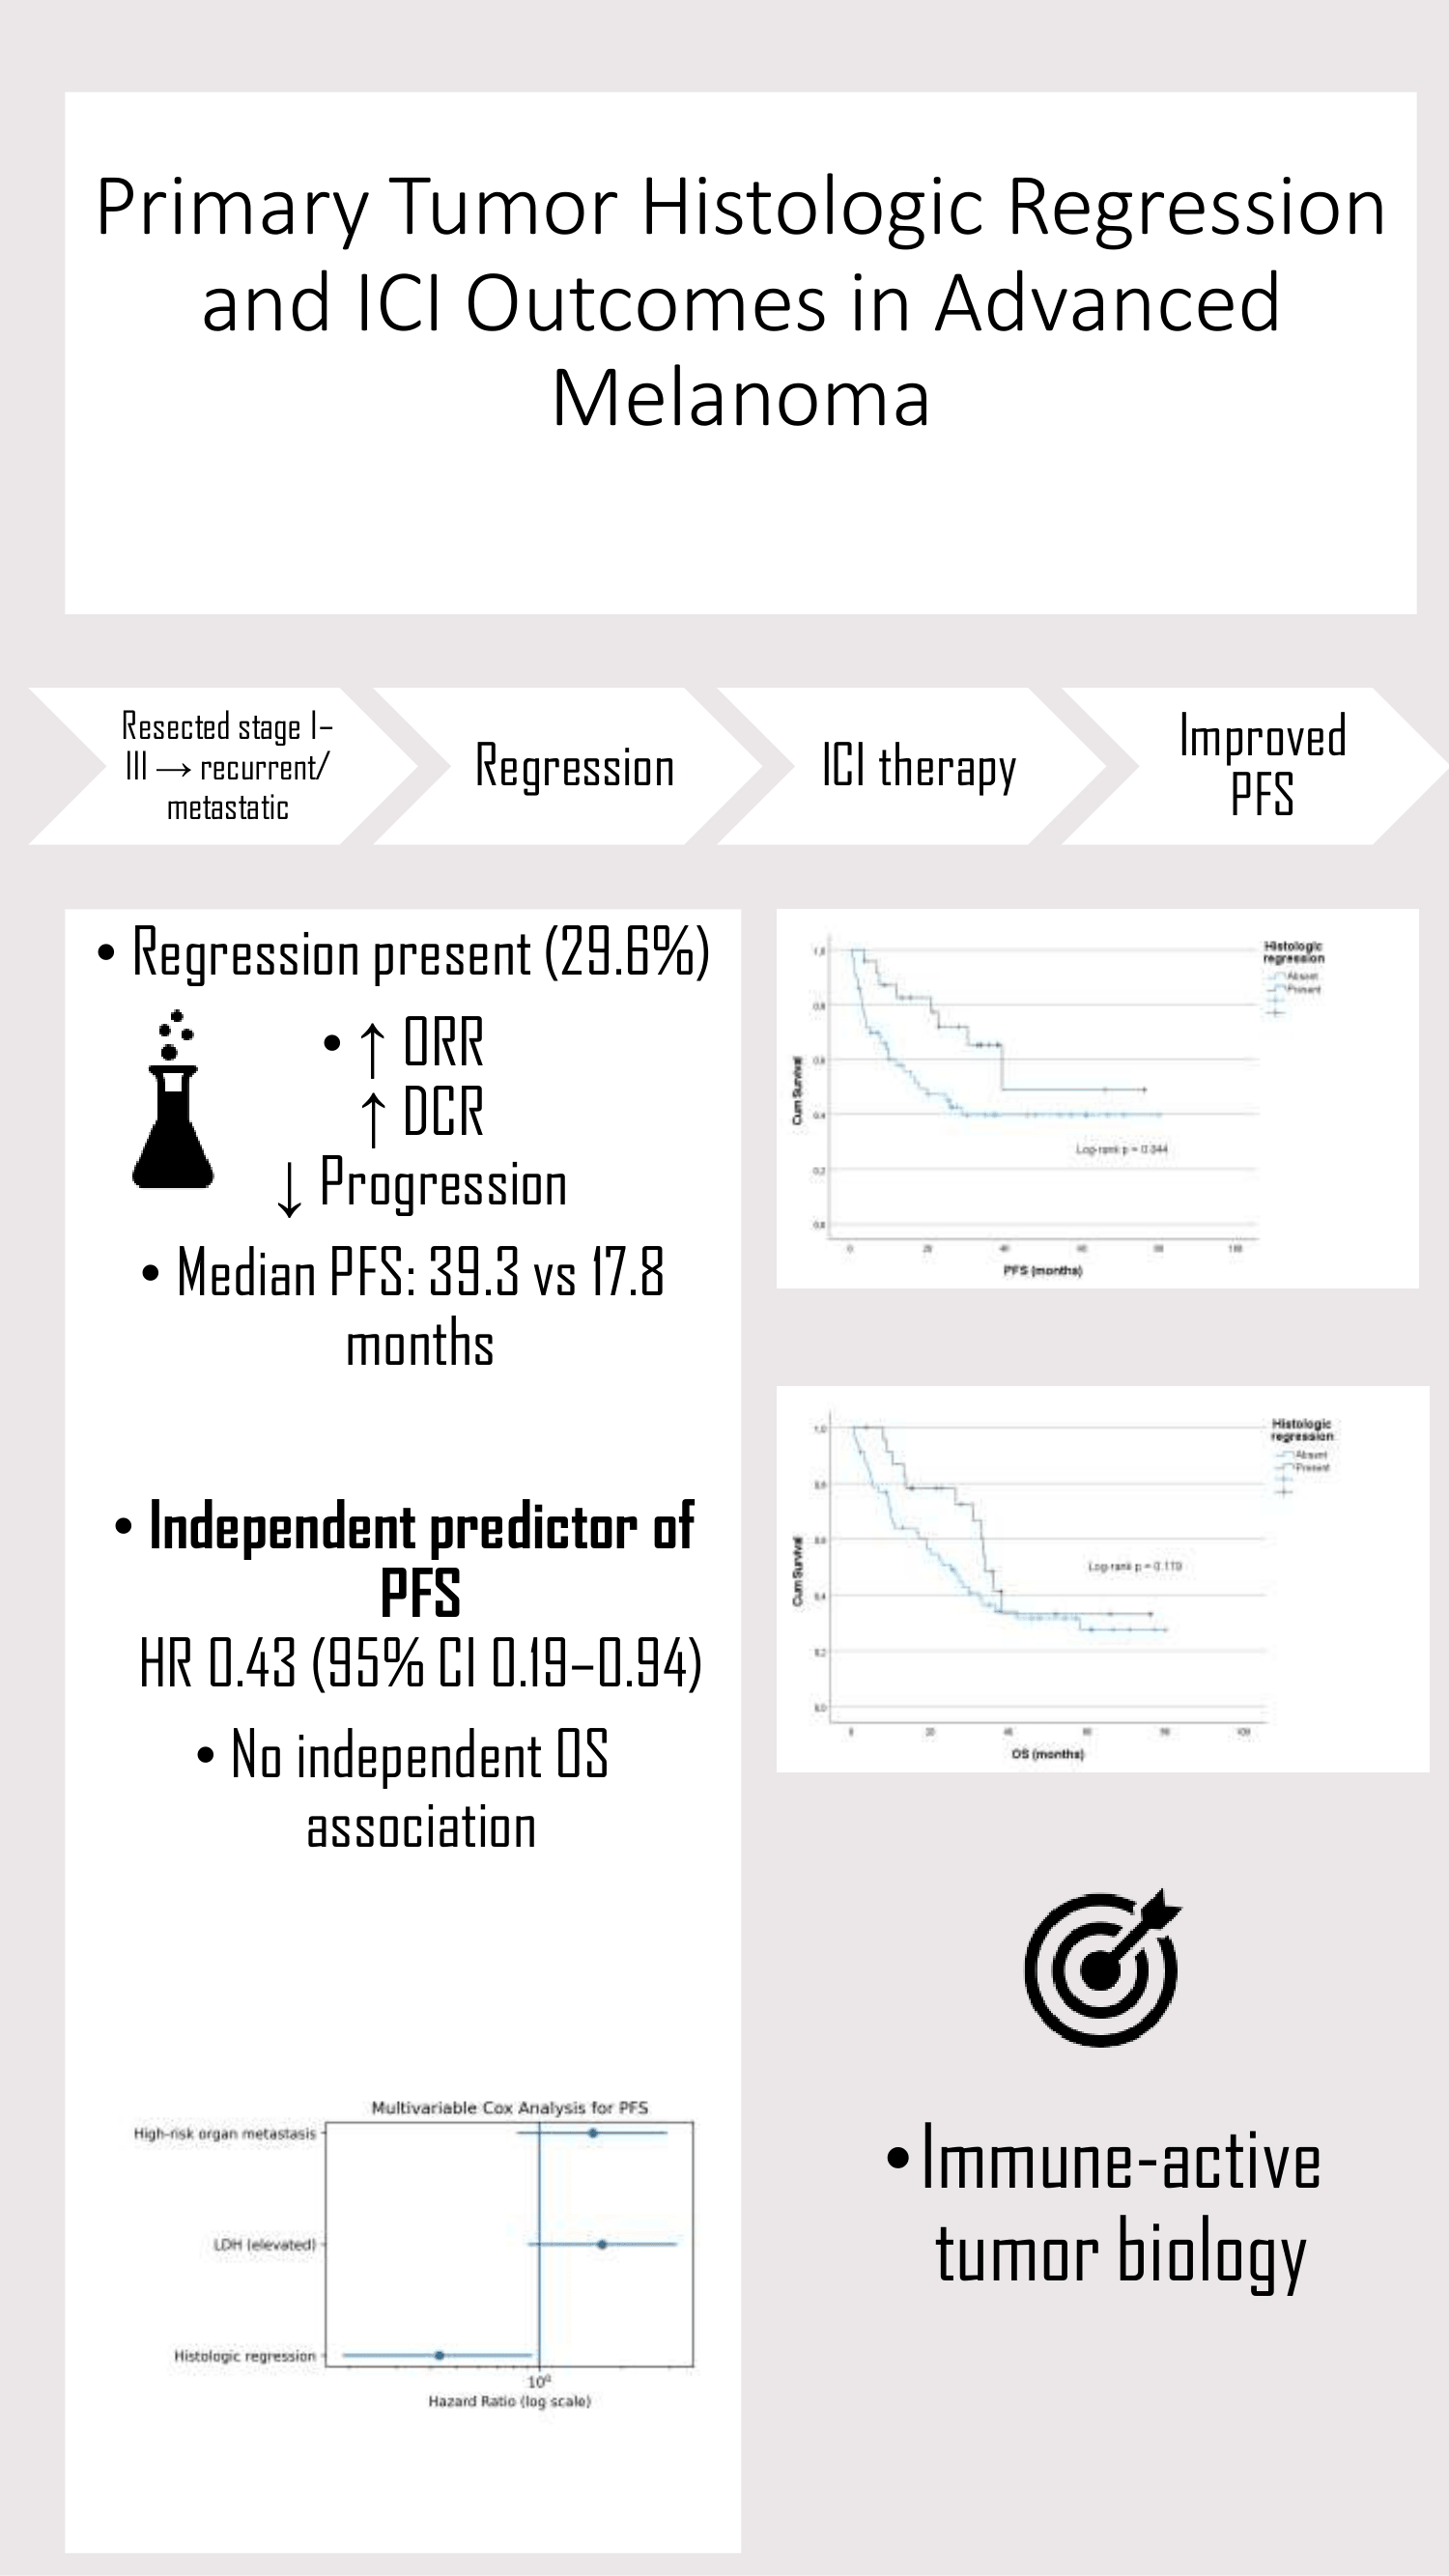
Background/Objectives: Histologic regression in primary cutaneous melanoma has shown inconsistent prognostic associations, and its relevance to immune checkpoint inhibitor (ICI) outcomes in patients who later develop recurrent or metastatic disease remains unclear. Methods: This retrospective single-center cohort included 81 patients with resected stage I–III cutaneous melanoma who later developed recurrent or metastatic disease and received ICIs. Histologic regression was classified as present or absent based on primary pathology reports. Objective response rate (ORR) and disease control rate (DCR) were assessed according to RECIST v1.1. Progression-free survival (PFS) and overall survival (OS) from ICI initiation were estimated using Kaplan–Meier analysis and evaluated with prespecified multivariable Cox models. Results: Histologic regression was identified in 24 patients (29.6%). Baseline characteristics were largely comparable between groups, although regression was more frequent in male patients (83.3% vs 59.6%; p = 0.039). ORR was numerically higher in the regression-present group (58.3% vs 43.9%; p = 0.330), and DCR was also higher (87.5% vs 66.7%; p = 0.061). Median PFS was significantly longer in patients with regression (39.3 vs 17.8 months; log-rank p = 0.044). In multivariable analysis, regression remained independently associated with longer PFS (adjusted HR, 0.43; 95% CI, 0.19–0.94; p = 0.035), whereas no independent association with OS was observed (adjusted HR, 0.54; 95% CI, 0.28–1.06; p = 0.071). Conclusions: In patients with recurrent or metastatic melanoma treated with ICIs, primary tumor histologic regression was independently associated with prolonged PFS but not OS. These findings suggest a potential link between regression and early immune-mediated disease control, while its impact on long-term survival remains uncertain.
Keywords:
melanoma
; histologic regression
; immune checkpoint inhibitors
; progression-free survival
; treatment response
; prognosis
1. Introduction
Melanoma is one of the few solid tumors in which spontaneous regression is relatively common, a phenomenon thought to reflect an immune-mediated antitumor response [1,2]. Several tumor and microenvironmental immune features have been linked to response to immune checkpoint inhibitors (ICIs) [3,4,5], suggesting that histologic regression in the primary tumor may indicate an immune-active phenotype.
Histologic regression is reported in approximately 10–35% of primary cutaneous melanomas [1]. Its prognostic significance, however, remains controversial. In early-stage disease (AJCC stage I–III), regression has been associated with lower rates of sentinel lymph node positivity and, in some studies, improved survival [6,7,8,9]. Conversely, other investigations have reported no association or even adverse outcome [10,11], likely reflecting heterogeneity in definitions and study populations.
Data regarding the clinical relevance of regression in patients who subsequently develop recurrent or metastatic disease remain limited; although emerging real-world studies suggest an association with improved progression-free survival (PFS) during ICI therapy [12,13,14], it is still unclear whether regression reflects a treatment-specific predictive effect or broader underlying tumor biology.
We therefore evaluated the association between histologic regression in the primary tumor and immunotherapy outcomes in patients with initially resected stage I–III cutaneous melanoma who later developed recurrent or metastatic disease.
2. Materials and Methods
2.1. Study Design and Patient Population
This retrospective cohort included patients with resected stage I–III cutaneous melanoma treated at a tertiary academic center between 2016 and 2024 who subsequently developed recurrent or metastatic disease and received immune checkpoint inhibitors (ICIs). Patients with de novo metastatic disease, mucosal or uveal melanoma, or age <18 years were excluded. Missing data were minimal (<5%), and complete-case analyses were performed for Cox regression models.
2.2. Variables and Definitions
Histologic regression was extracted from the original pathology reports of the primary resection and analyzed as a binary variable (present vs absent). Regression was defined according to established dermatopathologic criteria, including partial loss of melanoma cells, dermal fibrosis, melanophages, a lymphocytic infiltrate, and vascular proliferation. All original pathology reports were generated at the same tertiary academic center by experienced dermatopathologists; however, no centralized study-specific re-review was undertaken, and interobserver reproducibility was not formally assessed. Regression subclassification (focal vs extensive) was inconsistently reported and available only in a subset of cases; therefore, subclasses were summarized descriptively and not included in multivariable models due to the limited number of cases.
Primary tumor stage at diagnosis was classified according to the AJCC 8th edition criteria. The T category was defined by Breslow thickness and ulceration status.
Variables were categorized according to the time point of assessment. At initial diagnosis, variables included stage group (III vs I–II), primary pathology group (acral/nodular vs superficial/lentigo), BRAF status (wild-type vs mutant), ulceration (present vs absent), and histologic regression (present vs absent). At ICI initiation, variables included ECOG performance status (≥1 vs 0), immunotherapy regimen (combination vs monotherapy), immunotherapy line (≥2nd vs 1st), comorbidity status (present vs absent), sex, and age (≥65 vs <65).
Serum LDH was dichotomized using the institutional upper limit of normal (225 U/L). High-risk organ metastasis was defined as liver and/or brain involvement at ICI initiation.
2.3. Treatment Response and Outcomes
Recurrence-free interval (RFI) was defined as the time from primary surgery to the first documented recurrence or distant metastasis and was analyzed as a continuous baseline characteristic.
Tumor response to ICI therapy was assessed according to RECIST version 1.1 based on routine radiologic evaluations [15]. The first assessment was typically performed 8–12 weeks after ICI initiation. Independent central radiology review was not performed. Objective response rate (ORR) was defined as the proportion of patients achieving complete or partial response, and disease control rate (DCR) as the proportion achieving complete response, partial response, or stable disease.
PFS was defined as the time from ICI initiation to radiographic progression or death from any cause, whichever occurred first; deaths without prior documented progression were counted as PFS events. Patients without progression were censored at the date of last follow-up.
OS was defined as the time from ICI initiation to death from any cause, with censoring at last follow-up for surviving patients.
Median follow-up was calculated using the reverse Kaplan–Meier method. Among patients with progression, ICI refractoriness was classified as primary (progression at first assessment) or secondary (progression after initial clinical benefit).
2.4. Statistical Analysis
Baseline characteristics were compared using the chi-square or Fisher’s exact test for categorical variables and the Mann–Whitney U test for continuous variables.
PFS and OS were estimated using the Kaplan–Meier method and compared using the log-rank test. PFS was defined as the time from ICI initiation to radiographic progression or death from any cause and was prespecified as the primary endpoint.
Univariable Cox proportional hazards models were used to explore associations with PFS and OS. Multivariable models were constructed using a priori-selected, clinically relevant variables, with the number of observed events taken into account to reduce the risk of overfitting. The proportional hazards assumption was assessed graphically. For PFS, the multivariable model included histologic regression, LDH group, and high-risk organ metastasis. For OS, the model included histologic regression, primary pathology group, ICI treatment line, high-risk organ metastasis, and LDH group.
Hazard ratios (HRs) with 95% confidence intervals (CIs) were reported. All tests were two-sided, with p<0.05 considered statistically significant. Analyses were performed using SPSS version 27.0.
3. Results
3.1. Patient characteristics
A total of 81 patients with initially resected stage I–III melanoma who subsequently developed recurrence and received immune checkpoint inhibitors were included. Stage group and primary tumor characteristics (including ulceration and histologic regression) refer to the initial disease at diagnosis, whereas all patients were treated in the recurrent or metastatic setting. Histologic regression in the primary tumor was identified in 24 patients (29.6%), while 57 patients (70.4%) had no evidence of regression. Subclassification of regression (focal vs extensive/diffuse) was recorded when available and is reported descriptively; given the limited sample size within subgroups, these variables were not included in inferential analyses. Of the 24 regression-positive tumors, 12 (50%) were focal and 12 (50%) were diffuse.
The median age at diagnosis and baseline clinicopathological characteristics are summarized in Table 1. The median follow-up time, calculated using the reverse Kaplan–Meier method, was 52.0 months.
3.2. Baseline Clinicopathological Characteristics According To Histologic Regression
When baseline clinicopathological characteristics were compared by regression status (Table 1), patients with histologic regression were more often male (83.3% vs 59.6%, p=0.039). The primary pathology group and ulceration status did not differ significantly between groups, although ulceration was numerically less frequent in the regression-present cohort. No significant differences were observed in age, ECOG performance status, comorbidity, stage group, BRAF mutation status, LDH group, immunotherapy line or regimen, or high-risk organ metastasis (all p>0.05).
Regression-positive tumors demonstrated a higher prevalence of TIL positivity (87.5% vs 66.7%), with borderline statistical significance (p=0.054), suggesting a potential association with an immune-active tumor microenvironment.
3.3. Treatment Response and Disease Control
RFI was significantly longer in patients with histologic regression (median 17.35 vs 14.16 months; p=0.021).
ORR was numerically higher in the regression-present group (58.3% vs 43.9%), although this difference was not statistically significant (p=0.330). Similarly, DCR was increased (87.5% vs 66.7%), with borderline statistical significance (p=0.061).
Progression during immunotherapy occurred less frequently among patients with regression (33.3% vs 54.4%), consistent with the separation observed in PFS curves. Best overall response distributions according to RECIST v1.1 are summarized in Table 2.
At the time of analysis, mortality was numerically lower in the regression-present group (50.0% vs 64.9%), although this difference was not statistically significant. Among patients with progression (n=39), the distribution of primary versus secondary refractoriness did not differ between groups.
3.4. PFS Outcomes
At the data cut-off (31 January 2026), after a median follow-up of 52.0 months (reverse Kaplan–Meier), there were 53 PFS events.
PFS was analyzed using the Kaplan–Meier method stratified by histologic regression status. In patients without regression, the median PFS was 17.8 months (95% CI, 5.4–30.1), whereas in patients with regression, the median PFS was 39.3 months (95% CI not reached).
The PFS curves demonstrated a significant separation between groups (log-rank p = 0.044). Kaplan–Meier curves stratified by histologic regression status are shown in Figure 1.
3.5. Cox regression Analysis for PFS
In univariable Cox analyses for PFS, histologic regression was associated with a lower hazard of progression (HR 0.46, 95% CI 0.21–1.00; p=0.050). Elevated LDH demonstrated a numerical trend toward worse PFS (HR 1.70, 95% CI 0.91–3.19; p=0.099), whereas high-risk organ metastasis was not significantly associated (HR 1.57, 95% CI 0.83–2.94; p=0.163). Other clinicopathological variables, including stage group, primary pathology group, ulceration, BRAF status, immunotherapy regimen and line, age, sex, and comorbidity status, were not significantly associated with PFS (all p>0.05).
A parsimonious multivariable Cox model was prespecified to avoid overparameterization, including histologic regression (forced as the primary variable of interest), LDH group, and high-risk organ metastasis. Histologic regression remained independently associated with improved PFS (adjusted HR 0.43, 95% CI 0.19–0.94; p=0.035), whereas LDH group and high-risk organ metastasis were not independently associated with PFS (Table 3).
In prespecified sensitivity analyses, additional adjustment for primary pathology group and, separately, for recurrence-free interval (RFI) did not materially change the association between histologic regression and PFS. The regression effect remained statistically significant in both models, whereas neither pathology group nor RFI was independently associated with PFS (Supplementary Table A1).
| Variable | Univariable HR (95% CI) | p | Multivariable HR (95% CI) | p | (2) |
| Histologic regression (present vs absent) | 0.46 (0.21–1.00) | 0.050 | 0.43 (0.19–0.94) | 0.035 | |
| LDH group (high vs low) | 1.70 (0.91–3.19) | 0.099 | 1.56 (0.80–3.05) | 0.191 | |
| High-risk organ metastasis (yes vs no) | 1.57 (0.83–2.94) | 0.163 | 1.48 (0.76–2.87) | 0.245 | |
| Ulceration (present vs absent) | 1.12 (0.578–2.197) | 0.726 | — | — | |
| ECOG (≥1 vs 0) | 1.25 (0.65–2.39) | 0.501 | — | — | |
| Stage group (III vs I–II) | 1.76 (0.81–3.82) | 0.157 | — | — | |
| Primary pathology group (superficial/lentigo vs acral/nodular) | 1.06 (0.568–2.011) | 0.837 | — | — | |
| BRAF (wild-type vs mutant) | 1.34 (0.71–2.51) | 0.364 | — | — | |
| Immunotherapy regimen (combination vs monotherapy) | 1.11 (0.54–2.28) | 0.777 | — | — | |
| Line of immunotherapy (≥2nd line vs 1st line) | 1.43 (0.76–2.69) | 0.267 | — | — | |
| Comorbidity (present vs absent) | 1.00 (0.54–1.86) | 0.997 | — | — | |
| Sex (male vs female) | 0.74 (0.38–1.42) | 0.361 | — | — | |
| Age group (≥65 vs <65) | 0.93 (0.48–1.82) | 0.840 | — | — | |
| Age at diagnosis (per year) | 1.01 (0.99–1.04) | 0.272 | — | — | |
| RFI (per month) | 1.00 (0.97 – 1.02) | 0.993 | — | — | |
| (Table 3). PFS was defined as the time from initiation of immune checkpoint inhibitor (ICI) therapy to radiologic disease progression or death from any cause, whichever occurred first. Patients without an event were censored at the date of last follow-up. Hazard ratios (HRs) and 95% confidence intervals (CIs) were estimated using Cox proportional hazards models. The multivariable model (enter method) included histologic regression (forced as the primary variable of interest), LDH group, and high-risk organ metastasis, selected a priori based on clinical relevance and to ensure model parsimony given the limited number of PFS events. | |||||
3.6. OS Outcomes
At the data cut-off (31 January 2026), there were 49 deaths. OS was analyzed from ICI initiation to death from any cause, with patients censored at the date of last follow-up. Hazard ratios were estimated using Cox proportional hazards models accounting for censoring.
OS was evaluated using the Kaplan–Meier method according to histologic regression status. In patients without regression, the median OS was 25.3 months (95% CI, 15.7–34.9). In patients with regression, the median OS was 33.9 months (95% CI, 30.0–37.9). Although the regression group was numerically longer, the difference in OS between the groups was not statistically significant (log-rank p=0.179). OS curves stratified by histologic regression are shown in Figure 2.
3.7. Cox Regression Analysis for OS
In univariable Cox analyses for OS, high-risk organ metastasis and older age showed numerical associations with worse survival, although neither reached statistical significance. The primary pathology group showed a trend toward improved OS for superficial/lentigo melanoma compared with acral/nodular melanoma (HR 0.600, 95% CI 0.339–1.060; p=0.079). Histologic regression was not significantly associated with OS (HR 0.642, 95% CI 0.334–1.232; p=0.183). Other clinicopathological variables were not significantly associated with OS (all p>0.05). Sex was not associated with PFS or OS and was therefore excluded from multivariable models. Variables were selected a priori based on clinical relevance. The multivariable Cox model (enter method) included primary pathology group, histologic regression (forced as the exposure of interest), ICI treatment line (≥2 vs 1), high-risk organ metastasis, and LDH group.
In multivariable analysis, primary pathology group remained independently associated with OS, with superficial/lentigo melanoma demonstrating improved survival compared with acral/nodular melanoma (adjusted HR 0.499, 95% CI 0.278–0.894; p=0.020). High-risk organ metastasis showed a borderline association with worse OS (adjusted HR 1.828, 95% CI 0.987–3.388; p=0.055). Histologic regression was not independently associated with OS (adjusted HR 0.542; p=0.071). Other variables included in the model were not significantly associated with OS (Table 4).
4. Discussion
In patients with initially resected stage I–III melanoma who later received ICI therapy for recurrent or metastatic disease, histologic regression was associated with numerically higher response and disease control rates and with significantly prolonged PFS. ORR was numerically higher in the regression group (58.3% vs 43.9%), and DCR was increased (87.5% vs 66.7%; p=0.061). Progression during immunotherapy occurred less frequently among patients with regression (33.3% vs 54.4%). Regression was associated with significantly prolonged PFS (39.3 vs 17.8 months; log-rank p=0.044) and remained independently associated with a reduced risk of progression in multivariable analysis (adjusted HR 0.43, 95% CI 0.19–0.94; p=0.035). No independent association with OS was observed.
Histologic regression in primary cutaneous melanoma involves partial tumor loss accompanied by host-response features, including dermal fibrosis and lymphocytic infiltration [1]. A significant methodological concern is potential stage migration, as regression may reduce measurable Breslow thickness and affect T classification [16]. Although international reporting guidelines recommend excluding regressed areas from thickness measurements, interobserver variability and sampling heterogeneity may still lead to discrepancies [17]. However, all patients in this cohort developed metastatic disease and received systemic ICI therapy, making initial stage misclassification unlikely to fully account for the observed PFS difference. Adjustment for primary tumor characteristics in sensitivity analyses did not materially alter the regression effect.
The clinical and prognostic significance of histologic regression remains debated. Systematic reviews have reported lower sentinel lymph node positivity rates and, in some analyses, improved survival associated with regression; however, these findings are inconsistent due to heterogeneous definitions and potential staging bias [1,7,18]. Several individual cohort studies have likewise failed to demonstrate an independent prognostic impact of regression on recurrence-free or overall survival, underscoring the heterogeneity of published results [19,20]. In the present study, regression may represent not only a staging artifact but also a histopathologic correlate of a pre-existing immune-active tumor microenvironment linked to enhanced disease control under immune checkpoint inhibition. Tumor regression reflects an immune-mediated antitumor response and an inflamed tumor microenvironment, providing biological plausibility for improved disease control under ICI therapy [21,22,23]. However, in the absence of immune profiling data and a non-ICI comparator group, regression should be interpreted cautiously as a potential prognostic marker rather than a validated predictive biomarker.
These findings are consistent with emerging real-world evidence in advanced melanoma. Wagner et al. showed that regression in the primary tumor was associated with longer PFS after metastatic recurrence in patients treated with ICIs, whereas no significant association with OS was observed [13]. Similarly, Such et al. reported longer median PFS in stage IV patients with regression (13.1 vs 4.6 months; HR 0.60, 95% CI 0.36–1.00; p=0.05), while OS did not differ significantly [12]. A large retrospective cohort study evaluating primary tumor characteristics in advanced melanoma demonstrated that cutaneous melanoma subtypes exhibit higher response rates and longer PFS and OS compared with acral melanoma or melanoma of unknown primary, underscoring the biological heterogeneity among primary subtypes and the potential for residual confounding in observational analyses [24]. Beyond subtype distribution, pathology-based features indicative of an inflamed tumor microenvironment have been associated with improved response to ICI therapy in metastatic melanoma [25]. In this context, the higher ORR and DCR, lower progression rate, and prolonged PFS observed in the regression-present group are biologically consistent with enhanced antitumor immune activity. Regression-positive tumors also demonstrated a higher prevalence of tumor-infiltrating lymphocytes (87.5% vs 66.7%), with borderline statistical significance (p=0.054). Similarly, melanoma of unknown primary—hypothesized to result from immune-mediated regression—has been linked to favorable ICI outcomes [26,27].
Although melanoma subtypes differ in ICI responsiveness [28], regression was not significantly associated with primary histologic subtype in this cohort. Adjustment for the pathology group did not materially alter the regression–PFS association. While residual confounding cannot be excluded, the findings are more consistent with underlying tumor–immune biology than with subtype imbalance. Larger, molecularly annotated cohorts are needed to clarify whether regression represents an independent predictive marker or reflects broader tumor biology [29].
Large pathology series have reported that regression frequently co-occurs with favorable primary tumor features, including absence of ulceration [30]. In the present cohort, however, ulceration status did not differ significantly according to regression status (p=0.222), although it was numerically less frequent in the regression-present group. This suggests that the observed PFS benefit is unlikely to be explained solely by co-segregation with traditional favorable tumor characteristics.
Collectively, our findings indicate that regression may be more closely associated with early disease control under immunotherapy—reflected by lower progression rates and prolonged PFS—than with long-term survival outcomes. While PFS more directly captures tumor–immune dynamics during active ICI therapy, overall survival appears to be predominantly driven by metastatic tumor biology and disease burden, as evidenced by the independent impact of primary histologic subtype and high-risk organ involvement in the multivariable OS model. In this context, the influence of primary tumor regression may be attenuated by subsequent treatment lines and progressive metastatic burden.
Several limitations should be acknowledged. First, this was a retrospective, single-center study, which introduces the possibility of selection bias and limits external generalizability. The relatively small sample size, particularly the low number of patients and events in the regression-present subgroup, also reduced statistical power and may have limited our ability to detect moderate differences, especially for overall survival.
Second, regression status was derived from routine pathology reports rather than from centralized pathology re-review. As a result, assessment was not standardized, no formal subclassification of regression was available, and interobserver reproducibility could not be evaluated. This may have introduced misclassification and limited the precision of regression-based comparisons.
Third, the study included only patients with initially resected stage I–III cutaneous melanoma who later developed recurrent or metastatic disease and received ICI therapy. Therefore, the findings should not be extrapolated to all patients with early-stage melanoma, do not address the prognostic role of regression in non-metastatic settings, and cannot determine whether the observed associations are specific to ICI-treated populations, as no non-ICI comparator group was available.
Fourth, molecular and immune characterization was limited. Beyond BRAF status, no integrated profiling of PD-L1 expression, tumor mutational burden, immune infiltrates, or transcriptomic features was available. In addition, tumor-infiltrating lymphocytes were assessed qualitatively rather than quantitatively. These limitations preclude mechanistic interpretation and leave open the possibility that unmeasured biologic factors contributed to the observed associations.
Finally, radiologic assessments were performed according to routine clinical practice rather than at protocol-mandated intervals, which may have introduced some variability in the timing of progression detection. As in all observational studies, residual confounding cannot be excluded despite prespecified multivariable analyses designed to minimize overfitting. Multiple outcomes were also examined without formal adjustment for multiplicity; therefore, findings with borderline statistical significance should be interpreted cautiously and considered hypothesis-generating rather than confirmatory.
5. Conclusions
In this real-world cohort of patients with initially resected stage I–III cutaneous melanoma who later developed recurrent or metastatic disease and received ICIs, histologic regression in the primary tumor was associated with improved disease control and longer progression-free survival. In multivariable analysis, regression remained independently associated with a lower risk of progression, but not with overall survival.
These findings suggest that histologic regression may be more relevant to early disease control during immunotherapy than to long-term survival. However, given its potential association with other primary tumor features and the absence of integrated molecular and immune profiling, regression should not be used as a standalone criterion for treatment selection. Larger multicenter studies with standardized regression assessment and comprehensive biologic profiling are needed to clarify whether regression is independently associated with immunotherapy benefit or simply reflects broader underlying tumor biology.
Author Contributions
Conceptualization, A.G., Z.S.G., T.Ö., B.K., and E.G.; Methodology, A.G.; Formal Analysis, A.G.; Data Curation, A.G., Z.S.G., and T.Ö.; Investigation, A.G.; Writing—Original Draft Preparation, A.G.; Writing—Review and Editing, A.G., Z.S.G., and T.Ö.; Supervision, B.K. and E.G. All authors have read and agreed to the published version of the manuscript.
Funding
This research received no external funding.
Institutional Review Board Statement
The study was conducted in accordance with the Declaration of Helsinki and approved by the Ethics Committee of Ege University Faculty of Medicine (Approval No. 25-10.1T/88; 16 October 2025).
Informed Consent Statement
The requirement for informed consent was waived due to the retrospective design and use of anonymized data.
Data Availability Statement
The data presented in this study are available on reasonable request from the corresponding author. The data are not publicly available due to institutional and patient privacy restrictions.
Acknowledgments
We would like to express our sincere gratitude to our colleagues in the Department of Medical Oncology at Ege University Hospital for their invaluable support and collaboration.
Conflicts of Interest
The authors declare no conflicts of interest.
Abbreviations
The following abbreviations are used in this manuscript:
| ICI Immune checkpoint inhibitor ORR Objective response rate DCR Disease control rate PFS Progression-free survival OS Overall survival LDH Lactate dehydrogenase ECOG PS Eastern Cooperative Oncology Group performance status TIL Tumor-infiltrating lymphocytes HR Hazard ratio CI Confidence interval AJCC American Joint Committee on Cancer RFI Recurrence-free interval |
| ICI Immune checkpoint inhibitor ORR Objective response rate DCR Disease control rate PFS Progression-free survival OS Overall survival LDH Lactate dehydrogenase ECOG PS Eastern Cooperative Oncology Group performance status TIL Tumor-infiltrating lymphocytes HR Hazard ratio CI Confidence interval AJCC American Joint Committee on Cancer RFI Recurrence-free interval |
Appendix A
Appendix A.1

Table A1.
Multivariable Cox regression sensitivity analyses for PFS.
| Variable | Univariable HR (95% CI) | p | Primary multivariable aHR* (95% CI) | p | Sensitivity model A† aHR (95% CI) | p | Sensitivity model B‡ aHR (95% CI) | p |
| Histologic regression (present vs absent) | 0.46 (0.21–1.00) | 0.050 | 0.43 (0.19–0.94) | 0.035 | 0.43 (0.19–0.94) | 0.034 | 0.395 (0.175–0.889) | 0.025 |
| High-risk organ metastasis (yes vs no) | 1.57 (0.83–2.94) | 0.163 | 1.48 (0.76–2.87) | 0.245 | 1.57 (0.80–3.07) | 0.189 | 1.53 (0.78–3.01) | 0.214 |
| LDH group (high vs low) | 1.70 (0.91–3.19) | 0.099 | 1.48 (0.76–2.87) | 0.245 | 1.48 (0.76–2.88) | 0.244 | 1.57 (0.80–3.08) | 0.191 |
| Primary pathology group (superficial/lentigo vs acral/nodular) | 1.06 (0.57–2.01) | 0.837 | — | — | 0.96 (0.51–1.80) | 0.887 | — | — |
| RFI (per month) | 1.00 (0.98–1.02) | 0.993 | — | — | — | — | 1.010 (0.986–1.034) | 0.407 |
* Primary multivariable model included histologic regression (forced), LDH group, and high-risk organ metastasis.† Sensitivity model A additionally adjusted for the primary pathology group.‡ Sensitivity model B additionally adjusted for recurrence-free interval (RFI, months; continuous).PFS was defined as the time from initiation of immune checkpoint inhibitor therapy to radiologic progression or death from any cause. Hazard ratios (HRs) and adjusted hazard ratios (aHRs) were estimated using Cox proportional hazards models (enter method). Two-sided p-values <0.05 were considered statistically significant.
References
- Aung, PP; Nagarajan, P; Prieto, VG. Regression in primary cutaneous melanoma: etiopathogenesis and clinical significance. Lab Invest. 2017, 97(6), 657–668. [Google Scholar] [CrossRef]
- Ribero, S. Histological regression in primary melanoma and drug-related immune reaction towards metastatic melanoma: Are they associated?? Med Hypotheses 2020, 143, 110019. [Google Scholar] [CrossRef] [PubMed]
- Ribero, S; Moscarella, E; Ferrara, G; Piana, S; Argenziano, G; Longo, C. Regression in cutaneous melanoma: a comprehensive review from diagnosis to prognosis. J Eur Acad Dermatol Venereol. 2016, 30(12), 2030–2037. [Google Scholar] [CrossRef] [PubMed]
- Auslander, N; Zhang, G; Lee, JS; Frederick, DT; Miao, B; Moll, T; et al. Robust prediction of response to immune checkpoint blockade therapy in metastatic melanoma. Nat Med. 2018, 24(10), 1545–1549. [Google Scholar] [CrossRef]
- Cartron, AM; Aldana, PC; Khachemoune, A. Reporting regression in primary cutaneous melanoma. Part 2: prognosis, evaluation and management. Clin Exp Dermatol 2020, 45(7), 818–823. [Google Scholar] [CrossRef] [PubMed]
- Cartron, AM; Aldana, PC; Khachemoune, A. Reporting regression in primary cutaneous melanoma. Part 1: history, histological criteria and pathogenesis. Clin Exp Dermatol 2021, 46(1), 28–33. [Google Scholar] [CrossRef]
- Gualano, MR; Osella-Abate, S; Scaioli, G; Marra, E; Bert, F; Faure, E; et al. Prognostic role of histological regression in primary cutaneous melanoma: a systematic review and meta-analysis. Br J Dermatol 2018, 178(2), 357–362. [Google Scholar] [CrossRef]
- Ribero, S; Galli, F; Osella-Abate, S; Bertero, L; Cattaneo, L; Merelli, B; et al. Prognostic impact of regression in patients with primary cutaneous melanoma >1 mm in thickness. J Am Acad Dermatol 2019, 80(1), 99–105.e5. [Google Scholar] [CrossRef]
- Kim, E; Obermeyer, I; Rubin, N; Khariwala, SS. Prognostic significance of regression and mitotic rate in head and neck cutaneous melanoma. Laryngoscope Investig Otolaryngol 2021, 6(1), 109–115. [Google Scholar] [CrossRef]
- Zugna, D; Senetta, R; Osella-Abate, S; Fierro, MT; Pisacane, A; Zaccagna, A; et al. Favourable prognostic role of histological regression in stage III positive sentinel lymph node melanoma patients. Br J Cancer 2018, 118(3), 398–404. [Google Scholar] [CrossRef]
- Ribero, S; Osella-Abate, S; Sanlorenzo, M; Savoia, P; Astrua, C; Cavaliere, G; et al. Favourable prognostic role of regression of primary melanoma in AJCC stage I-II patients. Br J Dermatol 2013, 169(6), 1240–5. [Google Scholar] [CrossRef] [PubMed]
- Such, JB; Mansard, S; Zlobecki, M; Chevenet, C; Lambert, C; Bachelerie, M; et al. Impact of melanoma histological regression on first-line immunotherapy response in stage-IV disease. J Eur Acad Dermatol Venereol 2025. [Google Scholar] [CrossRef] [PubMed]
- Wagner, NB; Knierim, SM; Luttermann, F; Metzler, G; Yazdi, AS; Bauer, J; et al. Histopathologic regression in patients with primary cutaneous melanoma undergoing sentinel lymph node biopsy is associated with favorable survival and, after metastasis, with improved progression-free survival on immune checkpoint inhibitor therapy: A single-institutional cohort study. J Am Acad Dermatol 2024, 90(4), 739–748. [Google Scholar]
- Testori, A; De Salvo, GL; Montesco, MC; Trifirò, G; Mocellin, S; Landi, G; et al. Clinical considerations on sentinel node biopsy in melanoma from an Italian multicentric study on 1,313 patients (SOLISM-IMI). Ann Surg Oncol 2009, 16(7), 2018–27. [Google Scholar] [CrossRef] [PubMed]
- Eisenhauer, EA; Therasse, P; Bogaerts, J; Schwartz, LH; Sargent, D; Ford, R; et al. New response evaluation criteria in solid tumours: revised RECIST guideline (version 1.1). Eur J Cancer 2009, 45(2), 228–47. [Google Scholar] [CrossRef]
- Gershenwald, JE; Scolyer, RA; Hess, KR; Sondak, VK; Long, GV; Ross, MI; et al. Melanoma staging: Evidence-based changes in the American Joint Committee on Cancer eighth edition cancer staging manual. CA Cancer J Clin 2017, 67(6), 472–492. [Google Scholar] [CrossRef]
- Scolyer, RA; Judge, MJ; Evans, A; Frishberg, DP; Prieto, VG; Thompson, JF; et al. Data set for pathology reporting of cutaneous invasive melanoma: recommendations from the international collaboration on cancer reporting (ICCR). Am J Surg Pathol 2013, 37(12), 1797–814. [Google Scholar] [CrossRef]
- Ribero, S; Osella-Abate, S; Dika, E; Sportoletti Baduel, E; Marra, E; Picciotto, F; et al. Prognostic role of histological regression in cutaneous melanoma. G Ital Dermatol Venereol 2017, 152(6), 638–641. [Google Scholar] [CrossRef]
- Burton, AL; Gilbert, J; Farmer, RW; Stromberg, AJ; Hagendoorn, L; Ross, MI; et al. Regression does not predict nodal metastasis or survival in patients with cutaneous melanoma. Am Surg 2011, 77(8), 1009–13. [Google Scholar] [CrossRef]
- Oláh, J; Gyulai, R; Korom, I; Varga, E; Dobozy, A. Tumour regression predicts higher risk of sentinel node involvement in thin cutaneous melanomas. Br J Dermatol 2003, 149(3), 662–3. [Google Scholar] [CrossRef]
- Ribero, S; Gualano, MR; Osella-Abate, S; Scaioli, G; Bert, F; Sanlorenzo, M; et al. Association of Histologic Regression in Primary Melanoma With Sentinel Lymph Node Status: A Systematic Review and Meta-analysis. JAMA Dermatol 2015, 151(12), 1301–1307. [Google Scholar] [CrossRef]
- Aivazian, K. Regression in cutaneous melanoma: histological assessment, immune mechanisms and clinical implications. Pathology 2023, 55(2), 227–235. [Google Scholar] [CrossRef] [PubMed]
- Carretero, R; Wang, E; Rodriguez, AI; Reinboth, J; Ascierto, ML; Engle, AM; et al. Regression of melanoma metastases after immunotherapy is associated with activation of antigen presentation and interferon-mediated rejection genes. Int J Cancer 2012, 131(2), 387–95. [Google Scholar] [CrossRef] [PubMed]
- Goodman, RS; Jung, S; Fletcher, K; Burnette, H; Mohyuddin, I; Irlmeier, R; et al. Primary Tumor Characteristics as Biomarkers of Immunotherapy Response in Advanced Melanoma: A Retrospective Cohort Study. Cancers (Basel) 2024, 16(13). [Google Scholar] [CrossRef] [PubMed]
- Dupuis, F; Lamant, L; Gerard, E; Torossian, N; Chaltiel, L; Filleron, T; et al. Clinical, histological and molecular predictors of metastatic melanoma responses to anti-PD-1 immunotherapy. Br J Cancer 2018, 119(2), 193–199. [Google Scholar] [CrossRef]
- Gambichler, T; Chatzipantazi, M; Schröter, U; Stockfleth, E; Gedik, C. Patients with melanoma of unknown primary show better outcome under immune checkpoint inhibitor therapy than patients with known primary: preliminary results. Oncoimmunology 2019, 8(12), p. e1677139. [Google Scholar]
- Persa, OD; Hassel, JC; Steeb, T; Erdmann, M; Karimi, B; Stege, H; et al. Brief Communication: Treatment Outcomes for Advanced Melanoma of Unknown Primary Compared With Melanoma With Known Primary. J Immunother 2024, 47(9), 384–387. [Google Scholar] [CrossRef]
- van Not, OJ; de Meza, MM; van den Eertwegh, AJM; Haanen, JB; Blank, CU; Aarts, MJB; et al. Response to immune checkpoint inhibitors in acral melanoma: A nationwide cohort study. Eur J Cancer 2022, 167, 70–80. [Google Scholar] [CrossRef]
- Dessinioti, C; Befon, A; Plaka, M; Polydorou, D; Kypreou, K; Champsas, G; et al. Independent association of sex, age and the melanoma subtype with histological regression in invasive melanomas: A retrospective study. EJC Skin Cancer 2024. 2, 100020. [Google Scholar] [CrossRef]
- El Sharouni, MA; Aivazian, K; Witkamp, AJ; Sigurdsson, V; van Gils, CH; Scolyer, RA; et al. Association of Histologic Regression With a Favorable Outcome in Patients With Stage 1 and Stage 2 Cutaneous Melanoma. JAMA Dermatol 2021, 157(2), 166–173. [Google Scholar] [CrossRef]
Figure 1.
Kaplan–Meier PFS Curves According to Histologic Regression in the Primary Tumor. PFS from ICI initiation was compared between patients with and without regression. Tick marks indicate censored observations (log-rank p=0.044).
Figure 1.
Kaplan–Meier PFS Curves According to Histologic Regression in the Primary Tumor. PFS from ICI initiation was compared between patients with and without regression. Tick marks indicate censored observations (log-rank p=0.044).
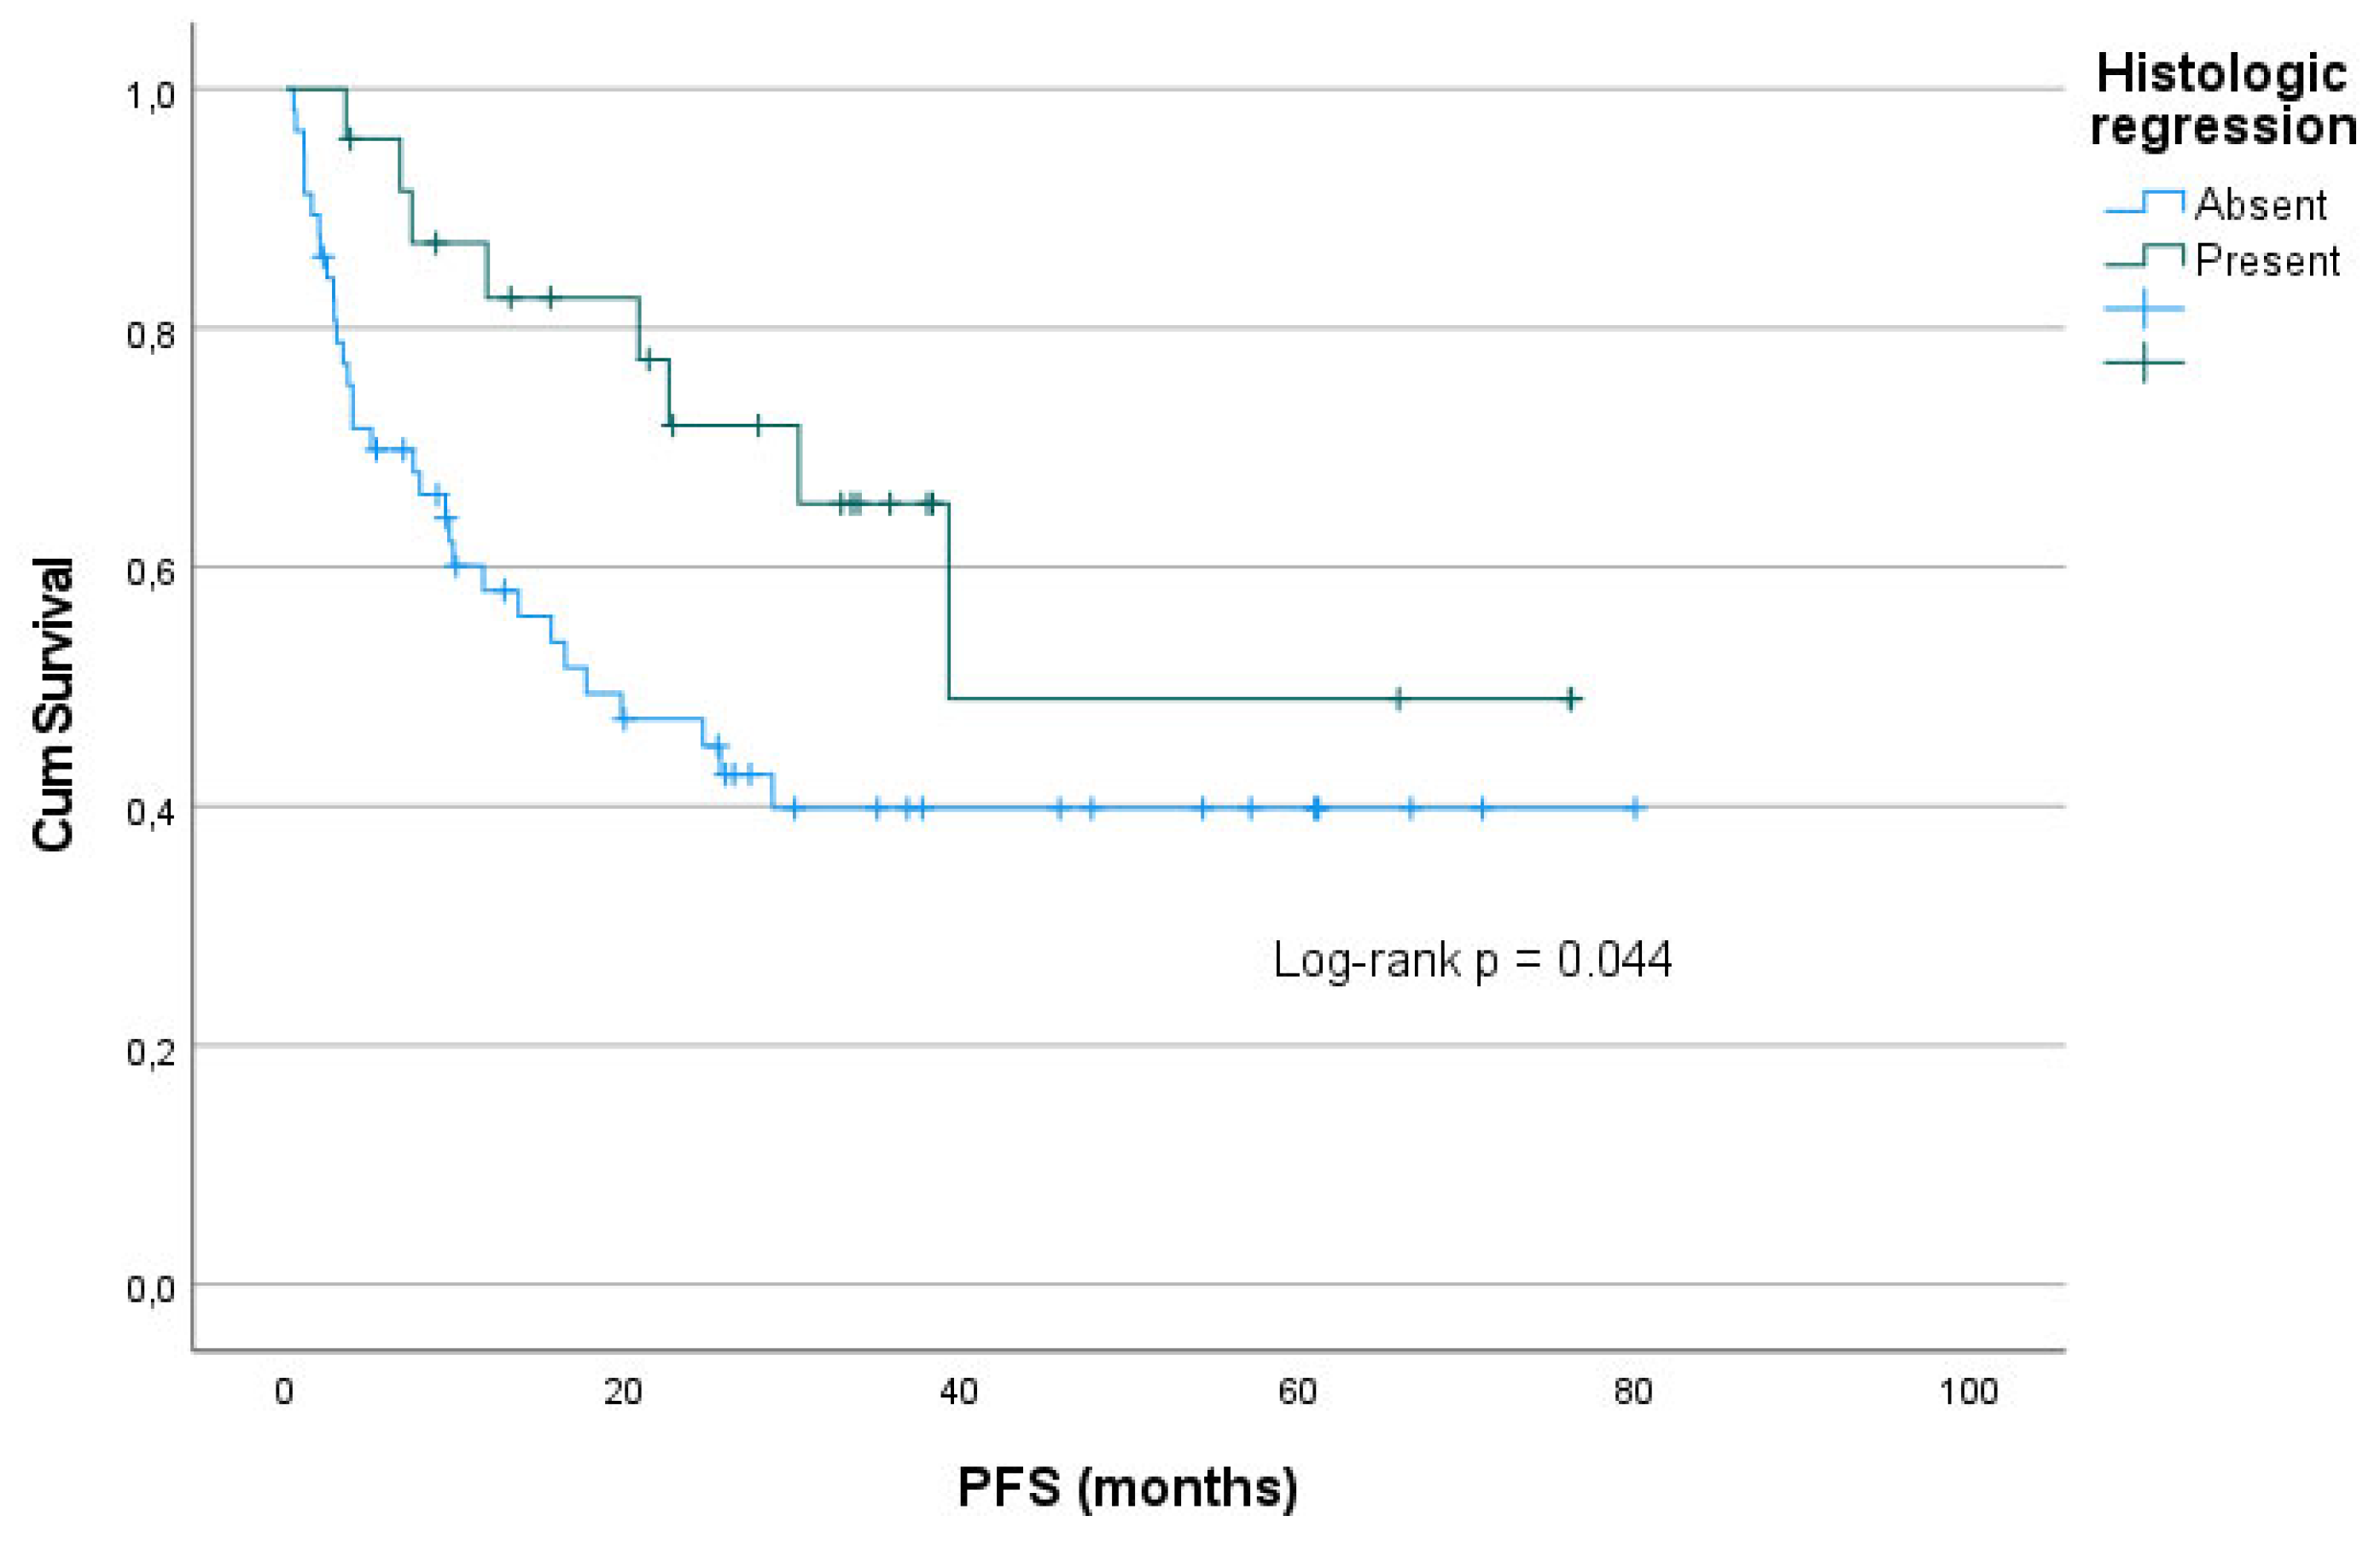
Figure 2.
Kaplan–Meier OS curves stratified by primary tumor histologic regression status. OS was compared between patients with and without histologic regression. Tick marks indicate censored observations (log-rank p=0.179).
Figure 2.
Kaplan–Meier OS curves stratified by primary tumor histologic regression status. OS was compared between patients with and without histologic regression. Tick marks indicate censored observations (log-rank p=0.179).
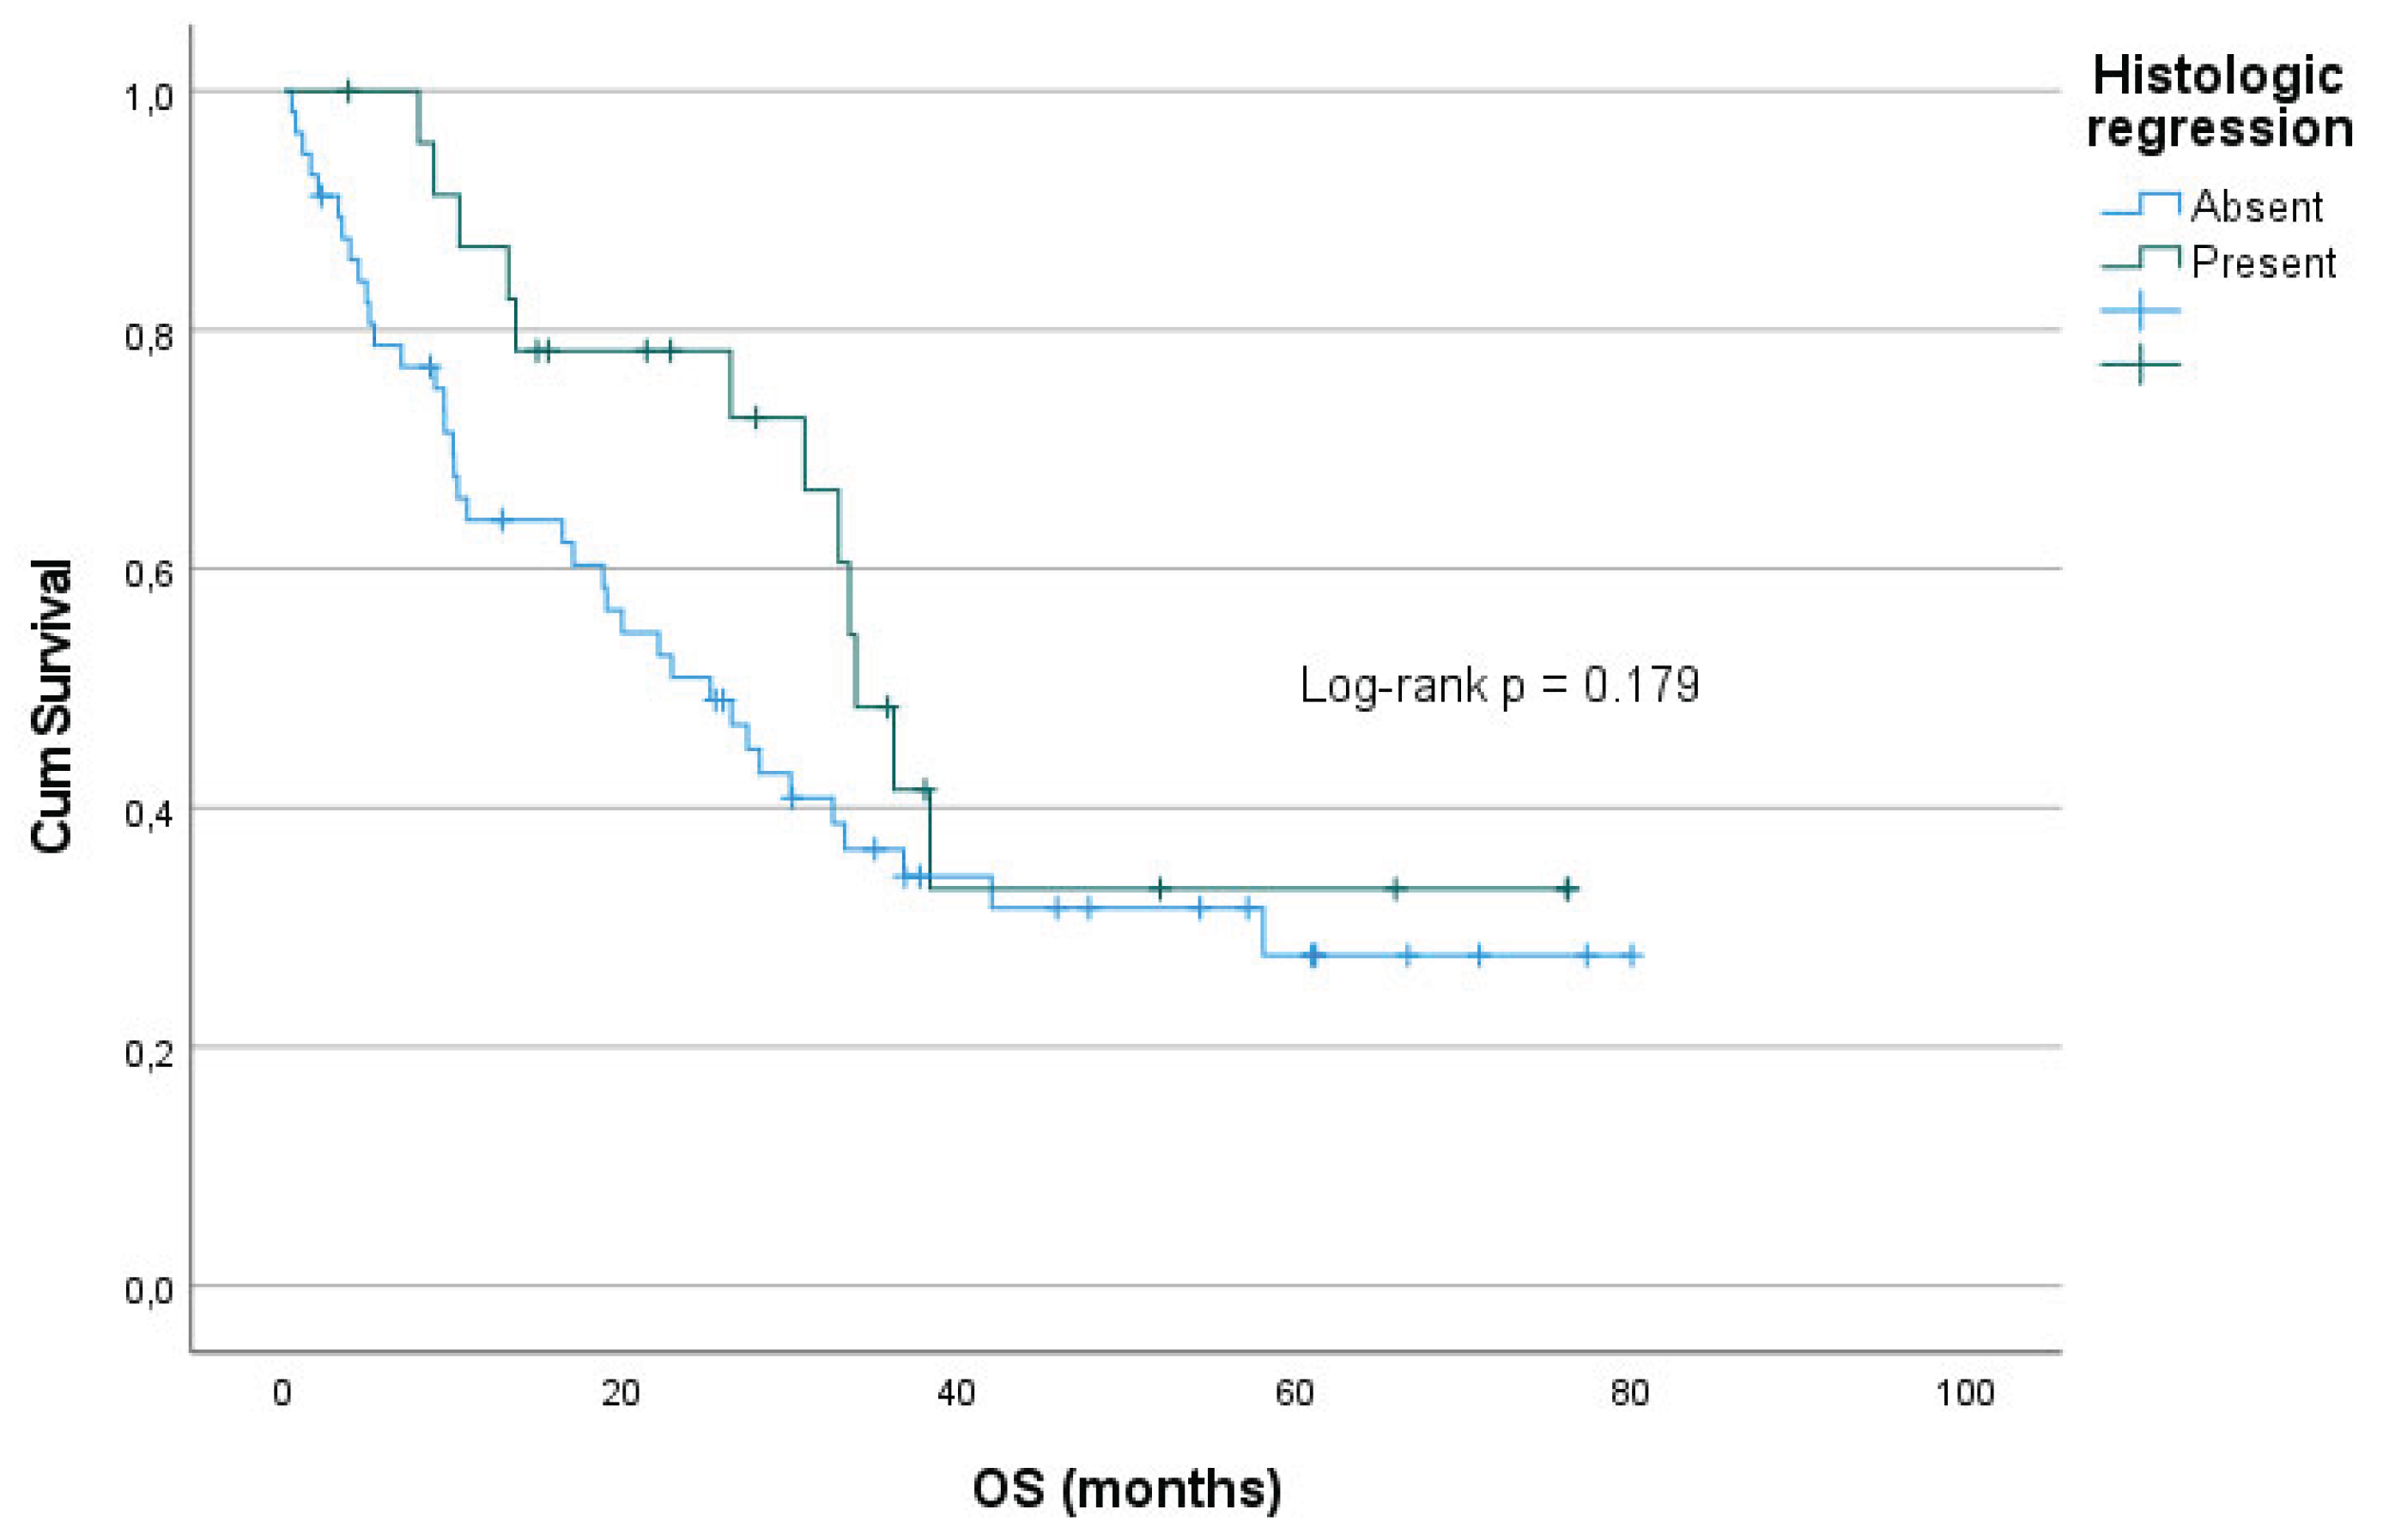
Table 1.
Clinicopathologic characteristics at initial diagnosis and disease/treatment characteristics at ICI initiation according to histologic regression status in the primary tumor.
Table 1.
Clinicopathologic characteristics at initial diagnosis and disease/treatment characteristics at ICI initiation according to histologic regression status in the primary tumor.
| Variable | Overall (n, %) | Regression absent (n, %) | Regression present (n, %) | p-value |
| Age at diagnosis (years), median (IQR) | 60.0 (49.0–68.0) | 60.0 (49.0–68.0) | 58.5 (49.0–65.3) | 0.590 |
| Sex | 0.039 | |||
| Female | 27 (33.3) | 23 (40.4) | 4 (16.7) | |
| Male | 54 (66.7) | 34 (59.6) | 20 (83.3) | |
| Age group | 0.606 | |||
| <65 | 54 (66.7) | 37 (64.9) | 17 (70.8) | |
| ≥65 | 27 (33.3) | 20 (35.1) | 7 (29.2) | |
| ECOG PS at ICI initiation | 0.167 | |||
| 0 | 53 (65.4) | 40 (70.2) | 13 (54.2) | |
| ≥1 | 28 (34.6) | 17 (29.8) | 11 (45.8) | |
| Comorbidity | 0.149 | |||
| Absent | 34 (42.0) | 21 (36.8) | 13 (54.2) | |
| Present | 47 (58.0) | 36 (63.2) | 11 (45.8) | |
| Stage group at diagnosis | 0.238 | |||
| Stage I–II | 23 (28.4) | 14 (24.6) | 9 (37.5) | |
| Stage III | 58 (71.6) | 43 (75.4) | 15 (62.5) | |
| Histology | 0.576 | |||
| Acral/nodular | 41 (50.6) | 30 (52.6) | 11 (45.8) | |
| Superficial spreading/lentigo | 40 (49.4) | 27 (47.4) | 13 (54.2) | |
| BRAF status | 0.501 | |||
| Wild-type | 46 (56.8) | 31 (54.4) | 15 (62.5) | |
| Mutant | 35 (43.2) | 26 (45.6) | 9 (37.5) | |
| Ulceration | 0.222 | |||
| Absent | 29 (35.8) | 18 (31.6) | 11 (45.8) | |
| Present | 52 (64.2) | 39 (68.4) | 13 (54.2) | |
| TIL | ||||
| Absent | 22 (27.2) | 19 (33.3) | 3 (12.5) | 0.054 |
| Present | 59 (72.8) | 38 (66.7) | 21 (87.5) | |
| LDH group | 0.461 | |||
| Low | 49 (60.5) | 33 (57.9) | 16 (66.7) | |
| High | 32 (39.5) | 24 (42.1) | 8 (33.3) | |
| Line of ICI | 0.757 | |||
| 1st line | 46 (56.8) | 33 (57.9) | 13 (54.2) | |
| ≥2nd line | 35 (43.2) | 24 (42.1) | 11 (45.8) | |
| ICI regimen | 0.777 | |||
| Monotherapy | 59 (72.8) | 41 (71.9) | 18 (75.0) | |
| Combination | 22 (27.2) | 16 (28.1) | 6 (25.0) | |
| High-risk organ metastasis | 0.342 | |||
| No | 47 (58.0) | 35 (61.4) | 12 (50.0) | |
| Yes | 34 (42.0) | 22 (38.6) | 12 (50.0) |
(Table 1). Variables in this table refer to two different time points. Stage group, ulceration status, histologic regression, and TIL status were recorded at the time of initial diagnosis from the primary tumor pathology reports. LDH level, presence of high-risk organ metastasis, line of therapy, and ICI regimen were recorded at ICI initiation. Data are presented as n (%) unless otherwise indicated. Continuous variables were summarized as medians (IQRs) and compared using the Mann–Whitney U test. Categorical variables were compared using the Pearson chi-square test or Fisher’s exact test, as appropriate. All p-values were two-sided, and p < 0.05 was considered statistically significant.
Table 2.
Best overall response (RECIST v1.1) according to histologic regression status.
| Best overall response | Regression absent (n=57) | Regression present (n=24) | p value† |
| CR | 8 (14.0%) | 6 (25.0%) | 0.334 |
| PR | 17 (29.8%) | 8 (33.3%) | 0.796 |
| SD | 13 (22.8%) | 7 (29.2%) | 0.580 |
| PD | 19 (33.3%) | 3 (12.5%) | 0.061 |
| ORR (CR+PR) | 25 (43.9%) | 14 (58.3%) | 0.330 |
| DCR (CR+PR+SD) | 38 (66.7%) | 21 (87.5%) | 0.061 |
Table 2. Data are n (%). All p-values were calculated using the two-sided Fisher’s exact test. For clarity, ‘PD as best overall response’ refers to patients whose best RECIST v1.1 response was PD, whereas ‘progression during immunotherapy’ denotes RECIST-confirmed progression occurring at any time during ICI treatment, including after an initial CR/PR/SD.
Table 3.
Univariable and Multivariable Cox Proportional Hazards Regression Analyses for PFS.
| Variable Univariable HR (95% CI) p Multivariable HR (95% CI) p Histologic regression (present vs absent) 0.46 (0.21–1.00) 0.050 0.43 (0.19–0.94) 0.035 LDH group (high vs low) 1.70 (0.91–3.19) 0.099 1.56 (0.80–3.05) 0.191 High-risk organ metastasis (yes vs no) 1.57 (0.83–2.94) 0.163 1.48 (0.76–2.87) 0.245 Ulceration (present vs absent) 1.12 (0.578–2.197) 0.726 — — ECOG (≥1 vs 0) 1.25 (0.65–2.39) 0.501 — — Stage group (III vs I–II) 1.76 (0.81–3.82) 0.157 — — Primary pathology group (superficial/lentigo vs acral/nodular) 1.06 (0.568–2.011) 0.837 — — BRAF (wild-type vs mutant) 1.34 (0.71–2.51) 0.364 — — Immunotherapy regimen (combination vs monotherapy) 1.11 (0.54–2.28) 0.777 — — Line of immunotherapy (≥2nd line vs 1st line) 1.43 (0.76–2.69) 0.267 — — Comorbidity (present vs absent) 1.00 (0.54–1.86) 0.997 — — Sex (male vs female) 0.74 (0.38–1.42) 0.361 — — Age group (≥65 vs <65) 0.93 (0.48–1.82) 0.840 — — Age at diagnosis (per year) 1.01 (0.99–1.04) 0.272 — — RFI (per month) 1.00 (0.97 – 1.02) 0.993 — —(Table 3). PFS was defined as the time from initiation of immune checkpoint inhibitor (ICI) therapy to radiologic disease progression or death from any cause, whichever occurred first. Patients without an event were censored at the date of last follow-up. Hazard ratios (HRs) and 95% confidence intervals (CIs) were estimated using Cox proportional hazards models. The multivariable model (enter method) included histologic regression (forced as the primary variable of interest), LDH group, and high-risk organ metastasis, selected a priori based on clinical relevance and to ensure model parsimony given the limited number of PFS events. |
Variable | Univariable HR (95% CI) | p | Multivariable HR (95% CI) | p | Histologic regression (present vs absent) | 0.46 (0.21–1.00) | 0.050 | 0.43 (0.19–0.94) | 0.035 | LDH group (high vs low) | 1.70 (0.91–3.19) | 0.099 | 1.56 (0.80–3.05) | 0.191 | High-risk organ metastasis (yes vs no) | 1.57 (0.83–2.94) | 0.163 | 1.48 (0.76–2.87) | 0.245 | Ulceration (present vs absent) | 1.12 (0.578–2.197) | 0.726 | — | — | ECOG (≥1 vs 0) | 1.25 (0.65–2.39) | 0.501 | — | — | Stage group (III vs I–II) | 1.76 (0.81–3.82) | 0.157 | — | — | Primary pathology group (superficial/lentigo vs acral/nodular) | 1.06 (0.568–2.011) | 0.837 | — | — | BRAF (wild-type vs mutant) | 1.34 (0.71–2.51) | 0.364 | — | — | Immunotherapy regimen (combination vs monotherapy) | 1.11 (0.54–2.28) | 0.777 | — | — | Line of immunotherapy (≥2nd line vs 1st line) | 1.43 (0.76–2.69) | 0.267 | — | — | Comorbidity (present vs absent) | 1.00 (0.54–1.86) | 0.997 | — | — | Sex (male vs female) | 0.74 (0.38–1.42) | 0.361 | — | — | Age group (≥65 vs <65) | 0.93 (0.48–1.82) | 0.840 | — | — | Age at diagnosis (per year) | 1.01 (0.99–1.04) | 0.272 | — | — | RFI (per month) | 1.00 (0.97 – 1.02) | 0.993 | — | — | (2) |
| Variable | Univariable HR (95% CI) | p | Multivariable HR (95% CI) | p | |||||||||||||||||||||||||||||||||||||||||||||||||||||||||||||||||||||||||||||
| Histologic regression (present vs absent) | 0.46 (0.21–1.00) | 0.050 | 0.43 (0.19–0.94) | 0.035 | |||||||||||||||||||||||||||||||||||||||||||||||||||||||||||||||||||||||||||||
| LDH group (high vs low) | 1.70 (0.91–3.19) | 0.099 | 1.56 (0.80–3.05) | 0.191 | |||||||||||||||||||||||||||||||||||||||||||||||||||||||||||||||||||||||||||||
| High-risk organ metastasis (yes vs no) | 1.57 (0.83–2.94) | 0.163 | 1.48 (0.76–2.87) | 0.245 | |||||||||||||||||||||||||||||||||||||||||||||||||||||||||||||||||||||||||||||
| Ulceration (present vs absent) | 1.12 (0.578–2.197) | 0.726 | — | — | |||||||||||||||||||||||||||||||||||||||||||||||||||||||||||||||||||||||||||||
| ECOG (≥1 vs 0) | 1.25 (0.65–2.39) | 0.501 | — | — | |||||||||||||||||||||||||||||||||||||||||||||||||||||||||||||||||||||||||||||
| Stage group (III vs I–II) | 1.76 (0.81–3.82) | 0.157 | — | — | |||||||||||||||||||||||||||||||||||||||||||||||||||||||||||||||||||||||||||||
| Primary pathology group (superficial/lentigo vs acral/nodular) | 1.06 (0.568–2.011) | 0.837 | — | — | |||||||||||||||||||||||||||||||||||||||||||||||||||||||||||||||||||||||||||||
| BRAF (wild-type vs mutant) | 1.34 (0.71–2.51) | 0.364 | — | — | |||||||||||||||||||||||||||||||||||||||||||||||||||||||||||||||||||||||||||||
| Immunotherapy regimen (combination vs monotherapy) | 1.11 (0.54–2.28) | 0.777 | — | — | |||||||||||||||||||||||||||||||||||||||||||||||||||||||||||||||||||||||||||||
| Line of immunotherapy (≥2nd line vs 1st line) | 1.43 (0.76–2.69) | 0.267 | — | — | |||||||||||||||||||||||||||||||||||||||||||||||||||||||||||||||||||||||||||||
| Comorbidity (present vs absent) | 1.00 (0.54–1.86) | 0.997 | — | — | |||||||||||||||||||||||||||||||||||||||||||||||||||||||||||||||||||||||||||||
| Sex (male vs female) | 0.74 (0.38–1.42) | 0.361 | — | — | |||||||||||||||||||||||||||||||||||||||||||||||||||||||||||||||||||||||||||||
| Age group (≥65 vs <65) | 0.93 (0.48–1.82) | 0.840 | — | — | |||||||||||||||||||||||||||||||||||||||||||||||||||||||||||||||||||||||||||||
| Age at diagnosis (per year) | 1.01 (0.99–1.04) | 0.272 | — | — | |||||||||||||||||||||||||||||||||||||||||||||||||||||||||||||||||||||||||||||
| RFI (per month) | 1.00 (0.97 – 1.02) | 0.993 | — | — |
Table 4.
Univariable and Multivariable Cox Proportional Hazards Regression Analyses for OS.
| Variable | Univariable HR (95% CI) | p | Multivariable HR (95% CI) | p |
| Histologic regression (present vs absent) | 0.642 (0.334–1.232) | 0.183 | 0.542 (0.279–1.055) | 0.071 |
| Sex (male vs female) | 0.839 (0.457–1.543) | 0.573 | — | — |
| Age at diagnosis (per year) | 1.021 (0.999–1.042) | 0.060 | — | — |
| Age group (≥65 vs <65) | 1.236 (0.683–2.239) | 0.484 | — | — |
| Comorbidity (present vs absent) | 1.095 (0.603–1.986) | 0.766 | — | — |
| Stage group (III vs I–II) | 1.646 (0.817–3.320) | 0.163 | — | — |
| Primary pathology group (superficial/lentigo vs acral/nodular) | 0.600 (0.339–1.060) | 0.079 | 0.499 (0.278–0.894) | 0.020 |
| BRAF (wild-type vs mutant) | 1.203 (0.671–2.157) | 0.535 | — | — |
| Ulceration (present vs absent) | 1.180 (0.643–2.172) | 0.591 | — | — |
| LDH group (high vs low) | 1.533 (0.874–2.688) | 0.136 | 1.328 (0.719–2.453) | 0.365 |
| Immunotherapy regimen (combination vs monotherapy) | 1.087 (0.565–2.094) | 0.802 | — | — |
| Line of immunotherapy (≥2nd vs 1st line) | 1.577 (0.898–2.769) | 0.113 | 1.563 (0.886–2.757) | 0.123 |
| ECOG (≥1 vs 0) | 1.572 (0.872–2.836) | 0.133 | — | — |
| High-risk organ metastasis (present vs absent) | 1.735 (0.989–3.045) | 0.055 | 1.828 (0.987–3.388) | 0.055 |
(Table 4). Univariable Cox proportional hazards regression analyses were performed to explore potential prognostic factors for overall survival. A multivariable Cox proportional hazards model (enter method) was prespecified and included histologic regression (forced as the primary exposure of interest), primary pathology group, line of immunotherapy (≥2nd vs 1st), high-risk organ metastasis, and LDH group, selected a priori based on clinical relevance. Hazard ratios (HRs) are reported with corresponding 95% confidence intervals (CIs).
Disclaimer/Publisher’s Note: The statements, opinions and data contained in all publications are solely those of the individual author(s) and contributor(s) and not of MDPI and/or the editor(s). MDPI and/or the editor(s) disclaim responsibility for any injury to people or property resulting from any ideas, methods, instructions or products referred to in the content. |
© 2026 by the authors. Licensee MDPI, Basel, Switzerland. This article is an open access article distributed under the terms and conditions of the Creative Commons Attribution (CC BY) license (http://creativecommons.org/licenses/by/4.0/).
Copyright: This open access article is published under a Creative Commons CC BY 4.0 license, which permit the free download, distribution, and reuse, provided that the author and preprint are cited in any reuse.


