

Submitted:
25 March 2026
Posted:
26 March 2026
You are already at the latest version
Abstract
A radial-polarization-based interferometric method is proposed for measuring object surface profiles. In the proposed approach, a radially polarized beam is generated by transmitting a linearly polarized beam through a zero-order vortex half-wave plate and is then introduced into a modified Twyman–Green interferometer, in which the test specimen is placed in one interferometric arm. By introducing a small variation in the wavelength illumination, two interferometric intensity patterns are recorded using a CMOS camera. The corresponding phase difference distribution is retrieved from the recorded intensities and subsequently used to reconstruct the surface profile of the specimen. The feasibility of the proposed method is experimentally validated by measuring a convex mirror, and the results show good agreement with theoretical predictions. Owing to its simple optical configuration, ease of alignment, high measurement accuracy, and rapid measurement capability, the proposed method demonstrates strong potential for practical surface profile measurement applications.
Keywords:
radial polarized beam
; surface profile measurement
; dual-wavelength measurement technique
1. Introduction
In precision manufacturing and engineering applications, surface profile measurement plays a crucial role in quality control and performance evaluation, and is widely used in industrial processes, precision components, and biomedical engineering. Therefore, the development of measurement techniques with both high accuracy and high efficiency is of great importance. Existing surface profilometry methods can be broadly classified into contact and non-contact approaches. Contact probe techniques [1,2] acquire surface topography through mechanical scanning and offer structural simplicity; however, non-contact methods are generally more suitable for delicate or high-precision samples. Optical probe techniques [3,4,5,6] replace mechanical probes with laser scanning and intensity detection, thereby eliminating physical contact. Nevertheless, three-dimensional measurements typically require point-by-point scanning, which may limit measurement speed.
Interferometric techniques have been widely adopted due to their non-contact operation, full-field capability, and high resolution, and have been extensively applied in the measurement of distance, surface roughness, and refractive index [7,8,9,10]. Conventional single-wavelength interferometers are limited in measurement range by the optical wavelength, whereas dual-wavelength techniques [11,12,13] extend the measurable range and enhance phase unwrapping capability using a synthetic wavelength. White-light interferometry [14,15] further enables absolute height determination by exploiting low-coherence characteristics. In addition, fringe projection [16,17,18,19] and Moiré interferometry [20,21,22,23] are commonly employed for three-dimensional surface reconstruction, and can be combined with heterodyne techniques to improve measurement stability [24].
Based on these developments, this study proposes a cylindrical vector beam interferometric profilometry method. A radially polarized cylindrical vector beam is employed as the illumination source, taking advantage of its axisymmetric polarization distribution. The system is implemented using a Twyman–Green interferometer configuration integrated with a dual-wavelength technique to establish a compact and rapid surface profilometry system. Only two interferograms are required to complete phase retrieval and surface reconstruction. Experimental validation using a standard gauge block demonstrates a system resolution of 61.42 μm, with a measurable range extended to the centimeter scale. The proposed method provides non-destructive, full-field, and rapid measurement capabilities with a relatively simple and cost-effective configuration.
2. Principles
Figure 1 schematically depicts the experimental configuration employed in this study. For clarity, the positive z-axis is defined along the direction of light propagation, while the x-axis is oriented perpendicular to the plane of the paper. A linearly polarized laser beam with wavelength λ, whose polarization direction is oriented at 90° with respect to the x-axis, is expanded and collimated by a beam expander (BE). Subsequently, the linearly polarized beam is transformed into a radially polarized symmetric beam using a zero-order vortex half-wave plate (ZR). The corresponding Jones vector can be expressed as
where ω0 denotes the angular frequency of the light source, and θ represents the azimuthal angle at a given position in the beam cross section. The radially polarized beam is then divided into transmitted and reflected components by a beam splitter (BS). The transmitted beam is normally incident on the test specimen and is reflected back along its original optical path. The associated Jones vector is given by
where φ(x, y) represents the phase difference distribution introduced by the specimen. Meanwhile, the reflected beam is directed toward a mirror (M) and retraces its original path after reflection. Its Jones vector can be written as
The two beams are recombined at the BS and subsequently detected by a CMOS camera (C). The resulting Jones vector at the CMOS plane is therefore expressed as
Accordingly, the intensity recorded by the CMOS camera can be derived as
From Eq. (5), the phase difference distribution φ(x, y) can be retrieved as
Since the phase difference induced by the specimen is related to its surface height distribution by φ(x, y) = 4πD(x, y)/λ, Eq. (6) can be further rewritten as
where D(x, y) denotes the surface height distribution of the specimen. To extend the unambiguous measurement range, the illumination wavelength is changed to λ′, leading to a modified phase difference distribution
The resulting phase difference variation can therefore be expressed as
This phase variation can also be represented in terms of an equivalent wavelength Λ as
where . Consequently, the surface height distribution D(x, y) of the specimen can be determined as
As indicated by Eq. (11), accurate measurements of the intensities I and I′ enable quantitative retrieval of the specimen surface height. By applying this procedure to each pixel of the CMOS image, the full surface profile of the tested object can be reconstructed.
3. Experimental Results and Discussions
To assess the feasibility of the proposed method, the first to fifth steps of a standard step gauge were measured, and the specifications are shown in Figure 2. The experimental system consisted of a tunable diode laser (Model 6304, New Focus) operating at wavelengths of λ = 632.8 nm and λ′ = 632.82 nm, corresponding to a wavelength difference of Δλ = 0.02 nm. The optical configuration further included a beam expander equipped with a 40× objective, a 5 μm pinhole, an achromatic lens with a focal length of 70 mm, and a zero-order vortex half-wave plate (ZR, WPV10L-633, Thorlabs). The interference patterns were recorded using a CMOS camera (Basler A504k, Basler AG) with an 8-bit gray level and a spatial resolution of 1280 × 1024 pixels. All captured images were processed and analyzed using MATLAB on a personal computer.
The interference patterns captured at wavelengths of 632.8 nm and 632.82 nm are shown in Figure 3. For computational convenience, the recorded interferograms were normalized in intensity using a MATLAB program, as illustrated in Figure 4. Subsequently, Eq. (9) was employed to convert the normalized intensity distribution into a three-dimensional phase distribution, as shown in Figure 5, where the phase values range from 15° to 45°. Finally, the surface profile of the standard step gauge was reconstructed using Eqs. (10) and (11), and the resulting contour map is presented in Figure 6.
The reconstructed data of each step were averaged to obtain the recovered step heights of layers i–v, which were 6.96 mm, 3.95 mm, 3.07 mm, 2.80 mm, and 2.71 mm, respectively. The corresponding step height differences were 3.01 mm, 0.88 mm, 0.27 mm, and 0.09 mm. These results are summarized in Table 1. As shown in Table 1, the reconstructed values exhibit good agreement with the standard values, thereby demonstrating the feasibility of the proposed method.
According to Eq. (11), the height error ∆Derr associated with the proposed method can be expressed as
where ΔIerr and ΔI′err denote the intensity errors of the CMOS camera, and ∆λerr and ∆λ′err represent the wavelength uncertainties of the tunable laser source. Considering the intensity resolution of the CMOS camera, the values of ΔIerr and ΔI′err were estimated to be 0.0039. In addition, based on the wavelength resolution of the tunable diode laser (Model 6304, New Focus), both ∆λerr and ∆λ′err were determined to be 0.02 nm. Substituting these parameters into Eq. (12) yields a height error ΔDerr of approximately 61.42 μm. To further reduce the measurement uncertainty, a CMOS camera with a 16-bit gray level was employed. Under the same experimental conditions, the corresponding height error was reduced to 36.62 μm. This error analysis confirms that the proposed method provides high measurement accuracy and enhanced resolution.
4. Conclusions
A radial-polarization-based interferometric system for surface profile measurement is proposed, which integrates the properties of radially polarized beams, a modified Twyman–Green interferometer, and dual-wavelength measurement technology. The feasibility of the proposed approach was experimentally verified by measuring a convex mirror, resulting in a height error of approximately 61.42 μm. The experimental results demonstrate that the proposed method effectively combines the advantages of these techniques, including a simple optical configuration, rapid measurement capability, high measurement accuracy, and enhanced spatial resolution.
Author Contributions
Conceptualization, Y.C.C., K.H.C., Data curation, W.E.B.; Investigation, W.E.B.; Methodology, K.H.C., W.E.B.; Writing—original draft, K.H.C.; Writing—review and editing, Y.C.C., J.H.C. All authors have read and agreed to the published version of the manuscript.
Funding
National Science Council of the Republic of China, Taiwan (Nos. 114–2221–E–035–012 and 114–2221–E–035–013–MY2).
Data Availability Statement
Data underlying the results presented in this paper are not publicly available at this time but may be obtained from the authors upon reasonable request.
Conflicts of Interest
The authors declare no conflict of interest.
References
- Yu, B.; Ru, Q.; Sun, A.; Han, R.B.; Qu, K.; Ju, B.F. A contact probe based on multi-focus spectral confocal method for in-site measurement of form and position errors of complex surface workpieces. Rev. Sci. Instrum. 2025, 96, 035005. [Google Scholar] [CrossRef] [PubMed]
- Park, J.; Cho, Y.J.; Chegal, W.; Lee, J.; Jang, Y.S.; Jin, J. A review of thin-film thickness measurements using optical methods. Int. J. Precis. Eng. Manuf. 2024, 25, 1725–1737. [Google Scholar] [CrossRef]
- Ružbarský, J. Roughness Control of Surfaces Using a Laser Profilometer with the Selected Material Cutting Technology. Materials (Basel) 2023, 31, 4109. [Google Scholar] [CrossRef] [PubMed]
- Kapłonek, W.; Mikolajczyk, T.; Pimenov, D.Y.; Gupta, M.K.; Mia, M.; Sharma, S.; Patra, K.; Sutowska, M. High-Accuracy 3D Optical Profilometry for Analysis of Surface Condition of Modern Circulated Coins. Materials 2020, 13, 5371. [Google Scholar] [CrossRef] [PubMed]
- Huang, P.S.; Xu, X.R. Design of an optical probe for surface profile measurement. Opt. Eng. 1999, 38, 1223–1228. [Google Scholar] [CrossRef]
- Sugawara, H.; Yanagihara, M.; Asaoka, S.; Okusawa, M.; Maezaws, H. Development and performance of a profilometer for measurement of mirror surface figure. Journal of Electron Spectroscopy and Related Phenomena 1996, 80, 485–488. [Google Scholar] [CrossRef]
- Wang, D.; Ma, D.; Li, K.; Zhang, Y.; Zhao, J.; Wang, Y.; Rong, L. Dynamic full-field refractive index distribution measurements using total internal reflection terahertz digital holography. Photon. Res. 2022, 10, 289–296. [Google Scholar] [CrossRef]
- Tsai, H.H.; Tsai, Y.J.; Lee, J.Y.; Cao, T.H. One-shot polarization interferometry for measurement of surface profile. Measurement: Sensors 2025, 38, 101827. [Google Scholar] [CrossRef]
- Chen, K.H.; Wang, Y.H.; Chen, J.H.; Lin, C.H. Full-field refractive index measurement using absolute-phase total internal reflection heterodyne interferometry. Applied Physics B-Lasers and Optics. 2020, 126, 109. [Google Scholar] [CrossRef]
- Ma, H.; Liu, S.; Tao, T.; Chen, L.; Tang, L.; Li, C.; Wu, J.; Jia, X.; Wang, X.; Weng, J. A high-performance ranging method with a long distance range and high accuracy. Optik 2022, 253, 168526. [Google Scholar] [CrossRef]
- Yi, L.; Jiang, Z.; Sun, A.; He, X.; Kong, Y.; Liu, C.; Wang, L. Rough surface profile measurement with spherical illuminating dual-wavelength shearing interferometry. Optics Communications 2026, 602, 132768. [Google Scholar] [CrossRef]
- Yan, Y.; Veetil, S.P.; Zhu, P.; Gao, F.; Kong, Y.; He, X.; Sun, A.; Jiang, Z.; Liu, C. Compact Single-Shot Dual-Wavelength Interferometry for Large Object Measurement with Rough Surfaces. Photonics 2024, 11, 518. [Google Scholar] [CrossRef]
- Kim, Y.; Hibino, K.; Kizaki, T.; Sugita, N.; Mitsuishi, M. Simultaneous interferometric measurement of the absolute thickness and surface shape of a transparent plate using wavelength tuning Fourier analysis and phase shifting. Precision Engineering 2017, 48, 347–351. [Google Scholar] [CrossRef]
- Guo, T.; Li, F.; Chen, J.; Fu, X.; Hu, X. Multi-wavelength phase-shifting interferometry for micro-structures measurement based on color image processing in white light interference. Optics and Lasers in Engineering 2016, 82, 41–47. [Google Scholar]
- Arieli, Y.; Epshtein, S.; Yakubov, I.; Weitzman, Y.; Locketz, G.; Harris, A. Surface measurements by white light spatial-phase-shift imaging interferometry. Opt. Express 2014, 22, 15632–15638. [Google Scholar] [CrossRef]
- Zhang, C.; Wang, G.; Gong, Z.; Lei, H.; Gong, P. Improving 3D measurement accuracy of fringe projection profilometry for complex textured objects by reducing projector-camera pixel matching errors. Optics and Lasers in Engineering 2026, 201, 109661. [Google Scholar] [CrossRef]
- Sanchez-Torres, M.; Hernández-Capuchin, I.; Ramírez-Fernández, C.; Clemente, E.; Sánchez-González, J.L.J.; López-Martínez, A. Recent Advances in Digital Fringe Projection Profilometry (2022–2025): Techniques, Applications, and Metrological Challenges—A Review. Metrology 2026, 6, 3. [Google Scholar] [CrossRef]
- Xu, Y.; Jia, S.; Luo, X.; Yang, J.; Zhang, Y. Multi-frequency projected fringe profilometry for measuring objects with large depth discontinuities. Optics Communications 2013, 288, 27–30. [Google Scholar] [CrossRef]
- Chen, Y.; He, Y.; Hu, E. Phase deviation analysis and phase retrieval for partial intensity saturation in phase-shifting projected fringe profilometry. Optics Communications 2008, 281, 3087–3090. [Google Scholar] [CrossRef]
- Chang, W.Y.; Chen, K.H.; Chen, D.C.; Tseng, J.K.; Chen, S.T.; Sun, H.Y.; Chen, J.H.; Hsu, K.Y. Heterodyne moiré interferometry for measuring corneal surface profile. Optics and Lasers in Engineering 2014, 54, 232–235. [Google Scholar] [CrossRef]
- Chen, K.H.; Tsai, C.H.; Hung, S.C.; Chen, J.H. Surface profile measurement using heterodyne moiré signals with an adjustable grating period. Appl. Opt. 2026, 65, G10–G16. [Google Scholar] [CrossRef]
- Dirckx, J.J.J.; Decraemer, W.F.; Dielis, G. Phase shift method based on object translation for full field automatic 3-D surface reconstruction from Moiré topograms. Appl. Opt. 1988, 27, 1164–1169. [Google Scholar] [CrossRef] [PubMed]
- Quan, C.; Fu, Y.; Tay, C.J.; Tan, J.M. Profiling of objects with height steps by wavelet analysis of shadow moiré fringes. Appl. Opt. 2005, 44, 3284–3290. [Google Scholar] [CrossRef] [PubMed]
- Chang, W.Y.; Hsu, F.H.; Chen, K.H.; Chen, J.H.; Hsu, K.Y. Heterodyne moiré surface profilometry. Opt. Express 2014, 22, 2845–2852. [Google Scholar] [CrossRef] [PubMed]
Figure 1.
The experimental setup of the proposed method.
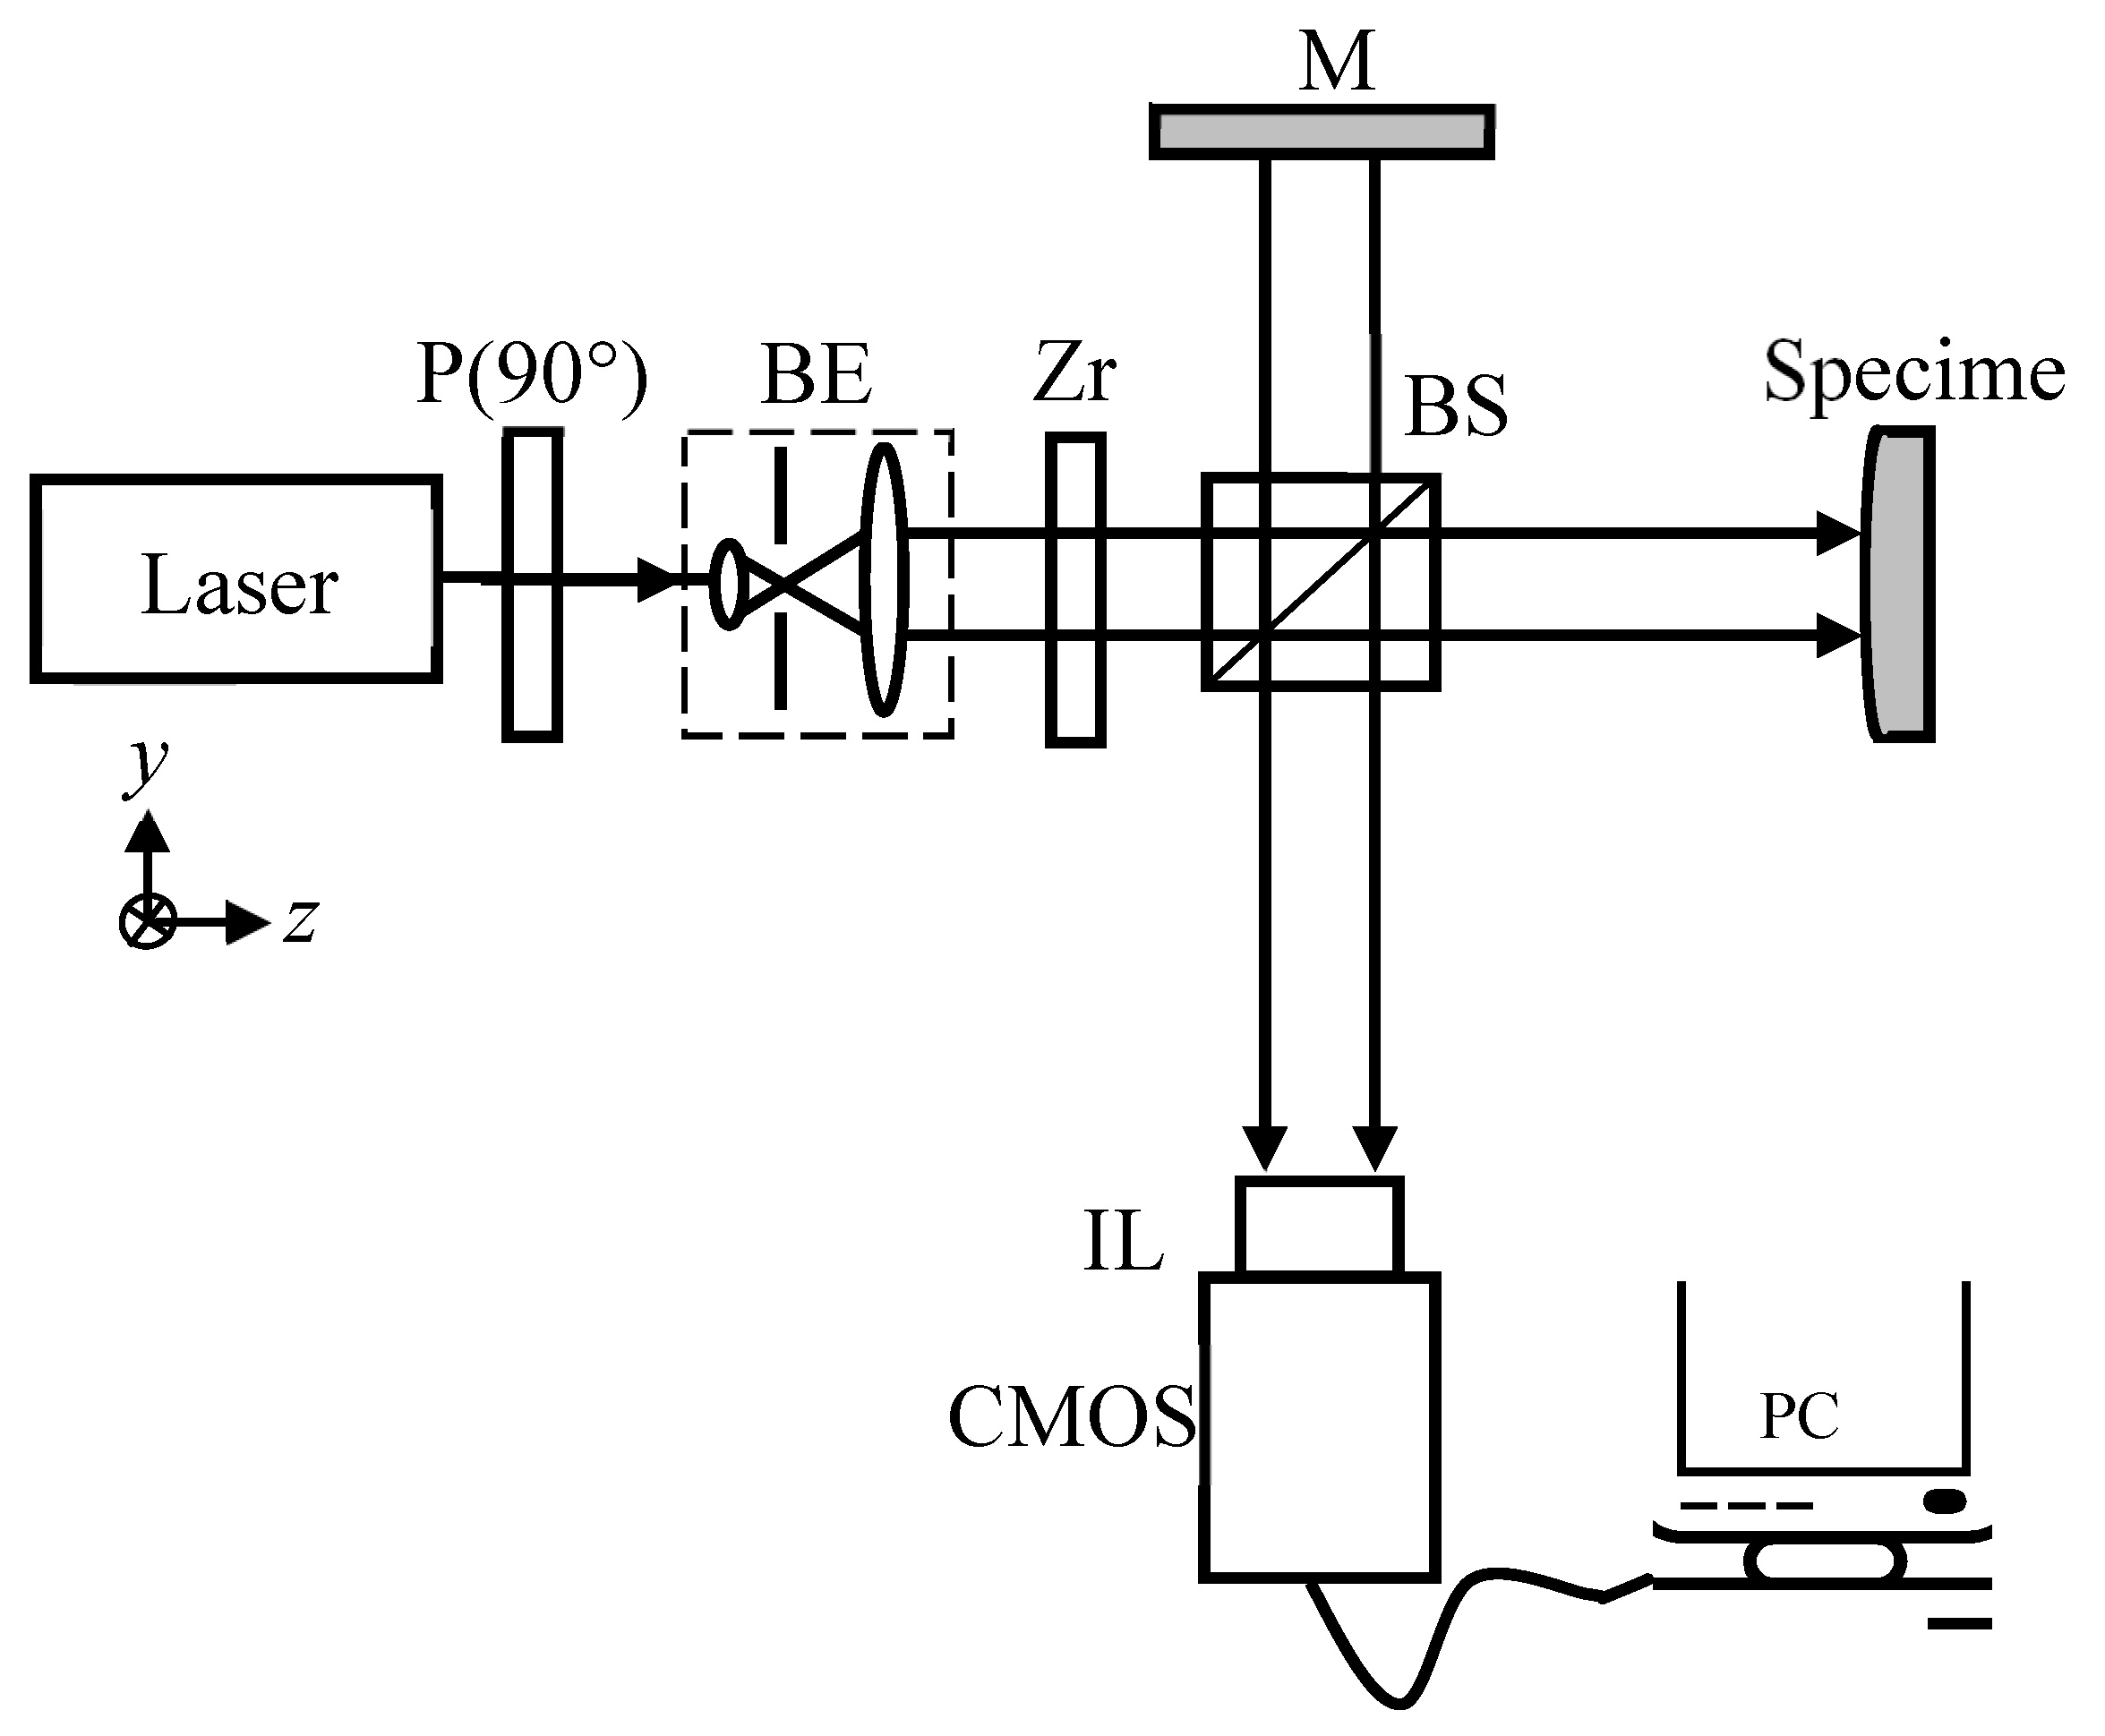
Figure 2.
Schematic diagram of the standard step gauge specifications.
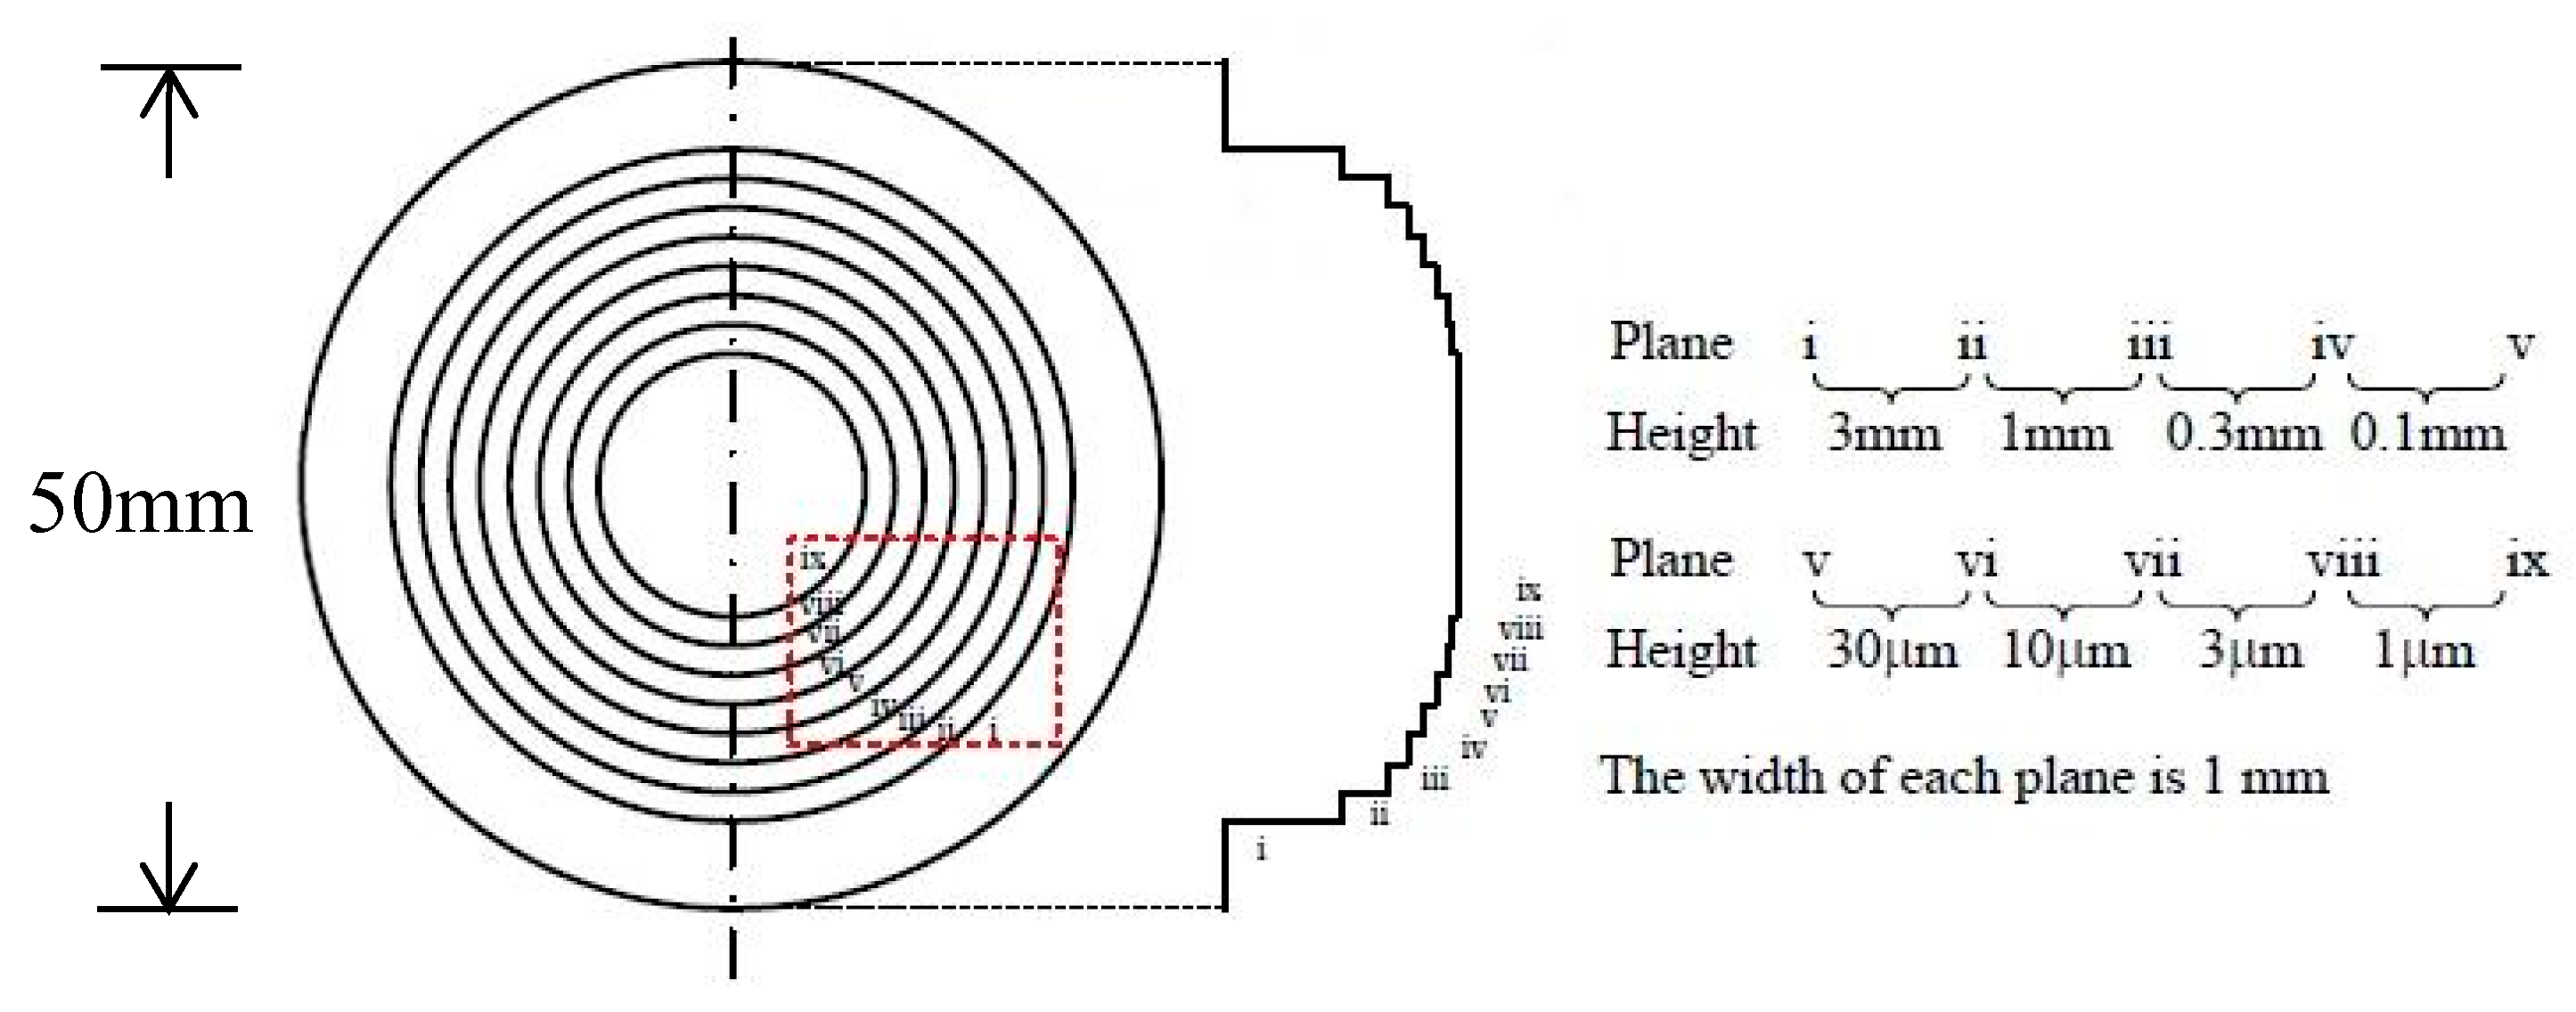
Figure 3.
The results of two interferometric images for different wavelengths; (a) the wavelength at 632.8 nm and (b) the wavelength at 632.82 nm.
Figure 3.
The results of two interferometric images for different wavelengths; (a) the wavelength at 632.8 nm and (b) the wavelength at 632.82 nm.
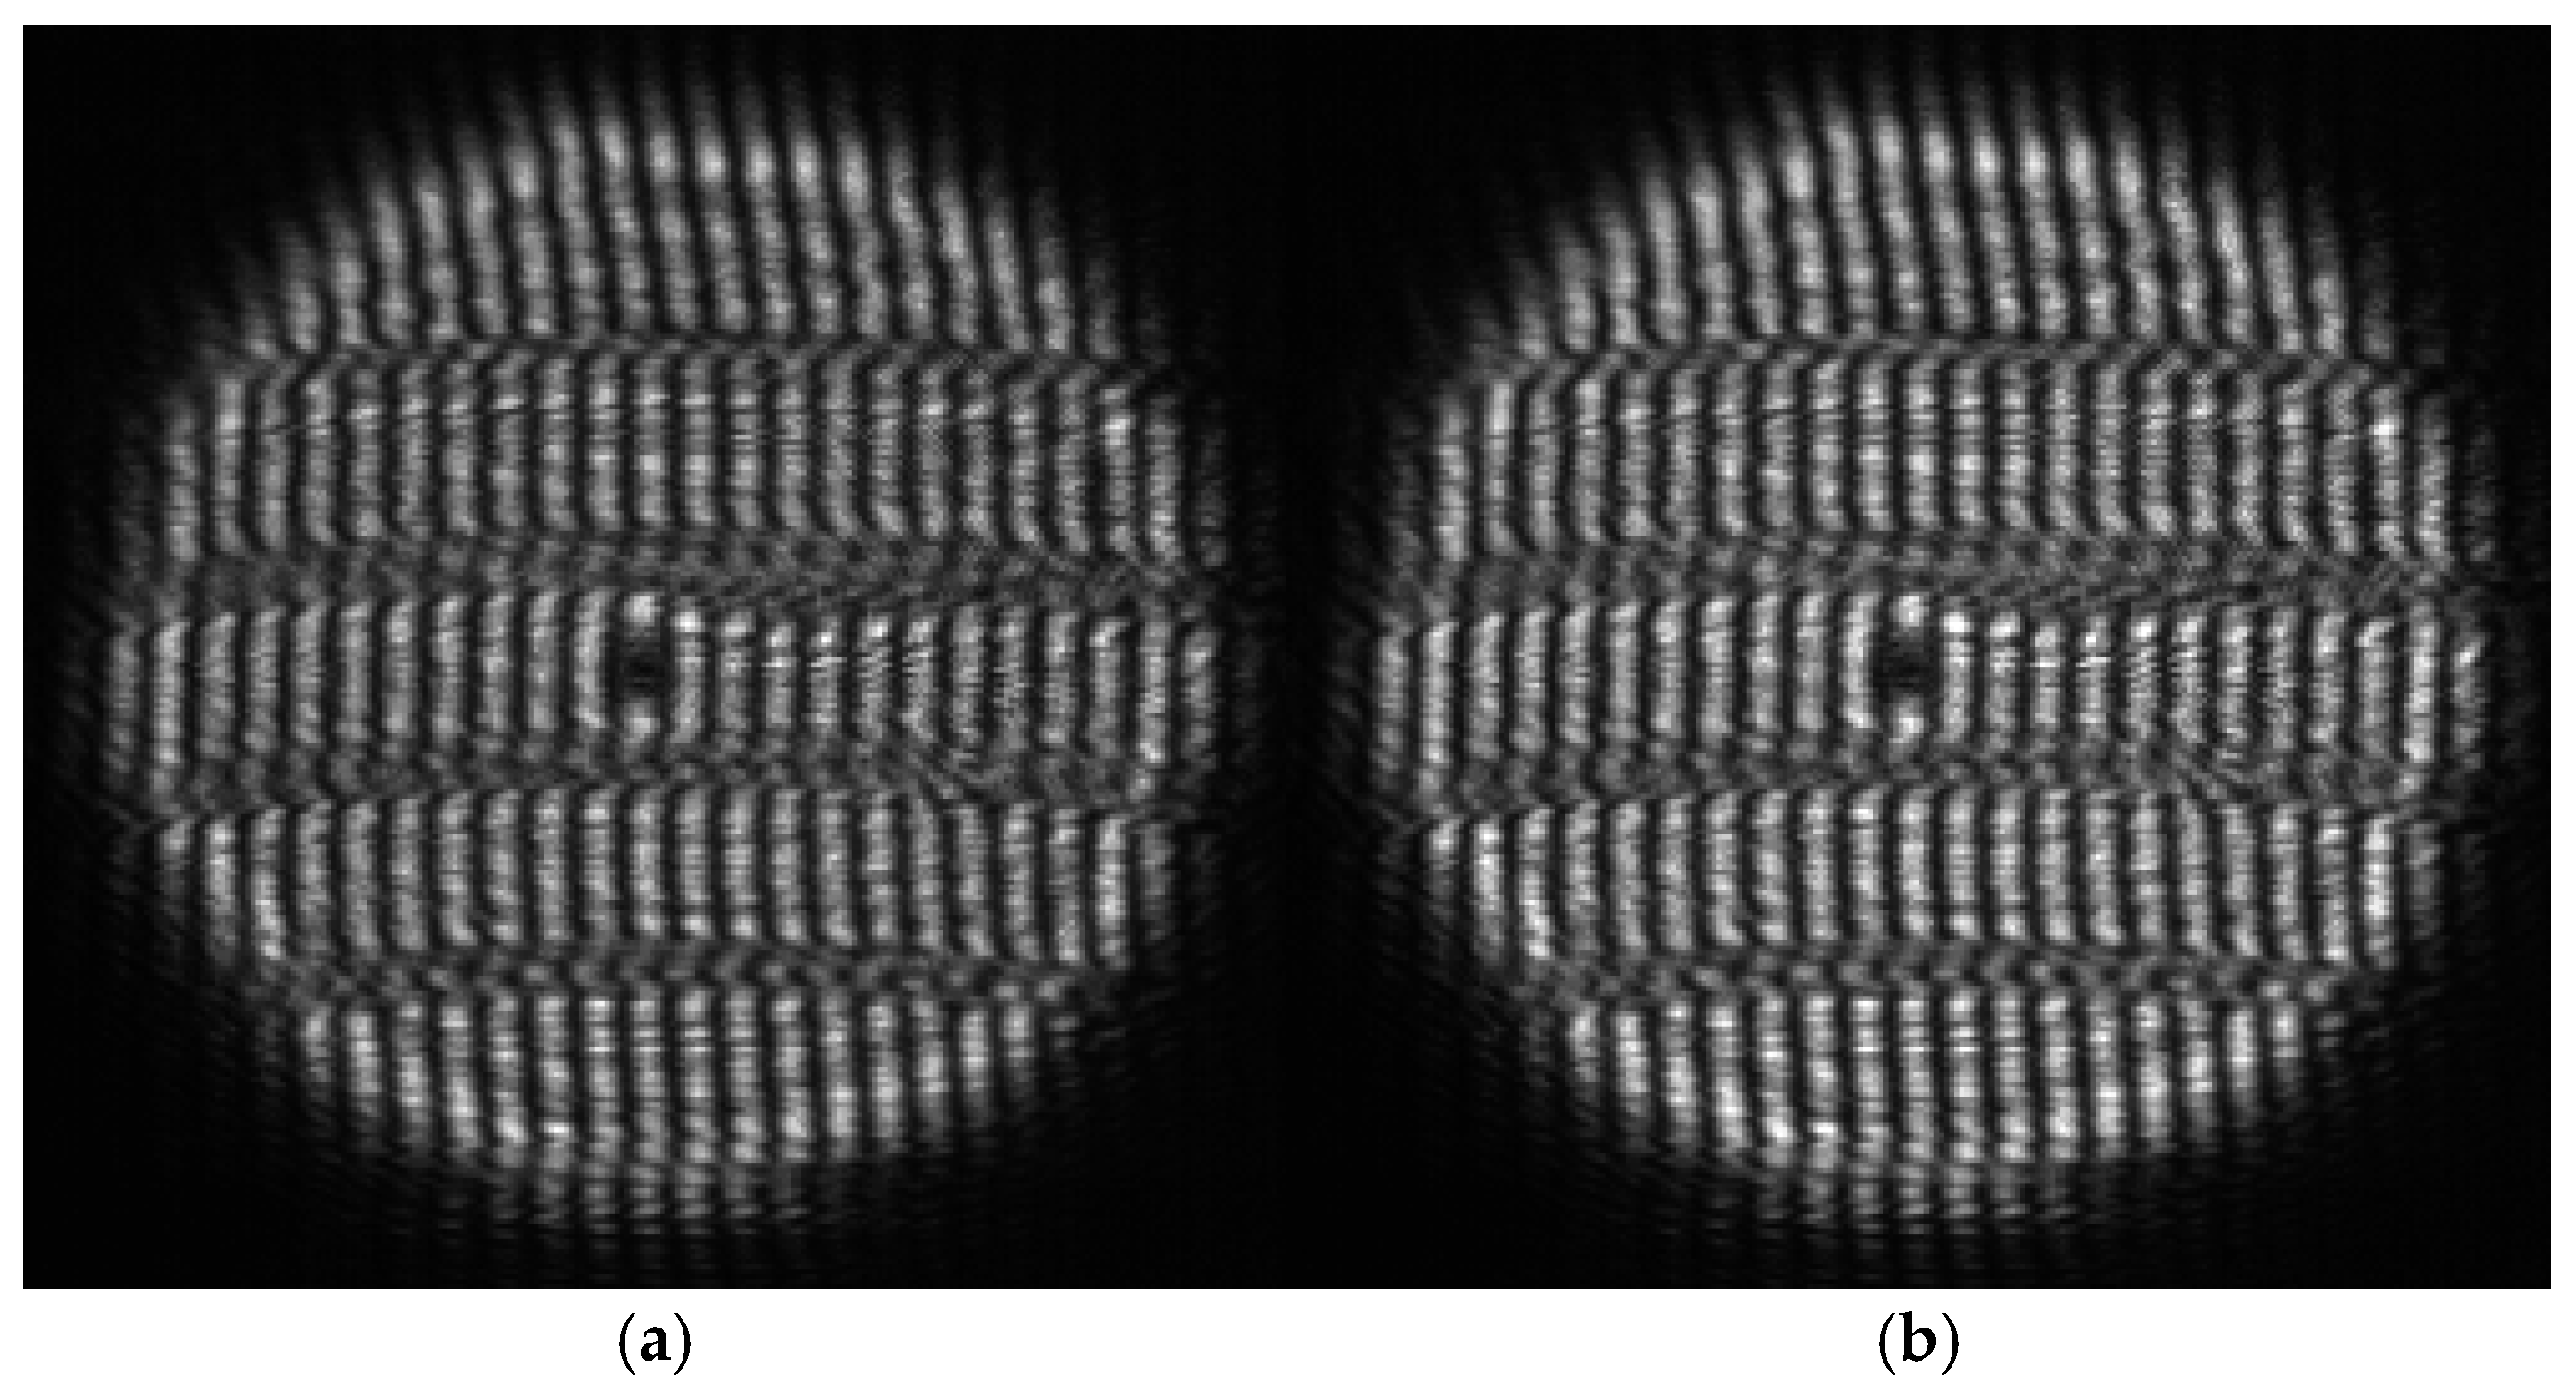
Figure 4.
The results of normalizing Figure 2; (a) the wavelength at 632.8 nm and (b) the wavelength at 632.82 nm.
Figure 4.
The results of normalizing Figure 2; (a) the wavelength at 632.8 nm and (b) the wavelength at 632.82 nm.
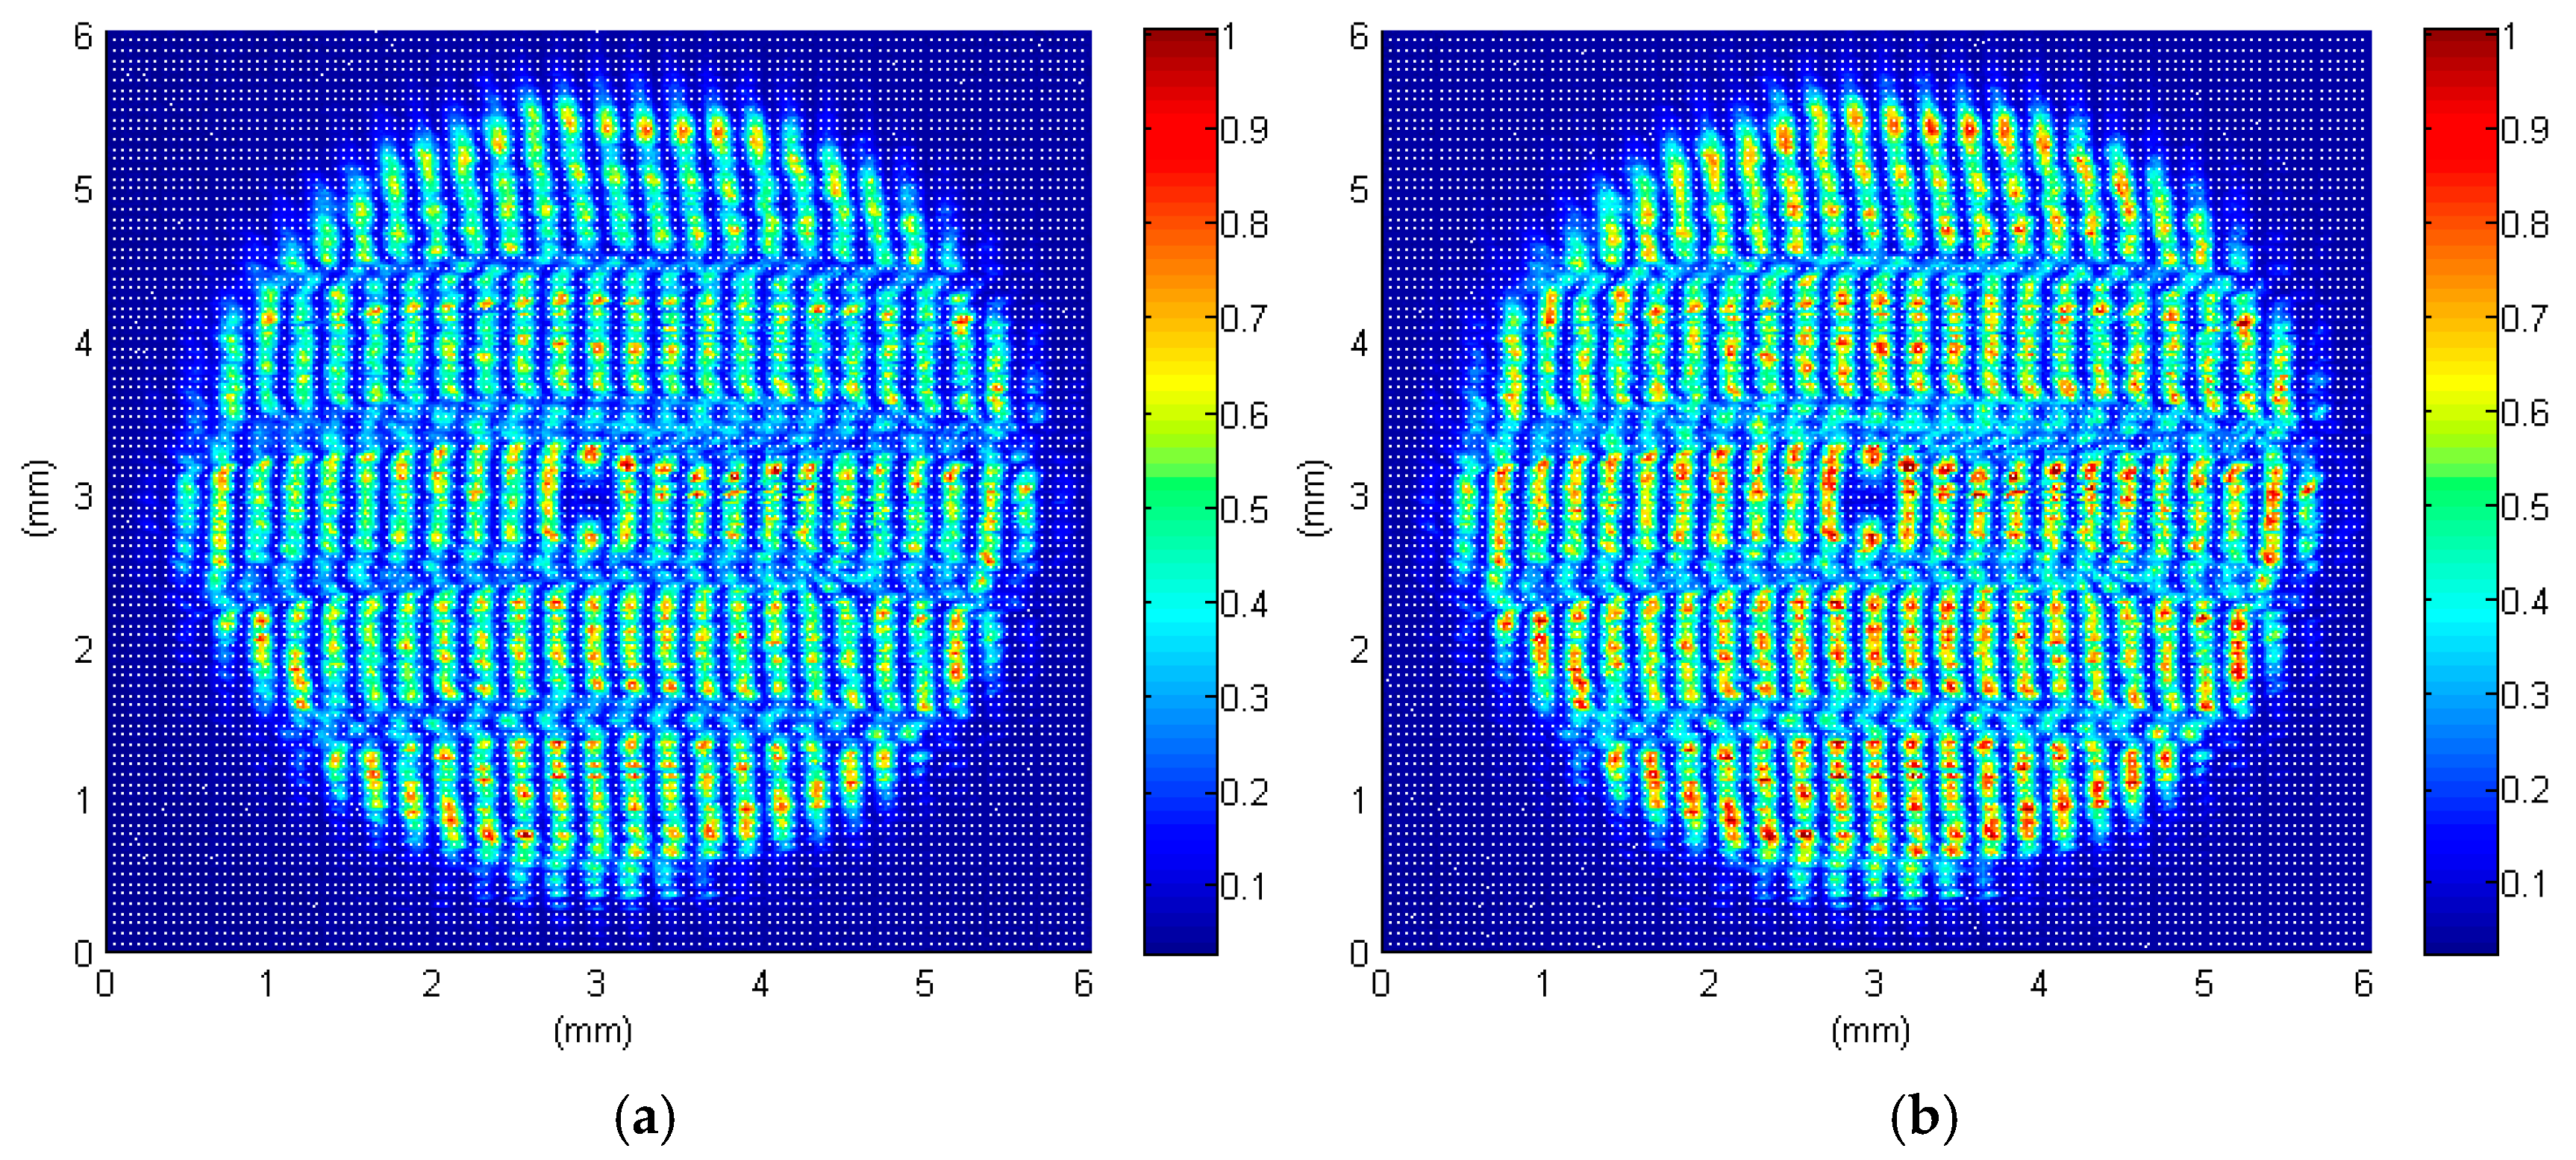
Figure 5.
The results of the phase distribution of the surface of the standard step gauge: (a) three-dimensional view; (b) side view.
Figure 5.
The results of the phase distribution of the surface of the standard step gauge: (a) three-dimensional view; (b) side view.
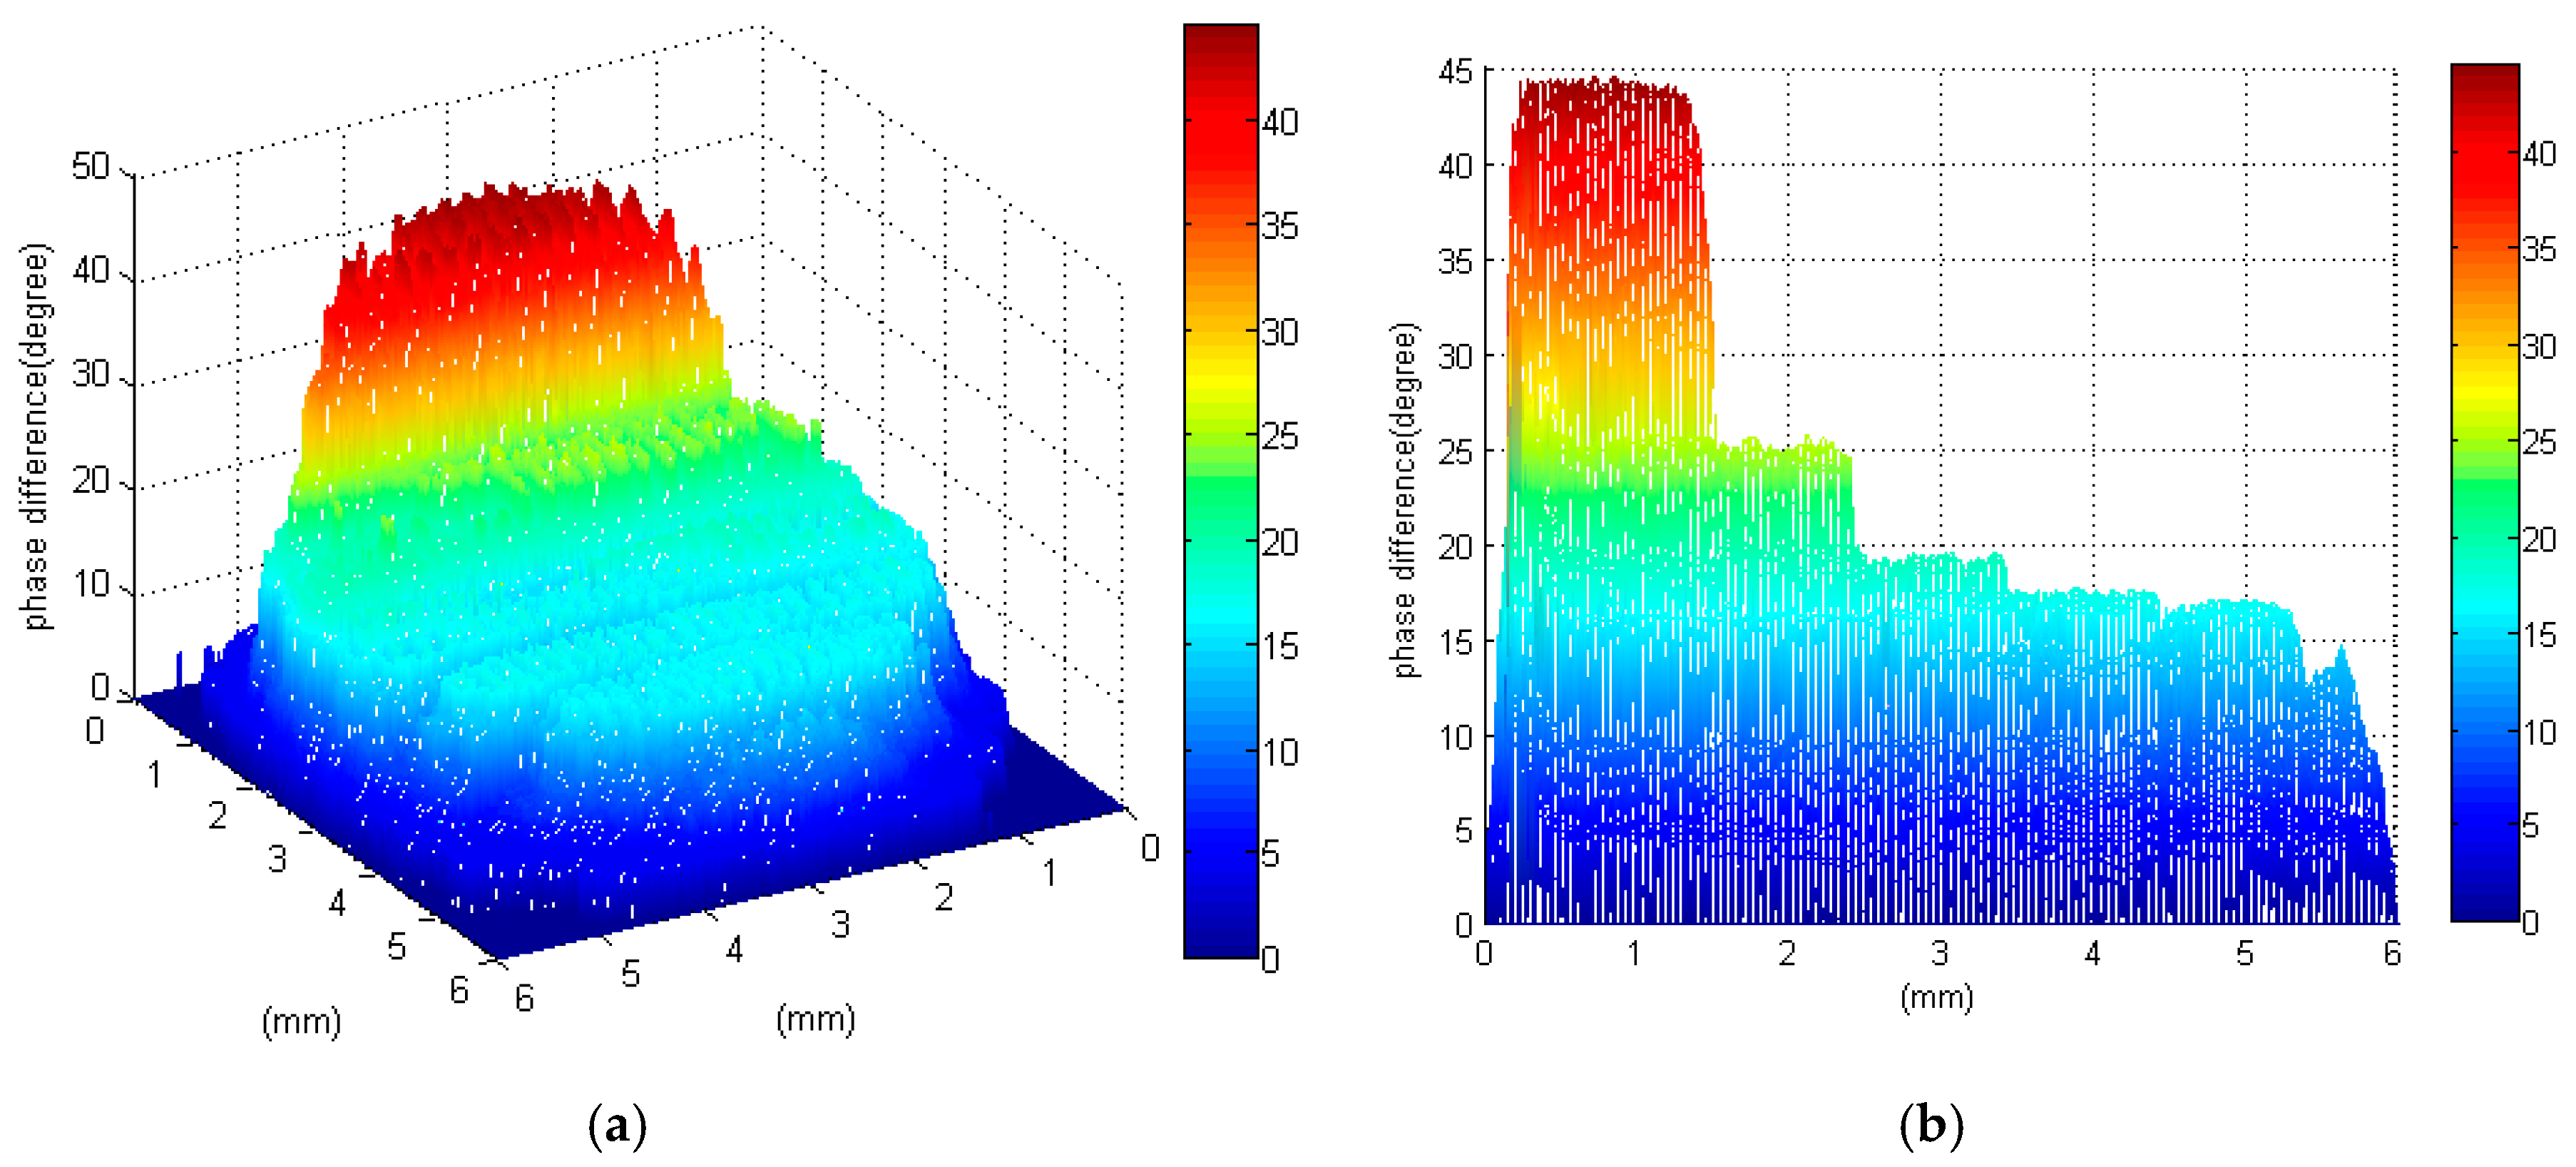
Figure 6.
The results of the surface profile of the standard step gauge: (a) three-dimensional view; (b) side view.
Figure 6.
The results of the surface profile of the standard step gauge: (a) three-dimensional view; (b) side view.
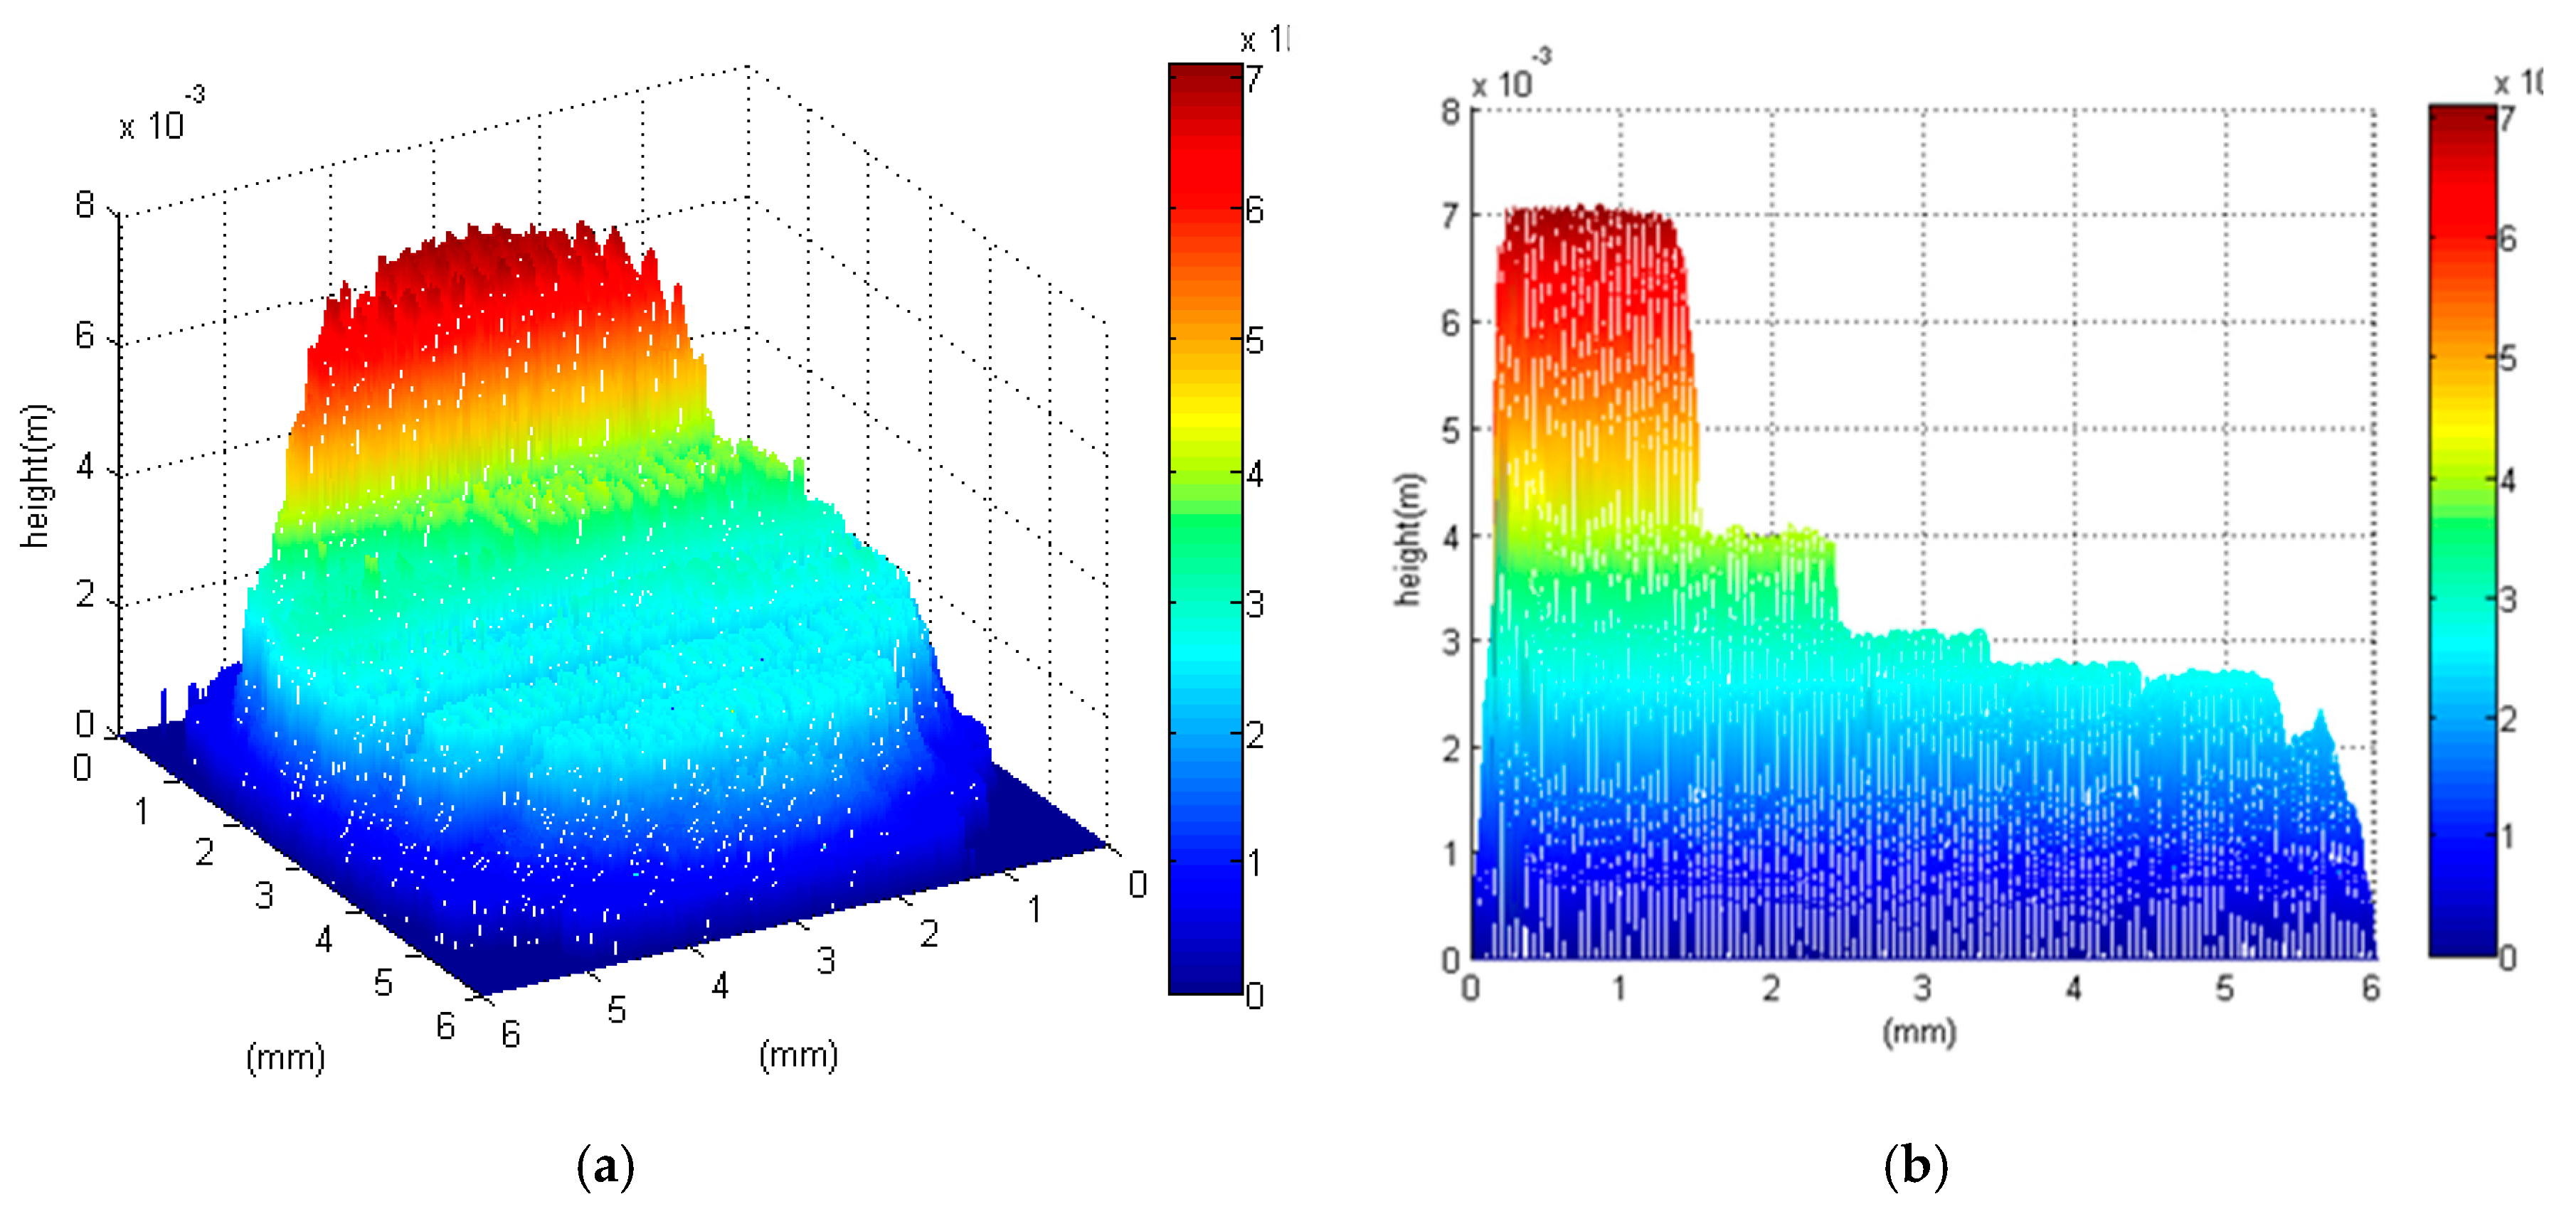

Table 1.
Summary of experimental data.
| Step height | Experimental values (Min.~Max.) | Average value | Step height difference | Experimental values | Standard value | Absolute error |
| i | 6.91 mm~7.08 mm | 6.96 mm | i−ii | 3.01 mm | 3 mm | 0.01 mm |
| ii | 3.87 mm~4.09 mm | 3.95 mm | ii−iii | 0.88 mm | 1 mm | 0.12 mm |
| iii | 3.01 mm~3.09 mm | 3.07 mm | iii−iv | 0.27 mm | 0.3 mm | 0.03 mm |
| iv | 2.76 mm~2.81 mm | 2.80 mm | iv−v | 0.09 mm | 0.1 mm | 0.01 mm |
| v | 2.70 mm~2.71 mm | 2.71 mm |
Disclaimer/Publisher’s Note: The statements, opinions and data contained in all publications are solely those of the individual author(s) and contributor(s) and not of MDPI and/or the editor(s). MDPI and/or the editor(s) disclaim responsibility for any injury to people or property resulting from any ideas, methods, instructions or products referred to in the content. |
© 2026 by the authors. Licensee MDPI, Basel, Switzerland. This article is an open access article distributed under the terms and conditions of the Creative Commons Attribution (CC BY) license.
Copyright: This open access article is published under a Creative Commons CC BY 4.0 license, which permit the free download, distribution, and reuse, provided that the author and preprint are cited in any reuse.


