

Submitted:
21 March 2026
Posted:
23 March 2026
You are already at the latest version
Abstract
As urbanization accelerates, transportation-related environmental challenges have become increasingly pressing. This study investigates the psychological and contextual drivers of Chinese consumers’ purchase intentions toward battery electric vehicles (BEVs) through the Value–Attitude–Behavior (VAB) framework. A large-scale cross-sectional online survey was conducted via the WJX platform in November 2023, yielding 596 valid responses collected using stratified sampling to ensure demographic diversity across age, income, education, and geographic distribution. Perceived value was conceptualized into green, hedonic, and utilitarian dimensions. Structural Equation Modeling (SEM) was employed to test hypothesized pathways, and interaction analysis was used to examine moderating effects. Results reveal that perceived green value and hedonic value significantly enhance consumer attitudes, which in turn strongly influence BEV purchase intentions. Technophilia positively moderates the link between attitude and intention, while range anxiety and battery cost weaken the influence of green and utilitarian value on attitude formation. Theoretically, this study enriches the VAB framework by integrating key moderating variables relevant to sustainable mobility. Practically, it highlights the importance of emphasizing both emotional and environmental benefits in BEV marketing strategies, while addressing consumer concerns over range and cost. Tailored communication strategies that leverage technophilia are especially effective for engaging younger, technology-oriented urban consumers.
Keywords:
perceived value
; technophilia
; range anxiety
; battery cost
; battery electric vehicles
1. Introduction
China has emerged as the world’s largest EV market, bolstered by robust government support and extensive infrastructure development (Pojani & Stead, 2015). National policies have been instrumental in promoting EV adoption. Moreover, numerous jurisdictions have set deadlines to phase out internal combustion engine (ICE) vehicles, signaling a collective commitment to cutting greenhouse gas emissions and tackling climate change (Zeng et al., 2021). Despite rapid technological progress, China remains heavily dependent on ICE vehicles. This has driven a sharp rise in vehicle ownership and intensified both environmental and energy pressures. In 2022, China produced only 105 million tons of oil but consumed 710 million tons, leaving a deficit of more than 600 million tons (Long et al., 2022). That same year, vehicle emissions exceeded 11.7 billion tons, accounting for over 80% of the country’s air pollutants, while ICE vehicles contributed an estimated 10–15% of total CO₂ emissions and 25–40% of PM2.5 particles (Xie, 2023). With 239 out of 338 prefecture-level cities grappling with air quality issues, the need for sustainable transportation solutions has never been more urgent.
The industrialization and commercialization of BEVs are essential for building sustainable supply chains and supporting global climate goals. BEV adoption enhances energy security, mitigates environmental degradation, and improves air quality, positioning the automotive industry as a central driver in the transition to a low-carbon future (Wu & Zhao, 2023). While China’s BEV sector is rapidly expanding, bolstered by policy and innovation, consumer purchase intentions remain limited, suggesting substantial untapped market potential (Zhao et al., 2021; Yali Zheng et al., 2020).
Prior research highlights that perceived hedonic value—how enjoyable and satisfying the BEV experience is—significantly shapes consumer purchase intentions (Yu et al., 2024). However, the specific role of hedonic satisfaction has been underexplored (Lei, Yu, Yu, et al., 2023). Likewise, perceived utilitarian value—the practical benefits and functional performance of BEVs—substantially influences consumer attitudes and purchase decisions, yet few studies have fully addressed this dimension (Lei, Yu, Shao, et al., 2023). Meanwhile, well-documented barriers such as high upfront costs, battery expenses, and range anxiety continue to impede BEV adoption (Zheng et al., 2019; Yanchong Zheng et al., 2020). High battery costs not only raise purchase prices but also heighten consumer concerns about long-term maintenance and replacement. At the same time, range anxiety, defined as the fear that a BEV may not cover sufficient distance between charges, remains a major psychological barrier to adoption.
This study advances the Value–Attitude–Behavior (VAB) framework within the BEV domain by assessing how perceived green, hedonic, and utilitarian value influence consumer attitudes, which then translate into purchase intentions (Gunawan et al., 2022; Higueras-Castillo et al., 2019; Manutworakit & Choocharukul, 2022). It further explores the moderating roles of technophilia, range anxiety, and battery cost in modulating these relationships. To deepen the analysis, the study incorporates Necessary Condition Analysis (NCA), providing a novel lens for identifying critical factors that determine consumer adoption behavior. By advancing the theoretical application of the VAB model and integrating NCA, this research offers essential insights for BEV manufacturers to forecast market demand and optimize strategies across investment, production, and marketing (Chiu et al., 2014; Lavuri et al., 2022; Wang, 2010). Ultimately, these findings contribute to a deeper understanding of consumer needs, support the refinement of industry strategies, and offer actionable guidance for the ongoing industrialization and commercialization of BEVs in China.
2. Literature Review and Hypothesis Development
2.1. Literature Review
Introduced by Mehrabian and Russell (1974), the Value–Attitude–Behavior (VAB) framework has become a foundational model in psychology and consumer behavior research (Mehrabian & Russell, 1974). The theory posits that external stimuli, such as product features, marketing cues, and social influence shape individuals’ internal states, including emotions, cognitions, and attitudes, which in turn drive behavioral responses such as purchase intention, satisfaction, or usage behavior.
VAB theory has been widely applied to explain consumer decision-making across diverse contexts. For example, Vergura et al. (2020) showed that retail environmental cues trigger emotional reactions that shape shopping behavior, while Kim and Yi (2025) demonstrated that visual and auditory advertising stimuli influence brand attitudes through affective pathways. In online environments, Guo et al. (2023) found that website design elements, such as aesthetics and navigation affect users’ shopping behavior via emotional responses.
In the context of electric vehicle (EV) adoption, the VAB model provides a comprehensive lens for understanding (Nazari et al., 2024) how environmental stimuli (e.g., EV technological attributes, policy incentives, environmental messaging) influence psychological mechanisms such as perceived value (Liu et al., 2022), technophilia, and range anxiety, ultimately shaping purchase intentions. Prior studies highlight the importance of these internal evaluative states: perceived green value strongly predicts pro-environmental behavior and green product adoption (Lee et al., 2023); hedonic value influences emotional gratification and purchase choices (Fu, 2025; He & Hu, 2022); and perceived utilitarian value shapes overall product evaluations and purchasing decisions.
VAB theory offers a robust framework for examining EV adoption by linking external (Alwadain et al., 2024; Lee et al., 2023)stimuli to internal psychological evaluations (Mustafa et al., 2024) and subsequent behavioral intentions. This theoretical perspective supports the objective of the present study, which seeks to identify the value perceptions and psychological factors that drive consumers’ willingness to adopt battery electric vehicles.
2.2. Hypothesis Development
2.2.1. Perceived Green Value (PGV)
Perceived green value pertains to the recognized advantages and expenses associated with the acquisition and utilization of eco-friendly products (Lin et al., 2017). It represents consumers’ belief in a product’s contribution to environmental protection. Perceived green value plays a pivotal role in shaping consumers’ attitudes (Chen et al., 2021) and behaviors towards environmentally friendly products and services. It covers how consumers view the environmental advantages and disadvantages of using eco-friendly products (Bennett, 2016). When consumers recognize a significant green value in a product (Tang et al., 2025), they tend to adopt more environmentally responsible behaviors, such as recycling, lowering energy use, and opting for eco-friendly products instead of traditional options.
Kim et al. highlighted that perceived green value significantly influences consumers’ eco-friendly behaviors and their propensity to purchase sustainable products (Kim et al., 2018). This indicates that consumers prioritizing environmental sustainability tend to make buying decisions that reflect their ecological values, thereby boosting the demand for environmentally friendly products (Tang et al., 2025). Additionally, individuals with a higher perceived green value are more inclined to adopt sustainable practices in their daily lives, such as using public transportation, conserving water, and supporting eco-friendly companies (Y. Guo et al., 2021; Koller et al., 2011). This shows that perceived green value not only influences purchasing decisions but also shapes post-consumption behaviors that support environmental conservation.
In the electric vehicle (EV) market, perceived green value has been shown to significantly affect willingness to pay a premium for EVs (Wong et al., 2015). Consumers who view EVs as environmentally friendly are more likely to incorporate ecological considerations into their purchase decisions, despite the potentially higher upfront costs. (Zhang et al., 2018)further highlight that EV adoption is driven not only by functional benefits but also by the perceived environmental utility offered by the vehicle.
Such effects may be especially pronounced in China due to unique socio-political and cultural factors. China has implemented strong national environmental policies, such as the “Dual Carbon” (carbon peak and carbon neutrality) goals and aggressive air-pollution control strategies which have significantly increased the visibility and social importance of environmental protection. In major urban areas, public discourse and government promotion have normalized green consumption as a socially desirable and responsible behavior (Hudayah et al., 2023; Jalu et al., 2023). Younger Chinese consumers, in particular, tend to associate BEVs with low-carbon lifestyles, civic responsibility, and alignment with national sustainability goals. Moreover, in densely populated cities such as Beijing, Shanghai, and Shenzhen where air pollution concerns are more salient—the perception that BEVs help reduce emissions further strengthens consumers’ positive attitudes toward environmentally friendly mobility options. These contextual factors suggest that perceived green value may exert a stronger attitudinal influence in China compared with other markets.
Overall, perceived green value captures an increasingly important dimension of consumer decision-making in China, where rising environmental awareness, government-backed sustainability initiatives, and social desirability of green behaviors jointly elevate the role of environmental value in shaping attitudes toward BEVs. Thus, the hypothesis is proposed as follows:
H1.
Perceived green value has a significant positive impact on Attitude Toward Using.
2.2.2. Perceived Hedonic Value (PHV)
Perceived hedonic value encompasses the pleasure and satisfaction consumers derive from using a product. Chitturi et al. found that this enjoyment plays a crucial role in influencing consumer decision-making (Chitturi et al., 2008), impacting both their purchase intentions and overall satisfaction. This factor is crucial in the intention to use electric vehicles (Hirschman & Holbrook, 1992). The importance of perceived hedonic value should not be underestimated when assessing the intention to purchase electric vehicles (Kim et al., 2020). It encompasses the pleasure derived from the sensory, enjoyable, and emotional elements of the shopping experience.
Empirical studies by Kesari & Atulkar have confirmed the presence of hedonic and Utility shopping values, including the expenditure of money and the achievement of satisfaction (Kesari & Atulkar, 2016; To et al., 2007), This influences consumer behavior significantly. The study further suggests that hedonic shopping values may lead to impulsive shopping behaviors, whereas Utility values typically do not. Furthermore, Venkatesh and Bala enhanced the traditional Technology Acceptance Model (TAM) by incorporating hedonic experiences as an external variable (Venkatesh & Bala, 2008). Their study revealed that the additional enjoyment derived from a technology affects its perceived usability. It was also discovered that users’ pro-environmental behaviors and innovative product developments consider the environmental utility of a technology. Specifically, users who advocate for environmental protection and innovation have been shown to impact both their consumption patterns and enjoyment of technology.
In the context of electric vehicles, research consistently shows that consumers evaluate not only the functional aspects of EVs but also the pleasure associated with the driving and ownership experience. (Hirschman & Holbrook, 1992)further argue that modern consumer behavior should be understood through a broader lens that includes sensation, aesthetics, emotion, and enjoyment, all of which are central to hedonic value. This perspective helps explain why hedonic experiences increasingly shape consumption patterns in technologically advanced and experience-driven markets.
These mechanisms may be especially salient in China, where urban mobility and consumer culture are deeply intertwined with digitalization, lifestyle upgrading, and aesthetic expectations. Chinese consumers, particularly younger urban residents, exhibit strong preferences for technologically enhanced, visually appealing, and emotionally engaging products, partly driven by the rise of digital consumerism, social media influence, and widespread acceptance of smart devices. The integration of immersive infotainment systems, augmented-reality dashboards, autonomous-driving features, and personalized in-car environments in BEVs amplifies the hedonic experience and reinforces the perception that driving an EV is enjoyable, modern, and reflective of an upgraded lifestyle.
Moreover, China’s highly competitive domestic EV market dominated by brands such as BYD, NIO, Xiaomi and XPeng places substantial emphasis on design aesthetics and user experience, further elevating the importance of hedonic value. In dense urban areas, where driving ranges are shorter and daily commutes are more experiential than functional, the emotional gratification, comfort, smooth driving sensation, and smart-car interaction become critical factors shaping attitudes toward BEVs. Given this context, perceived hedonic value is expected to exert a strong positive influence on consumers’ attitudes toward using BEVs in China. Thus, the following hypothesis is proposed:
H2.
Perceived Hedonic value has a significant positive impact on Attitude toward using
2.2.3. Perceived Utility Value (PUV)
Perceived utility value captures how consumers evaluate a product’s functional performance and practical benefits. This comprehensive assessment of a product’s overall quality is crucial for purchase decisions, encompassing intrinsic product attributes such as model, quality, user experience and functional design, as well as external factors including brand reputation, company image and after-sales support. Sweeney and Soutar highlighted that perceived utility value strongly influences consumers’ overall product evaluations and subsequent buying behavior (Sweeney & Soutar, 2001). In the context of Battery Electric Vehicles (BEVs), perceived utility value significantly shapes consumer attitudes, as it reflects evaluations of vehicle performance, technological reliability and operational convenience (Y. Guo et al., 2021; Zeithaml et al., 1996).
Perceived utility value in the EV domain includes functional considerations such as ease of charging, acceleration, battery endurance, maintenance convenience, charging costs, service station coverage, vehicle size and cabin or luggage space (Kim et al., 2012). Prior studies confirm that reductions in long-term fuel and maintenance expenses can offset the higher upfront costs of BEV purchases, increasing the likelihood of adoption (Murray, 2013). A longer driving range also enhances consumer acceptance, while limited range or inadequate charging infrastructure hinders adoption and usage. Recent research emphasizes the importance of reliable charging networks (Martínez-Lao et al., 2017). Furthermore, (Zhang et al., 2020) found that higher perceived utility value reinforces consumers’ positive reactions to product functionality and improves purchase evaluations, while insufficient functional understanding or perceived inadequacy negatively affects decision-making (Chiu et al., 2014).
These dynamics are particularly salient in the Chinese BEV market, where functional value plays an especially critical role due to unique socio-economic and infrastructural factors. Chinese consumers tend to be more price-sensitive and utility-oriented than consumers in many Western markets, which makes evaluations of long-term operational savings a strong predictor of attitudes toward BEVs. Differences in fuel costs, maintenance requirements and license plate restrictions in major cities such as Beijing, Shanghai and Guangzhou further amplify the importance of functional and economic utility.
China has rapidly expanded its charging infrastructure and now hosts the world’s largest charging network. However, regional disparities remain significant. Consumers in first-tier cities benefit from dense urban charging facilities and widespread home-charging availability, which enhances the perceived convenience and practicality of BEVs. Consumers in second- and third-tier cities may perceive utility differently due to heavier reliance on public charging and concerns about intercity travel. These variations make functional utility a central dimension of BEV evaluation.
Given the importance of functional reliability, convenience and economic benefit in the Chinese market, perceived utility value is expected to have a significant positive effect on attitudes toward BEVs. Thus, the following hypothesis is proposed:
H3.
Perceived utility value has a significant positive impact on Attitude toward using
2.2.4. Attitude Toward Using (ATU)
Attitude Toward Using arises when consumers measure their actual experiences against their prior expectations (Oliver, 1980). When the actual experience surpasses expectations, consumers tend to be satisfied; if it falls short, they are likely to feel dissatisfied. Attitude Toward Using is shaped by several factors, such as product quality, service quality, pricing, brand image, and customer expectations (Anderson & Sullivan, 1993; Zeithaml et al., 1996).The performance, durability, and reliability of a product directly affect Attitude Toward Using (Garvin, 1987).Additionally, service quality, including the speed of service, the attitude, and professionalism of employees, etc., also influence Attitude Toward Using (Parasuraman et al., 1988).Furthermore, the reasonableness of the price and value for money are also important factors affecting Attitude Toward Using (Hang, 2017).The level of customer expectations determines their evaluation criteria for products or services (Li et al., 2018; Oliver, 1980),and the reputation and image of a brand can affect customer expectations and satisfaction (Afzal et al., 2010; Ali et al., 2015).
The Value–Attitude–Behavior (VAB) theory is widely used in consumer behavior research, especially in explaining Attitude Toward Using. By analyzing how external stimuli influence the internal states of individuals and their behavioral responses, the VAB theory helps to understand the decision-making process of consumers and the mechanism of satisfaction formation. Donovan and Rossiter (1982) found that stimuli in the retail environment (such as in-store music and lighting) can affect consumer emotions, thereby influencing their shopping behavior and satisfaction. Eroglu et al.(2001)studied how visual and auditory stimuli in advertising affect consumer brand attitudes and satisfaction through emotional responses. Hasan explored how website design (such as attractive interfaces and easy navigation) affects online shopping behavior and satisfaction through user emotional responses (Hasan, 2016). The VAB theory provides a powerful theoretical framework for understanding Attitude Toward Using by analyzing the relationship between external stimuli, internal states, and behavioral responses, helping to explain the decision-making process of consumers. Consequently, the following hypothesis is proposed by this study:
H4.
Attitude toward using has a significant positive impact on BEV purchase intention
2.2.5. Technophilia (TEC)
Technophilia describes the enthusiasm and acceptance consumers show towards innovative technologies (Abbasi et al., 2021; Anderberg et al., 2019), especially within the electric vehicle (EV) sector (Gilbert et al., 2003). Consumers exhibiting strong technophilia generally hold favorable views on the latest technological advancements in EVs (Martínez-Córcoles et al., 2017), like autonomous driving and smart connectivity, which often leads to greater satisfaction. Technophilia represents consumers positive attitude and interest in new technology, influencing how they perceive and experience product features. This positive attitude can amplify or diminish the impact of external stimuli (such as new technology in EVs) on consumers’ internal states(satisfaction). Technophiles are more sensitive to the positive stimuli of new technology (Abbasi & Tabatabaee-Yazdi, 2021), resulting in higher satisfaction. This high satisfaction further enhances their purchase intention (Davis, 1989). Additionally, technophilia acts as a buffer; when the actual experience of new technology falls short of expectations, technophiles may be more tolerant and not significantly reduce their satisfaction, thus maintaining a higher purchase intention (Venkatesh & Bala, 2008). Technophilia affects consumers’ internal states (Seebauer et al., 2015), namely their satisfaction with the product and their expectations for new technology. High technophiles are more likely to feel satisfied and pleased when experiencing new technology, which enhances their overall satisfaction with the product. Moreover, technophiles tend to have stronger positive emotional responses, such as excitement and satisfaction, when experiencing new technology (Agarwal & Karahanna, 2000). They are inclined to have a higher sense of identification with the functions and advantages of new technology, enhancing their satisfaction (Sahin & Thompson, 2006). Meanwhile, satisfaction, as an internal state of the organism, is more likely to translate into purchase intention through the moderating effect of technophilia. For high technophiles, high satisfaction is more likely to translate into strong purchase intention because of their higher interest and acceptance of new technology (Bhattacherjee, 2001). Technophilia moderates the relationship between Attitude Toward Using and purchase intention by affecting how external stimuli influence consumers’ internal states (Elliott & Speck, 2005).
Technophiles are more sensitive to the presence of innovative technological features and tend to interpret advanced functionality as an indicator of product superiority. This heightened responsiveness increases the likelihood that positive attitudes toward BEVs will be translated into strong purchase intentions. Furthermore, technophiles exhibit higher tolerance toward technological imperfections because their enjoyment and identity derived from new technologies compensate for minor shortcomings. Thus, for consumers with high technophilia, a favorable attitude toward BEVs is more readily converted into strong purchase intentions. Conversely, for low-technophilia consumers, concerns about technology complexity or unfamiliarity may weaken the conversion of attitude into intention. Consequently, this study proposes the following hypothesis:
H5.
Technophilia moderates the relationship between Attitude toward using and BEV purchase intention.
2.2.6. Range Anxiety (RAY)
Range anxiety concerns the fear that the battery range of electric vehicles (EVs) may be inadequate, impacting Attitude Toward Using and influencing their purchasing decisions (Noel et al., 2019). Under the framework of the Value–Attitude–Behavior (VAB) theory, environmental stimuli impact an individual’s emotional and cognitive states (Rainieri et al., 2023), thereby affecting their behavioral responses. Stimulus factors are external environmental or product characteristics, such as the technological features and range of EVs. Organism factors are internal states of individuals, such as Attitude Toward Using and range anxiety. Response factors encompass individual behavioral reactions, such as the influence of range anxiety on consumers’ experiences with electric vehicle (EV) features, which in turn affects their satisfaction and willingness to buy. Range anxiety, as a detrimental stimulus, could diminish the positive effects of satisfaction on purchasing decisions. High range anxiety might lead to reduced satisfaction with EVs, potentially dampening purchase intentions even if other aspects are satisfactory (Rauh et al., 2015). Moreover, range anxiety might lower overall Attitude Toward Using with electric vehicles (EVs), consequently diminishing the positive influence of satisfaction on their willingness to purchase (Neubauer et al., 2014). Range anxiety, as an internal state of consumers, directly affects their satisfaction and purchase intention. A comprehensive charging infrastructure can mitigate range anxiety, thus improving satisfaction and bolstering the intention to purchase electric vehicles. Rauh et al. (2015) demonstrated that range anxiety markedly impacts both satisfaction and the intent to purchase electric vehicles. They found that consumers experiencing high range anxiety show substantially lower purchase intentions compared to those with low range anxiety (Rauh et al., 2015).
This moderating mechanism holds particular relevance in China due to pronounced regional differences in charging infrastructure and mobility patterns. Consumers in first-tier cities generally benefit from well-developed charging networks, higher station density, and shorter average daily travel distances. These conditions collectively reduce the perceived risks associated with limited driving range. Under such circumstances, favorable attitudes toward BEVs are more readily translated into purchase intentions, as concerns about range reliability pose minimal psychological barriers.
In contrast, consumers in second- and third-tier cities or suburban regions often engage in longer commuting distances or intercity travel. These mobility patterns heighten concerns about battery capacity and charging accessibility, thereby intensifying range anxiety. For these consumers, even a positive attitude toward BEVs may not fully convert into a strong purchase intention if doubts about range sufficiency persist. High range anxiety, therefore, substantially weakens the attitude–intention relationship.
Moreover, Chinese consumers tend to prioritize practicality, reliability, and functional security in vehicle-related decisions. Within this cultural and market environment, range anxiety operates as a salient risk cue that undermines confidence in a BEV’s capability to meet everyday mobility needs. As a result, behavioral intention can be suppressed despite generally favorable attitudes. Conversely, when consumers perceive charging availability as adequate and battery performance as trustworthy, this sense of functional assurance strengthens the conversion of positive attitudes into purchase intentions. this study suggests the following hypothesis:
H6.
Range Anxiety moderates the relationship between Attitude toward using and BEV purchase intention.
2.2.7. Price of Battery Cost (PBC)
High battery prices can reduce Attitude Toward Using with battery electric vehicles (BEVs) and affect their purchase intentions. High battery prices may increase purchase costs, leading consumers to feel an excessive economic burden, which impacts their satisfaction with BEVs (Rauh et al., 2015). Battery prices not only directly affect Attitude Toward Using but also indirectly influence purchase intentions by moderating the effect of satisfaction on purchase intentions. High battery costs can reduce the positive influence of Attitude Toward Using on their willingness to purchase electric vehicles (EVs), thereby impacting purchase decisions. Besides economic considerations, the cost of batteries also influences the psychological perceptions of consumers regarding electric vehicles (Brase, 2019). High battery prices may cause consumers to have doubts about their purchasing decisions (Degirmenci & Breitner, 2017).
Within the Value–Attitude–Behavior (VAB) framework, battery cost operates as a stimulus factor that influences consumers’ internal states by activating price sensitivity, perceived financial risk, and concerns about future depreciation. These internal cognitive responses shape the strength of the relationship between Attitude Toward Using and purchase intention. When battery costs are perceived as high, consumers may question whether a positive attitude toward BEVs is sufficient to justify the substantial financial investment. Under such conditions, even favorable attitudes may fail to translate into strong purchase intentions, as the perceived economic risk overrides attitudinal positivity. Conversely, when battery costs are perceived as reasonable or declining, the financial barrier is reduced, enabling positive attitudes to more effectively convert into purchase intentions.
This moderating mechanism is particularly meaningful in China due to the strong price sensitivity of Chinese automobile consumers and the structural role that battery packs play in vehicle cost. The phase-out of national purchase subsidies and the rising cost of raw materials for lithium-ion batteries have heightened Chinese consumers’ awareness of battery-related expenses. Moreover, BEVs in China experience rapid technological upgrading cycles, which make consumers especially concerned about battery depreciation and replacement costs over time. These economic and psychological concerns magnify the impact of battery cost on the attitude–intention relationship. When battery costs appear high, consumers may adopt a cautious approach, weakening the conversion of positive attitudes into purchase intentions. In contrast, declining battery prices, economies of scale in domestic battery production, and greater transparency in battery warranties enhance consumers’ perceived economic security, strengthening the extent to which positive attitudes lead to firm purchase intentions. Therefore, this study proposes the following hypothesis:
H7.
Price of Battery cost moderates the relationship between Attitude toward using and BEV purchase intention.
2.2.8. BEV Purchase Intention (BPI)
Purchase intention refers to an individual’s subjective likelihood and willingness to engage in a future purchasing action (Asgarian et al., 2024; Le et al., 2023a). It reflects not only a consumer’s evaluative judgment toward a product but also their motivational readiness to act (J. Guo et al., 2021; Jo, 2024). In the context of environmentally friendly products, prior studies have consistently shown that positive environmental attitudes strengthen the linkage between cognitive evaluations and pro-environmental purchasing behaviors.
However, BEV purchase intention has evolved rapidly in recent years due to technological advancements and structural changes in the mobility ecosystem (Adu-Gyamfi et al., 2022). Contemporary research emphasizes that BEV purchase decisions are shaped by a combination of infrastructure readiness, policy incentives, environmental attitudes, and technological sophistication (Gu et al., 2024). Recent findings reveal that charging infrastructure availability is one of the strongest determinants of BEV purchase intention (Duarte et al., 2023). Consumers are significantly more likely to adopt BEVs when public charging density, home-charging accessibility, and fast-charging coverage are perceived as reliable and widely available. Likewise, policy incentives, such as purchase subsidies, tax reductions, free license plates, and non-monetary benefits, have been shown to substantially shape consumer intention, especially in emerging markets like China (Asgarian et al., 2024; Jo, 2024; Le et al., 2023b). Further, contemporary studies highlight the significant role of environmental concern and green attitudes in driving BEV adoption. Consumers who are more aware of air-pollution risks and climate impacts demonstrate stronger purchase intentions toward low-emission vehicles (Hossain et al., 2022; Liu et al., 2024). These findings align with the VAB framework, suggesting that environmental stimuli and pro-environmental values shape internal attitudes and, subsequently, behavioral responses (Naseri et al., 2024; Wu et al., 2020).
Technological improvements in battery performance, driving range, smart infotainment systems, and autonomous-driving features also play a central role (Nazari et al., 2024; Veza et al., 2023). Recent work confirms that consumers attribute higher purchase intention to BEVs that provide greater range, lower charging time, enhanced digital connectivity, and intelligent cockpit functions (Correia Sinézio Martins et al., 2024; Hao et al., 2023; Rauf et al., 2024). These innovations strengthen both hedonic and utilitarian evaluations, making BEVs more appealing to mainstream consumers. BEV purchase intention as a multidimensional construct shaped by functional, psychological, and contextual factors (Ali et al., 2023; Hossain et al., 2022; Lei, Yu, Yu, et al., 2023). Consistent with the VAB framework, external stimuli—such as charging infrastructure, environmental pressures, technological benefits, and policy incentives—shape internal evaluations and ultimately influence consumers’ likelihood of adopting BEVs (Abbasi et al., 2021; Zhao, Furuoka, Rasiah, et al., 2024). Arising from the analysis discussed, the model posited in this research (Figure 1).
3. Methodology
3.1. Research Design
We carefully designed a survey questionnaire to collect quantitative data on consumer intentions toward purchasing electric vehicle. This questionnaire consists of three primary sections. The initial section features targeted screening questions designed to select participants meeting the study’s eligibility requirement, participants who have never purchased a battery electric vehicle (BEV) are included, while those who have previously bought a BEV are asked to end the survey quickly.
The questionnaire’s second section features 30 items, each rated on a 5-point Likert scale, designed to measure participants’ responses aligned with ten essential constructs from our theoretical framework. The final section gathers demographic details and seeks to understand participants’ personal profiles and social traits. Initially composed in English, the questionnaire underwent a back-translation process into Chinese to ensure its precise communication among online participants. Both the English and Chinese versions were meticulously evaluated by two senior researchers specializing in consumer behavior within live-streaming contexts, thus improving the questionnaire’s accuracy and reliability.
The survey was strategically executed online in November 2023 via WJX, a leading online survey platform in China (www.wjx.cn), known for its broad user sate of nearly 50 million. The platform’s capacity to collect reliable data has been confirmed by previous studies. To reduce common method bias, data collection was staggered over different periods and via multiple channels. The survey targeted BEV enthusiast groups and attendees of BEV test-drive events. A purposive sampling strategy was employed to select respondents who are residents of mainland China and had participated in BEV test-drive experiences within the previous year. From the 620 responses collected, 596 were considered valid after filtering out incomplete entries. All consents were obtained from all subjects and/or their legal guardian (Table 1).Informed consent was obtained in written form from all participants prior to their participation in the study.
3.2. Measures and Data Analysis
In this survey, all items were adapted from existing research. See appendix A. All measurement items in this study were adapted from established scales in prior literature. To ensure linguistic accuracy and cultural appropriateness, we employed a multi-step scale development procedure. First, original English items were selected based on strong prior validation in studies of technophilia, range anxiety, perceived value, and behavioral intention. Second, the items were translated into Chinese by two bilingual researchers, followed by a back-translation by two independent translators who were not involved in the initial translation. Discrepancies between the translations were reviewed and resolved through iterative refinement. Third, an expert panel comprising three scholars in consumer behavior and sustainable mobility assessed the clarity, content validity, and cultural relevance of the translated items. Finally, a pilot test with 32 respondents was conducted to evaluate linguistic comprehensibility and item reliability. Based on the pilot feedback, several items related to technophilia and range anxiety were slightly rephrased to better match Chinese consumers’ interpretive norms. These procedures enhance the validity and reliability of the measurement instruments.
Each survey item utilized a five-point Likert scale, ranging from “strongly disagree” to “strongly agree,” to gauge respondent agreement. Adhering to academic norms, this research incorporates both Partial Least Squares Structural Equation Modeling (PLS-SEM) and Necessary Condition Analysis (NCA) to investigate the required and adequate conditions affecting consumers’ intentions to purchase Battery Electric Vehicles (BEVs). The PLS-SEM approach includes a measurement model, specifying relationships between latent constructs and observed variables, and a structural model, detailing interactions among the latent constructs.
4. Result
4.1. PLS-SEM Result
4.1.1. Assessing the Outer Measurement Model
The robustness of measurement models is evaluated through tests for reliability and validity. Reliability testing assesses the internal consistency and stability of questionnaire scales, primarily using Cronbach’s alpha coefficient and composite reliability (CR). Scores above 0.7 in both Cronbach’s alpha and CR are indicative of strong reliability (Table 2). the Cronbach’s alpha coefficients and CR values for all questionnaires in this study surpass the 0.7 threshold, confirming the high reliability of the data collected.
The validity of a measurement model is assessed using both convergent and discriminant validity tests. As shown in Table 2, all indicators exhibit Average Variance Extracted (AVE) values greater than 0.5, confirming strong convergent validity for the model (Fornell & Larcker, 1981). Discriminant validity is evaluated using the Fornell-Larcker criterion and the Heterotrait-Monotrait Ratio (HTMT). According to the Fornell-Larcker criterion, the square root of the AVE for each variable exceeds its correlations with other variables (Fornell & Larcker, 1981). Moreover, the ratio of HTMT values for the variables fall beneath 0.9, confirming the measurement model possesses significant discriminant validity.
To evaluate discriminant validity, the Heterotrait–Monotrait Ratio (HTMT) was assessed for all latent construct pairs. HTMT values below 0.85 (conservative threshold) or 0.90 (liberal threshold) indicate satisfactory discriminant validity (Table 3). the vast majority of HTMT values fall well within acceptable ranges (0.001–0.672), demonstrating that the constructs are empirically distinct. The interaction terms (RAY × BSA, TEC × BSA, PBC × BSA) also show very low HTMT values, which is expected because interaction terms are orthogonal transformations of their constituent variables and do not reflect conceptual overlap.Perceived Hedonic Value (PHV) and Technophilia (TEC)—exceeds conventional thresholds (HTMT = 1.064). This higher value should be interpreted in light of the conceptual closeness of the two constructs. In BEV research contexts, hedonic enjoyment often stems from technologically advanced features such as intelligent cockpit systems, connected infotainment, and autonomous driving modes, which are simultaneously central to technophilia. Thus, a certain degree of empirical proximity is theoretically expected. Importantly, additional checks using Fornell–Larcker, cross-loadings, and VIF values indicate no multicollinearity or conceptual redundancy, suggesting that the elevated HTMT value does not threaten overall discriminant validity.The HTMT results support acceptable discriminant validity for the measurement model. Although PHV and TEC demonstrate higher conceptual alignment, the constructs remain distinct based on multiple validation criteria. Therefore, the measurement model is considered robust for subsequent structural analysis.
The Fornell–Larcker criterion was applied to further assess discriminant validity (Table 4). The square root of the Average Variance Extracted (AVE) for each construct (diagonal values) is greater than the correlations between that construct and any other construct (off-diagonal values). This indicates that each latent variable explains more variance in its own indicators than in those of other constructs, satisfying the recommended threshold for discriminant validity (Fornell & Larcker, 1981).Overall, the Fornell–Larcker results support satisfactory discriminant validity across all constructs. Combined with HTMT and reliability indicators, the measurement model demonstrates robustness and is suitable for subsequent structural analysis.
4.1.2. Measurement Validity and Collinearity Assessment
Discriminant validity and collinearity were assessed using multiple complementary criteria rather than relying solely on the HTMT ratio. Although HTMT provides a stringent evaluation of discriminant validity, it is not the only indicator of construct distinctiveness. To ensure the robustness of the measurement model, additional criteria including VIF values, Cronbach’s alpha, composite reliability (CR), Average Variance Extracted (AVE), and factor loadings were examined collectively.
All VIF values were below the recommended threshold of 3.3, indicating no critical multicollinearity among constructs. This suggests that the latent variables do not exhibit redundancy and that the structural estimates are not inflated due to collinearity. Cronbach’s alpha and CR values for all constructs exceed 0.70, demonstrating strong internal consistency reliability. This ensures that the measurement items consistently capture their intended constructs. AVE values are above 0.50, confirming adequate convergent validity. Each construct explains more than half of the variance in its observed indicators. Item loadings were all above 0.70, further supporting convergent validity and indicating that the indicators are strongly associated with their underlying constructs. HTMT values were reviewed to assess discriminant validity. Although PHV and TEC exhibited a relatively high HTMT value, additional evidence from VIF, CR, AVE, and factor loading analyses confirms that conceptual overlap does not threaten the model’s psychometric integrity. The constructs remain empirically distinguishable and theoretically justified.
Overall, the combined results across multiple metrics demonstrate that the measurement model exhibits satisfactory reliability, convergent validity, discriminant validity, and no significant multicollinearity issues, providing a solid foundation for subsequent structural model analysis.
4.1.2. Inspecting the Inner Structural Model
To check for collinearity, variance inflation factors (VIFs) were calculated for all predictors in the structural model. As indicated in Table 5, the VIF values ranged from 1.012 to 1.696, remaining below the commonly accepted threshold of 3, thereby confirming that collinearity does not pose a problem. Additionally, a bootstrapping procedure involving 5,000 samples was carried out to assess the significance of the proposed hypotheses.
The structural model assessment results (Table 5) show that Attitude Toward Using (ATU), battery cost (PBC), range anxiety (RAY), and technophilia (TEC) all exert significant direct effects on BEV purchase intention (BPI). Among them, PBC shows the strongest effect (β = 0.291, p < 0.001), indicating that economic considerations remain a dominant driver in the Chinese BEV market. Hedonic value (PHV) exerts the strongest influence on ATU (β = 0.591, p < 0.001; f² = 0.551), emphasizing that experiential enjoyment—such as smart cockpit interaction, driving pleasure, and digital features—plays a central role in shaping user attitudes. Green value (PGV) and utility value (PUV) also show significant but smaller effects on ATU, consistent with the VAB framework.
The model explains 24.2% of variance in BPI and 40.9% of variance in ATU, with Q² values above 0.60, indicating strong predictive relevance. All VIF values remain well below 3.3, confirming no collinearity issues. The moderation analysis reveals mixed results. Technophilia significantly strengthens the ATU→BPI relationship (β = –0.096, p = 0.002). This suggests that consumers with stronger technological enthusiasm are more likely to translate positive attitudes into concrete purchase intentions, aligning with China’s technology-driven BEV consumption culture.
However, the moderating effects of range anxiety (RAY × ATU) and battery cost (PBC × ATU) are not significant. These nonsignificant findings are theoretically interpretable. In China, rapid improvements in charging infrastructure, declining battery prices, and strong government support have reduced variability in perceived range anxiety and cost concerns. As a result, these factors may no longer meaningfully alter the conversion of attitudes into behavioral intention. Instead, they exert influence primarily through direct pathways rather than moderation. This structural model demonstrates robust explanatory and predictive power. Significant predictors align with theoretical expectations, while the nonsignificant moderators reflect evolving contextual conditions in China’s mature and technology-oriented BEV market.
4.1.3. Latent Variable Correlation Heatmap Analysis
The calculated and visualized a correlation heatmap on latent variable scores to intuitively display the strength and direction of linear relationships among the latent constructs (Figure 2). The heatmap adopts a light-gradient color scheme, where dark blue indicates strong positive correlations and light yellow represents weak or negative correlations. Most pairs of latent variables exhibit near-zero or low-to-moderate correlation coefficients, indicating good statistical independence among these constructs. Some pairs show moderate positive correlations, such as BAI and RAY (r = 0.17) and PHV and PBC x BSA (r = 0.20). This heatmap provides strong visual support for understanding the relational network among latent variables within the model.
4.2. Necessary Condition Analysis
4.2.1. Scatter Plots of Necessary Condition Analysis
Necessary Condition Analysis (NCA) provides a unique approach to examining complex causal relationships by pinpointing the indispensable conditions that impact outcome variables. Diverging from traditional methods, NCA not only identifies these critical conditions but also measures their scope and limitations. This method is particularly valuable for uncovering “indispensable yet insufficient” links between dependent and independent variables (Dul, 2016).Complementing standard sufficiency evaluations, NCA quantitatively assesses necessary conditions needed to attain particular outcome levels, providing insights into their influence and revealing potential constraints (Zhao & Furuoka, 2025).
Initially, latent variable scores were generated through the PLS-SEM method, as outlined by Hines & Czerwinski. Subsequently, the NCA analysis was conducted using Smart-PLS software, adhering to the established procedures (Zhao et al., 2025). The initial step in Necessary Condition Analysis (NCA) consists of plotting a ceiling line that intersects the highest data points on an x-y graph, effectively defining the limits of necessary conditions (Figure 3).
Following this, an assessment was carried out to determine the statistical significance of effect sizes (d) for latent variable scores, utilizing a random sample size of 10,000 (Dul, 2016; Sarstedt et al., 2020). The CR-FDH line, appropriate for evaluating survey data on a five-point Likert scale, was used in the NCA results interpretation. Table 6 shows that Perceived Green Value (PGV) (d=0.01, p=0.003), Perceived Hedonic Value (PHV) (d=0.079, p<0.001), and Perceived Utility Value (PUV) (d=0.048, p=0.001) are crucial for BEC Adapting Satisfaction (ATU). Furthermore, ATU (d=0.01, p=0.027) significantly affects BEV Purchase Intention (BPI).
Additionally, ATU itself appears as a necessary condition for BPI (d = 0.01, p = 0.027), meaning that a certain minimum level of positive attitude must be present before consumers develop meaningful purchase intentions. This supports the VAB framework, where organism-level attitudes serve as essential gateways for behavior. The NCA results reveal that hedonic value is the most critical baseline requirement, followed by utility and green value. These findings highlight that BEV adoption is not driven solely by environmental motivations; rather, consumers first require sufficient experiential enjoyment and functional utility before positive attitudes and subsequently purchase intentions can emerge.
The bottleneck analysis provides insight into the minimum threshold levels of key antecedents required to achieve specific performance levels in Attitude Toward Using (ATU) and BEV Purchase Intention (BPI). As shown in Table 7, reaching a 70% level of ATU requires Perceived Green Value (PGV), Perceived Hedonic Value (PHV), and Perceived Utility Value (PUV) to meet minimum values of 2.461, 2.381, and 2.36, respectively. These thresholds indicate that consumers must perceive at least a moderate level of environmental benefit, experiential enjoyment, and functional utility before forming a sufficiently positive attitude toward BEVs. Notably, PHV and PUV show slightly lower threshold requirements compared to PGV, suggesting that experiential and functional aspects may more efficiently elevate attitude formation relative to purely environmental motivations.
At the 100% ATU level, the minimum requirements decrease slightly (PGV = 2.222, PHV = 2.08, PUV = 1.487), reflecting condition inefficiency patterns characteristic of NCA results. These lower thresholds imply that once attitudes reach very high levels, they are less constrained by these value perceptions, although a minimal presence is still necessary.
For behavior-level outcomes, achieving a 70% BPI level requires ATU to be no less than 2.547, whereas achieving 100% BPI requires ATU to be at least 2.28. This reinforces the critical role of attitude as a necessary gateway for intention: without sufficient attitudinal positivity, purchase intention cannot reach higher performance levels. Overall, the bottleneck results highlight that BEV adoption depends not only on high values of predictors but on satisfying specific minimum psychological thresholds. Manufacturers should therefore ensure that BEVs provide baseline levels of enjoyment, functional convenience, and perceived environmental benefit to unlock higher levels of consumer attitude and purchase intention.
4.2.2. Interpretation of NCA Results
The NCA results indicate that hedonic value exhibits a higher necessity effect size than green value, suggesting that hedonic value represents a minimum psychological requirement for forming a favorable attitude toward BEVs in the Chinese context. In NCA logic, a higher necessity effect size means that without meeting a certain threshold of hedonic value, such as driving enjoyment, interaction with intelligent cockpit features, or emotional pleasure, consumers are unlikely to develop a positive attitude toward BEVs, regardless of how strong the environmental (green) value may be. This finding highlights a shift in the motivational structure of BEV adoption: while environmental value contributes to attitude formation, it is not a necessary condition, whereas hedonic experience is.
From a theoretical perspective, this challenges the conventional VAB assumption that green value is the dominant driver in sustainable product adoption. Instead, it positions hedonic value as a critical baseline condition that must be met before other stimuli can exert influence. Practically, this means that BEV manufacturers and policymakers must prioritize the experiential dimension—smooth acceleration, immersive infotainment systems, intelligent interfaces, quiet driving, and overall “fun-to-drive” qualities before emphasizing environmental or cost benefits. Without delivering sufficient hedonic appeal, efforts to highlight green utility will have limited impact. The bottleneck table further shows that even modest increases in hedonic value substantially reduce the minimum conditions needed for favorable attitudes, demonstrating its leverage effect on adoption likelihood.
5. Implications
5.1. Theoretical Implications
This study makes several contributions to the theoretical understanding of consumer behavior in the BEV context. First, it extends the Value–Attitude–Behavior (VAB) framework to a rapidly evolving sustainable technology domain. The findings demonstrate that perceived green, hedonic, and utilitarian value operate as critical external stimuli that shape internal evaluative states, which subsequently influence purchase intention. This supports and advances the original propositions of Mehrabian and Russell by providing empirical evidence that the stimulus–organism–response mechanism remains robust in the context of emerging low-carbon transportation technologies.
Second, the study integrates VAB with perceived value theory to offer a multidimensional interpretation of how consumers evaluate BEVs. By showing that green, hedonic, and utilitarian value contribute differentially to attitude formation, the research enriches prior studies (e.g., Sweeney & Soutar) that conceptualize perceived value as a single overarching construct. The results clarify how each value dimension acts as a unique psychological stimulus within the VAB sequence, deepening theoretical understanding of sustainable consumption decision-making.
Third, the identification of technophilia, range anxiety, and battery cost as moderating variables adds novel insight into the boundary conditions of the VAB framework. Technophilia strengthens the translation of positive attitudes into purchase intention, illustrating how individual-level technological affinity amplifies the stimulus–response pathway. In contrast, range anxiety and battery cost weaken this translation, highlighting the role of practical and psychological constraints. These findings align with previous work on individual differences and perceived risk, while also revealing new dynamics specific to BEV adoption in China. This study advances the theoretical landscape by demonstrating that BEV adoption is shaped not only by functional and economic considerations but also by emotional, experiential, and technological factors. Future research should explore how these stimuli evolve over time as technologies mature, and examine the applicability of the extended VAB framework in other sustainability domains such as renewable energy or low-carbon consumer products.
5.2. Practical Implications
This study provides several actionable insights for stakeholders in the BEV ecosystem, including manufacturers, marketers, policymakers, and consumer advocacy groups. The findings highlight the importance of multidimensional perceived value in shaping attitudes and purchase intentions, offering clear guidance for strategy development.
First, implications for manufacturers and marketers. The strong influence of hedonic and utilitarian value suggests that BEV promotion should go beyond environmental messaging. Manufacturers should enhance user experience through refined design, intelligent cockpit systems, and enjoyable driving dynamics. At the same time, communicating functional benefits, such as lower operating costs, reduced maintenance needs, and long-term economic savings can appeal to cost-sensitive consumers. Although green value contributes to attitudes, it functions less as a primary motivator; therefore, environmental claims should complement rather than dominate marketing strategies. Firms should also target technology-oriented consumers by emphasizing advanced safety features, connectivity, and autonomous driving functions.
Second, implications for consumer advocates and educators. Clear communication of total cost of ownership, available subsidies, and battery durability can help reduce misconceptions that often hinder adoption. Test-drive programs, experiential workshops, and public education campaigns can provide hands-on familiarity, increasing comfort and confidence with BEVs. Linking BEV adoption to broader environmental and public health benefits can further motivate sustainability-oriented consumers.
Third, implications for policymakers and future industry collaboration. Policies should continue to support charging infrastructure expansion, battery cost reduction, and transparent warranty systems, as these factors mitigate range anxiety and economic concerns. Collaboration between industry and academia can help identify emerging consumer expectations and refine policy interventions accordingly. Monitoring market dynamics across regions and demographic segments will allow for more targeted and adaptive policy design.
In summary, a balanced strategy that integrates functional value, emotional experience, and accurate consumer information can enhance attitudes toward BEVs and accelerate market adoption.
6. Conclusion
This research offers significant insights into the elements influencing consumer purchase intentions for battery electric vehicles (BEVs) in China. Utilizing the Value–Attitude–Behavior (VAB) theory, we have constructed a robust framework to comprehend how external factors, such as perceived green value, perceived hedonic value, and perceived Utility value, influence consumer behavior through internal states like satisfaction and sensitivity to perceived battery prices.
Our results indicate that high battery prices significantly affect Attitude Toward Using, subsequently influencing their purchase intentions. This aligns with findings from Franke and Krems (2013), which suggest that the financial strain of high battery costs can deter consumers from purchasing BEVs. The direct correlation between battery prices and Attitude Toward Using underscores the importance of addressing cost-related concerns to enhance BEV market acceptance. Moreover, the moderating role of battery prices in the relationship between satisfaction and purchase intention highlights that, even when consumers are generally satisfied with BEVs, elevated battery costs can diminish their willingness to proceed with a purchase.
The study extends the understanding of perceived value dimensions in the context of BEVs. Our analysis revealed that perceived green value positively influences consumers’ environmental attitudes and their willingness to engage in eco-friendly behaviors, supporting the findings of. Similarly, perceived hedonic value was found to play a critical role in consumer decision-making processes, impacting both purchase intention and satisfaction, consistent with. Perceived Utility value also emerged as a significant factor, affecting overall product evaluation and purchase decisions, in line with the work of.
Including technophilia, range anxiety, and battery costs as moderating factors offered a more nuanced understanding of consumer behavior. Technophilia was found to amplify the positive influence of perceived values on satisfaction and purchase intentions, indicating that consumers with a strong affinity for technology are more likely to recognize and value the advantages of BEVs. Conversely, range anxiety was shown to diminish consumer confidence in BEVs, echoing previous research that highlighted concerns about the practical usability of these vehicles. Addressing these anxieties through improved infrastructure and battery technology could mitigate such concerns and promote BEV adoption.
The results carry practical significance for both policymakers and industry stakeholders. The study suggests that reducing battery costs, either through technological advancements or government subsidies, could significantly enhance Attitude Toward Using and boost purchase intentions. Policymakers should also consider initiatives to alleviate range anxiety, such as expanding the charging infrastructure and promoting public awareness about the actual range capabilities of modern BEVs. For manufacturers, focusing on enhancing the perceived hedonic and Utility values of BEVs can attract a broader consumer ATUe.
Future research could explore the specific mechanisms through which battery prices affect Attitude Toward Using and purchase intentions in different market segments. Additionally, longitudinal studies could provide insights into how consumer perceptions and behaviors evolve as BEV technology and infrastructure improve. Investigating the interplay between different perceived value dimensions and other moderating factors, such as social influence and environmental consciousness, could further enrich our understanding of consumer decision-making in the context of sustainable automotive technologies.
This study contributes to the existing literature by applying the VAB theory to the context of BEVs and highlighting the crucial role of battery prices, perceived values, and moderating variables in shaping Attitude Toward Using and purchase intentions. By addressing the economic and psychological barriers identified, stakeholders can better strategize to enhance the adoption of BEVs, ultimately contributing to a more sustainable automotive industry.
7. Limitation and Future Research
This study identified several limitations. First, the research framework was evaluated using a sample of Chinese consumers, focusing on perceived value, which may limit the generalizability of the findings to other contexts. Second, the study did not take into account samples from diverse geographical and ethnic backgrounds, which could address this issue. Although this research is based on solid theoretical principles, the cross-sectional survey design might introduce methodological biases. Lastly, future research on consumers’ perceptions of green, hedonic, and utilitarian value may need to collect data at multiple time points and include control variables to enhance robustness. Although this study collected 620 responses and retained 596 valid cases, the sampling approach may introduce potential bias. Participants were recruited through BEV enthusiast groups, online discussion forums, and test-drive events, which may attract individuals who already hold more favorable attitudes toward electric vehicles. As a result, the sample may overrepresent consumers with positive predispositions toward BEVs, potentially inflating the strength of certain attitudinal relationships. This sampling limitation should be considered when interpreting the generalizability of the findings. Future studies may benefit from probability-based sampling or broader community-based recruitment to obtain a more balanced distribution of attitudes.
Given these limitations, several avenues for future research are recommended.
Longitudinal studies would allow for the examination of temporal changes in perceived value, attitudes, and adoption behaviors as technology and infrastructure mature. Incorporating behavioral or revealed-preference data, such as actual purchase records, usage logs, or charging behavior—would strengthen the validity of adoption models and overcome biases associated with self-reported intentions. Experimental and quasi-experimental designs, including field tests, A/B marketing experiments, and policy simulation studies, could help isolate causal mechanisms within the Value–Attitude–Behavior framework and examine how consumers respond to specific technological, economic, or informational stimuli. Mixed-methods approaches may also provide deeper insights into how consumers negotiate functional, emotional, and psychological trade-offs when evaluating BEVs. Finally, future research could extend the enhanced VAB framework to other domains of sustainable consumption, such as renewable energy products, shared mobility systems, and low-carbon household technologies, to further test its theoretical generalizability.
Informed Consent and Ethical Approval
This study was conducted in accordance with the Declaration of Helsinki and was approved by the Institutional Review Board (IRB) of [University of Malaya] (Approval No.UM.TNC2/UMREC_4492). Informed consent was obtained from all participants prior to participation. Written informed consent was obtained before the commencement of data collection.
Data availability
The data are available from the corresponding author on reasonable request.
Competing interests
The author(s) declare no competing interests.
Appendix A
| Construct | Item | Measurement Items | Resource |
| PGV |
PGV1 | I feel that BEVs have a positive impact on the environment compared to conventional vehicles. | (Chen et al., 2013) (Cheung et al., 2015) (Juliana et al., 2020) |
| PGV2 | BEVs are more environmentally friendly than gasoline-powered cars. | ||
| PGV3 | I believe that choosing a BEV is a step toward a more sustainable future. | ||
| PGV4 | I believe that owning a BEV reflects positively on my commitment to environmental sustainability. | ||
| PHV | PHV1 | Driving a BEV is a fun and pleasurable experience for me. | (Hanzaee & Rezaeyeh, 2013) (Chiu et al., 2014) (Lavuri et al., 2022) |
| PHV2 | The modern look of my BEV enhances my driving enjoyment | ||
| PHV3 | I feel that driving a BEV is exciting because of the innovative technology. | ||
| PHV4 | Driving a BEV gives me a sense of prestige and status. | ||
| PUV | PUV1 | I am satisfied with the lower maintenance costs of my BEV compared to traditional vehicles. | (Canning et al., 2019) (Rosenzweig et al., 2019) |
| PUV2 | The convenience of driving a BEV fits well with my daily routine. | ||
| PUV3 | The technology in my BEV enhances its overall functionality. | ||
| PUV4 | I believe that my BEV is more energy-efficient than traditional vehicles. | ||
| RAY | RAY1 | I often worry that my BEV will run out of battery while driving. | (Wu & Fang, 2010) (Zhao, Furuoka, Rasiah, et al., 2024) |
| RAY2 | I worry that I will not be able to find a charging station when I need one. | ||
| RAY3 | I worry that charging my BEV will take too long during trips. | ||
| TEC | TEC1 | I am very interested in the advanced technology used in BEVs. | (Wu & Fang, 2010; Zhou, 2023) |
| TEC2 | I believe that BEVs represent the future of automotive technology. | ||
| TEC3 | I easily adapt to new technological updates in my BEV. | ||
| TEC4 | I like exploring all the technological options and settings in my BEV. | ||
| PBC | PBC1 | I believe the purchase price of a BEV is affordable for me. | (Wu & Fang, 2010) (Zhao, Furuoka, & Rasiah, 2024) |
| PBC2 | Even though BEVs are expensive, I believe they offer better value compared to gasoline cars. | ||
| PBC3 | I expect the battery in a BEV to last for a long time without needing replacement. | ||
| PBC4 | I am satisfied with the financial savings from charging my BEV compared to using gasoline. | ||
| BPI | BPI1 | I believe buying a BEV is a good decision. | (Zhao, Furuoka, & Rasiah, 2024; Zhao, Furuoka, Rasiah, et al., 2024; Zhou, 2023) |
| BPI2 | My friends and family would support my decision to purchase a BEV. | ||
| BPI3 | I believe that buying a BEV is a way to contribute to environmental protection. | ||
| BPI4 | I intend to purchase a BEV within the next year. | ||
| ATU | ATU1 | I have a positive attitude toward using a battery electric vehicle. | |
| ATU2 | I find using a battery electric vehicle to be a pleasant experience. | ||
| ATU3 | I think using a battery electric vehicle is a good idea. |
References
- Abbasi, F., & Tabatabaee-Yazdi, M. (2021). EFL teachers’ personality traits and their sense of technophobia and technophilia. Journal of Research in Techno-based Language Education, 1(2), 1-14.
- Abbasi, H. A., Johl, S. K., Shaari, Z. B. H., Moughal, W., Mazhar, M., Musarat, M. A., Rafiq, W., Farooqi, A. S., & Borovkov, A. (2021). Consumer motivation by using unified theory of acceptance and use of technology towards electric vehicles. Sustainability, 13(21), 12177.
- Adu-Gyamfi, G., Song, H., Obuobi, B., Nketiah, E., Wang, H., & Cudjoe, D. (2022). Who will adopt? Investigating the adoption intention for battery swap technology for electric vehicles. Renewable and Sustainable Energy Reviews, 156. [CrossRef]
- Afzal, H., Khan, M. A., ur Rehman, K., Ali, I., & Wajahat, S. (2010). Consumer’s trust in the brand: Can it be built through brand reputation, brand competence and brand predictability. International business research, 3(1), 43.
- Agarwal, R., & Karahanna, E. (2000). Time flies when you’re having fun: Cognitive absorption and beliefs about information technology usage. MIS quarterly, 665-694.
- Ali, M. H., Jaber, M. M., Alfred Daniel, J., Vignesh, C. C., Meenakshisundaram, I., Kumar, B. S., & Punitha, P. (2023). Autonomous vehicles decision-making enhancement using self-determination theory and mixed-precision neural networks. Multimedia Tools and Applications, 1-24.
- Ali, R., Leifu, G., YasirRafiq, M., & Hassan, M. (2015). Role of perceived value, customer expectation, corporate image and perceived service quality on the customer satisfaction. Journal of Applied Business Research, 31(4), 1425-1436.
- Alwadain, A., Fati, S. M., Ali, K., & Ali, R. F. (2024). From theory to practice: An integrated TTF-UTAUT study on electric vehicle adoption behavior. PloS one, 19(3), e0297890.
- Anderberg, P., Eivazzadeh, S., & Berglund, J. S. (2019). A novel instrument for measuring older people’s attitudes toward technology (TechPH): Development and validation. Journal of medical Internet research, 21(5), e13951.
- Anderson, E. W., & Sullivan, M. W. (1993). The antecedents and consequences of customer satisfaction for firms. Marketing science, 12(2), 125-143.
- Asgarian, F., Hejazi, S. R., Khosroshahi, H., & Safarzadeh, S. (2024). Vehicle pricing considering EVs promotion and public transportation investment under governmental policies on sustainable transportation development: The case of Norway. Transport Policy, 153, 204-221.
- Bennett, N. J. (2016). Using perceptions as evidence to improve conservation and environmental management. Conservation biology, 30(3), 582-592.
- Bhattacherjee, A. (2001). An empirical analysis of the antecedents of electronic commerce service continuance. Decision support systems, 32(2), 201-214.
- Brase, G. L. (2019). What would it take to get you into an electric car? Consumer perceptions and decision making about electric vehicles. The Journal of psychology, 153(2), 214-236.
- Canning, E. A., Priniski, S. J., & Harackiewicz, J. M. (2019). Unintended consequences of framing a utility-value intervention in two-year colleges. Learning and Instruction, 62, 37-48.
- Chen, L., Qie, K., Memon, H., & Yesuf, H. M. (2021). The empirical analysis of green innovation for fashion brands, perceived value and green purchase intention—mediating and moderating effects. Sustainability, 13(8), 4238.
- Chen, Y.-S., Lin, C.-L., & Chang, C.-H. (2013). The influence of greenwash on green word-of-mouth (green WOM): the mediation effects of green perceived quality and green satisfaction. Quality & Quantity, 48(5), 2411-2425. [CrossRef]
- Cheung, R., Lam, A. Y., & Lau, M. M. (2015). Drivers of green product adoption: the role of green perceived value, green trust and perceived quality. Journal of Global Scholars of Marketing Science, 25(3), 232-245.
- Chitturi, R., Raghunathan, R., & Mahajan, V. (2008). Delight by design: The role of hedonic versus utilitarian benefits. Journal of marketing, 72(3), 48-63.
- Chiu, C. M., Wang, E. T., Fang, Y. H., & Huang, H. Y. (2014). Understanding customers’ repeat purchase intentions in B2C e-commerce: the roles of utilitarian value, hedonic value and perceived risk. Information systems journal, 24(1), 85-114.
- Correia Sinézio Martins, E., Lépine, J., & Corbett, J. (2024). Assessing the effectiveness of financial incentives on electric vehicle adoption in Europe: Multi-period difference-in-difference approach. Transportation Research Part A: Policy and Practice, 189. [CrossRef]
- Davis, F. D. (1989). Perceived usefulness, perceived ease of use, and user acceptance of information technology. MIS quarterly, 319-340.
- Degirmenci, K., & Breitner, M. H. (2017). Consumer purchase intentions for electric vehicles: Is green more important than price and range? Transportation Research Part D: Transport and Environment, 51, 250-260.
- Duarte, A. P., Contreiras, J. P., & Seabra, F. M. (2023). Work-family conflict’s mediating effect on the relationship between job insecurity and job satisfaction in the hospitality industry: Evidence from the Algarve, Portugal. Journal of Human Resources in Hospitality & Tourism, 23(2), 337-357. [CrossRef]
- Dul, J. (2016). Necessary condition analysis (NCA) logic and methodology of “necessary but not sufficient” causality. Organizational research methods, 19(1), 10-52.
- Elliott, M. T., & Speck, P. S. (2005). Factors that affect attitude toward a retail web site. Journal of Marketing Theory and Practice, 13(1), 40-51.
- Fornell, C., & Larcker, D. F. (1981). Evaluating structural equation models with unobservable variables and measurement error. Journal of marketing research, 18(1), 39-50.
- Franke, T., & Krems, J. F. (2013). What drives range preferences in electric vehicle users? Transport Policy, 30, 56-62.
- Fu, X. (2025). How could your intention to purchase electric vehicle be stimulated? A behavioral spillover perspective based on pro-environmental attitude-behavior (in) congruence. Journal of Environmental Psychology, 102673.
- Garvin, D. (1987). Competing on the eight dimensions of quality. Harv. Bus. Rev., 101-109.
- Gilbert, D., Lee-Kelley, L., & Barton, M. (2003). Technophobia, gender influences and consumer decision-making for technology-related products. European Journal of Innovation Management, 6(4), 253-263.
- Gu, J., Wu, Z., Song, Y., & Nicolescu, A.-C. (2024). A win-win relationship? New evidence on artificial intelligence and new energy vehicles. Energy Economics, 134. [CrossRef]
- Gunawan, I., Redi, A. A. N. P., Santosa, A. A., Maghfiroh, M. F. N., Pandyaswargo, A. H., & Kurniawan, A. C. (2022). Determinants of customer intentions to use electric vehicle in Indonesia: An integrated model analysis. Sustainability, 14(4), 1972.
- Guo, J., Yu, Z., Ma, Z., Xu, D., & Cao, S. (2021). What factors have driven urbanization in China? Environment, Development and Sustainability, 24(5), 6508-6526. [CrossRef]
- Guo, J., Zhang, W., & Xia, T. (2023). Impact of shopping website design on customer satisfaction and loyalty: The mediating role of usability and the moderating role of trust. Sustainability, 15(8), 6347.
- Guo, Y., Souders, D., Labi, S., Peeta, S., Benedyk, I., & Li, Y. (2021). Paving the way for autonomous Vehicles: Understanding autonomous vehicle adoption and vehicle fuel choice under user heterogeneity. Transportation Research Part A: Policy and Practice, 154, 364-398.
- Hang, D. T. T. (2017). Evaluation of qualitative value for money of public-private partnership projects in Vietnam. Journal of International Studies, 10(4), 192-206.
- Hanzaee, K. H., & Rezaeyeh, S. P. (2013). Investigation of the effects of hedonic value and utilitarian value on customer satisfaction and behavioural intentions. African Journal of business management, 7(11), 818.
- Hao, L., Ren, Y., Lu, W., Jiang, N., Ge, Y., & Wang, Y. (2023). Assessment of Heavy-Duty Diesel Vehicle NOx and CO2 Emissions Based on OBD Data. Atmosphere, 14(9), 1417.
- Hasan, B. (2016). Perceived irritation in online shopping: The impact of website design characteristics. Computers in Human Behavior, 54, 224-230.
- He, X., & Hu, Y. (2022). Understanding the role of emotions in consumer adoption of electric vehicles: the mediating effect of perceived value. Journal of Environmental Planning and Management, 65(1), 84-104.
- Higueras-Castillo, E., Molinillo, S., Coca-Stefaniak, J. A., & Liébana-Cabanillas, F. (2019). Perceived value and customer adoption of electric and hybrid vehicles. Sustainability, 11(18), 4956.
- Hirschman, E. C., & Holbrook, M. B. (1992). Postmodern consumer research (Vol. 1). Sage.
- Hossain, M. S., Kumar, L., Islam, M. M., & Selvaraj, J. (2022). A comprehensive review on the integration of electric vehicles for sustainable development. Journal of Advanced Transportation, 2022(1), 3868388.
- Hudayah, S., Ramadhani, M. A., Sary, K. A., Raharjo, S., & Yudaruddin, R. (2023). Green perceived value and green product purchase intention of Gen Z consumers: Moderating role of environmental concern. Environmental Economics, 14(2), 87-102.
- Jalu, G., Dasalegn, G., Japee, G., Tangl, A., & Boros, A. (2023). Investigating the Effect of Green Brand Innovation and Green Perceived Value on Green Brand Loyalty: Examining the Moderating Role of Green Knowledge. Sustainability, 16(1), 341.
- Jo, K. (2024). Who drives the green shift? EV and battery policymaking and systemic marginalisation of auto suppliers in South Korea. The Extractive Industries and Society, 20, 101538. [CrossRef]
- Juliana, J., Djakasaputra, A., & Pramono, R. (2020). Green perceived risk, green viral communication, green perceived value against green purchase intention through green satisfaction. Journal of Industrial Engineering & Management Research, 1(2), 124-139.
- Kesari, B., & Atulkar, S. (2016). Satisfaction of mall shoppers: A study on perceived utilitarian and hedonic shopping values. Journal of Retailing and Consumer Services, 31, 22-31.
- Kim, C., Jin, M.-H., Kim, J., & Shin, N. (2012). User perception of the quality, value, and utility of user-generated content. Journal of Electronic Commerce Research, 13(4), 305.
- Kim, J., & Yi, E. (2025). Effects of advertising stimulus according to consumer’s sound information acceptance characteristics: neuroscientific quantification of emotion prediction. Applied Acoustics, 240, 110867.
- Kim, M.-K., Oh, J., Park, J.-H., & Joo, C. (2018). Perceived value and adoption intention for electric vehicles in Korea: Moderating effects of environmental traits and government supports. Energy, 159, 799-809. [CrossRef]
- Kim, M. S., An, M. H., Kim, W. J., & Hwang, T.-H. (2020). Comparative efficacy and safety of pharmacological interventions for the treatment of COVID-19: A systematic review and network meta-analysis. PLoS medicine, 17(12), e1003501.
- Koller, M., Floh, A., & Zauner, A. (2011). Further insights into perceived value and consumer loyalty: A “green” perspective. Psychology & Marketing, 28(12), 1154-1176.
- Lavuri, R., Jindal, A., & Akram, U. (2022). How perceived utilitarian and hedonic value influence online impulse shopping in India? Moderating role of perceived trust and perceived risk. International Journal of Quality and Service Sciences, 14(4), 615-634.
- Le, T. T., Jabeen, F., & Santoro, G. (2023a). What drives purchase behavior for electric vehicles among millennials in an emerging market. Journal of Cleaner Production, 428, 139213. [CrossRef]
- Le, T. T., Jabeen, F., & Santoro, G. (2023b). What drives purchase behavior for electric vehicles among millennials in an emerging market. Journal of Cleaner Production, 428. [CrossRef]
- Lee, S. S., Kim, Y., & Roh, T. (2023). Pro-environmental behavior on electric vehicle use intention: Integrating value-belief-norm theory and theory of planned behavior. Journal of Cleaner Production, 418, 138211.
- Lei, X., Yu, H., Shao, Z., & Jian, L. (2023). Optimal bidding and coordinating strategy for maximal marginal revenue due to V2G operation: Distribution system operator as a key player in China’s uncertain electricity markets. Energy, 283, 128354.
- Lei, X., Yu, H., Yu, B., Shao, Z., & Jian, L. (2023). Bridging electricity market and carbon emission market through electric vehicles: Optimal bidding strategy for distribution system operators to explore economic feasibility in China’s low-carbon transitions. Sustainable Cities and Society, 94, 104557.
- Li, Y.-L., Du, Y.-F., & Chin, K.-S. (2018). Determining the importance ratings of customer requirements in quality function deployment based on interval linguistic information. International Journal of Production Research, 56(14), 4692-4708.
- Lin, J., Lobo, A., & Leckie, C. (2017). The role of benefits and transparency in shaping consumers’ green perceived value, self-brand connection and brand loyalty. Journal of Retailing and Consumer Services, 35, 133-141.
- Liu, J., Zhang, N., & Yang, Y. (2024). Acceptance model of new energy vehicles based on PLS-SEM model. Heliyon, 10(9). [CrossRef]
- Liu, J., Zhuge, C., Tang, J. H. C. G., Meng, M., & Zhang, J. (2022). A spatial agent-based joint model of electric vehicle and vehicle-to-grid adoption: A case of Beijing. Applied Energy, 310, 118581.
- Long, H., Wang, S., Wu, W., & Zhang, G. (2022). The economic influence of oil shortage and the optimal strategic petroleum reserve in China. Energy Reports, 8, 9858-9870.
- Manutworakit, P., & Choocharukul, K. (2022). Factors influencing battery electric vehicle adoption in Thailand—Expanding the unified theory of acceptance and use of technology’s variables. Sustainability, 14(14), 8482.
- Martínez-Córcoles, M., Teichmann, M., & Murdvee, M. (2017). Assessing technophobia and technophilia: Development and validation of a questionnaire. Technology in Society, 51, 183-188.
- Martínez-Lao, J., Montoya, F. G., Montoya, M. G., & Manzano-Agugliaro, F. (2017). Electric vehicles in Spain: An overview of charging systems. Renewable and Sustainable Energy Reviews, 77, 970-983.
- Mehrabian, A., & Russell, J. A. (1974). A verbal measure of information rate for studies in environmental psychology. Environment and Behavior, 6(2), 233.
- Murray, C. K. (2013). What if consumers decided to all ‘go green’? Environmental rebound effects from consumption decisions. Energy Policy, 54, 240-256.
- Mustafa, S., Shi, Y., Adan, D. e., Luo, W., & Al Humdan, E. (2024). Role of environmental awareness & self-identification expressiveness in electric-vehicle adoption. Transportation, 1-25.
- Naseri, H., Waygood, E. O. D., Patterson, Z., & Wang, B. (2024). Who is more likely to buy electric vehicles? Transport Policy, 155, 15-28. [CrossRef]
- Nazari, F., Noruzoliaee, M., & Mohammadian, A. (2024). Electric vehicle adoption behavior and vehicle transaction decision: estimating an integrated choice model with latent variables on a retrospective vehicle survey. Transportation Research Record, 2678(4), 378-397.
- Neubauer, J., Wood, E., Burton, E., Smith, K., & Pesaran, A. (2014). FY14 Milestone: Simulated Impacts of Life-Like Fast Charging on BEV Batteries.
- Noel, L., De Rubens, G. Z., Sovacool, B. K., & Kester, J. (2019). Fear and loathing of electric vehicles: The reactionary rhetoric of range anxiety. Energy research & social science, 48, 96-107.
- Oliver, R. L. (1980). A cognitive model of the antecedents and consequences of satisfaction decisions. Journal of marketing research, 17(4), 460-469.
- Parasuraman, A., Zeithaml, V. A., & Berry, L. L. (1988). Servqual: A multiple-item scale for measuring consumer perc. Journal of retailing, 64(1), 12.
- Pojani, D., & Stead, D. (2015). Sustainable urban transport in the developing world: beyond megacities. Sustainability, 7(6), 7784-7805.
- Rainieri, G., Buizza, C., & Ghilardi, A. (2023). The psychological, human factors and socio-technical contribution: A systematic review towards range anxiety of battery electric vehicles’ drivers. Transportation Research Part F: Traffic Psychology and Behaviour, 99, 52-70.
- Rauf, M., Kumar, L., Zulkifli, S. A., & Jamil, A. (2024). Aspects of artificial intelligence in future electric vehicle technology for sustainable environmental impact. Environmental Challenges, 14. [CrossRef]
- Rauh, N., Franke, T., & Krems, J. F. (2015). Understanding the impact of electric vehicle driving experience on range anxiety. Human factors, 57(1), 177-187.
- Rosenzweig, E. Q., Harackiewicz, J. M., Priniski, S. J., Hecht, C. A., Canning, E. A., Tibbetts, Y., & Hyde, J. S. (2019). Choose your own intervention: Using choice to enhance the effectiveness of a utility-value intervention. Motivation Science, 5(3), 269.
- Sahin, I., & Thompson, A. (2006). Using Rogers’ theory to interpret instructional computer use by COE faculty. Journal of Research on Technology in Education, 39(1), 81-104.
- Sarstedt, M., Ringle, C. M., Cheah, J.-H., Ting, H., Moisescu, O. I., & Radomir, L. (2020). Structural model robustness checks in PLS-SEM. Tourism Economics, 26(4), 531-554.
- Seebauer, S., Stolz, R., & Berger, M. (2015). Technophilia as a driver for using advanced traveler information systems. Transportation Research Part C: Emerging Technologies, 60, 498-510.
- Sweeney, J. C., & Soutar, G. N. (2001). Consumer perceived value: The development of a multiple item scale. Journal of retailing, 77(2), 203-220.
- Tang, T., Guo, Y., Souders, D. J., Li, X., Yang, M., Xu, X., & Qian, X. (2025). Moderating effects of policy measures on intention to adopt autonomous vehicles: Evidence from China. Travel Behaviour and Society, 38, 100921.
- To, P.-L., Liao, C., & Lin, T.-H. (2007). Shopping motivations on Internet: A study based on utilitarian and hedonic value. Technovation, 27(12), 774-787.
- Venkatesh, V., & Bala, H. (2008). Technology acceptance model 3 and a research agenda on interventions. Decision sciences, 39(2), 273-315.
- Vergura, D. T., Zerbini, C., & Luceri, B. (2020). Consumers’ attitude and purchase intention towards organic personal care products. An application of the SOR model. Sinergie Italian Journal of Management, 38(1), 121-137.
- Veza, I., Asy’ari, M. Z., Idris, M., Epin, V., Fattah, I. R., & Spraggon, M. (2023). Electric vehicle (EV) and driving towards sustainability: Comparison between EV, HEV, PHEV, and ICE vehicles to achieve net zero emissions by 2050 from EV. Alexandria Engineering Journal, 82, 459-467.
- Wang, E. S.-T. (2010). Internet usage purposes and gender differences in the effects of perceived utilitarian and hedonic value. Cyberpsychology, Behavior, and Social Networking, 13(2), 179-183.
- Wong, I. A., Wan, Y. K. P., & Qi, S. (2015). Green events, value perceptions, and the role of consumer involvement in festival design and performance. Journal of Sustainable Tourism, 23(2), 294-315.
- Wu, J., Liao, H., & Wang, J.-W. (2020). Analysis of consumer attitudes towards autonomous, connected, and electric vehicles: A survey in China. Research in Transportation Economics, 80. [CrossRef]
- Wu, S.-C., & Fang, W. (2010). The effect of consumer-to-consumer interactions on idea generation in virtual brand community relationships. Technovation, 30(11-12), 570-581.
- Wu, W., & Zhao, K. (2023). Does upgrading of industrial structure drive economy to “decouple” from environment: An empirical analysis based on the data of prefecture-level cities in China. Journal of the Knowledge Economy, 14(1), 287-313.
- Xie, J. (2023). Comparing the sustainability of multimodal transportation between China and Europe. Frontiers in Business, Economics and Management, 7(1), 5-16.
- Yu, B., Lei, X., Shao, Z., & Jian, L. (2024). V2G Carbon Accounting and Revenue Allocation: Balancing EV Contributions in Distribution Systems. Electronics, 13(6), 1063.
- Zeithaml, V. A., Berry, L. L., & Parasuraman, A. (1996). The behavioral consequences of service quality. Journal of marketing, 60(2), 31-46.
- Zeng, D., Dong, Y., Cao, H., Li, Y., Wang, J., Li, Z., & Hauschild, M. Z. (2021). Are the electric vehicles more sustainable than the conventional ones? Influences of the assumptions and modeling approaches in the case of typical cars in China. Resources, Conservation and Recycling, 167, 105210.
- Zhang, X., Bai, X., & Shang, J. (2018). Is subsidized electric vehicles adoption sustainable: Consumers’ perceptions and motivation toward incentive policies, environmental benefits, and risks. Journal of Cleaner Production, 192, 71-79.
- Zhang, Y., Xiao, C., & Zhou, G. (2020). Willingness to pay a price premium for energy-saving appliances: Role of perceived value and energy efficiency labeling. Journal of Cleaner Production, 242, 118555.
- Zhao, H., & Furuoka, F. (2025). Linking social capital to green purchasing intentions in livestreaming sessions: the moderating role of perceived visible heterogeneity. Humanities and Social Sciences Communications, 12(1). [CrossRef]
- Zhao, H., Furuoka, F., & Rasiah, R. (2024). The Influence of Psychological Factors on Consumer Purchase Intention for Electric Vehicles: Case Study from China: Integrating the Necessary Condition Analysis Methodology from the Perspective of Self-Determination Theory. World Electric Vehicle Journal, 15(8). [CrossRef]
- Zhao, H., Furuoka, F., Rasiah, R. A. L., & Shen, E. (2024). Consumers’ Purchase Intention toward Electric Vehicles from the Perspective of Perceived Green Value: An Empirical Survey from China. World Electric Vehicle Journal, 15(6). [CrossRef]
- Zhao, H., Ru, P., & Jia, H. (2025). TikTok Users Migration to Xiaohongshu (Rednote): Emotional Dynamics, Platform Governance, and an NCA-SEM Analysis in Cross-Cultural Adaptation. International Journal of Human–Computer Interaction, 1-26.
- Zhao, J., Xi, X., Na, Q., Wang, S., Kadry, S. N., & Kumar, P. M. (2021). The technological innovation of hybrid and plug-in electric vehicles for environment carbon pollution control. Environmental Impact Assessment Review, 86, 106506.
- Zheng, Y., He, X., Wang, H., Wang, M., Zhang, S., Ma, D., Wang, B., & Wu, Y. (2020). Well-to-wheels greenhouse gas and air pollutant emissions from battery electric vehicles in China. Mitigation and Adaptation Strategies for Global Change, 25, 355-370.
- Zheng, Y., Niu, S., Shang, Y., Shao, Z., & Jian, L. (2019). Integrating plug-in electric vehicles into power grids: A comprehensive review on power interaction mode, scheduling methodology and mathematical foundation. Renewable and Sustainable Energy Reviews, 112, 424-439.
- Zheng, Y., Shao, Z., Zhang, Y., & Jian, L. (2020). A systematic methodology for mid-and-long term electric vehicle charging load forecasting: The case study of Shenzhen, China. Sustainable Cities and Society, 56, 102084.
- Zhou, S. (2023). The effect of COVID-19 risk perception on pro-environmental behavior of Chinese consumers: Perspectives from affective event theory. Frontiers in Psychology, 13. [CrossRef]
Figure 1.
Conceptual Framework.
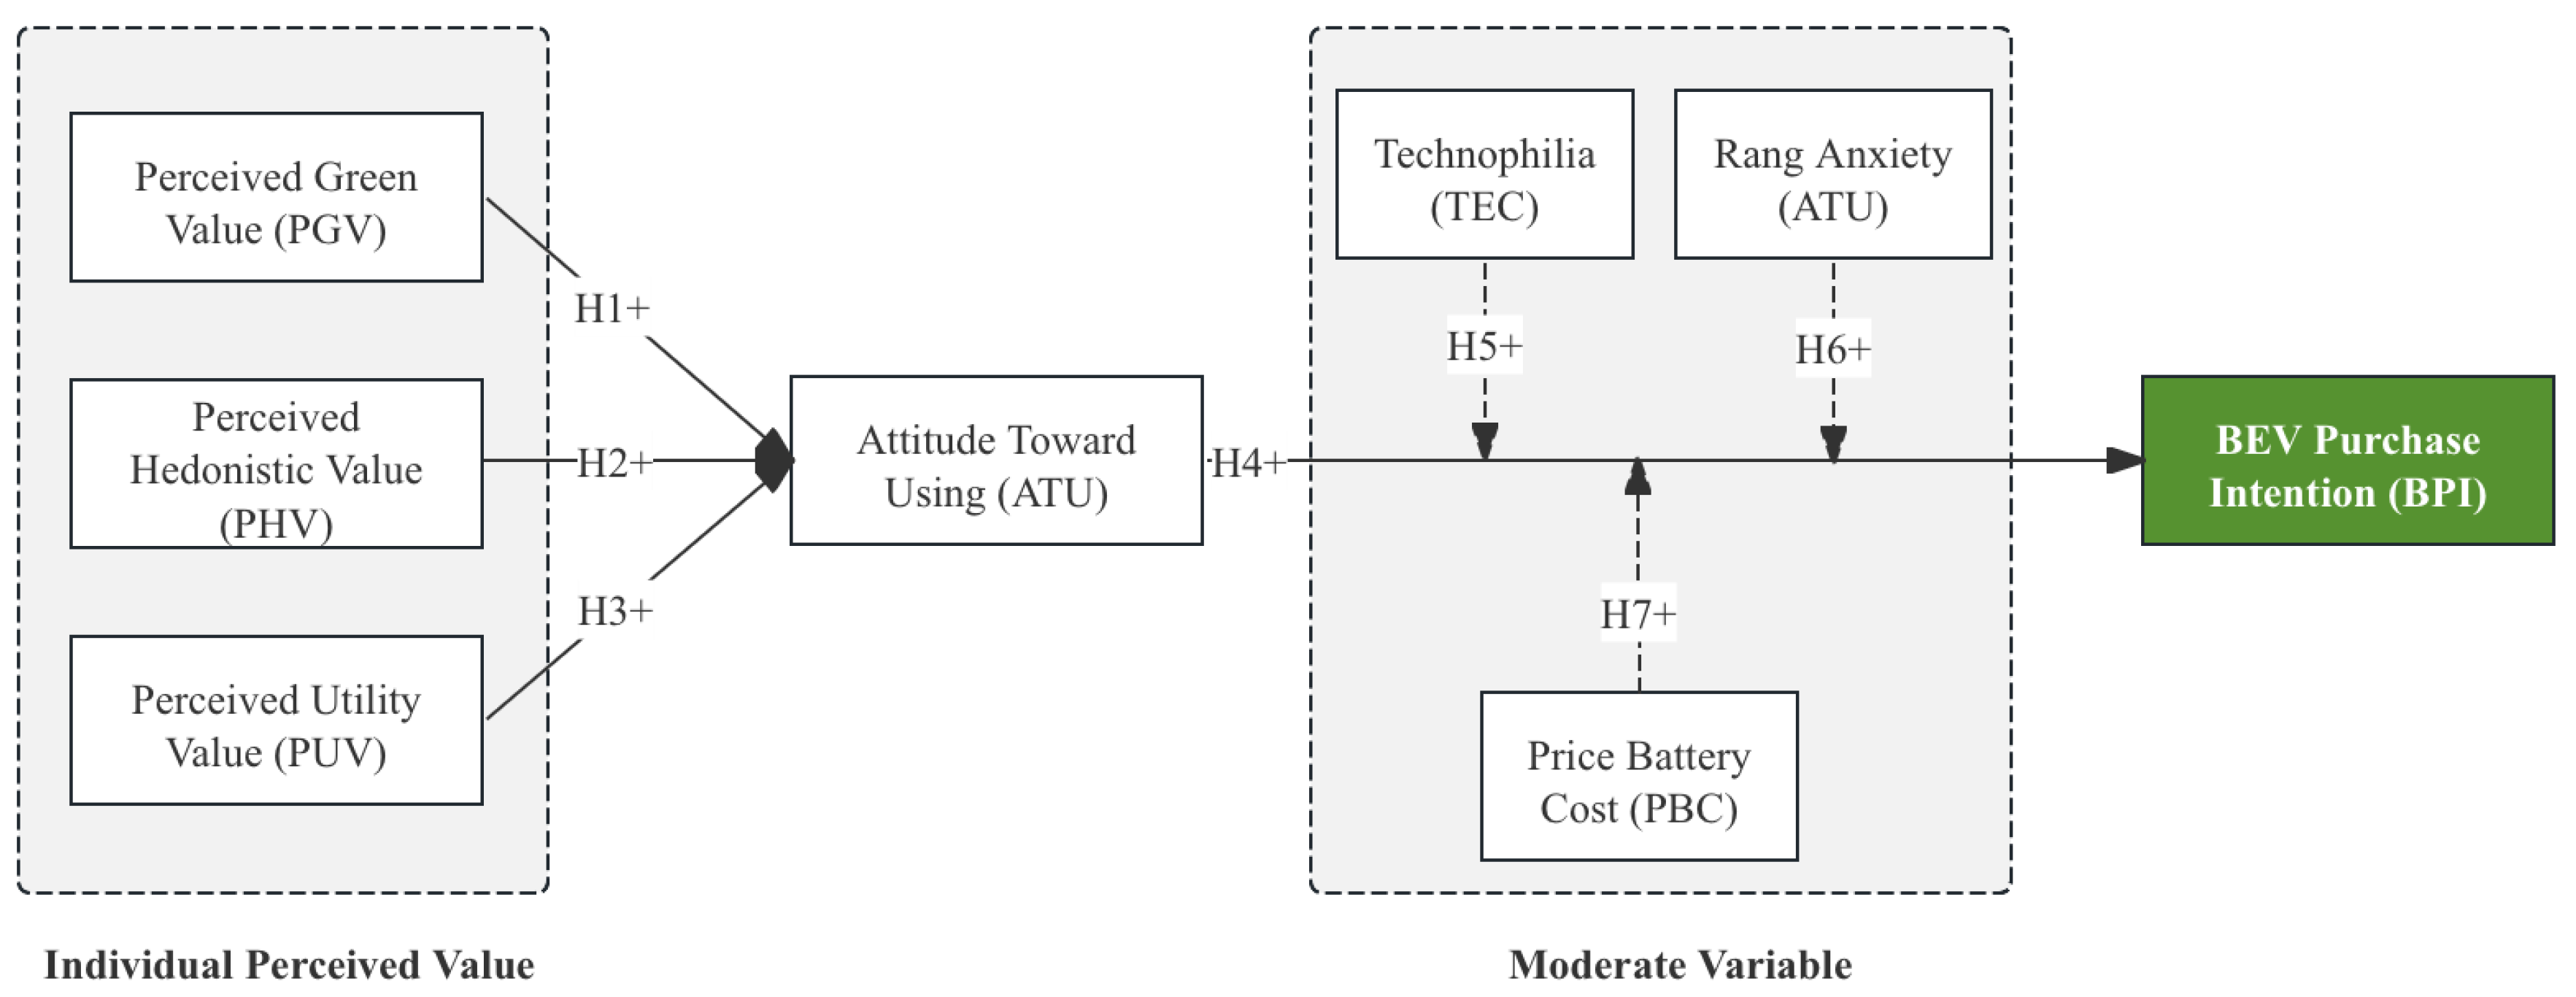
Figure 2.
Latent Variable Correlation Heatmap.
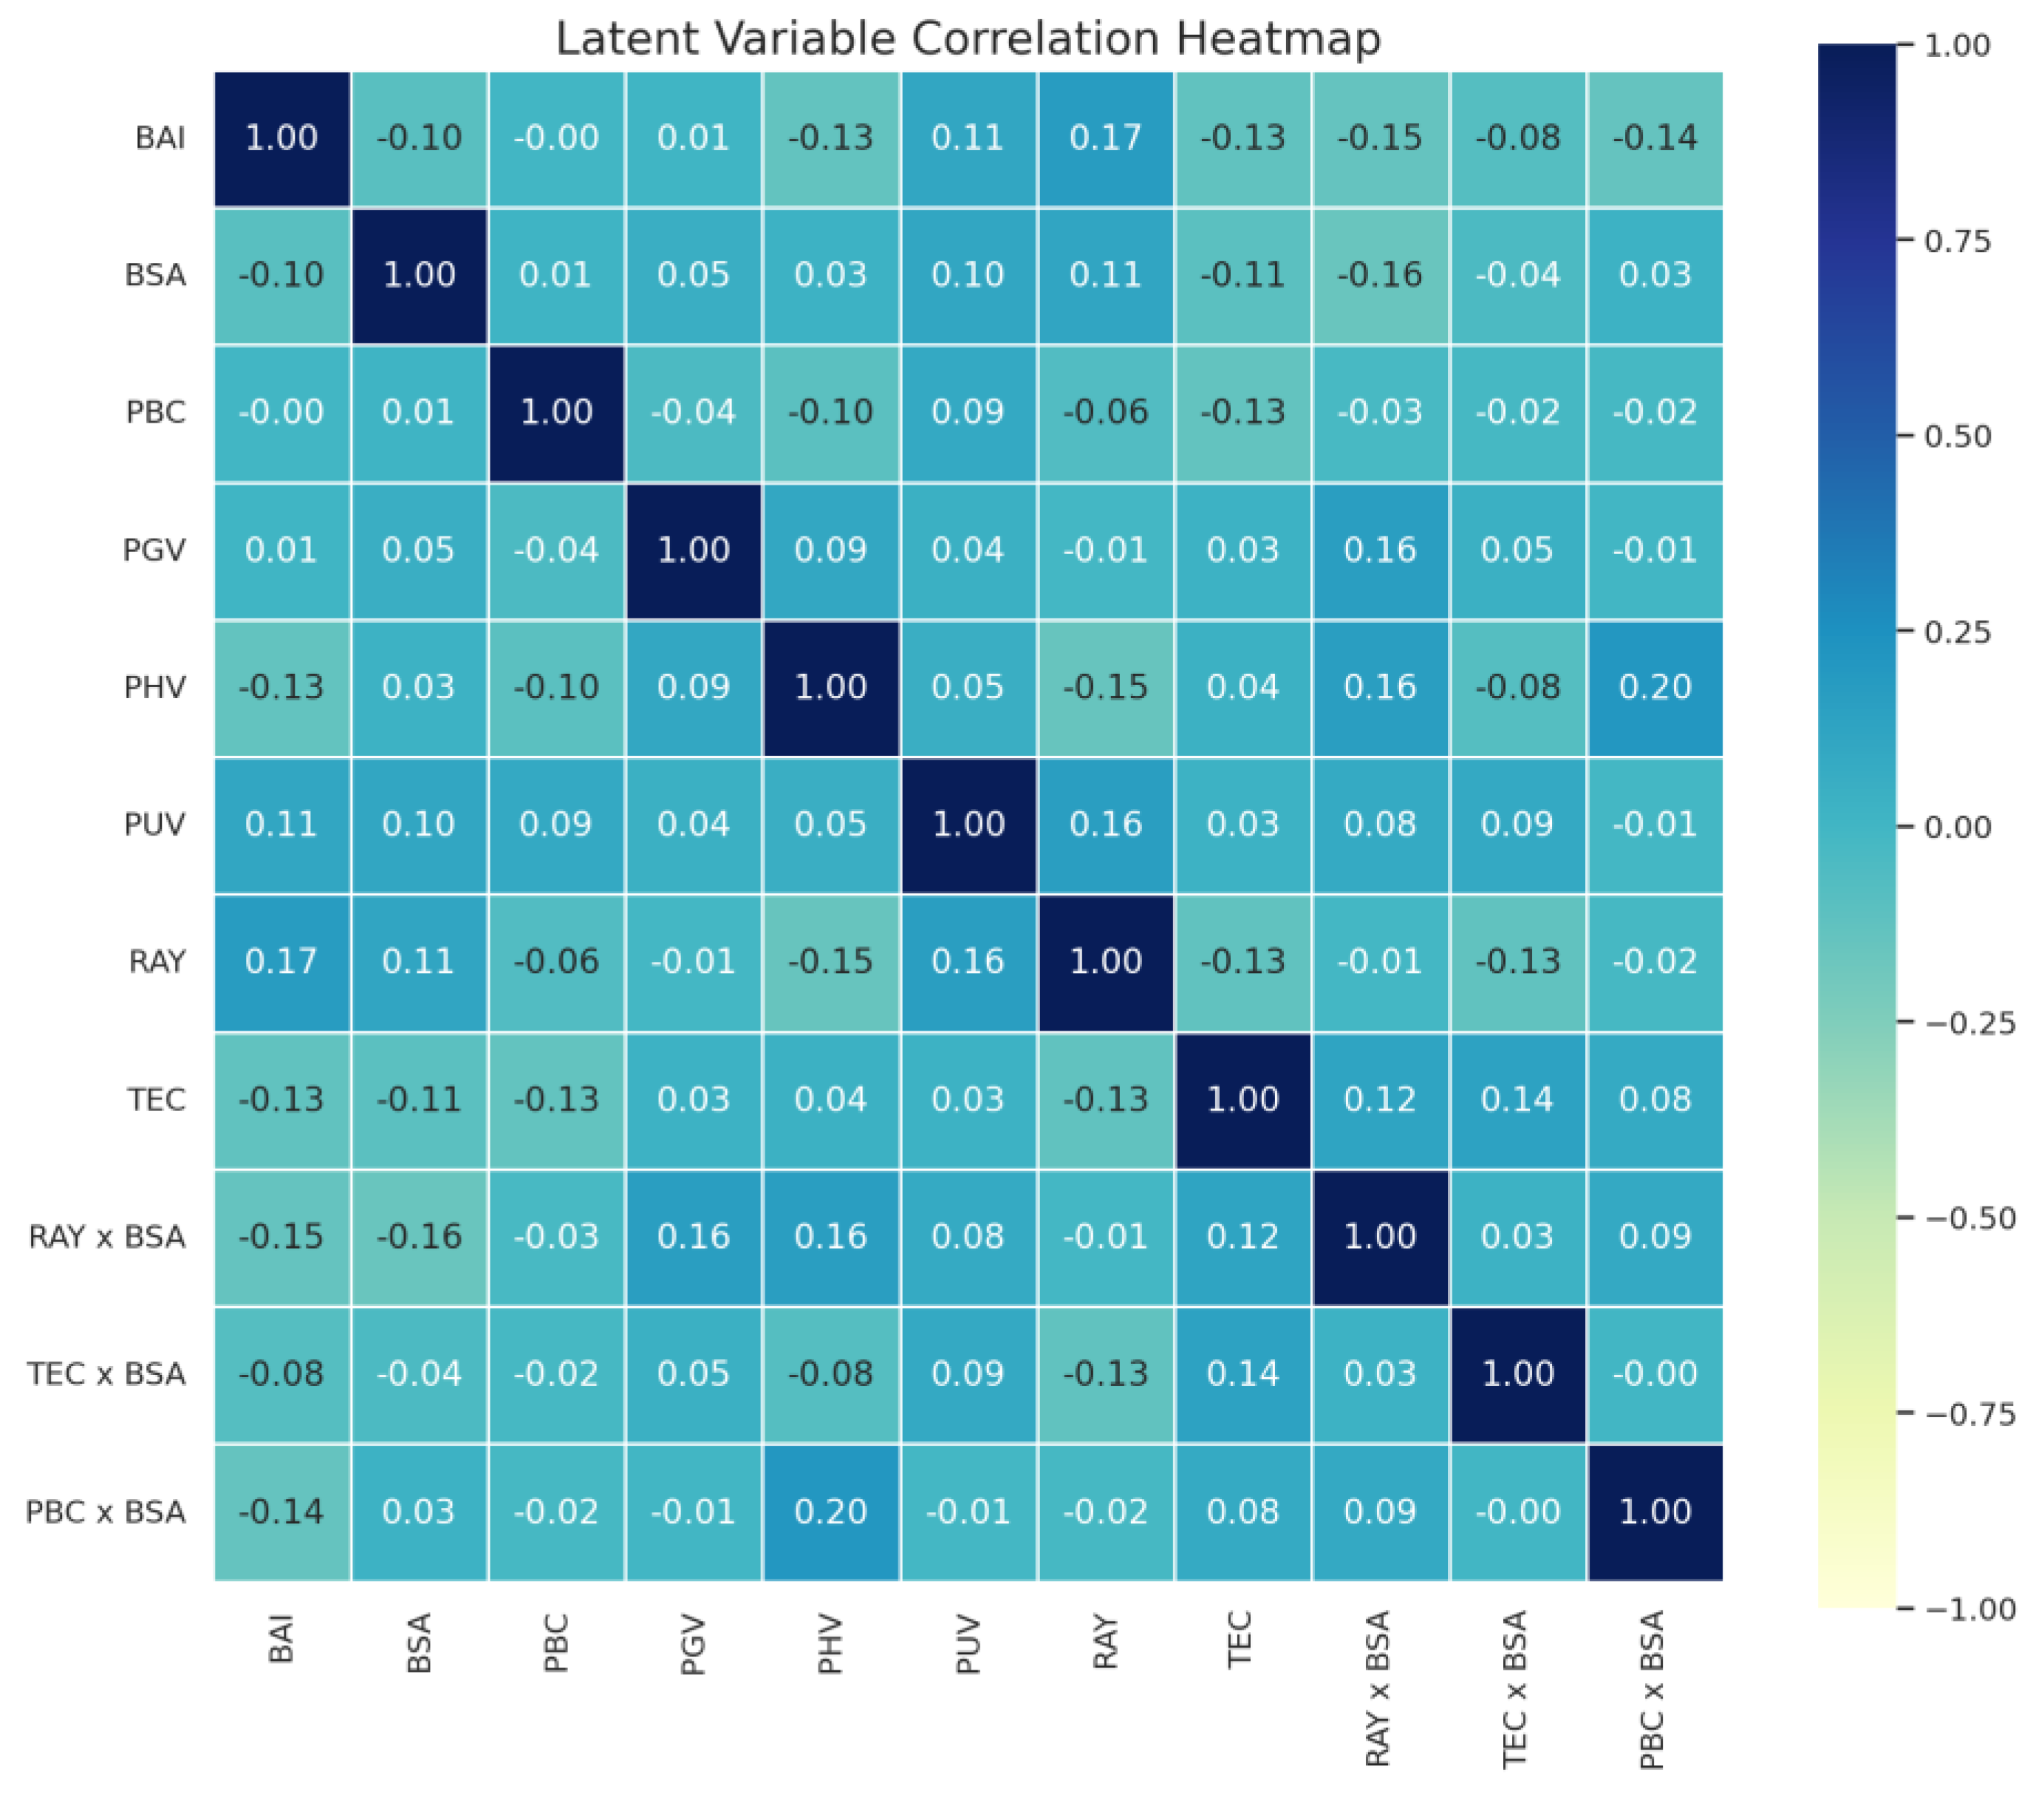
Figure 3.
Scatter plots of necessary condition analysis.
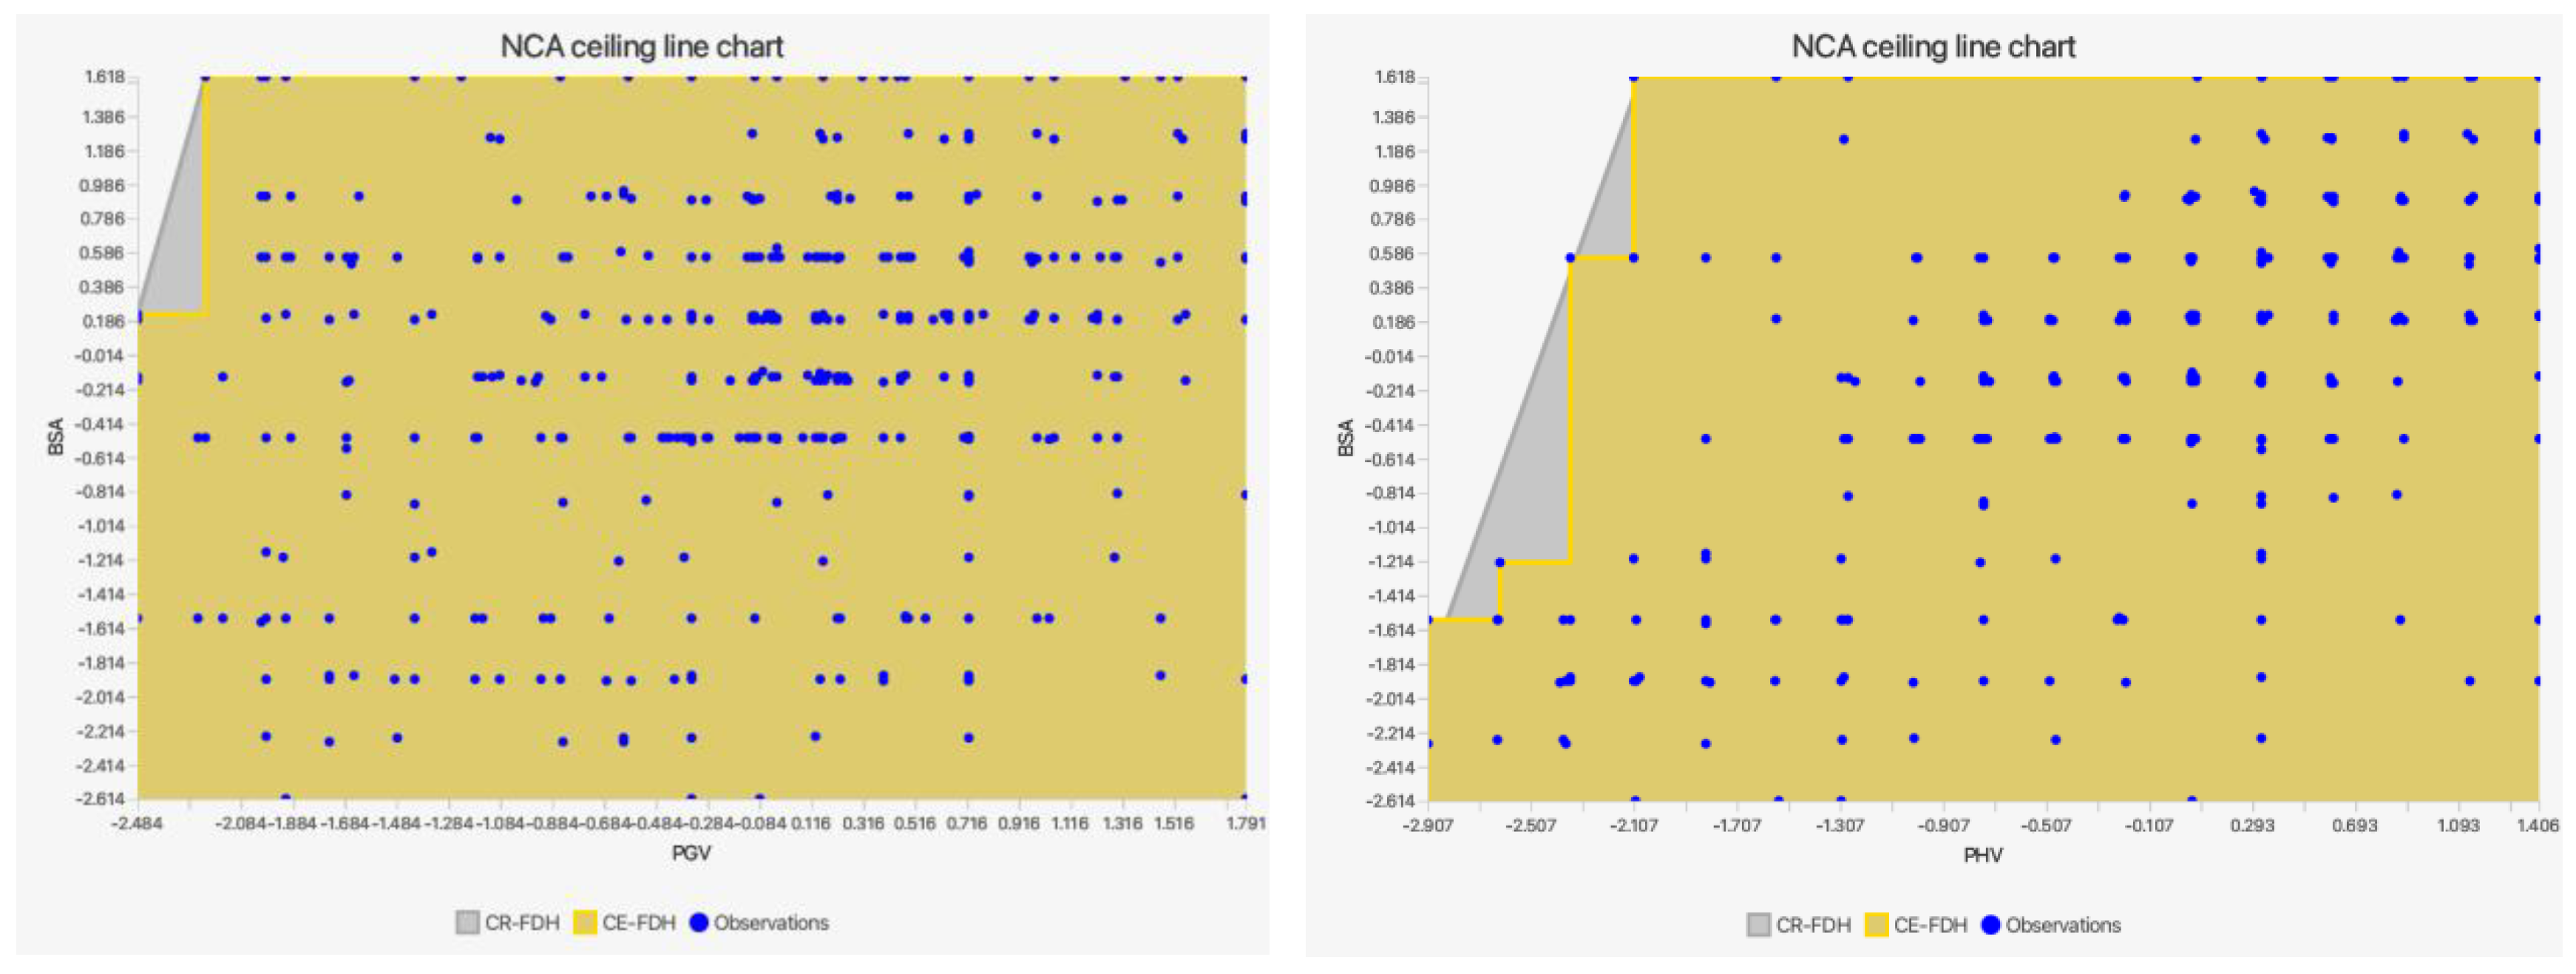
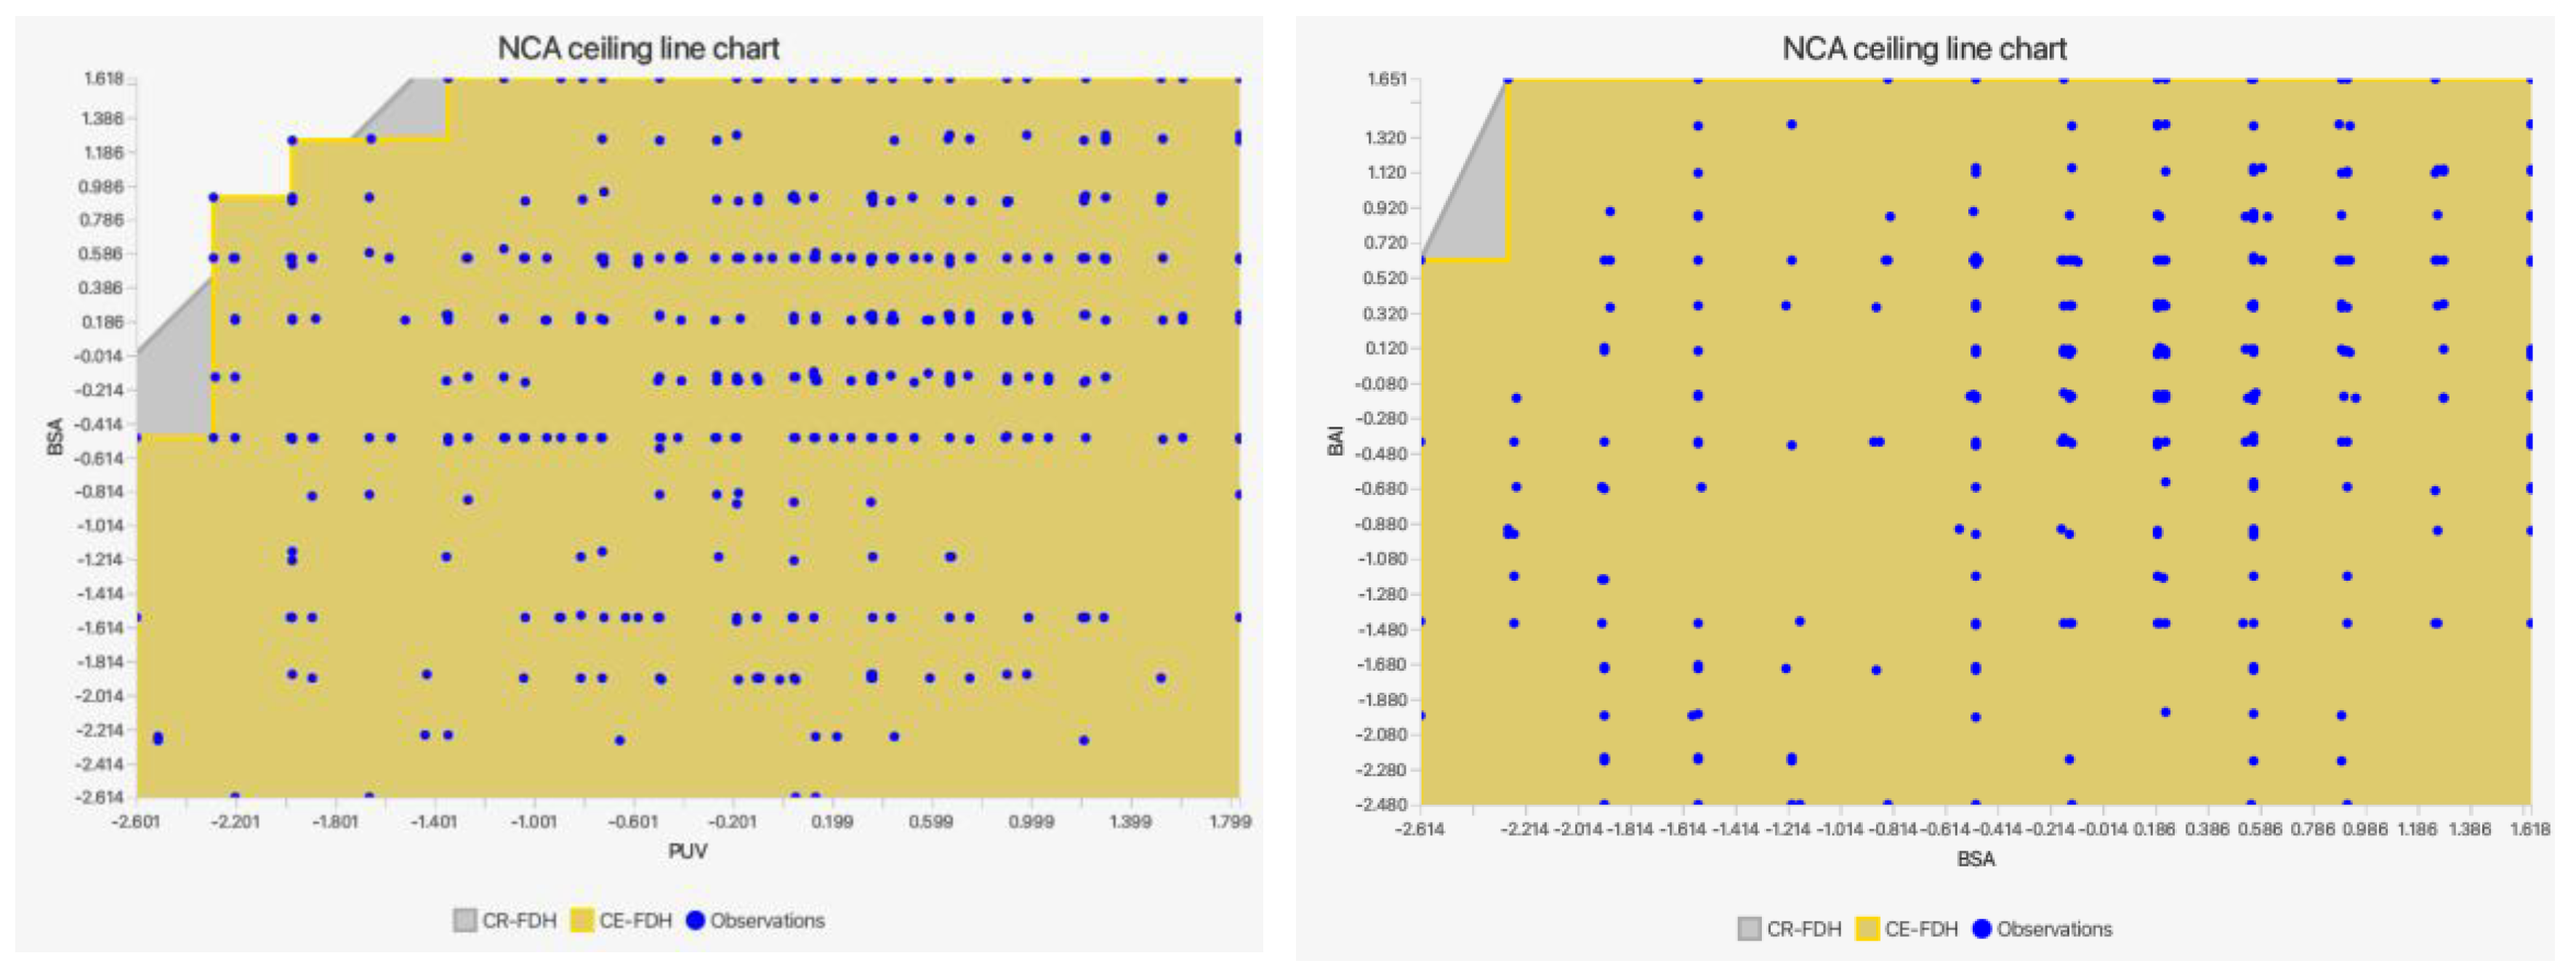

Table 1.
Respondent profiles. Respondent profiles(n=596).
| Variable | Category | Frequency | Percent | Cumulative Percent |
| Sex | Female | 264 | 44.3 | 44.3 |
| Male | 332 | 55.7 | 100 | |
| Age | 18-25 | 76 | 12.8 | 12.8 |
| 26-35 | 149 | 25 | 37.8 | |
| 36-45 | 176 | 29.5 | 67.3 | |
| 45 or above | 195 | 32.7 | 100 | |
| Edu | High School or Below | 144 | 24.2 | 24.2 |
| College Diploma | 117 | 19.6 | 43.8 | |
| Bachelor’s Degree | 109 | 18.3 | 62.1 | |
| Master’s Degree or Above | 226 | 37.9 | 100 | |
| Income | 3000-5000 | 162 | 27.2 | 27.2 |
| 5001-10000 | 224 | 37.6 | 64.8 | |
| 10001-15000 | 130 | 21.8 | 86.6 | |
| 15001-20000 | 55 | 9.2 | 95.8 | |
| 20001 or above | 25 | 4.2 | 100 | |
| Total | 596 | 100 | 100 |
Table 2.
Reliability and convergent validity.
| Construct | Item | Loading | VIF | Cronbach’s alpha | rho_A | CR | AVE |
| BPI | BPI1 | 0.901 | 3.184 | 0.925 | 0.925 | 0.947 | 0.817 |
| BPI2 | 0.903 | 3.266 | |||||
| BPI3 | 0.917 | 3.599 | |||||
| BPI4 | 0.894 | 3.004 | |||||
| ATU | ATU1 | 0.917 | 3.097 | 0.905 | 0.908 | 0.94 | 0.84 |
| ATU2 | 0.919 | 3.007 | |||||
| ATU3 | 0.914 | 2.698 | |||||
| PBC | PBC1 | 0.92 | 3.651 | 0.936 | 0.937 | 0.954 | 0.838 |
| PBC2 | 0.915 | 3.892 | |||||
| PBC3 | 0.93 | 4.24 | |||||
| PBC4 | 0.898 | 3.019 | |||||
| PGV | PGV1 | 0.9 | 2.731 | 0.897 | 0.913 | 0.928 | 0.762 |
| PGV2 | 0.875 | 2.722 | |||||
| PGV3 | 0.866 | 2.544 | |||||
| PGV4 | 0.85 | 2.185 | |||||
| PHV | PHV1 | 0.908 | 3.515 | 0.94 | 0.94 | 0.957 | 0.847 |
| PHV2 | 0.929 | 4.582 | |||||
| PHV3 | 0.934 | 4.692 | |||||
| PHV4 | 0.909 | 3.55 | |||||
| PUV | PUV1 | 0.8 | 1.817 | 0.814 | 0.82 | 0.877 | 0.642 |
| PUV2 | 0.783 | 1.738 | |||||
| PUV3 | 0.826 | 2.332 | |||||
| PUV4 | 0.794 | 2.286 | |||||
| RAY | RAY1 | 0.921 | 2.68 | 0.881 | 0.897 | 0.926 | 0.807 |
| RAY2 | 0.906 | 2.783 | |||||
| RAY3 | 0.867 | 2.131 | |||||
| TEC | TEC1 | 0.911 | 3.515 | 0.94 | 0.942 | 0.957 | 0.846 |
| TEC2 | 0.929 | 4.582 | |||||
| TEC3 | 0.93 | 4.692 | |||||
| TEC4 | 0.91 | 3.55 |
Table 3.
Heterotrait-Monotrait Ratio (HTMT).
| BAI | BSA | PBC | PGV | PHV | PUV | RAY | TEC | RAY x BSA | TEC x BSA | PBC x BSA | |
| BAI | |||||||||||
| BSA | 0.339 | ||||||||||
| PBC | 0.373 | 0.118 | |||||||||
| PGV | 0.543 | 0.262 | 0.355 | ||||||||
| PHV | 0.327 | 0.672 | 0.069 | 0.283 | |||||||
| PUV | 0.067 | 0.221 | 0.160 | 0.112 | 0.096 | ||||||
| RAY | 0.221 | 0.154 | 0.174 | 0.275 | 0.084 | 0.308 | |||||
| TEC | 0.327 | 0.672 | 0.069 | 0.283 | 1.064 | 0.096 | 0.084 | ||||
| RAY x BSA | 0.039 | 0.103 | 0.014 | 0.106 | 0.023 | 0.045 | 0.098 | 0.023 | |||
| TEC x BSA | 0.243 | 0.279 | 0.038 | 0.182 | 0.400 | 0.042 | 0.017 | 0.400 | 0.001 | ||
| PBC x BSA | 0.110 | 0.012 | 0.108 | 0.095 | 0.047 | 0.076 | 0.031 | 0.047 | 0.162 | 0.058 |
Table 4.
Fornell-Larcker Criterion.
| BPI | ATU | PBC | PGV | PHV | PUV | RAY | TEC | |
| BPI | 0.904 | |||||||
| ATU | 0.312 | 0.916 | ||||||
| PBC | 0.347 | 0.11 | 0.916 | |||||
| PGV | 0.494 | 0.241 | 0.322 | 0.873 | ||||
| PHV | 0.305 | 0.622 | 0.066 | 0.261 | 0.92 | |||
| PUV | 0.049 | 0.192 | 0.137 | 0.09 | 0.085 | 0.801 | ||
| RAY | 0.201 | 0.137 | 0.156 | 0.245 | 0.076 | 0.262 | 0.898 | |
| TEC | 0.307 | 0.622 | 0.066 | 0.261 | 1.00 | 0.086 | 0.076 | 0.92 |
Note: The off-diagonal values in the above matrix are the square correlations between the latent constructs and the diagonals (bold) are AVEs.
Table 5.
Assessment of Structural Model.
| Original sample (O) | Standard deviation | T value | P values | VIF | f-square | Result | ||
| ATU -> BPI | 0.151 | 0.048 | 3.148 | 0.002 | 1.696 | 0.018 | Supported | |
| PBC -> BPI | 0.291 | 0.039 | 7.456 | 0 | 1.046 | 0.108 | Supported | |
| RAY -> BPI | 0.119 | 0.04 | 3.00 | 0.003 | 1.053 | 0.018 | Supported | |
| TEC -> BPI | 0.133 | 0.051 | 2.619 | 0.009 | 1.795 | 0.013 | Supported | |
| BPI;R2=0.242;Q2 predict=0.675 | ||||||||
| PGV -> ATU | 0.074 | 0.033 | 2.222 | 0.026 | 1.079 | 0.009 | Supported | |
| PHV -> ATU | 0.591 | 0.036 | 16.445 | 0 | 1.078 | 0.551 | Supported | |
| PUV -> ATU | 0.135 | 0.029 | 4.709 | 0 | 1.012 | 0.031 | Supported | |
| ATU;R2=0.409;Q2 predict=0.637 | ||||||||
| RAY x ATU -> BPI | 0.044 | 0.036 | 1.246 | 0.213 | 1.055 | 0.003 | Not Supported | |
| TEC x ATU -> BPI | -0.096 | 0.031 | 3.096 | 0.002 | 1.182 | 0.018 | Supported | |
| PBC x ATU -> BPI | -0.065 | 0.038 | 1.717 | 0.086 | 1.046 | 0.006 | Not Supported | |
Table 6.
Necessary condition analysis result (Method: CR-FDH).
| Effect size | Ceiling | Slope | Condition inefficiency | Outcome inefficiency | Rel. inefficiency | Abs. inefficiency | p value | |
| PGV | 0.01 | 1 | 5.317 | 93.871 | 67.084 | 97.983 | 17.727 | 0.003 |
| PHV | 0.079 | 3 | 4.219 | 80.824 | 17.559 | 84.191 | 15.367 | 0.000 |
| PUV | 0.048 | 6 | 1.454 | 74.908 | 61.723 | 90.396 | 16.982 | 0.001 |
| ATU | 0.01 | 1 | 3.093 | 92.108 | 74.994 | 98.026 | 17.137 | 0.027 |
Note: ***, p < 0.001.
Table 7.
Bottleneck table(CE-FDH).
| ATU | PGV | PHV | PUV | BAI | ATU |
| 0.00% | NN | NN | NN | 0.00% | NN |
| 10.00% | NN | NN | NN | 10.00% | NN |
| 20.00% | NN | 2.883 | NN | 20.00% | NN |
| 30.00% | NN | 2.782 | NN | 30.00% | NN |
| 40.00% | NN | 2.682 | NN | 40.00% | NN |
| 50.00% | NN | 2.582 | NN | 50.00% | NN |
| 60.00% | NN | 2.481 | NN | 60.00% | NN |
| 70.00% | 2.461 | 2.381 | 2.36 | 70.00% | NN |
| 80.00% | 2.381 | 2.281 | 2.069 | 80.00% | 2.547 |
| 90.00% | 2.302 | 2.18 | 1.778 | 90.00% | 2.414 |
| 100.00% | 2.222 | 2.08 | 1.487 | 100.00% | 2.28 |
Disclaimer/Publisher’s Note: The statements, opinions and data contained in all publications are solely those of the individual author(s) and contributor(s) and not of MDPI and/or the editor(s). MDPI and/or the editor(s) disclaim responsibility for any injury to people or property resulting from any ideas, methods, instructions or products referred to in the content. |
© 2026 by the authors. Licensee MDPI, Basel, Switzerland. This article is an open access article distributed under the terms and conditions of the Creative Commons Attribution (CC BY) license (http://creativecommons.org/licenses/by/4.0/).
Copyright: This open access article is published under a Creative Commons CC BY 4.0 license, which permit the free download, distribution, and reuse, provided that the author and preprint are cited in any reuse.


