

Submitted:
20 March 2026
Posted:
23 March 2026
You are already at the latest version
Abstract
This study analyzes the vibrations to which the WBV of an agricultural tractor operator is exposed during the performance of three different tillage’s: Standard Tillage (ST), System Deep (CTD) and System Shallow (CTS). Measurements were carried out according to ISO 2631-1 and ISO 2631-4 in three coordinate axes (x, y, z). The analysis and statistical processing carried out indicates that none of the mean vibration values exceeds the prescribed limit value of 1.15 m/s² according to Directive 2002/44/EC, but exceeds the daily warning value of 0.5 m/s². From the above, it can be assumed that the operator of the investigated tractor may be exposed to the occurrence of occupational diseases by long-term exposure to such vibrations. The highest vibrations in the x and y axes were recorded when working with the ripper, while in the z-axis they were the highest in the loosener. Although the measured values are within safe (permissible) limits, further research on this topic and optimization of operation can further reduce the burden on the operator.
Keywords:
whole-body vibration
; agricultural tractor
; reduced tillage
1. Introduction
One of the more important and extensively researched factors in ergonomics [1], particularly with regard to the development of agricultural tractors, is whole-body vibration (WBV) affecting the tractor operator. Vibrations occur as a result of engine operation, transmission operation, tractor movement during various agricultural operations, movement on different types of agricultural surfaces, varying travel speeds, different tire inflation pressures, and other factors.
Excessive exposure of tractor operators to elevated levels of whole-body vibration can lead to the development of occupational diseases affecting the cardiovascular system, spine, hips, feet, and other parts of the musculoskeletal system [2]. Furthermore, such disorders may manifest through improper functioning of bodily organs. Each organ operates within a certain natural frequency range, and when the frequency of external vibration coincides with the natural frequency of an organ, resonance may occur, potentially resulting in impaired physiological functioning.
In addition to health risks, excessive vibration significantly affects the operator’s work performance. This influence is manifested through improper operation during various agrotechnical tasks, primarily due to fatigue, irritability, reduced concentration, and slower reaction times. In response to the need to reduce whole-body vibration exposure, tractor manufacturers have introduced several technical solutions, including front axle suspension systems, cab suspension systems, improved seat suspension mechanisms, and the use of anti-vibration materials.
According to Directive 2002/44/EC [3], exposure values for whole-body vibration affecting agricultural tractor operators are defined as follows:
- daily vibration exposure limit value: 1,15 m/s2;
- vibration exposure action value: 0,5 m/s2.
Singh et al. [4] state that predicting lumbar spine health is essential for developing effective ergonomic strategies for tractor operators exposed to WBV. The aim of their study was to predict the static compression dose (Sed), a key indicator of lumbar spine load according to ISO 2631-5, by comparing classical regression models with ensemble machine learning models. Three tractor operating parameters were considered: average speed, average tillage depth, and tractive effort, in order to estimate Sed during rotary tillage operations. The results showed that newer modeling approaches provided more accurate predictions. Such research has important implications for improving occupational health and safety among tractor operators and may contribute to improved ergonomic tractor design aimed at reducing lumbar spine strain. Another study conducted by Singh et al. [5] examined the exposure of tractor operators to whole-body vibration in the head–seat system during tractor-loader operations. Measurements were carried out with nine different operators. The researchers developed an Internet of Things (IoT) module for real-time data transmission to improve experimental efficiency and reduce potential human error during measurements. The results indicated that the highest vibration levels occurred in the z-axis direction, exceeding the action value of 0.5 m/s2 specified in Directive 2002/44/EC. Singh et al. [6] investigated the transmission of vibration from the seat to the back of a tractor operator. A smart device was used for real-time data transfer in order to improve measurement reliability and eliminate potential sources of error. The results showed that both the seat panel and the backrest experienced high vibration levels in the vertical z-axis, exceeding the 0.5 m/s2 action value defined by Directive 2002/44/EC.
According to Oncescu et al. [7], whole-body vibration is a potential cause of occupational diseases among tractor operators. To minimize this risk, as well as to reduce fatigue and irritability while improving comfort and safety, electric tractors are increasingly being considered. The same authors reported that a literature review indicated that WBV levels in electric tractors largely depend on the type of agrotechnical operation performed, tractor speed, and surface conditions. In their study, measurements were conducted with an electric tractor traveling at 5 km/h on different agrotechnical surfaces (flat road, uneven road, rough road, and plowed soil). The results showed that the highest WBV values occurred in the z-axis direction across all surfaces and exceeded the action value of 0.5 m/s2 specified in Directive 2002/44/EC. Further research involved measuring whole-body vibration on an agricultural tractor operating on four different agrotechnical surfaces (straight terrain, uncultivated land, uneven ground, and plowed land) at two travel speeds of 5 and 10 km/h. The results showed that vibration values significantly exceeded the action value of 0.5 m/s2 across all surfaces and speeds, as reported by Oncescu et al. [8]. In another study, Oncescu et al. [9] compared WBV exposure between operators of electric and diesel tractors under identical operating conditions. Measurements were conducted on four agrotechnical surfaces and at two travel speeds (5 and 10 km/h). The results indicated that higher vibration levels were consistently recorded in tractors equipped with diesel engines, which was expected due to their mechanical characteristics. Mohammadi et al. [10] stated that whole-body vibration is one of the primary causes of musculoskeletal disorders among tractor operators. Their study investigated permissible exposure time, the caution limit, and operator response to vibration from the seat of an ITM 475 four-wheel-drive tractor according to ISO 2631-1. The factors considered included engine speed, transmission ratio, and road condition. The results indicated that the main factors and their interactions significantly influenced the total vibration transmitted from the tractor seat at the 1% probability level. The minimum permissible exposure time and the caution limit were determined to be 1.16 h and 0.14 h, respectively, indicating a highly uncomfortable exposure range. Engine speed had a greater influence on permissible exposure time than gear selection. The maximum vibration value measured was 1.49 m/s2, exceeding the limit value of 1.15 m/s2 specified in Directive 2002/44/EC. Prakash et al. [11] conducted a study examining whole-body vibration exposure in terms of daily vibration exposure A(8), weighted acceleration response (Awz) at the seat base, health guidance caution zones (HGCZ), and vibration damping ratio (VDR) in three tractor operators. Measurements were performed under three driving conditions: forward speed (five levels), road roughness (five levels), and two driving postures (upright sitting with backrest contact (P1) and free sitting without backrest contact (P2)). The experimental design was based on response surface methodology (RSM). Measured vibration values ranged from 0.62–1.00 m/s2 (operator 1), 0.60–0.94 m/s2 (operator 2), and 0.49–0.90 m/s2 (operator 3), indicating that most values exceeded the action value of 0.5 m/s2. Naveen et al. [12] investigated WBV exposure during tractor transport operations and developed cost-effective mitigation strategies. WBV measurements were conducted at the operator’s seat during transport with a trailer under three loading conditions: no load, half load (3715 kg of soil), and full load (5910 kg of soil). Measurements were performed on two surfaces (asphalt and farm road) at various travel speeds. The speeds recommended by ISO 5008-1979 (10, 12, and 14 km/h on asphalt; 4, 5, and 7 km/h on farm roads) as well as speeds preferred by operators (18, 20, and 22 km/h on asphalt; 8, 10, and 12 km/h on farm roads) were considered. Two vibration reduction interventions were developed: a single-point spring coupling (I1) and a polyurethane (PU) bushing (I2) installed between the tractor and the trailer. Vibration values in the x, y, and z axes increased with increasing speed and trailer load on both surfaces. However, the implemented interventions reduced vibration levels in all three axes across all tested speeds and loads. On asphalt, vibration values ranged from 0.44 to 1.32 m/s2, while on farm roads they ranged from 0.33 to 1.54 m/s2, exceeding both the action value (0.5 m/s2) and the limit value (1.15 m/s2).
Almady et al. [13] measured WBV exposure of a tractor operator during soil cultivation with a disc harrow at three speeds (4.0, 5.5, and 7.0 km/h) and a working depth of 15 cm in sandy loam soil. The results indicated that vibration levels increased with increasing cultivation speed. The highest vibration level (0.80 m/s2) was recorded in the z-axis direction at 7 km/h, while the lowest value (0.12 m/s2) was recorded in the y-axis direction at 4 km/h. The maximum value exceeded the action value of 0.5 m/s2. Pochi et al. [14] emphasized that vibration is one of the key factors affecting operator health and comfort. In an effort to improve tractor design, manufacturers developed a prototype cab equipped with an automatic self-leveling system, designed to maintain proper spinal alignment during demanding agricultural operations such as primary tillage. The prototype cab was tested during tillage operations with a cutting plough and a rooting plough on both flat and sloped terrain. The results showed a reduction in vibration levels when the self-leveling system was active compared with conventional cab configurations. To mitigate soil compaction caused by repeated passes of tractor–implement aggregates, soil loosening through vibration-based methods has been explored as an effective deep tillage technique. Vibratory subsoilers can significantly reduce the tractive force required compared to conventional implements, enabling the use of smaller and less powerful tractors. Fanigliulo et al. [15] investigated a single tiller equipped with an innovative oscillating working tool, focusing on dynamic energy requirements, tillage quality, and whole-body vibration transmitted to the operator. Measurements were performed using two four-wheel-drive tractors with different engine powers and masses, with the oscillating tool alternately activated and deactivated in a dense poplar plantation. The results indicated that the oscillating implement reduced traction force, required traction power, fuel consumption, and tractor wheel slip while maintaining tillage efficiency. However, measured vibration levels exceeded the permissible limit value of 1.15 m/s2 when the oscillating tool was active.
The aim of the present research is to determine the levels of whole-body vibration experienced by an agricultural tractor operator during three different primary soil cultivation methods. Based on the obtained results, recommendations will be provided regarding the soil cultivation method that results in the lowest vibration exposure, thereby minimizing potential health risks for the tractor operator.
2. Materials and Methods
The research was conducted at the experimental field (Figure 1) of the Križevci Polytechnic. Whole-body vibrations of the tractor operator were measured at the seat of an agricultural tractor during different soil tillage operations: ST – Standard Tillage, CTD – Conservation Tillage Deep, and CTS – Conservation Tillage Shallow.
The test field was divided into three equal sections according to the tillage operation. Each section was further divided into two parts: a preparatory section of 10 m and a measuring section of 100 m (Figure 1).
The research was carried out using a device for measuring the whole-body vibration of the tractor operator seated on an agricultural tractor, brand MMF, type VM30 (Table 1), equipped with an appropriate sensor. Vibration measurements were performed along all three axes (x, y, and z) of the coordinate system. The weighting filters Wd (for the x and y axes) and Wk (for the z axis) were applied during the measurements, in accordance with the requirements of the HRN ISO 2631-1 standard [16] (Figure 2).

Table 1.
Technical specifications of the WBV measuring device brand MMF type VM30.
| Measuring range | Sensor (1 mV/ms-2) | Whole body vibration 0.10-12.00 / 1.0-120.0 / 10-1200 / 1000 / 6000 ms-2peak; Acceleration 0.10-12.00 / 1.0-120.0 / 10-1200 / 1000 / 6000 ms-2peak; Speed 0.001-0.120 / 0.010-1200 / 0.10-0.12 / 1.00 / 60.00 ms-1peak; Shift 0.001-0.120 / 0.010-1200 / 0.10-0.12 / 1.00 / 60.00 mmpeak. |
| Accuracy Non-linearity error |
±3% and ±2 digits. <5% readings in all measurement ranges. |
|
| Screen display mode | Working RMS (1 s), maximum working RMS (MTVV), interval RMS (do 10 h), value of the estimated vibration quantity (eVDV), total vibration value (Ahv), highest value (1 s), maximum of the highest value and crest factor | |
| Weighted filters | Wb, Wc, Wd, We, Wg, Wh, Wj, Wk, Wm | |
| Screen | Graphic LCD display with 32 x 120 dots and LED backlight, 3 vibration values with units and operating mode | |
| Sensor input | 3 IEPE inputs, plug type Binder 711, female, 4 pins | |
| IEPE power supply | 3 constant current sources, 2 A, total voltage 20V | |
| Recommended sensors | KB103SV-100 for whole body vibration measurement (1 mV/s-2) | |
| Memory | Flash memory for 1000 to 3000 measured values, depending on the recording mode | |
| Recording modes | Manually using the SAVE button or Logging mode, time-controlled from 1 s to 10 h | |
| Operating temperature range | -20 ºC to 40 ºC | |
| Dimensions | 165 x 92 x 31 mm3 | |
According to HRN ISO 2631-1 [16] the R.M.S. method of measurement in motion takes into account intermittent impulse and transient vibrations using a short integration time constant. The vibration magnitude is defined as the maximum transient vibration value (MTVV), which is the maximum for aw(t0):
aw(t) – current frequency of measured acceleration (ms-2)
τ – integration time for continuous averaging
t – time (s)
t0 – observation time (s)
MTVV = max [aw(t0)]
MTVV - maximum transient vibration value (ms-2)
Guidelines for evaluating the effects of vibration and rotational motion on passenger and operator comfort in transport systems are defined in the HRN ISO 2631-4 standard [17]. The same standard specifies the correct mounting of the torso vibration sensor on the seat, with the axes oriented as follows (Figure 2):
- x-axis: longitudinal, in the direction of travel – forward (positive) / backward (negative);
- y-axis: lateral, perpendicular to the direction of travel (left/right);
- z-axis: vertical, perpendicular to the floor – upward (positive) / downward (negative).
The agricultural tractor used in the research (Figure 2) was a Valtra model N141, manufactured in 2009, with 3,278 operating hours. The tractor has an engine power of 111.9 kW, electric transmission and hydraulic control, mechanical cab suspension, and a pneumatic seat suspension system.
The attached implements (Figure 3) used during the measurements of whole-body vibration (WBV) for different tillage operations had the following working depths (a) and working widths (b):
- 1)
- plough (ST) (a = 30 cm, b = 1.5 m),
- 2)
- subsoiler (CTD) (a = 30 cm, b = 2.5 m), and
- 3)
- soil loosener (CTS) (a = 10 cm, b = 3.0 m).
The soil type on which the WBV measurements were conducted was the same for all treatments (hydromorphic soil, Gleysols group). The tractor travel speed during all operations was maintained at 8 km/h, while the tire inflation pressure was set to 2.4 bar.
Measurements were performed in such a way that each pass was recorded separately, and the average value per pass was subsequently calculated. During the measurements, the measuring range of the whole-body vibration device was set to 12 m/s2. This range was selected to ensure sufficient precision of the measured values (two decimal places).
The transfer and processing of the recorded data were carried out using a Microsoft Excel file with an integrated Visual Basic macro. Statistical data processing included descriptive statistics, analysis of variance (ANOVA), and graphical presentation using boxplots.
3. Results and Discussion
The following tables and boxplots present the measured values of the operator’s whole-body vibration (WBV) at the seat of the agricultural tractor for each axis separately.
The results of descriptive statistics related to the mean values of the measured vibrations in the direction of all three axes show that the largest standard error was observed in the System Shallow (CTS) treatment. In contrast, the smallest standard error in all three axes was determined in the Standard Tillage (ST) treatment, except for vibrations in the x-axis direction, where the smallest value was determined in the System Deep (CTD) treatment (Table 1).
Table 1.
Descriptive statistics of mean values of vibrations during different soil tillage operations.
Table 1.
Descriptive statistics of mean values of vibrations during different soil tillage operations.
| N | Mean WBV m/s2 |
Std. Deviation | Std. Error | 95% Confidence Interval for Mean | Min | Max | ||
| Lower Bound | Upper Bound | |||||||
| x axis | ||||||||
| ST | 27 | 0.285 | 0.0864 | 0.0166 | 0.251 | 0.319 | 0.2 | 0.6 |
| CTD | 16 | 0.350 | 0.0632 | 0.0158 | 0.316 | 0.384 | 0.3 | 0.5 |
| CTS | 13 | 0.354 | 0.0776 | 0.0215 | 0.307 | 0.401 | 0.3 | 0.5 |
| Total | 56 | 0.320 | 0.0840 | 0.0112 | 0.297 | 0.342 | 0.2 | 0.6 |
| y axis | ||||||||
| ST | 27 | 0.715 | 0.0864 | 0.0166 | 0.681 | 0.749 | 0.5 | 0.8 |
| CTD | 16 | 0.550 | 0.1033 | 0.0258 | 0.495 | 0.605 | 0.4 | 0.7 |
| CTS | 13 | 0.446 | 0.1050 | 0.0291 | 0.383 | 0.510 | 0.3 | 0.6 |
| Total | 56 | 0.605 | 0.1470 | 0.0196 | 0.566 | 0.645 | 0.3 | 0.8 |
| z axis | ||||||||
| ST | 27 | 0.426 | 0.0903 | 0.0174 | 0.390 | 0.462 | 0.3 | 0.5 |
| CTD | 16 | 0.344 | 0.0727 | 0.0182 | 0.305 | 0.383 | 0.3 | 0.5 |
| CTS | 13 | 0.392 | 0.0862 | 0.0239 | 0.340 | 0.444 | 0.3 | 0.5 |
| Total | 56 | 0.395 | 0.0903 | 0.0121 | 0.370 | 0.419 | 0.3 | 0.5 |
The highest vibration values affecting the operator’s whole body were determined in the y and z-axis directions for ST while in the x-axis direction they were confirmed for CTS which is consistent with the findings reported by authors [14,18]. The occurrence of the highest vibration levels can be explained as follows. In the case of CTS during the measurements a noticeable forward and backward movement of the tractor was observed due to the smaller working depth. which is characteristic of vibrations in the x-axis direction. In the case of ST during operation the tractor moves with one row of wheels in the furrow. causing the tractor to tilt. which is characteristic of lateral vibrations in the y-axis direction. while at the same time the tractor encounters vertical irregularities of the terrain. which results in vibrations in the z-axis direction.
Furthermore. the lowest vibration values were determined in the following cases: for ST in the x-axis direction. for CTS in the y-axis direction. and for CTD in the z-axis direction. These results can be explained as follows. In the case of ST when the tractor operates under a relatively constant load. no noticeable forward or backward movement occurs. In the case of CTS the larger working width of the implement provides greater operational stability. In the case of CTD the greater working depth allows the tractor to maintain a more stable and level movement compared to the ST treatment.
The results obtained in this research differ from those reported by authors [5,6,8,10,19]. where the highest vibration levels were measured in the y-axis direction. However. similar to the present study. those authors also determined statistically significant differences between the mean vibration values using analysis of variance.
The analysis of variance (ANOVA) of the mean vibration values in the x. y. and z-axis directions (Table 2) indicates statistically significant differences between the mean vibration values obtained for all soil tillage treatments. Similar results were reported by authors [20,21]. who also found statistically significant differences in the mean values for all three measurement axes. In contrast. author [19] reported statistically significant differences only in the y and z-axis directions.
Multiple comparisons of vibration levels for different tillage treatments using Tukey’s test and the LSD test revealed the same statistically significant differences in the following axes (Table 3):
• x-axis: comparison between ST and CTD ST and CTS and CTD and ST;
• y-axis: statistically significant differences were found in all comparisons;
• z-axis: comparison between ST and CTD and between CTD and ST.
These results differ from those reported by author [19]. where multiple comparison using Tukey’s test identified statistically significant differences only in the y and z-axis directions.
The presented boxplots of vibration values for different soil tillage treatments show the following median distributions: in the x-axis direction. the smallest median value was observed for ST while the largest values were equal for CTD and CTS. In the y-axis direction. the smallest median value was recorded for CTS while the largest was recorded for ST. In the z-axis direction. the smallest median value was determined for CTD while the largest was recorded for ST.
Furthermore. the smallest dispersion of WBV data is visible in the y-axis direction for ST and CTD and in the z-axis direction for CTD. The largest dispersion was observed in the y-axis direction for CTS and in the z-axis direction for ST and CTS. The dispersion of data in the x-axis direction is similar for all soil tillage treatments (Figure 4, Figure 5 and Figure 6). These results partially correspond to the findings reported by author [22]. where greater dispersion was observed in the x and y-axis directions.
4. Conclusions
The aim of this study was to determine the levels of whole-body vibration (WBV) at the operator’s seat of an agricultural tractor in relation to three different soil tillage operations.
Based on the conducted research. the following conclusions can be drawn:
- The highest vibration level at the operator’s seat of the agricultural tractor was determined in the x-axis direction for the System Shallow (CTS) treatment (0.354 m/s2). while in the y-axis (0.715 m/s2) and z-axis (0.426 m/s2) directions the highest values were recorded for Standard Tillage.
- The lowest vibration levels at the operator’s seat were determined in the x-axis direction for Standard Tillage (0.285 m/s2). in the y-axis direction for System Shallow (CTS) (0.446 m/s2). and in the z-axis direction for System Deep (CTD) (0.344 m/s2).
- The analysis of the measured vibration values showed that none of the recorded values exceeded the vibration action value of 0.5 m/s2. except for vibrations in the y-axis direction during Standard Tillage (ST) (0.715 m/s2). Based on the measured and statistically processed data. and in order to avoid potential health risks for the operator. the use of the System Deep (CTD) and System Shallow (CTS) soil tillage methods can be recommended.
- Analysis of variance (ANOVA) between the mean vibration values for different tillage treatments revealed a statistically significant difference in the mean values across all three measurement axes.
- Multiple comparison of vibration values for different tillage treatments using Tukey’s test and the LSD test showed partial statistical significance in the x and z-axis directions. while in the y-axis direction statistically significant differences were found for all treatment combinations.
- Future research should include a wider range of soil types. a larger number of tractors with equal or different engine powers. and additional technical parameters such as seat suspension. cab suspension. and front axle suspension. Furthermore. future studies should consider incorporating medical indicators. such as blood pressure. in order to better assess the physiological effects of whole-body vibration on tractor operators.
Author Contributions
Conceptualization. Ž.B. and D.J.; methodology. Ž.B. and D.J.; software. Ž.B.; validation. Ž.B. I.P. T.J. E.D. D.J. and M.M.; formal analysis. Ž.B.; investigation. Ž.B.; resources. Ž.B.; data curation. Ž.B. and T.J.; writing—original draft preparation. Ž.B. T.J. I.P. and M.M.; writing—review and editing. Ž.B. I.P. T.J. E.D. D.J. and M.M.; visualization. Ž.B.; supervision. T.J.; project administration. M.M.; funding acquisition. Ž.B. I.P. T.J. E.D. D.J. and M.M. All authors have read and agreed to the published version of the manuscript.
Funding
This research received no external funding.
Data Availability Statement
The data presented in this study are available on request from the corresponding author.
Acknowledgments
This research was supported by the Croatian Science Foundation under the project “Assessment of conservation soil tillage as advanced methods for crop production and prevention of soil degradation–ACTIVEsoil” (IP-2020–02–2647) and scientific project “Prediction of maize yield potential using machine learning models based on vegetation indices and phenological metrics from Sentinel-2 multispectral satellite images (AgroVeFe)—581-UNIOS-30”. which was funded by the European union—NextGenerationEU.
Conflicts of Interest
The authors declare no conflicts of interest.
References
- Gubiani. R.; Zucchiatti. N.; Da Broi. U. Whole-Body Vibration for Tractor Drivers. In Proceedings of the AIIA 2022: Biosystems Engineering Towards the Green Deal; Ferro. V. Giordano. G. Orlando. S. Vallone. M. Cascone. G. Porto. S.M.C. Eds.; Springer International Publishing: Cham. 2023; pp. 605–613.
- Vitale. E.; Vella. F.; Matera. S.; Rizzo. G.C.; Rapisarda. L.; Roggio. F.; Musumeci. G.; Rapisarda. V.; Romano. E.; Filetti. V. Precision Agriculture: Assessment of Ergonomic Risks of Assisted Driving System. Applied Sciences 2024. 14. [CrossRef]
- Directive 2002/44/EC of the European Parliament and of the Council of 25 June 2002 on the Minimum Health and Safety Requirements Regarding the Exposure of Workers to the Risks Arising from Physical Agents (Vibration) (Sixteenth Individual Directive within the Meaning of Article 16(1) of Directive 89/391/EEC) - Joint Statement by the European Parliament and the Council; 2002; Vol. 177;.
- Singh. A.; Nawayseh. N.; Doyon-Poulin. P.; Milosavljevic. S.; Dewangan. K.N.; Kumar. Y.; Samuel. S. Comparative Analysis of Classical and Ensemble Models for Predicting Whole Body Vibration Induced Lumbar Spine Stress. A Case Study of Agricultural Tractor Operators. International Journal of Industrial Ergonomics 2025. 108. 103775. [CrossRef]
- Singh. A.; Samuel. S.; Dhabi. Y.K.; Singh. H. Whole-Body Vibration: Characterization of Seat-to-Head Transmissibility for Agricultural Tractor Drivers during Loader Operation. Smart Agricultural Technology 2023. 4. 100164. [CrossRef]
- Singh. A.; Nawayseh. N.; Dhabi. Y.K.; Samuel. S.; Singh. H. Digital Agriculture: Analysis Of Vibration Transmission From Seat To Back Of Tractor Drivers Under Multi-Directional Vibration Conditions. International Journal of Industrial Engineering: Theory. Applications and Practice 2023. 30. [CrossRef]
- Oncescu. A.-T.; Persu. C.; Dumitru. I.; Prunoiu. D.; Grigorie. L.; Tarnita. D. Influence Of The Road Type On The Whole Body Vibrations Transmitted To The Driver Of An Electric Tractor. Acta Technica Napocensis - Series: Applied Mathematics. Mechanics. And Engineering 2022. 65.
- Oncescu. A.; Persu. C.; Tarniță. D.; Biriș. S.; Tunsoiu. N.; Fudulache. O.C. The Measurement And Evaluation Of The Large Agricultural Tractor Operator’s Whole–Body Vibration For Four Types Of Land And Two Running Speeds. International Journal Of Engineering 2024. 22. 8.
- Oncescu. T.-A.; Persu. I.C.; Bostina. S.; Biris. S.S.; Vilceleanu. M.-V.; Nenciu. F.; Matache. M.-G.; Tarnita. D. Comparative Analysis of Vibration Impact on Operator Safety for Diesel and Electric Agricultural Tractors. AgriEngineering 2025. 7. [CrossRef]
- Mohammadi. A.; Kheiralipour. K.; Ghamary. B.; Jahanbakhshi. A.; Shahidi. R. The Driver Responses to the Vibration of Tractor. Agricultural Engineering International: CIGR Journal 2023. 25.
- Prakash. C.; Singh. L.P.; Gupta. A. Experiment and Optimisation Analysis of Whole-Body Vibration among Tractor Drivers: A Comprehensive Study. International Journal of Heavy Vehicle Systems 2024. 31. 87–112. [CrossRef]
- Naveen. R.; Kumar. A.; Kumar. R.; Kushwaha. H.L.; Khanna. M.; Ramasubramanian. V.; Poojith. S. Assessment of Whole-Body Vibration and Development of Mitigation Intervention for Single-Axle Tractor–Trailer Combination. Front. Mech. Eng. 2024. 10. [CrossRef]
- Almady. S.S.; Al-Janobi. A.A.; Marey. S.A.; Al-Sager. S.M.; Aboukarima. A.M.; Gaddal. Y.H. Establishment of a Measuring Unit Based on Arduino Board for Recording Vibrations on an Agricultural Tractor during Tillage Process. Measurement and Control 2025. 58. 1147–1157. [CrossRef]
- Pochi. D.; Fornaciari. L.; Vassalini. G.; Grilli. R.; Fanigliulo. R. Levels of Whole-Body Vibrations Transmitted to the Driver of a Tractor Equipped with Self-Levelling Cab during Soil Primary Tillage. AgriEngineering 2022. 4. 695–706. [CrossRef]
- Fanigliulo. R.; Pochi. D.; Grilli. R.; Vassalini. G.; Pagano. M.; Tomasone. R.; Cedrola. C.; Fornaciari. L. Tillage Performance and Whole-Body Vibration Analysis of a Subsoiler Equipped with an Oscillating Working Tool. Agriculture 2026. 16. [CrossRef]
- HRN4You HRN4You - Hrvatski zavod za norme Available online: https://repozitorij.hzn.hr/norm/HRN+ISO+2631-1:1999/A1:2019 (accessed on 10 March 2026).
- HRN4You HRN4You - Hrvatski zavod za norme Available online: https://repozitorij.hzn.hr/norm/HRN+ISO+2631-4:2010/A1:2018 (accessed on 10 March 2026).
- Prakash. C.; Singh. L.P.; Gupta. A. Experiment and Optimisation Analysis of Whole-Body Vibration among Tractor Drivers: A Comprehensive Study. International Journal of Heavy Vehicle Systems 2024. 31. 87–112. [CrossRef]
- Fanigliulo. R.; Pochi. D.; Grilli. R.; Vassalini. G.; Pagano. M.; Tomasone. R.; Cedrola. C.; Fornaciari. L. Tillage Performance and Whole-Body Vibration Analysis of a Subsoiler Equipped with an Oscillating Working Tool. Agriculture 2026. 16. [CrossRef]
- Barač. Ž.; Plaščak. I.; Jurić. T.; Marković. M. The Impact of Vibrations on the Hand–Arm System and Body of Agricultural Tractor Operators in Relation to Operational Parameters. Approach: Analytical Hierarchical Process (AHP). AgriEngineering 2025. 7. [CrossRef]
- Huang. Q.; Gao. M.; Guo. M.; Wei. Y.; Zhang. J.; Jin. X. Vibration Comfort Assessment of Tractor Drivers Based on sEMG and Vibration Signals. Computer Methods in Biomechanics and Biomedical Engineering 2024. 27. 1875–1892. [CrossRef]
- Barač. Ž.; Jurić. M.; Plaščak. I.; Jurić. T.; Marković. M. Assessing Whole-Body Vibrations in an Agricultural Tractor Based on Selected Operational Parameters: A Machine Learning-Based Approach. AgriEngineering 2025. 7. [CrossRef]
Figure 1.
Experimental field diagram during measurement.
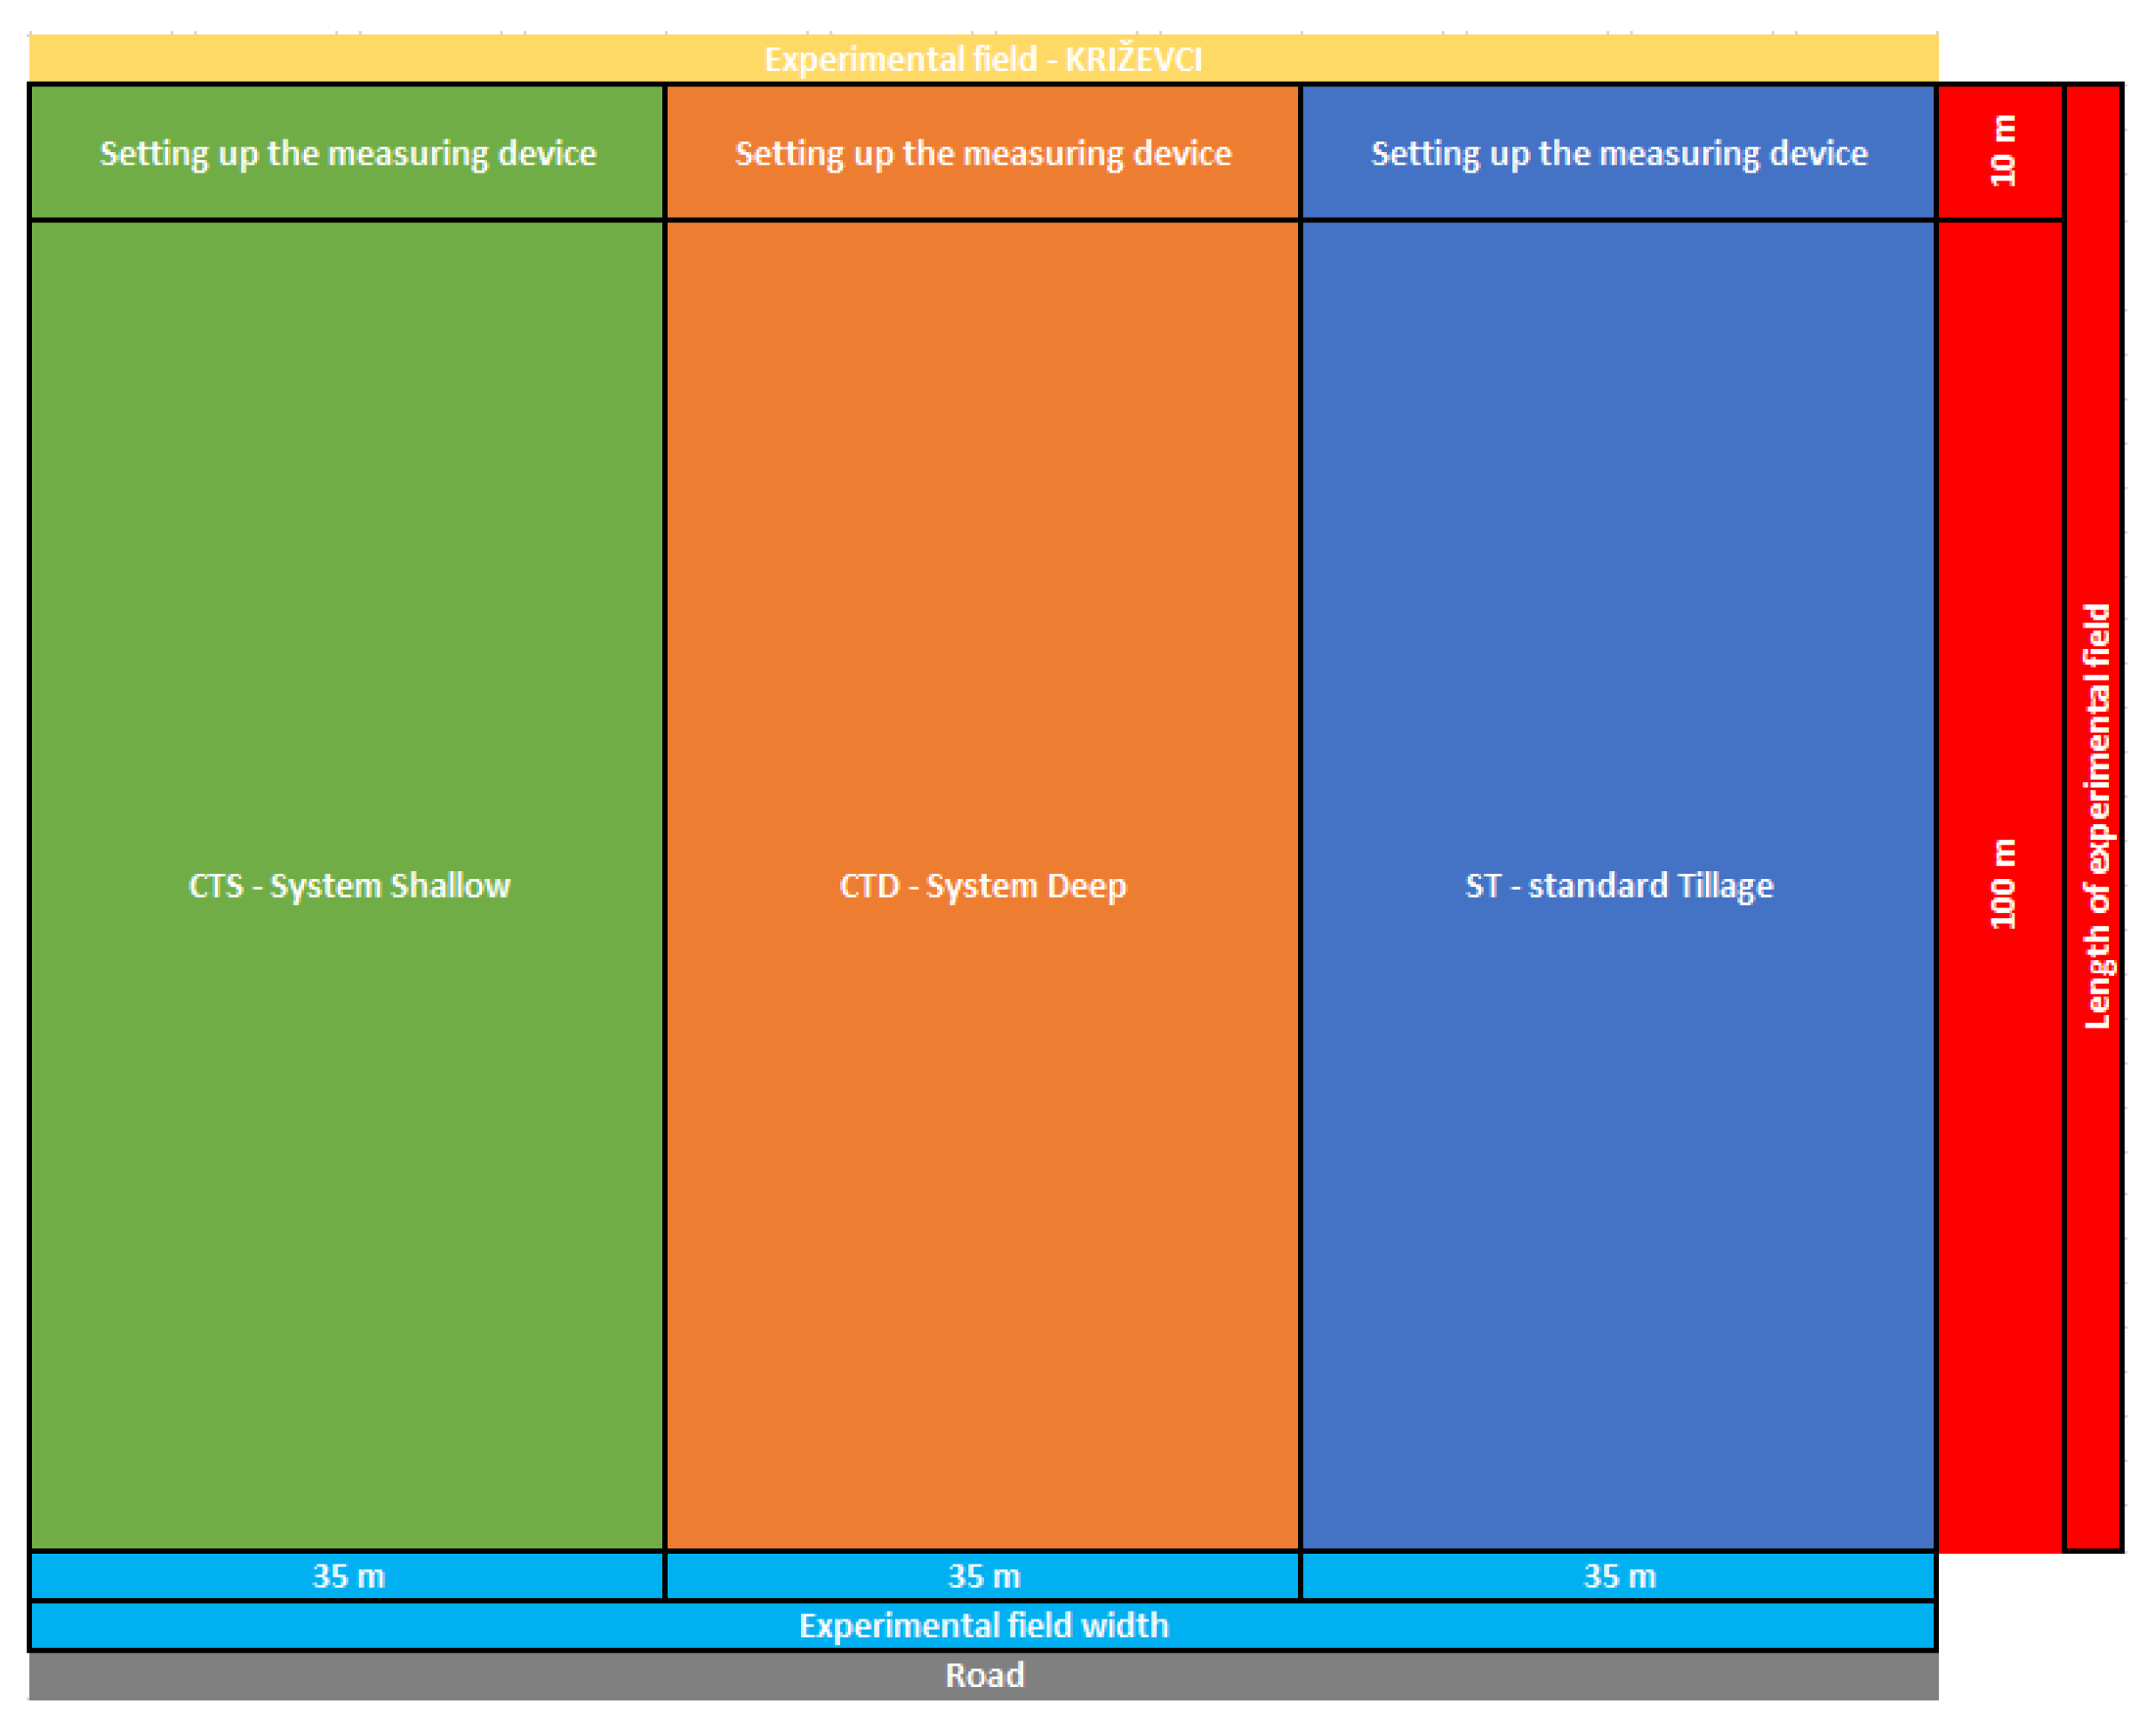
Figure 2.
Display of the coordinate axes of the tractor during vibration measurement.
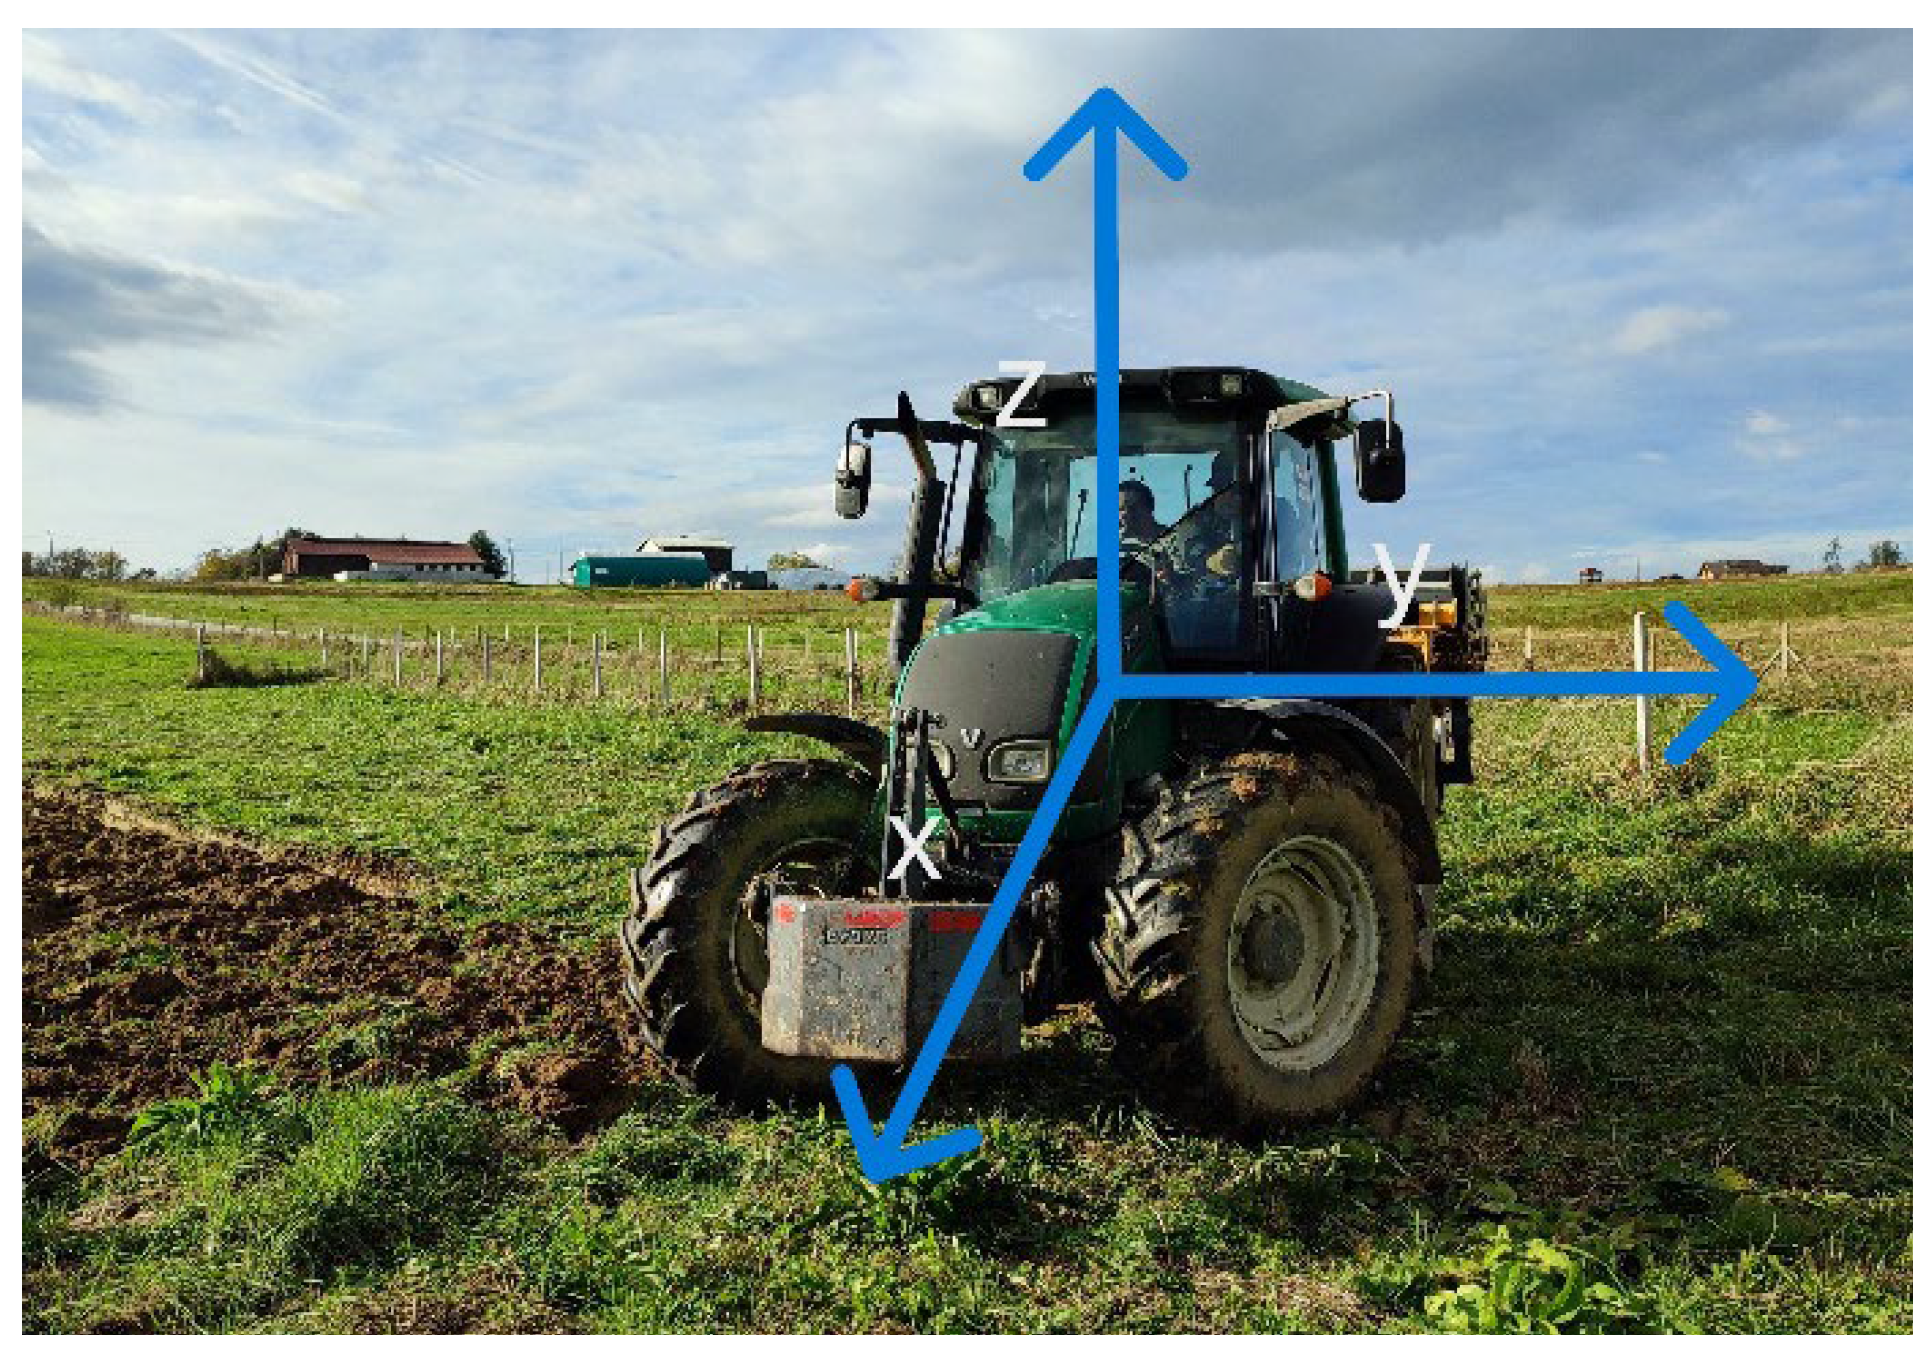
Figure 3.
Display of attachment machines with which different soil treatments were performed: 1) plow (ST), 2) subsoiler (CTD) and 3) soil loosener (CTS).
Figure 3.
Display of attachment machines with which different soil treatments were performed: 1) plow (ST), 2) subsoiler (CTD) and 3) soil loosener (CTS).
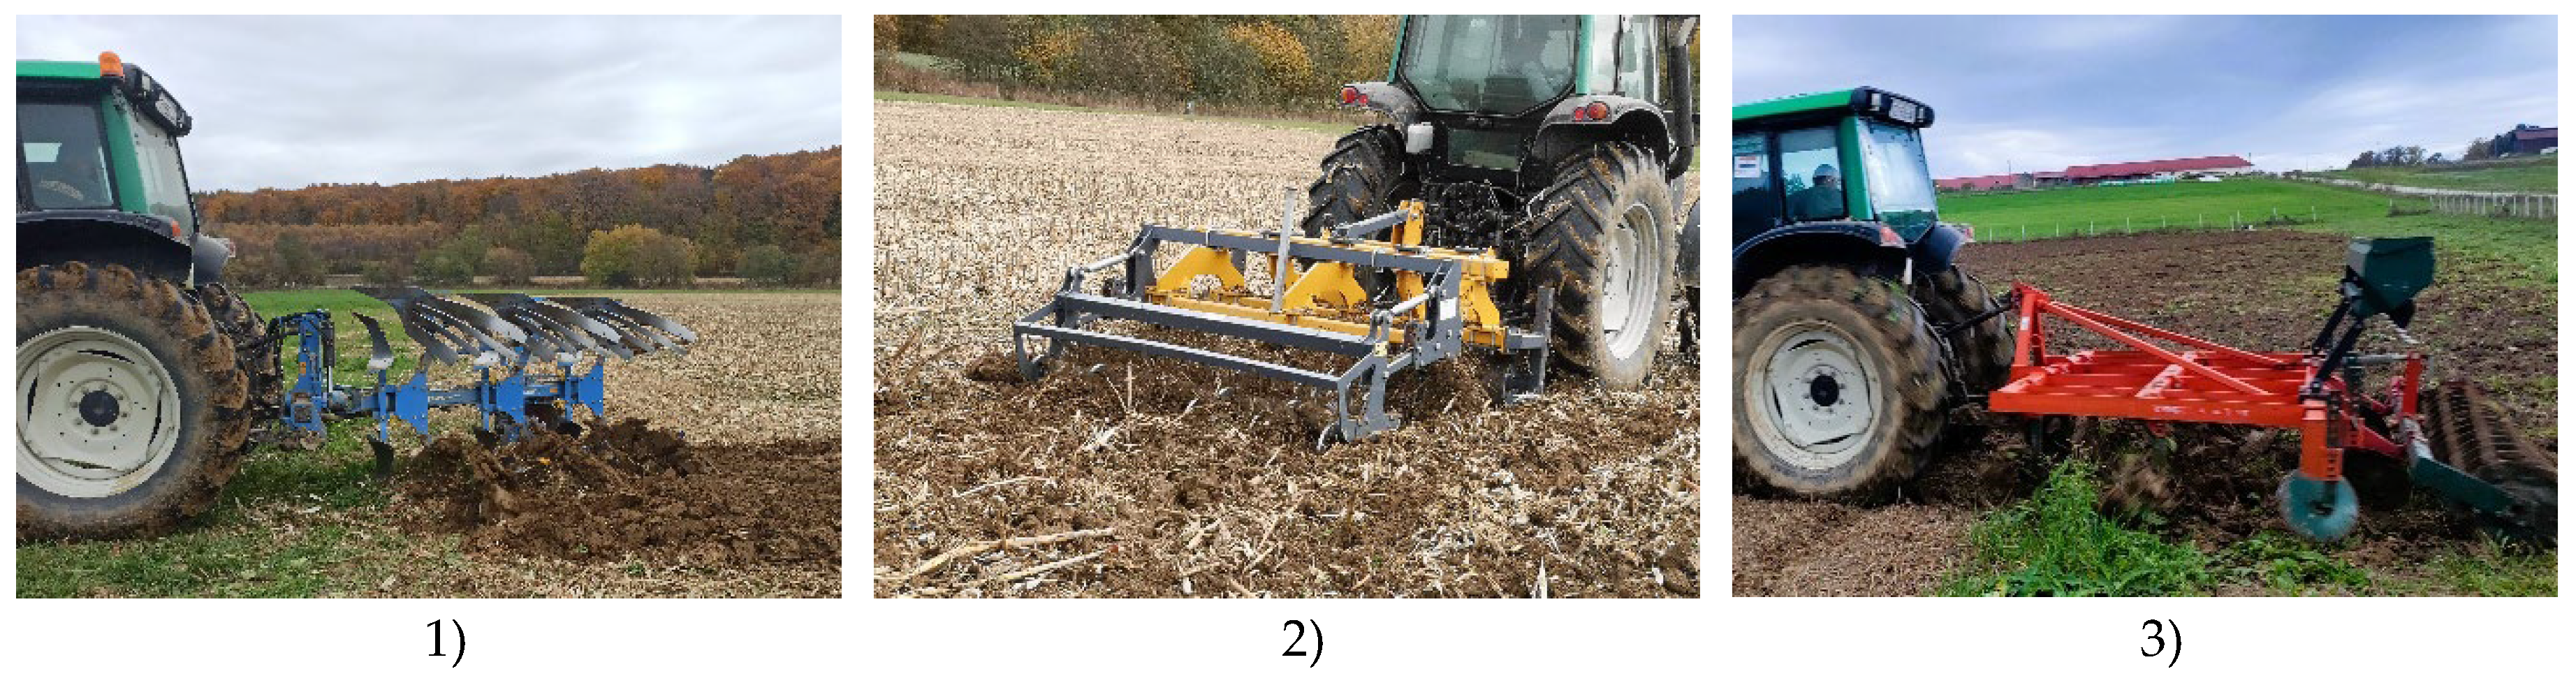
Figure 4.
Boxplots of vibration with different tillage’s in the x-axis direction.
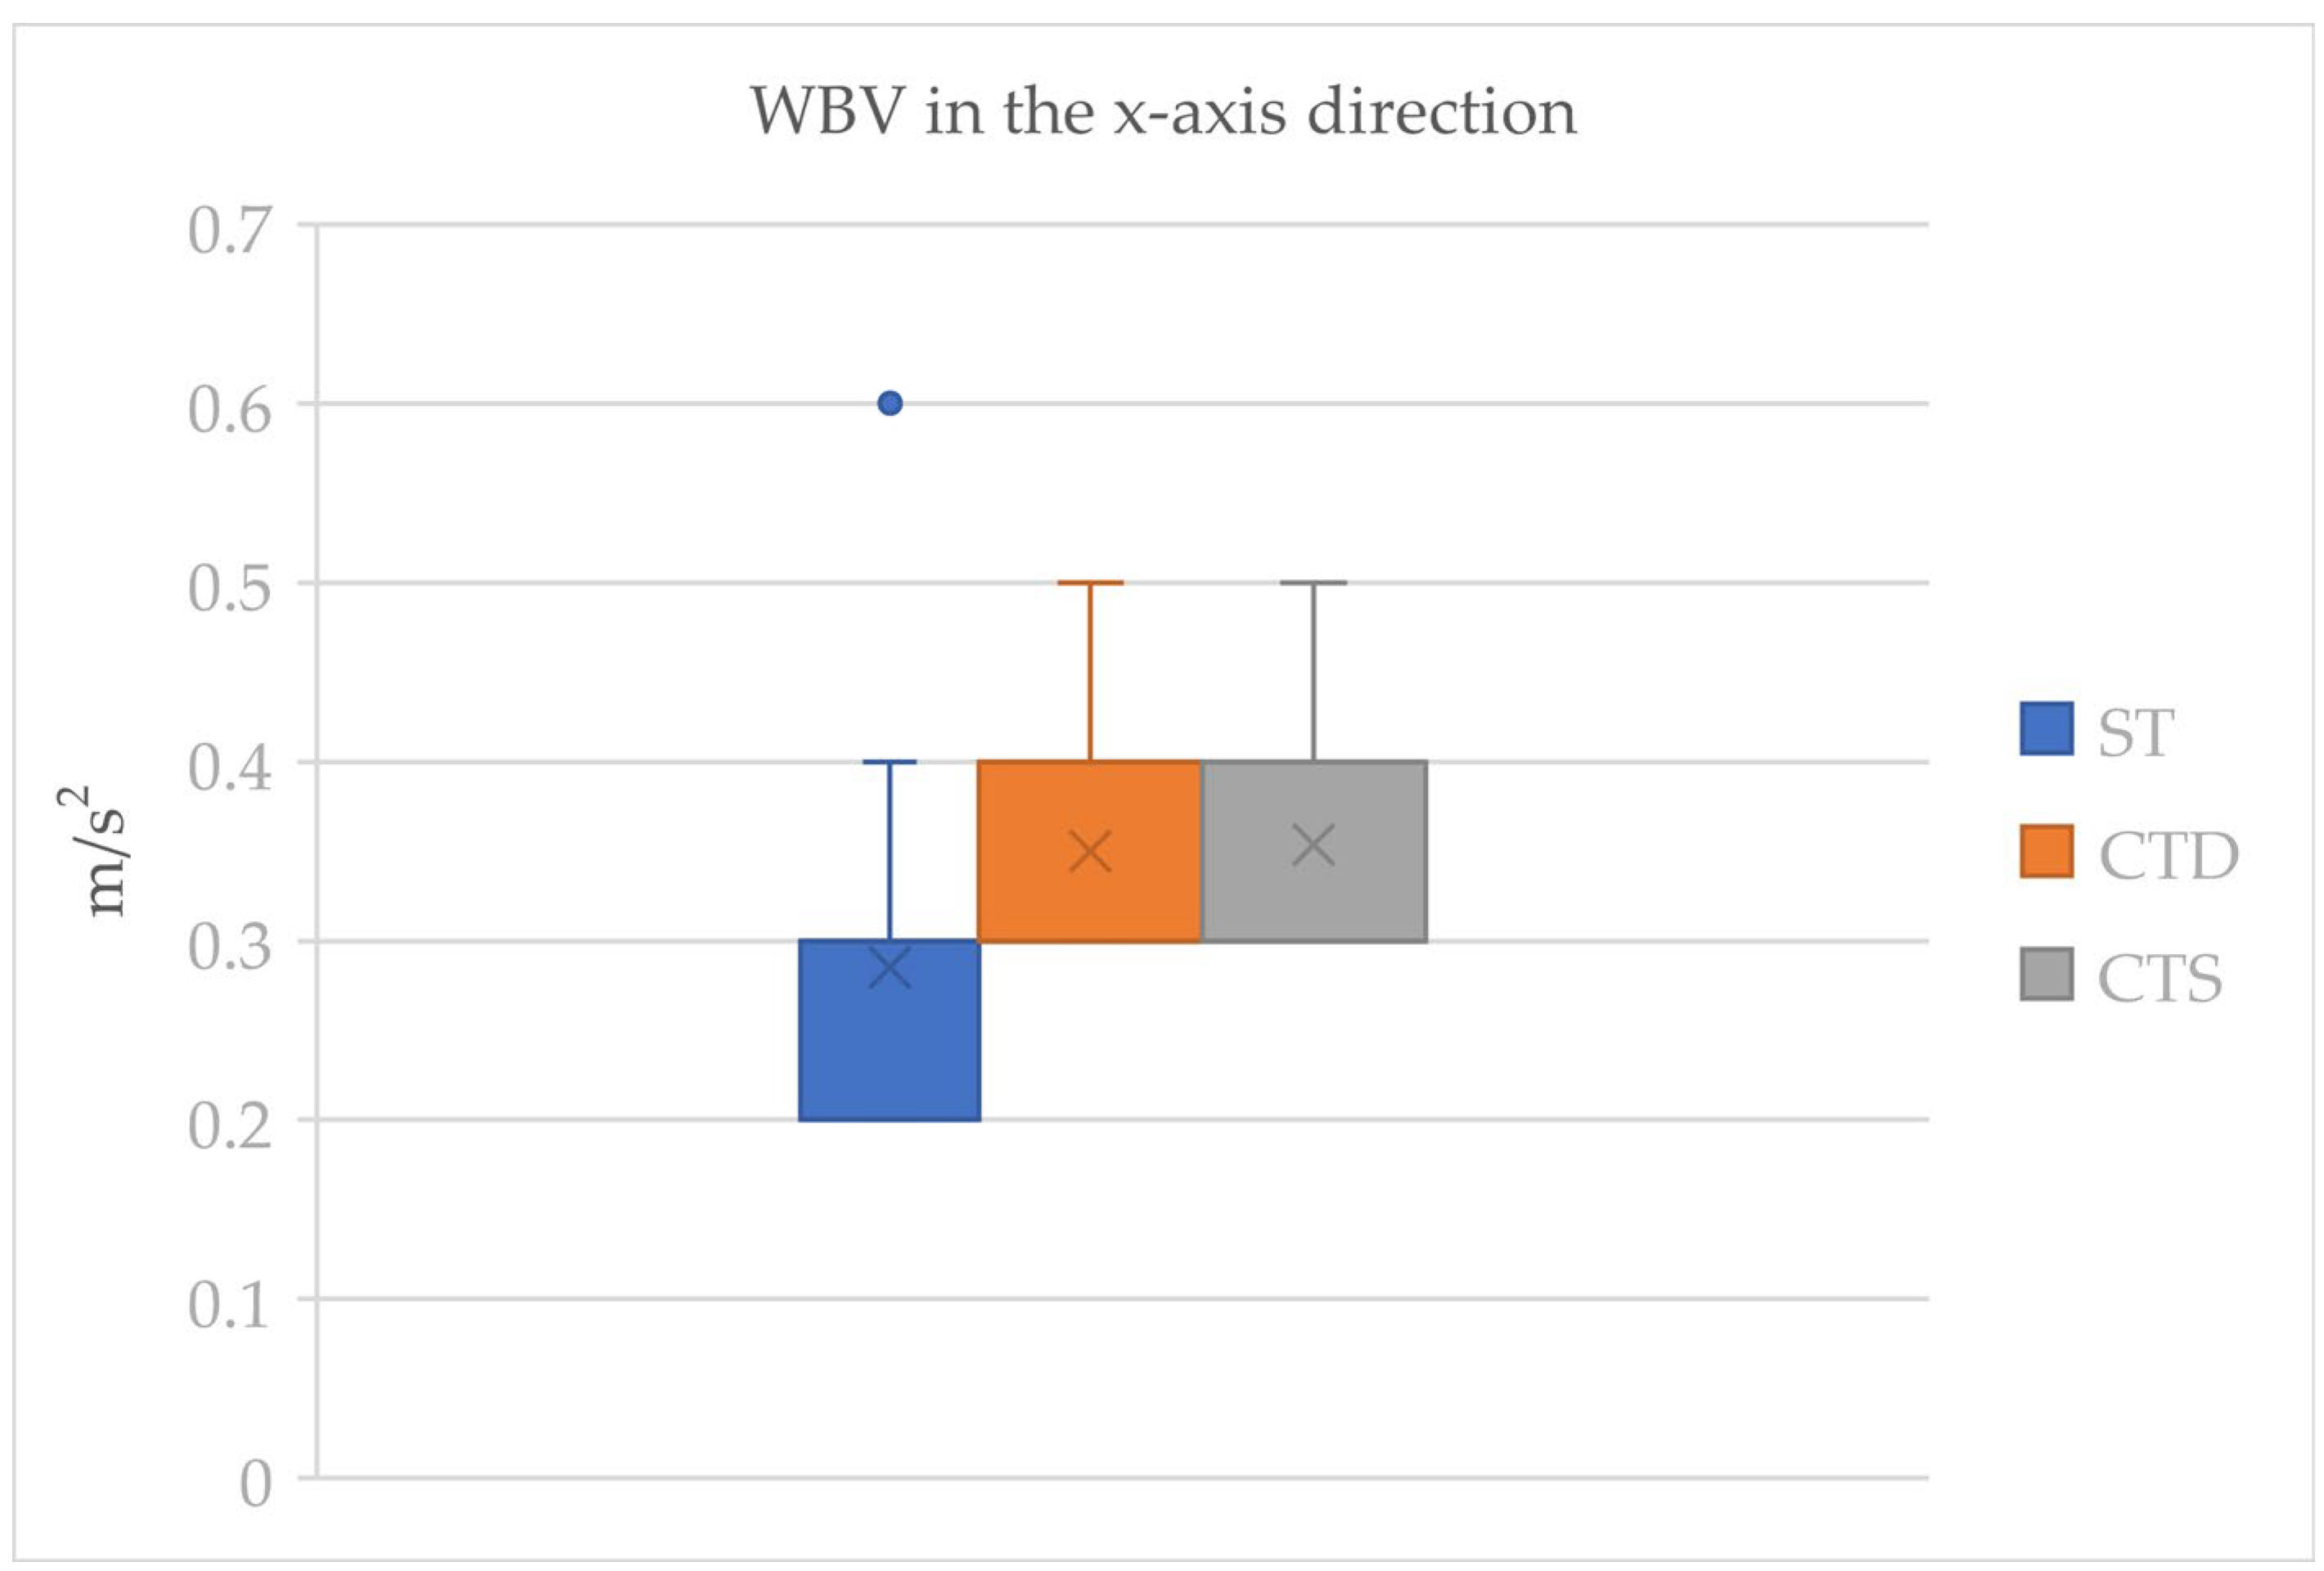
Figure 5.
Boxplots of vibration with different tillage’s in the y-axis direction.
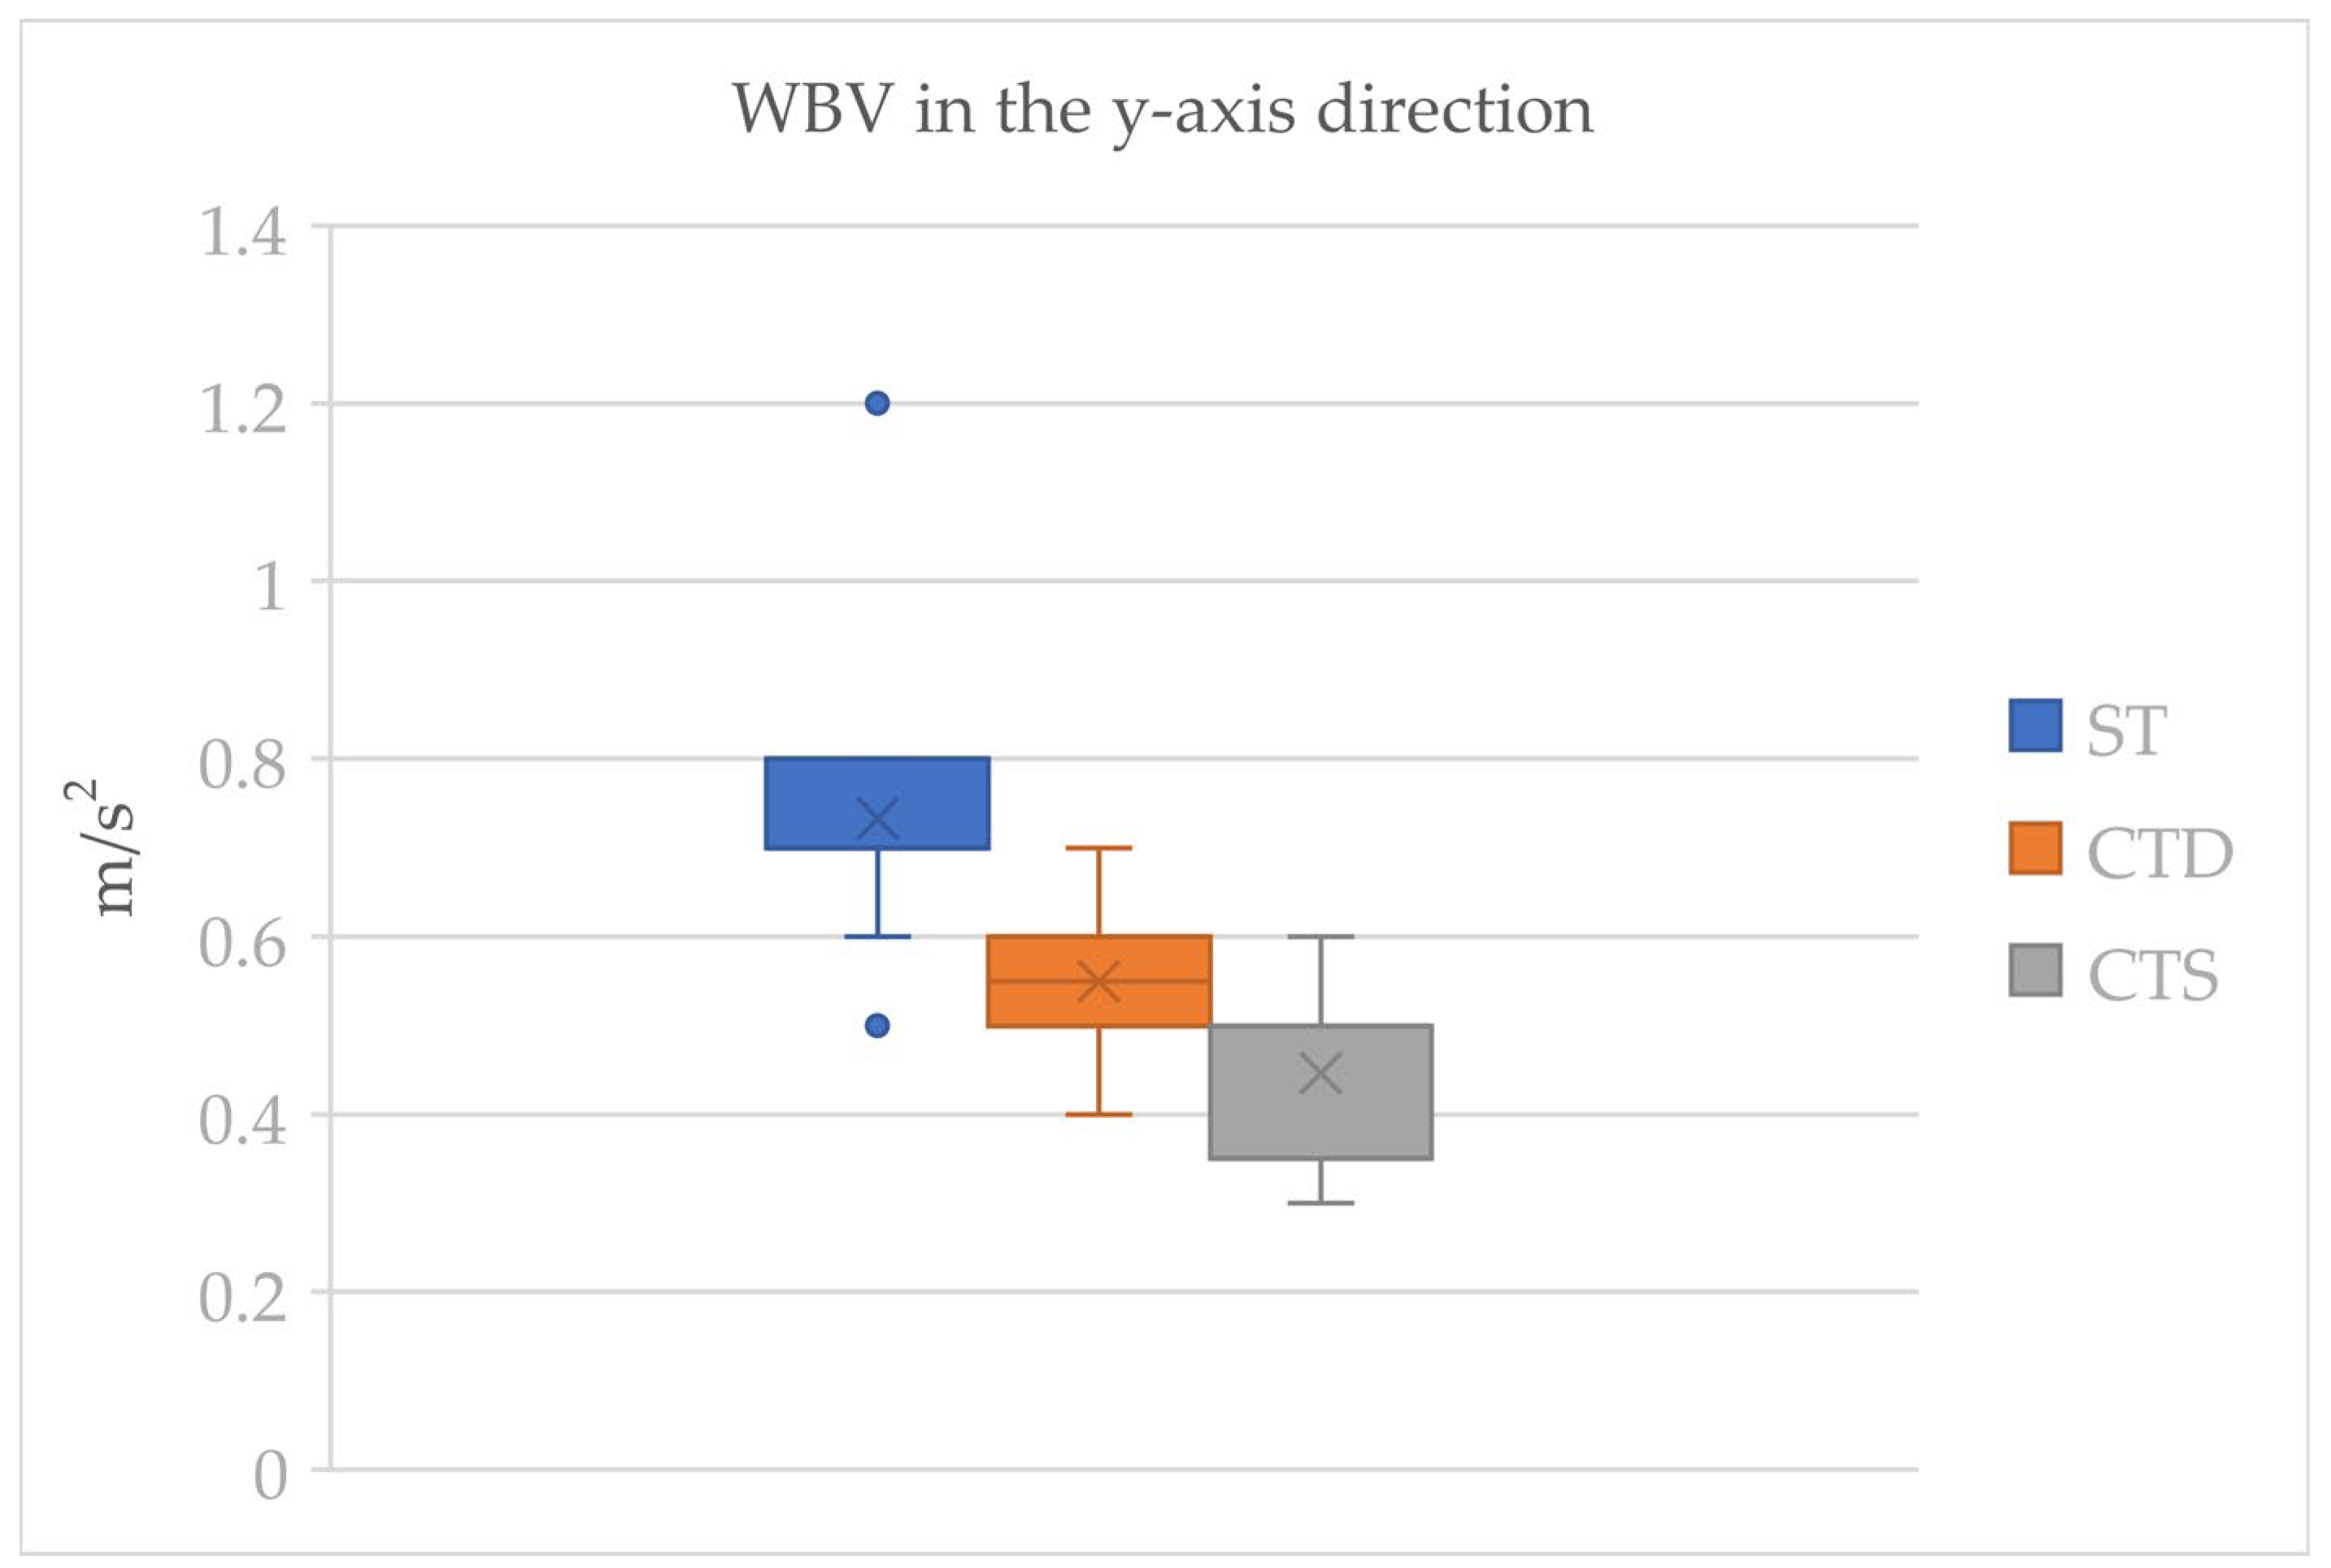
Figure 6.
Boxplots of vibration with different tillage’s in the z-axis direction.
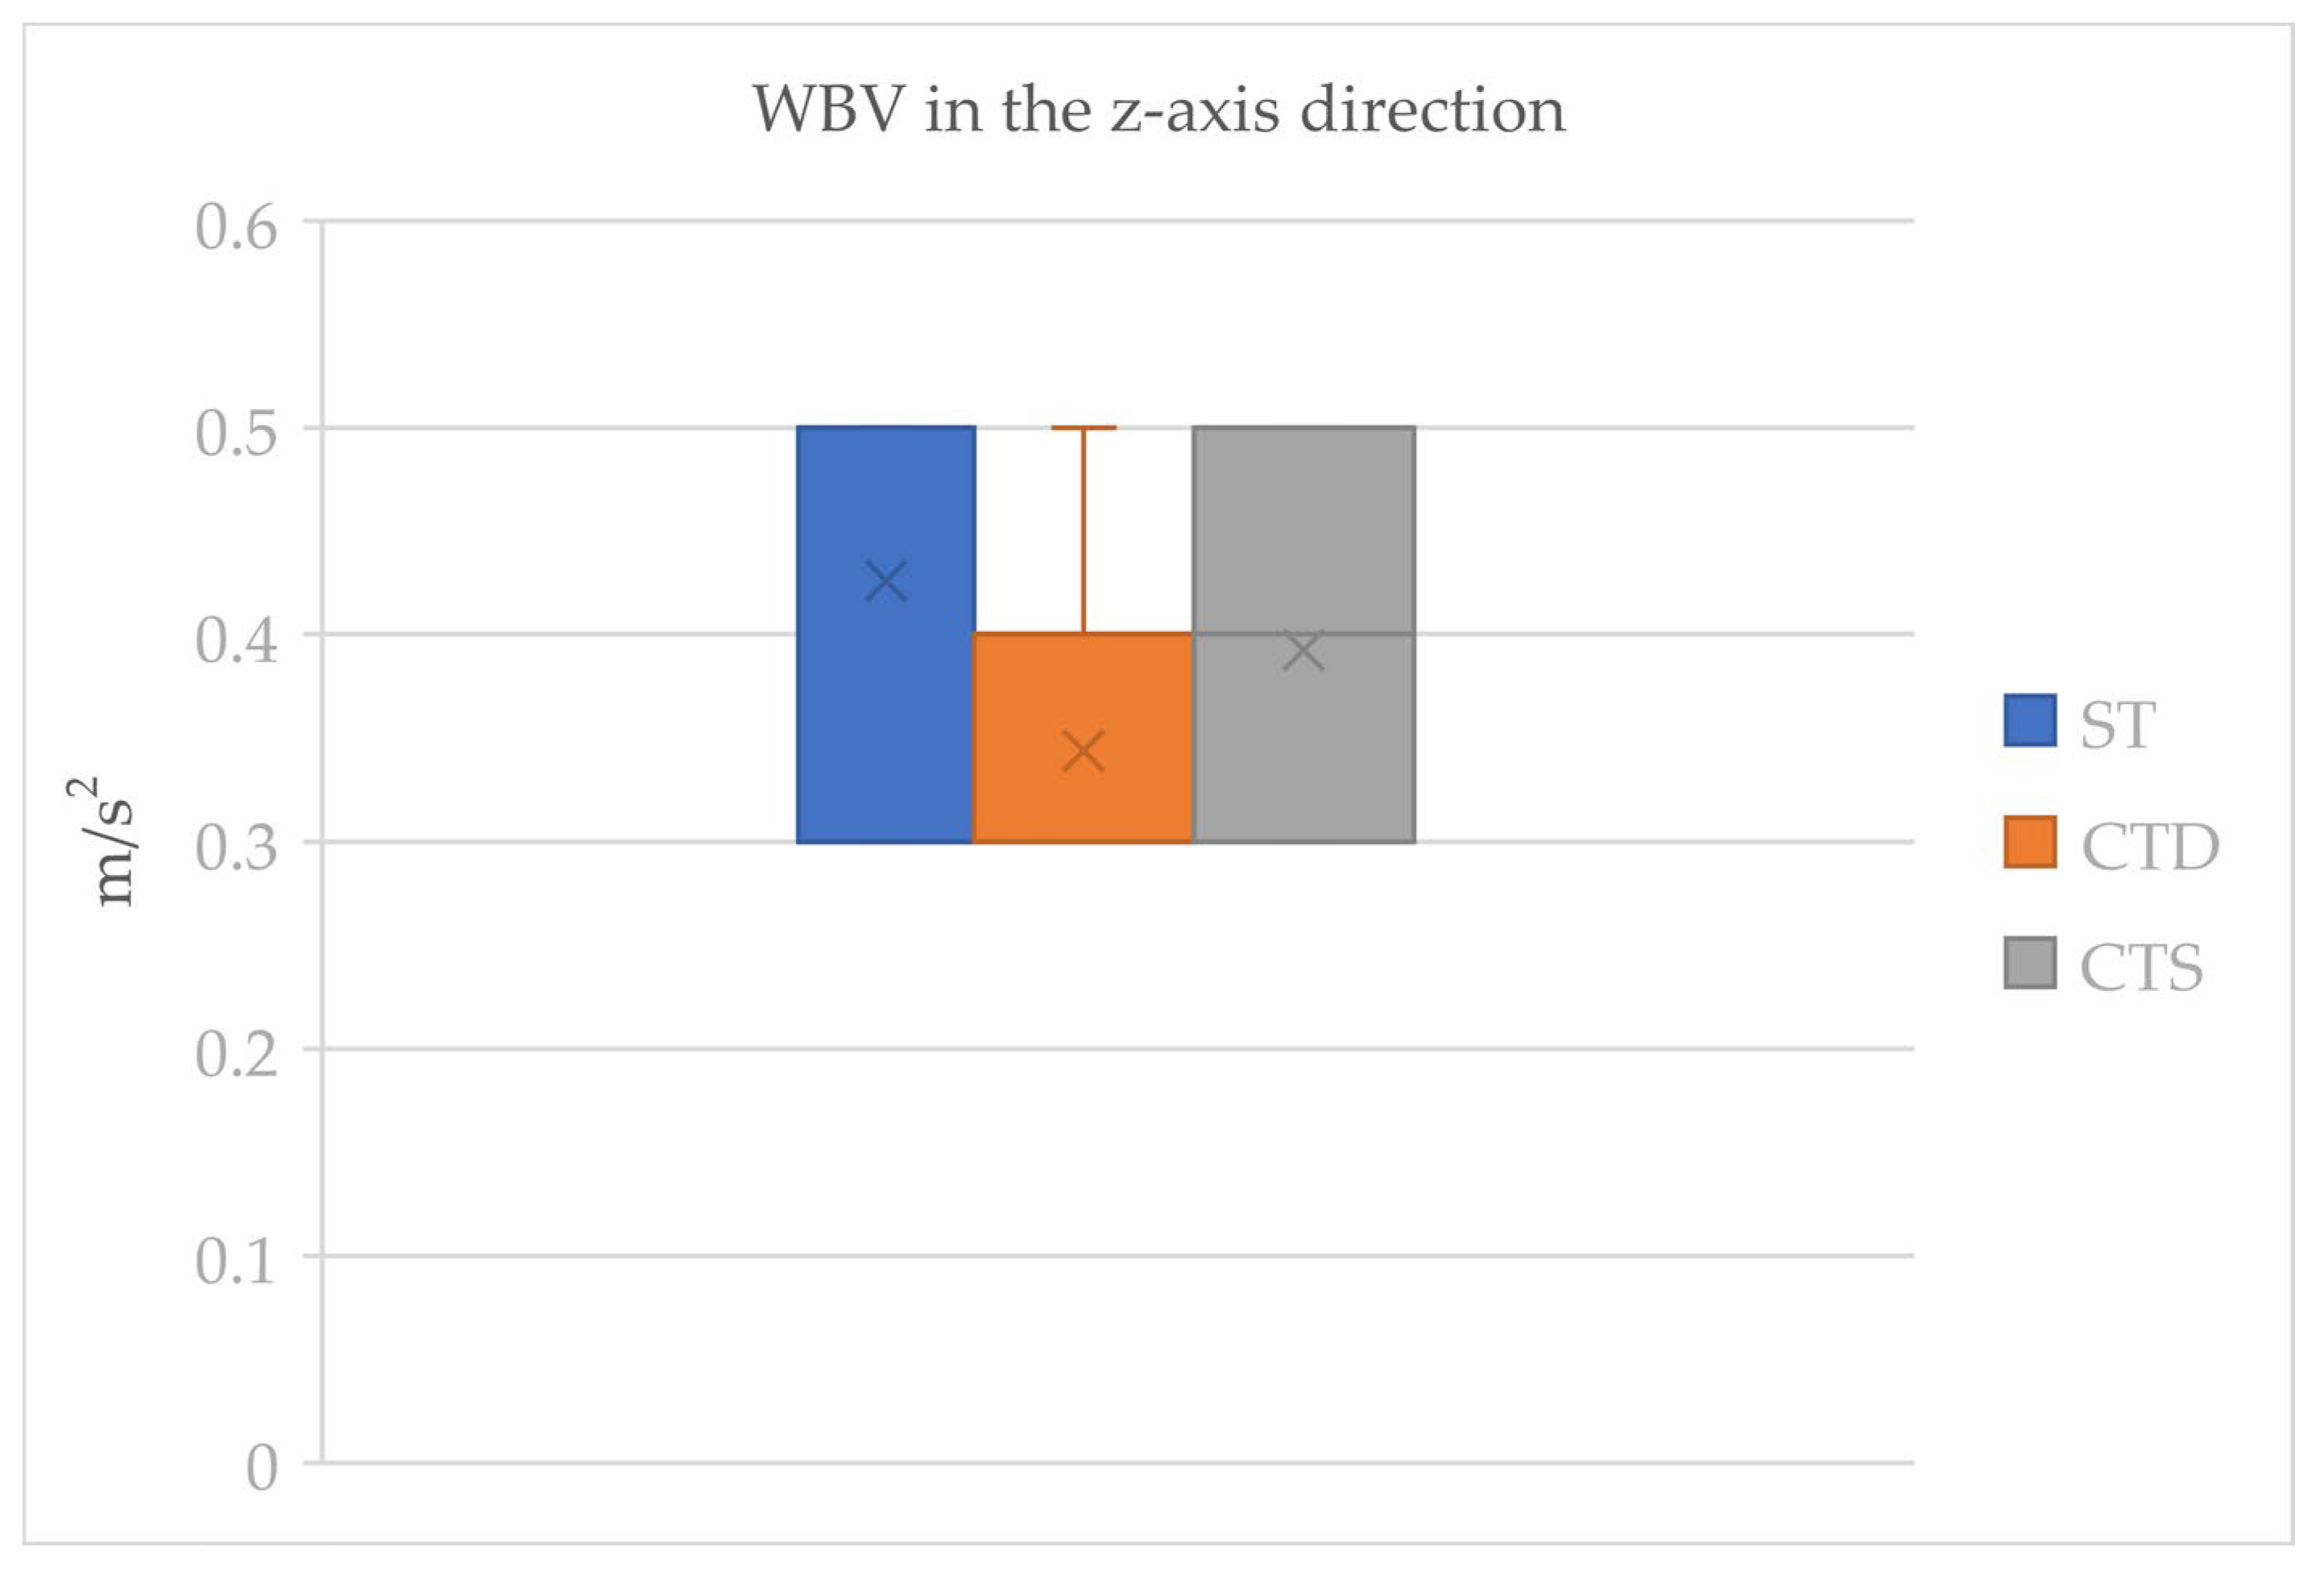
Table 2.
Analysis of variance of vibrations during different tillage’s (ANOVA).
| Sum of Squares | df | Mean Square | F | Sig. | |
|---|---|---|---|---|---|
| x axis | |||||
| Between Groups | 0.062 | 2 | 0.031 | 5.035 | 0.010 |
| Within Groups | 0.326 | 53 | 0.006 | ||
| Total | 0.388 | 55 | |||
| y axis | |||||
| Between Groups | 0.702 | 2 | 0.351 | 38.248 | 0.000 |
| Within Groups | 0.486 | 53 | 0.009 | ||
| Total | 1.188 | 55 | |||
| z axis | |||||
| Between Groups | 0.068 | 2 | 0.034 | 4.732 | 0.013 |
| Within Groups | 0.380 | 53 | 0.007 | ||
| Total | 0.448 | 55 | |||
Table 3.
Multiple comparisons of vibrations during different tillage’s.
| (I) Soil_cultivation | (J) Soil_cultivation | Mean Difference (I-J) | Std. Error | Sig. | 95% Confidence Interval | ||
|---|---|---|---|---|---|---|---|
| Lower Bound | Upper Bound | ||||||
| x axis | |||||||
| Tukey | ST | CTD | -0.0648* | 0.0248 | 0.030 | -0.125 | -0.005 |
| CTS | -0.0687* | 0.0265 | 0.032 | -0.133 | -0.005 | ||
| CTD | ST | 0.0648* | 0.0248 | 0.030 | 0.005 | 0.125 | |
| CTS | -0.0038 | 0.0293 | 0.991 | -0.075 | 0.067 | ||
| CTS | ST | 0.0687* | 0.0265 | 0.032 | 0.005 | 0.133 | |
| CTD | 0.0038 | 0.0293 | 0.991 | -0.067 | 0.075 | ||
| LSD | ST | CTD | -0.0648* | 0.0248 | 0.012 | -0.114 | -0.015 |
| CTS | -0.0687* | 0.0265 | 0.012 | -0.122 | -0.016 | ||
| CTD | ST | 0.0648* | 0.0248 | 0.012 | 0.015 | 0.114 | |
| CTS | -0.0038 | 0.0293 | 0.896 | -0.063 | 0.055 | ||
| CTS | ST | 0.0687* | 0.0265 | 0.012 | 0.016 | 0.122 | |
| CTD | 0.0038 | 0.0293 | 0.896 | -0.055 | 0.063 | ||
| y axis | |||||||
| Tukey HSD | ST | CTD | 0.1648* | 0.0302 | 0.000 | 0.092 | 0.238 |
| CTS | 0.2687* | 0.0323 | 0.000 | 0.191 | 0.347 | ||
| CTD | ST | -0.1648* | 0.0302 | 0.000 | -0.238 | -0.092 | |
| CTS | 0.1038* | 0.0358 | 0.015 | 0.018 | 0.190 | ||
| CTS | ST | -0.2687* | 0.0323 | 0.000 | -0.347 | -0.191 | |
| CTD | -0.1038* | 0.0358 | 0.015 | -0.190 | -0.018 | ||
| LSD | ST | CTD | 0.1648* | 0.0302 | 0.000 | 0.104 | 0.225 |
| CTS | 0.2687* | 0.0323 | 0.000 | 0.204 | 0.334 | ||
| CTD | ST | -0.1648* | 0.0302 | 0.000 | -0.225 | -0.104 | |
| CTS | 0.1038* | 0.0358 | 0.005 | 0.032 | 0.176 | ||
| CTS | ST | -0.2687* | 0.0323 | 0.000 | -0.334 | -0.204 | |
| CTD | -0.1038* | 0.0358 | 0.005 | -0.176 | -0.032 | ||
| z axis | |||||||
| Tukey HSD | ST | CTD | 0.0822* | 0.0267 | 0.009 | 0.018 | 0.147 |
| CTS | 0.0336 | 0.0286 | 0.473 | -0.035 | 0.103 | ||
| CTD | ST | -0.0822* | 0.0267 | 0.009 | -0.147 | -0.018 | |
| CTS | -0.0486 | 0.0316 | 0.283 | -0.125 | 0.028 | ||
| CTS | ST | -0.0336 | 0.0286 | 0.473 | -0.103 | 0.035 | |
| CTD | 0.0486 | 0.0316 | 0.283 | -0.028 | 0.125 | ||
| LSD | ST | CTD | 0.0822* | 0.0267 | 0.003 | 0.029 | 0.136 |
| CTS | 0.0336 | 0.0286 | 0.245 | -0.024 | 0.091 | ||
| CTD | ST | -0.0822* | 0.0267 | 0.003 | -0.136 | -0.029 | |
| CTS | -0.0486 | 0.0316 | 0.131 | -0.112 | 0.015 | ||
| CTS | ST | -0.0336 | 0.0286 | 0.245 | -0.091 | 0.024 | |
| CTD | 0.0486 | 0.0316 | 0.131 | -0.015 | 0.112 | ||
| *. The mean difference is significant at the 0.05 level. | |||||||
Disclaimer/Publisher’s Note: The statements, opinions and data contained in all publications are solely those of the individual author(s) and contributor(s) and not of MDPI and/or the editor(s). MDPI and/or the editor(s) disclaim responsibility for any injury to people or property resulting from any ideas, methods, instructions or products referred to in the content. |
© 2026 by the authors. Licensee MDPI, Basel, Switzerland. This article is an open access article distributed under the terms and conditions of the Creative Commons Attribution (CC BY) license (http://creativecommons.org/licenses/by/4.0/).
Copyright: This open access article is published under a Creative Commons CC BY 4.0 license, which permit the free download, distribution, and reuse, provided that the author and preprint are cited in any reuse.


