
Submitted:
22 March 2026
Posted:
23 March 2026
You are already at the latest version
Abstract
This study examines the interactions between agricultural development, environmental sustainability, and energy transition in Morocco, where agriculture is a key driver of economic growth, employment, and food security but is increasingly constrained by environmental pressures and rising CO2 emissions. It aims to assess the compatibility between agricultural performance and ecological sustainability in the context of energy transition and trade liberalization. The analysis uses annual data from 1990 to 2021, including agricultural GDP, CO2 emissions, agricultural employment, renewable energy consumption, and trade openness. An Auto-Regressive Distributed Lag (ARDL) model is employed to investigate both short- and long-run relationships. Stationarity is tested using ADF and PP tests, while the F-Bounds test confirms the presence of long-run cointegration among the variables. The findings indicate that CO2 emissions negatively affect agricultural growth in the long run, whereas trade openness has a positive effect, and renewable energy consumption exerts a significant negative impact. In the short run, CO2 emissions and renewable energy consumption positively influence agricultural GDP, while trade openness has a negative effect. Granger causality tests reveal unidirectional relationships, and diagnostic checks confirm model robustness.
Keywords:
agricultural development
; environmental sustainability
; energy transition
; trade openness
; ARDL modeling
1. Introduction
The transition to a sustainable development model is now a key challenge for emerging economies, particularly those whose productive structure remains heavily dependent on the agricultural sector. In Morocco, agriculture is a strategic lever for economic growth, food security, and rural employment, while also being exposed to the effects of climate change and growing environmental pressures [23]. The increase in CO2 emissions linked to the intensification of productive activities raises the question of the compatibility between agricultural performance and environmental sustainability. In this context, the integration of renewable energies, the dynamics of agricultural employment, and trade liberalization appear to be factors likely to change the relationship between agricultural value added and environmental degradation, both in the short and long term [2].
Economic literature highlights complex relationships between sectoral growth, energy consumption, and pollutant emissions. On the one hand, the Kuznets environmental curve hypothesis suggests that as income rises, environmental degradation follows a bell curve before declining thanks to technological advances and environmental policies [11]. On the other hand, several empirical studies show that the transition to renewable energies helps reduce carbon footprints while supporting economic growth, particularly in developing countries [8]. However, the effects of these variables remain heterogeneous depending on the sectoral structure, the level of trade openness, and the specific characteristics of the labor market.
In the case of the agricultural sector, the relationship between production and CO2 emissions depends not only on production techniques and energy intensity, but also on the degree of integration into international trade. Trade liberalization can promote the spread of clean technologies and improve energy efficiency, but it can also lead to intensified production and increased emissions, in line with the “pollution haven” hypothesis [7]. Furthermore, agricultural employment plays an ambivalent role: it can reflect traditional low-carbon practices or, conversely, accompany increased mechanization and more intensive use of energy inputs [3].
In this context, analyzing the dynamic interactions between agricultural value added, renewable energy, agricultural employment, and trade liberalization is particularly important for Morocco, which has embarked on an ambitious strategy of energy transition and agricultural modernization through the Green Moroccan Plan and the Generation Green strategy. These policies aim simultaneously to improve productivity, create rural jobs, and reduce the environmental footprint. Nevertheless, few empirical studies have examined these variables jointly from a dynamic perspective that distinguishes between short- and long-term effects.
In order to fill this gap, this research addresses the following question: To what extent does the energy transition make it possible to reconcile agricultural development and environmental sustainability?, it uses an ARDL model based on the cointegration approach developed by Pesaran et al. (2001), which is particularly suited to small samples and integrated variables of different orders. This methodology makes it possible to identify long-term equilibrium relationships and short-term adjustments between CO2 emissions and their economic and energy determinants. The objective is thus to assess the extent to which the transition to renewable energies, agricultural employment dynamics, and trade liberalization are changing the impact of agricultural value added on the environment in Morocco, and to draw implications for the formulation of public policies that reconcile agricultural growth and environmental sustainability.
Despite the abundance of empirical studies on the relationships between economic growth, energy consumption, and environmental degradation, the existing literature still has several limitations, particularly when it comes to developing economies. In particular, studies based on the ARDL approach generally focus on aggregate relationships between GDP, energy, and emissions, without paying specific attention to sectoral dynamics, particularly those of the agricultural sector. Furthermore, few studies simultaneously incorporate variables such as agricultural employment, trade openness, and the energy transition into a unified analysis, which limits our understanding of the complex mechanisms linking agricultural performance and environmental sustainability.
In this context, the present study fills a dual research gap. On the one hand, it offers an integrated analysis of the interactions between agricultural value added, CO2 emissions, renewable energy consumption, agricultural employment, and trade openness. On the other hand, it adopts a dynamic approach that explicitly distinguishes between short- and long-term effects, thereby providing a better understanding of the adjustment mechanisms and trade-offs between agricultural growth and environmental constraints.
The choice of Morocco as a case study is justified by its particular relevance and representativeness. Indeed, the Moroccan economy is characterized by a heavy reliance on the agricultural sector, while simultaneously undergoing a dual transition: energy and agricultural. National strategies, such as the Green Moroccan Plan and Generation Green, aim simultaneously to modernize agriculture, improve productivity, boost rural employment, and reduce the environmental footprint. This context offers a unique analytical framework for examining the tensions and complementarities between agricultural development and sustainability.
Finally, this study contributes to the literature by providing original empirical findings on the differentiated role of explanatory variables depending on the time horizon, particularly the contrasting effects of renewable energy and CO2 emissions. It thus enriches the theoretical debate on the compatibility between sectoral growth and environmental sustainability, while providing relevant implications for the design of integrated public policies in developing economies.
2. Literature Review
The existing literature broadly agrees that economic growth and agricultural development significantly affect CO2 emissions, consistent with the Kuznets Environmental Curve (EKC) hypothesis. This framework suggests that in the early stages of development, increased economic and agricultural activity leads to higher emissions, while beyond a certain income threshold, cleaner technologies and environmental policies facilitate a reduction in the carbon footprint [4,9]. Within the agricultural sector, however, this relationship is more nuanced due to high energy intensity, reliance on natural resources, and traditional production techniques. Empirical studies using ARDL models demonstrate that agricultural value added not only drives output but also determines the capacity to invest in green technologies, thereby influencing long-term environmental sustainability [1]. Nonetheless, some research indicates that agricultural expansion may continue to exacerbate emissions if investments in sustainable practices are insufficient, pointing to a divergence in outcomes depending on the country’s level of technological adoption, policy frameworks, and sectoral characteristics [6]. This highlights an unresolved question regarding the thresholds at which agricultural modernization translates into environmental benefits, particularly in developing countries with large rural populations.
The energy–environment nexus represents a second area of convergence in the literature. Both theoretical and empirical evidence indicate that the adoption of renewable energies can decouple economic growth from carbon emissions by improving energy efficiency and replacing fossil fuels [5,8]. In agricultural contexts, the deployment of biomass, solar, or wind energy for irrigation and processing operations reduces emissions while potentially enhancing productivity. Yet, short-term effects remain contested: some studies report transitional adaptation costs that may temporarily reduce agricultural growth, whereas others observe immediate efficiency gains [1,3]. This divergence underscores the importance of institutional quality, access to financing, and government incentives in determining the effectiveness of renewable energy integration in agriculture. Additionally, it raises questions about how short-term economic trade-offs can be managed to ensure long-term environmental and productivity gains, an issue that is underexplored in the current literature [21].
Trade liberalization and agricultural employment introduce a complex and context-dependent dimension into the relationship between agricultural development and environmental sustainability [22]. The literature highlights two contrasting perspectives: the “pollution haven hypothesis,” according to which trade openness may increase emissions by encouraging specialization in pollution-intensive activities, and the “pollution halo hypothesis,” which emphasizes the positive role of trade in facilitating the transfer of clean technologies and improving environmental standards [7,8]. Similarly, agricultural employment exhibits an ambivalent effect. While an expanding labor force may intensify land use and emissions under traditional practices, it can also promote sustainable agricultural methods when supported by training, innovation, and appropriate policies [3]. These mixed findings suggest that the environmental and economic impacts of trade and labor dynamics depend largely on structural conditions, technological adoption, and institutional quality.
A critical review of the literature also reveals important gaps. Few studies jointly examine agricultural value added, renewable energy, employment, and trade openness within a unified dynamic framework that distinguishes between short- and long-term effects [24]. Moreover, the specific characteristics of developing countries such as reliance on traditional agricultural practices, limited technological diffusion, and heterogeneous institutional support remain insufficiently explored. This gap is particularly evident in the case of Morocco, where the interaction between energy transition, agricultural modernization, and trade liberalization has not been adequately analyzed [13]. Addressing these limitations requires an integrated analytical approach combining the Environmental Kuznets Curve (EKC), the energy–environment nexus, and robust empirical methods (e.g., ARDL or panel cointegration) to better understand the joint effects of these determinants on agricultural growth and environmental sustainability [10].
Similarly, the effect of agricultural employment on sustainability is complex and multidimensional. An increase in the agricultural labor force may intensify land use, mechanization, and energy consumption if traditional, carbon-intensive practices dominate [15]. However, when employment expansion is coupled with targeted training, innovation, and access to renewable energy solutions, it can accelerate the adoption of sustainable practices such as agroecology, rational water management, and solar- or wind-powered irrigation [14]. These findings indicate that labor dynamics cannot be interpreted in isolation, but must be analyzed alongside technological, institutional, and policy factors to understand their net effect on emissions and productivity [24,28].
Despite these insights, several critical gaps remain in the literature. Very few studies integrate agricultural value added, renewable energy consumption, employment, and trade openness within a unified dynamic modeling framework that distinguishes between short- and long-term effects [12]. Moreover, most empirical work focuses on large, diversified economies, leaving countries heavily dependent on agriculture such as Morocco understudied in the context of simultaneous energy transition and agricultural modernization [13].
Addressing these gaps requires the development of a structured theoretical framework that integrates the EKC hypothesis, the energy–environment nexus, and institutional mechanisms to account for the interplay between trade, labor, and technology [25]. Such a model can empirically test the causal and interactive effects of agricultural growth, renewable energy adoption, labor dynamics, and trade openness, providing insights into the conditions under which agricultural expansion can be reconciled with environmental sustainability in Morocco and similar developing countries [16].
To go beyond a purely descriptive approach, this study is grounded in a structured theoretical framework that integrates the Kuznets Environmental Curve (EKC) and the energy–environment nexus, while taking into account the specific characteristics of the agricultural sector [17]. According to the EKC hypothesis, the relationship between economic growth and environmental degradation follows a nonlinear trajectory: in the early stages of development, increased production is accompanied by rising emissions, before a certain income level fosters the adoption of cleaner technologies and an improvement in environmental quality. When applied to the agricultural sector, this dynamic depends heavily on energy intensity, production techniques, and the degree of modernization [30].
Furthermore, the energy–environment nexus framework posits that the transition to renewable energy allows for the decoupling of economic growth from CO2 emissions [29]. However, in the agricultural context of developing countries, this effect may differ in the short and long term due to adaptation costs, technological constraints, and the level of integration of energy innovations [25]. Furthermore, trade liberalization and agricultural employment introduce complementary mechanisms that can either amplify environmental pressure (the “pollution haven” hypothesis) or promote the adoption of clean technologies (the “pollution halo” hypothesis).
Based on these theoretical and empirical foundations, the following research hypotheses are formulated:
- : CO2 emissions have a negative effect on long-term agricultural performance due to the degradation of natural resources and environmental constraints.
- : Renewable energy consumption significantly influences agricultural growth, with a potentially negative short-term effect (transition costs) and a positive long-term effect (energy efficiency).
- : Trade liberalization has a positive effect on agricultural growth by facilitating access to markets and technologies, although this effect may be ambivalent depending on the context.
- : Agricultural employment has a significant effect on agricultural growth and the environment, reflecting both production intensity and the sector’s level of modernization.
These hypotheses are directly incorporated into the estimated empirical model, where agricultural GDP growth (AGDP) is explained by CO2 emissions (CO2), agricultural employment (AEMP), renewable energy consumption (ENR), and trade openness (INTT). The use of the ARDL model allows for the simultaneous testing of short- and long-term relationships, in accordance with theoretical predictions, and for the identification of adjustment mechanisms between these variables in the Moroccan context.
3. Materials and Methods
3.1. Data Source
The data used in this study was collected from reliable sources to ensure the accuracy and consistency of the analysis. Data on CO2 emissions (measured in metric tons per capita), agricultural GDP growth rate (annual percentage), renewable energy consumption (annual percentage), agricultural employment level (annual percentage), and international trade relative to GDP (annual percentage) were obtained from the following sources, as summarized in Table 1.
3.2. Stationarity of the Data
As part of this study, the stationarity properties of the variables were thoroughly examined using two standard econometric tests: the Augmented Dickey–Fuller (ADF) test and the Phillips–Perron (PP) test. These tests are essential in time series analysis, as they allow for the detection of unit roots and the identification of whether the series are stationary. Ensuring stationarity is a crucial prerequisite to avoid spurious regressions and to guarantee the reliability and validity of the estimated relationships between variables.
Among the available approaches, the ADF test remains one of the most widely used methods for assessing the presence of a unit root in a time series. In this context, it is applied to determine the order of integration of the variables under study. The Dickey–Fuller framework is based on an autoregressive process of order one, which serves as the foundation for testing the null hypothesis of non-stationarity against the alternative of stationarity:
where εt denotes a white noise error term with zero mean and constant variance, and Yt−1 represents the lagged value of the dependent variable. By subtracting Yt−1 from both sides of the equation, we obtain:
Which simplifies to:
Defining δ = ∅ − 1, the model can be rewritten as:
The null and alternative hypotheses of the Dickey–Fuller unit root test are as follows:
In interpreting the results, a probability value (p-value) greater than 0.05 indicates that the series contains a unit root, whereas a p-value below 0.05 suggests that the series is stationary. Within the ADF framework, the null hypothesis assumes the presence of a unit root, while the alternative hypothesis implies stationarity. Consequently, rejecting the null hypothesis confirms that the series is stationary, whereas failure to reject it indicates non-stationarity. Given the relatively long sample period, the possibility of structural breaks is also considered using the Zivot–Andrews (1992) unit root test [26]. In addition, lag lengths are determined based on the Akaike and Schwarz information criteria to ensure model adequacy and stability. The ADF tests are conducted with an intercept and without a deterministic trend, with optimal lag selection guided by the Akaike Information Criterion.
The combined use of the ADF and Phillips–Perron (PP) tests allow for a more rigorous identification of the order of integration of the variables. This complementary approach enhances the robustness of the econometric analysis by ensuring that the chosen estimation techniques are consistent with the statistical properties of the data. Verifying stationarity beforehand therefore provides a solid foundation for reliable inference and strengthens the validity of the empirical findings.
3.3. ARDL Bounds Testing Approach
This study investigates both the long-term and short-term relationships between environmentally sustainable growth and its economic, social, energy, and technological determinants by employing the Autoregressive Distributed Lag (ARDL) bounds testing approach proposed by Pesaran et al. (2001) [18]. The ARDL methodology is particularly appropriate in this context, as it accommodates variables integrated of order zero I(0) and order one I(1), yields robust estimates even with relatively small sample sizes, and allows for the joint estimation of long-run equilibrium relationships alongside short-run dynamic adjustments, provided that none of the variables is integrated of order two I(2).
To assess the presence of a long-run cointegration relationship among the variables, the analysis is based on the following hypotheses:
The calculated F-statistic is compared with the lower and upper bound critical values provided by Pesaran et al. (2001) [18]. If the F-statistic exceeds the upper bound, the null hypothesis of no cointegration is rejected, suggesting the presence of a long-run equilibrium relationship among the variables.
3.4. Model Specification and Estimation Method
In this study, the econometric model is specified in the following functional form, which can be specified in linear econometric form as follows:
With:
- : Growth rate of agricultural GDP.
- : Annual carbon dioxide emissions.
- : Share of agricultural employment in total employment.
- : Renewable energy consumption.
- : Trade as a percentage of GDP.
- : The term random error.
The analysis is based on a time series framework designed to examine the dynamic relationships between CO2 emissions and their structural determinants. The data were processed and estimated using EViews software, employing a methodological approach that included stationarity tests, determination of the order of integration of the variables, and analysis of short- and long-term relationships. This approach allows for the temporal dimension of the variables and their gradual adjustments over time to be taken into account. For the estimation, the autoregressive distributed lag (ARDL) model developed by Pesaran and Shin (1999) and extended by Pesaran et al. (2001) [18] was used for time series modeling. This model is particularly suitable for small samples and integrated variables of mixed orders I(0) and I(1). The bound test procedure associated with ARDL makes it possible to identify the existence of a cointegration relationship between variables, simultaneously estimate short- and long-term dynamics, and correct for endogeneity biases. This specification thus reinforces the robustness of the results and guarantees the validity of the econometric inferences.
The first stage of the time series analysis consisted of testing the stationarity of the variables in order to ensure the reliability and efficiency of the estimations. This was carried out using the Augmented Dickey–Fuller (ADF) unit root test [19]. After determining the order of integration of each variable, the ARDL bounds testing approach was applied to examine the existence of a long-run relationship among the variables. The calculated F-statistic was compared with the critical values reported by Pesaran et al. (2001) [18], while the Akaike Information Criterion (AIC) was used to select the optimal lag length for the model. The ARDL specification allows the estimation of both short-run and long-run dynamics within a single reduced-form equation.
In the ARDL model, the dynamic time series equation is expressed as follows:
This specification allows us to simultaneously estimate the short-term effects (first-difference variables) and the long-term relationship (lagged level variables) over the period 1990–2021.
When cointegration was confirmed, an Error Correction Model (ECM) was estimated to capture the speed of adjustment toward long-run equilibrium through the error-correction term (ECt-1). For convergence, this coefficient must be negative and statistically significant; a positive value would indicate divergence and the absence of long-run equilibrium. In the absence of cointegration, only the short-run dynamics were estimated. Finally, several post-estimation diagnostic tests were conducted, including tests for normality, serial correlation, heteroscedasticity, and parameter stability. These procedures are essential to validate the robustness of the model and to ensure that the results are not affected by econometric specification problems.
4. Results and Discussion
In the previous chapter, we presented the empirical methodological approach, including the ARDL model, which examines the long- and short-term dynamics between CO2 emissions, renewable energy, agricultural economic growth, and other variables included in the study. This model follows the cointegration approach proposed by Pesaran et al. (2001), which is effective in small samples. This chapter presents the results of using these econometric techniques to analyze the long- and short-term relationships between AGDP, CO2, AEMP, ENR, and INTT in Morocco. It is divided into seven sections: descriptive statistics, unit root test results, Bound test results, model estimation, and model validation.
The use of the natural logarithm aims to make the data more comparable, mitigate issues of heteroscedasticity, and allow the coefficients to be interpreted as elasticity, which is particularly well-suited to an ARDL model. Nevertheless, to enhance the clarity and consistency of the presentation, it is necessary to adopt a consistent notation throughout the manuscript, explicitly stating from the outset that the variables are expressed in logarithmic form (LOGGDP, LOGCO2, LOGENR, etc.), unless otherwise specified. Such standardization helps avoid confusion and improves the readability of the empirical analysis.
4.1. Descriptive Statistics
The descriptive analysis covers 31 annual observations spanning the period 1990–2022 for all logarithmic variables: LOGAGDP, LOGCO2, LOGAEMP, LOGENR, and LOGINTT. The results indicate a generally low dispersion of data, as evidenced by moderate standard deviations. For LOGAGDP, the mean is 22.78 with a close median (22.75), reflecting a relatively symmetrical distribution. The skewness is slightly negative (-0.14) and the kurtosis is less than 3 (1.95), suggesting a flat distribution. The Jarque-Bera test (1.52; p=0.47) confirms the normality of the series. Similarly, LOGCO2 has a mean of 10.63, a median of 10.68, and a standard deviation of 0.35, with slight negative asymmetry (-0.19) and a kurtosis of 1.75; the Jarque-Bera test (2.21; p=0.33) does not allow the hypothesis of normality to be rejected.

Table 2.
Descriptive statistics of variables.
| LOGAGDP | LOGCO2 | LOGAEMP | LOGENR | LOGINTT | |
|---|---|---|---|---|---|
| Mean | 22.78177 | 10.62847 | 3.701699 | 2.145790 | 4.103420 |
| Median | 22.74513 | 10.68235 | 3.755913 | 2.142416 | 4.118937 |
| Maximum | 23.30616 | 11.17024 | 3.824836 | 2.443216 | 4.359552 |
| Minimum | 22.10315 | 9.975706 | 3.468720 | 1.848455 | 3.821493 |
| Std. Dev. | 0.354897 | 0.354823 | 0.102737 | 0.161061 | 0.183599 |
| Skewness | -0.137368 | -0.193601 | -1.016741 | 0.098194 | 0.022737 |
| Kurtosis | 1.948989 | 1.749182 | 2.833669 | 1.966717 | 1.431740 |
| Jarque-Bera | 1.524299 | 2.214525 | 5.376835 | 1.428895 | 3.179448 |
| Probability | 0.466662 | 0.330462 | 0.067988 | 0.489462 | 0.203982 |
Note: *, **, and *** indicate significance at the 10%, 5%, and 1% levels, respectively.
Regarding the other variables, LOGAEMP has a mean of 3.70 and a low standard deviation (0.10), but a more pronounced asymmetry (-1.02), indicating a concentration of observations towards high values. Its kurtosis (2.83) remains close to normal, but the Jarque-Bera test (5.38; p=0.07) suggests a slight deviation from normality. For LOGENR, the mean (2.15), median (2.14), and low positive skewness (0.10) reflect a balanced distribution, confirmed by the Jarque-Bera test (1.43; p=0.49). Finally, LOGINTT has a mean of 4.10 and a standard deviation of 0.18, with near-zero skewness (0.02) and a kurtosis of 1.43 indicating a relatively flat distribution; the Jarque-Bera test (3.18; p=0.20) also confirms normality. Overall, these results show that most of the series follow a normal distribution, which reinforces the reliability of subsequent econometric estimates.
4.2. Stationarity of the Variables
Examining the properties of time series before analyzing the relationships between variables is crucial due to the challenges posed by non-stationary data in regression analysis. It is well established in the literature that ordinary least squares (OLS) regression can produce spurious results when the data contain a unit root, except in cases of cointegration (Hamilton, 1994). Consequently, insufficient investigation of the presence of a unit root may lead to estimates that appear statistically significant but are, in reality, meaningless or, at best, inaccurate. To prevent such spurious estimations, stationarity properties are verified using unit root tests, notably the Augmented Dickey-Fuller (ADF) test (Dickey & Fuller, 1979) and the Phillips-Perron (PP) test (Phillips & Perron, 1988).
4.3. Tests of Variables in Levels
The table presents the results of the Augmented Dickey-Fuller (ADF) and Phillips-Perron (PP) unit root tests to assess the stationarity of the time series for the variables Log(AGDP), Log(CO2), Log(AEMP), Log(ENR), and Log(INTT) in levels. The t-Statistic values indicate the strength of the test, while the P-value determines its statistical significance. Decisions are classified according to whether the process is considered a Trend Stationary (TS) or a Difference Stationary (DS) process.
Table 3.
Level Stationarity Analysis of the Variables.
| Variables | ADF t-Statistic | ADF P-value | PP t-Statistic | PP P-value | Decision |
|---|---|---|---|---|---|
| Log(AGDP) | -6.307141 | 0.0001*** | -6.33144 | 0.0001*** | Trend Stationary (TS) |
| Log(CO2) | -2.412254 | 0.1467 | -2.81983 | 0.0667* | Difference Stationary |
| Log(AEMP) | 2.407614 | 0.9999 | 2.095776 | 0.9998 | DS |
| Log(ENR) | -2.588303 | 0.2877 | -2.63056 | 0.2704 | DS |
| Log(INTT) | -3.164396 | 0.1095 | -3.01191 | 0.1447 | DS |
Note: *, **, and *** indicate significance at the 10%, 5%, and 1% levels, respectively.
For the variable Log(AGDP), both the ADF and PP tests show a significance level below 5%, indicating that the series is stationary. The analysis of the test results suggests that the trend component is significant, meaning the series is stationary around its trend. Therefore, Log(AGDP) is classified as a Trend Stationary (TS) process.
For the variables Log(CO2), Log(AEMP), Log(ENR), and Log(INTT), the ADF and PP tests indicate significance levels above 5%, suggesting that these time series are non-stationary.
4.4. First Difference Variable Tests
The table presents the results of the Augmented Dickey-Fuller (ADF) and Phillips-Perron (PP) unit root tests used to assess the stationarity of the time series for the variables Log(AGDP), Log(CO2), Log(AEMP), Log(ENR), and Log(INTT) at first difference. The t-Statistic values indicate the strength of the test, while the P-value values reflect the statistical significance. The order of integration shows the number of differences required to make the time series stationary.
Table 4.
First-Difference Stationarity Analysis of the Variables.
| Variables | ADF t-Statistic | ADF P-value | PP t-Statistic | PP P-value | Decision | Order of Integration |
|---|---|---|---|---|---|---|
| Log(AGDP) | -6.307141 | 0.000*** | -6.33144 | 0.000*** | TS | I(1) |
| Log(CO2) | -9.10811 | 0.000*** | -10.7948 | 0.000*** | DS | I(1) |
| Log(AEMP) | -4.654867 | 0.004*** | -4.57102 | 0.005*** | DS | I(1) |
| Log(ENR) | -5.281031 | 0.001*** | -5.84139 | 0.000*** | DS | I(1) |
| Log(INTT) | -4.243062 | 0.011** | -5.86179 | 0.000*** | DS | I(1) |
Note: *, **, and *** indicate significance at the 10%, 5%, and 1% levels, respectively.
For the variable Log(AGDP), the trend component of the original series was removed, and the ADF and PP tests were conducted, showing high t-statistics and very low p-values (0.000), leading to the conclusion that the time series is stationary. For the variables Log(CO2), Log(AEMP), Log(ENR), and Log(INTT), the ADF and PP tests also exhibit high t-statistics and very low p-values (0.000), indicating that these time series are stationary. The order of integration for these variables is I(1), suggesting that taking the first difference is necessary to achieve stationarity.
4.5. F-Bound Test
In the absence of including higher-order I(2) variables, the variables used in the equation were analyzed to examine whether a long-term relationship exists among the model’s variables using the OLS technique, followed by performing a Wald test in EViews 12.
Table 5.
Results of the F-Bounds Test.
| Test Statistic | Value | Significance | I(0) | I(1) |
|---|---|---|---|---|
| F-statistic | 26.86 | 10% | 2.2 | 3.09 |
| k | 4 | 5% | 2.56 | 3.49 |
| 2.5% | 2.88 | 3.87 | ||
| 1% | 3.29 | 4.37 |
The calculated F-statistic is 26.86, which exceeds the upper critical value of 4.37 at the 1% significance level. Therefore, the null hypothesis of no cointegration is rejected, indicating the existence of long-run cointegration relationships among the variables. This implies that a long-term relationship exists between AGDP, CO2, AEMP, ENR, and INTT over the period 1990–2022 in Morocco.
4.6. Results of the Estimations
4.6.1. Long-Run Relationship Analysis
The results reported in Table 6 provide insight into the long-term relationships between the explanatory variables and agricultural GDP, expressed in logarithmic form. The coefficient associated with CO2 emissions (LOGCO2) is negative and statistically significant at the 5% level (-0.81), indicating a robust inverse relationship. This finding suggests that environmental degradation adversely affects agricultural productivity in the long run, likely through soil deterioration, climate variability, and reduced water availability. In elasticity terms, a 1% increase in CO2 emissions leads to a 0.81% decrease in agricultural output. This result aligns with the environmental degradation hypothesis but contrasts with some empirical studies that find a positive association in early stages of development, highlighting the sensitivity of results to country-specific conditions and stages of structural transformation.
In contrast, agricultural employment (LOGAEMP) does not exhibit a statistically significant effect on agricultural GDP, as indicated by its relatively high p-value (0.3416). This lack of significance may reflect structural inefficiencies in the agricultural labor market, where increases in labor do not necessarily translate into higher productivity. It may also suggest the persistence of traditional farming practices with low value added, implying that labor quantity alone is insufficient without improvements in skills, technology, and capital intensity. This finding underscores the importance of agricultural modernization policies that focus not only on employment but also on productivity enhancement.
A particularly noteworthy and somewhat counterintuitive result concerns renewable energy consumption (LOGENR), which displays a negative and statistically significant coefficient (-0.488). While the literature generally emphasizes the positive role of renewable energy in promoting sustainable growth, this result may reflect short- to medium-term transition costs associated with the adoption of new energy technologies. In the agricultural context, investments in renewable infrastructure (such as solar irrigation systems or biomass equipment) may initially divert financial resources away from productive activities, thereby reducing output in the short run. Additionally, inefficiency in the implementation of renewable energy projects, limited technical expertise, or inadequate institutional support could further explain this negative relationship. This interpretation is consistent with studies highlighting that the benefits of renewable energy are often realized only in the long term, once adaptation and learning effects materialize.
Finally, trade openness (LOGINTT) shows a positive and statistically significant impact on agricultural GDP, with a coefficient of 1.389. This result suggests that increased integration into international markets stimulates agricultural growth, likely through expanded export opportunities, improved access to technology, and enhanced competitiveness. In the Moroccan context, agricultural exports particularly to European markets—play a key role in driving sectoral performance. However, when comparing these findings with existing empirical literature, some divergences emerge. For instance, Tagwi Aluwani (2023) [20] reports a positive effect of CO2 emissions on agricultural output, in contrast to the negative relationship observed in this study. Conversely, the positive role of trade openness and the negative effect of renewable energy are consistent across both studies. These mixed results highlight the importance of contextual factors, model specifications, and time horizons.
Moreover, it is important to note that the estimated error correction term suggests a very rapid speed of adjustment toward long-term equilibrium. While this may indicate strong convergence dynamics, such a high adjustment coefficient could raise concerns regarding its economic plausibility, as real-world agricultural systems typically adjust more gradually due to structural rigidities and adjustment costs. This calls for cautious interpretation and may warrant further robustness checks or alternative model specifications to ensure the stability and credibility of the estimated relationships.
4.6.2. Short-Run Relationship Analysis
The following table (Table 7) presents the results of the short-run analysis of the explanatory variables on the dependent variable. The coefficients of the first-difference variables (D) indicate significant relationships with the dependent variable. Specifically, the positive coefficient of D(LOGCO2) suggests a significant positive relationship between changes in CO2 emissions and Agricultural GDP in the short term. Similarly, the positive and significant coefficients of the differences in energy consumption (D(LOGENR) to D(LOGENR(-3))) indicate a positive relationship between these changes and the dependent variable.
In contrast, the coefficients of the differences in trade openness (D(LOGINTT(-1)) to D(LOGINTT(-2))) are significant, suggesting a negative and significant effect of trade openness on agricultural GDP growth. Furthermore, the negative and significant coefficient of CointEq(-1) indicates the existence of short-run cointegration among the variables, confirming that in the event of a short-term disequilibrium, the model will adjust back to its long-term equilibrium at an annual adjustment speed of 173%. Regarding model fit, the model appears well-specified, with an R2 of 0.96, suggesting that the explanatory variables account for a substantial portion of the variation in the dependent variable in the context of the short-run analysis.
The empirical findings highlight a clear distinction between short-run dynamics and long-run relationships, particularly for trade openness, CO2 emissions, and renewable energy. In the short term, variations in trade openness exert a negative and statistically significant effect on agricultural GDP growth, suggesting that increased exposure to international markets generates adjustment costs such as stronger competition, price volatility, and structural constraints limiting producers’ responsiveness. Moreover, the negative and highly significant error correction term confirms the existence of short-run cointegration among the variables. However, the estimated adjustment speed (173%) appears unusually high, implying a very rapid return to equilibrium that may be economically unrealistic given the rigidities and gradual adaptation processes characterizing agricultural systems.
In contrast, the long-run results reveal more stable and theoretically consistent relationships. CO2 emissions have a significant negative impact on agricultural GDP, reflecting the cumulative effects of environmental degradation on productivity, in line with the later stage of the Environmental Kuznets Curve. Similarly, renewable energy consumption shows a negative long-term effect, which, although counterintuitive, can be explained by transition costs, initial inefficiency, and structural constraints that delay the realization of productivity gains. Trade openness, on the other hand, exhibits a positive and significant long-term effect, indicating that despite short-term disruptions, it ultimately supports agricultural growth through export expansion, technology transfer, and improved competitiveness. Overall, these results emphasize the importance of distinguishing between short-term adjustment effects and long-term equilibrium outcomes, while highlighting the need for appropriate public policies to ease transition costs and enhance the long-term benefits of energy transition and trade liberalization.
4.6.3. Causality Test
The issue of reverse causality is particularly relevant in the context of this study, given that agricultural growth is likely to, in turn, influence CO2 emissions and energy consumption. While the ARDL model helps to partially mitigate endogeneity biases by distinguishing between short-term and long-term dynamics, it does not guarantee strict causal identification [27]. To address this limitation, a Granger causality test was employed to explicitly examine the direction of the dynamic relationships between the variables and assess the existence of any feedback effects.
The results reveal a predominantly unidirectional causal structure, which provides important empirical evidence regarding the risk of reverse causality. In particular, CO2 emissions appear to be an explanatory variable for agricultural growth (p = 0.0464), with no significant inverse relationship detected. This suggests that, in the Moroccan context, environmental pressures influence agricultural performance, while the expansion of agricultural activity does not, in the short term, result in a significant increase in emissions. Similarly, renewable energy consumption and trade openness have a predictive effect on agricultural growth (at the 10% significance level), without confirmation of reverse causality. These results suggest that the main explanatory variables can be considered relatively exogenous in the short-term dynamics, which mitigates the risk of strong simultaneity.
Table 9.
Causality Analysis Between the Variables.
| Hypothese null | F-Statistic | Prob. |
| LOGCO2 does not Granger Cause LOGAGDPTS | 3.46243 | 0.0464** |
| LOGAGDPTS does not Granger Cause LOGCO2 | 0.37570 | 0.6905 |
| LOGEMP does not Granger Cause LOGAGDPTS | 0.52970 | 0.5950 |
| LOGAGDPTS does not Granger Cause LOGEMP | 3.78062 | 0.0362** |
| LOGENR does not Granger Cause LOGAGDPTS | 2.96753 | 0.0705** |
| LOGAGDPTS does not Granger Cause LOGENR | 1.30796 | 0.2890 |
| LOGINTT does not Granger Cause LOGAGDPTS | 3.23331 | 0.0557* |
| LOGAGDPTS does not Granger Cause LOGINTT | 1.58391 | 0.2243 |
| LOGAEMP does not Granger Cause LOGCO2 | 0.62255 | 0.5444 |
| LOGCO2 does not Granger Cause LOGAEMP | 2.95222 | 0.0699* |
| LOGENR does not Granger Cause LOGCO2 | 1.14343 | 0.3355 |
| LOGCO2 does not Granger Cause LOGENR | 2.68296 | 0.0888* |
| LOGINTT does not Granger Cause LOGCO2 | 0.10442 | 0.9012 |
| LOGCO2 does not Granger Cause LOGINTT | 5.16500 | 0.0129** |
| LOGENR does not Granger Cause LOGAEMP | 1.13640 | 0.3376 |
| LOGAEMP does not Granger Cause LOGENR | 0.32186 | 0.7279 |
| LOGINTT does not Granger Cause LOGAEMP | 5.84737 | 0.0080*** |
| LOGAEMP does not Granger Cause LOGINTT | 1.07571 | 0.3558 |
| LOGINTT does not Granger Cause LOGENR | 2.65909 | 0.0906* |
| LOGENR does not Granger Cause LOGINTT | 0.19621 | 0.8231 |
Note: *, **, and *** indicate significance at the 10%, 5%, and 1% levels, respectively.
Furthermore, the interactions between variables confirm the existence of asymmetric and hierarchical relationships, without any significant bidirectional causality. Agricultural growth influences agricultural employment (p = 0.0362), while trade openness affects CO2 emissions (p = 0.0129) and agricultural employment (p = 0.0080), and CO2 emissions also influence employment at a lower threshold. The absence of feedback loops between key variables (particularly between agricultural growth and emissions or energy) reinforces the robustness of the results from the ARDL model by limiting the risks of bias associated with reverse causality. Nevertheless, these conclusions should be interpreted with caution, as the Granger test relies on predictive rather than structural causality. Thus, complementary approaches, such as structural VAR models or instrumental variable methods, could be considered in future work to better understand long-term causality mechanisms and strengthen empirical identification.
4.7. Model Validity
To assess the robustness of the estimated models, several diagnostic tests were conducted. A serial correlation test was applied to verify the independence of the residuals, a heteroskedasticity test was used to examine the constancy of the error variance, were performed to evaluate whether the model coefficients remain stable over the study period.
To assess whether the residuals of the three estimated regression models exhibit autocorrelation, the Breusch–Godfrey test was applied. The null hypothesis of this test assumes that no autocorrelation is present in the residuals, while the alternative hypothesis indicates the existence of serial correlation. The test statistic is compared to the critical value of the Fisher distribution, and the null is rejected if the associated probability is below 5%. Results reported in Table 10 show probabilities exceeding 5%, indicating that the null hypothesis cannot be rejected and that the residuals are free from serial correlation.
The normality of the residuals was examined using the Jarque–Bera test, which tests whether the residuals follow a normal distribution. Here, the null hypothesis posits normality, while the alternative suggests deviation from normality. If the test statistic exceeds the critical value or the probability is below 5%, the null is rejected. As shown in Table 10, all models present probabilities greater than 5%, confirming that the residuals can be considered normally distributed.
Heteroskedasticity was evaluated using the Breusch–Pagan–Godfrey test. Under the null hypothesis, the variance of the residuals is constant (homoskedasticity), whereas the alternative assumes a non-constant variance (heteroskedasticity). Rejection occurs when the test statistic exceeds the Fisher critical value or the associated probability falls below 5%. The results, summarized in Table 10, indicate probabilities above the 5% threshold, implying that the residuals are homoskedastic across all models and that variance stability is maintained.
Finally, model stability was assessed through the Cumulative Sum (CUSUM) and Cumulative Sum of Squares (CUSUMSQ) tests, which examine the constancy of long-term coefficients and short-term dynamics over time [18]. The null hypothesis assumes that the coefficient vector remains stable across periods. According to Bahmani-Oskooee and Ng (2002) [30], if the CUSUM and CUSUMSQ plots remain within the 5% significance bounds, the null cannot be rejected. The plots presented in Figure 1 and Figure 2 show that the coefficients of the models are stable, confirming the reliability of the estimated relationships throughout the sample period.
The CUSUM plot for Morocco stays within the 5% critical bounds over the entire sample period, indicating that the estimated coefficients are stable over time. This finding suggests that the ARDL model does not exhibit structural instability in the case of Morocco.
The CUSUMSQ test results for Morocco also remain within the critical bounds, confirming the stability of the variance of the residuals and supporting the overall reliability of the estimated model.
5. Conclusions
This study highlights the complex interplay between agricultural development, environmental sustainability, and energy transition in Morocco, where agriculture remains a critical driver of growth, employment, and food security, yet faces rising CO2 emissions and environmental pressures. By employing an ARDL modeling approach, the research identifies both long-term and short-term dynamics between agricultural value added, renewable energy consumption, agricultural employment, and trade liberalization, showing that renewable energy and trade openness can influence environmental outcomes while supporting economic growth, whereas CO2 emissions and certain production practices may hinder sustainability. The findings emphasize that reconciling agricultural productivity with environmental objectives requires integrated policies that promote clean technologies, efficient energy use, and sustainable labor practices in agriculture, offering actionable insights for Morocco’s Green Moroccan Plan and Generation Green strategy to balance economic development with ecological responsibility.
The analysis of the stationarity properties of the variables reveals that while Log(AGDP) is trend-stationary at levels, the other variables Log(CO2), Log(AEMP), Log(ENR), and Log(INTT) are non-stationary and require first differencing to achieve stationarity. The first-difference unit root tests confirm that all variables become stationary at order I(1), which validates the use of the ARDL framework for analyzing both short- and long-term relationships. Furthermore, the F-Bounds test strongly rejects the null hypothesis of no cointegration, indicating the existence of significant long-term equilibrium relationships among agricultural GDP, CO2 emissions, agricultural employment, renewable energy consumption, and trade openness in Morocco over the period 1990–2022.
The estimation results show that CO2 emissions have a long-term negative impact on agricultural GDP, whereas trade openness positively influences agricultural growth, and renewable energy consumption exhibits a significant negative effect. In the short term, changes in CO2 emissions and renewable energy consumption positively affect agricultural GDP, while short-term fluctuations in trade openness show a negative effect. The Granger causality analysis reveals several unidirectional relationships, such as CO2 emissions Granger-causing agricultural GDP and trade openness influencing both CO2 emissions and agricultural employment, highlighting dynamic and asymmetric interactions between environmental, economic, and energy variables in Morocco’s agricultural sector.
Diagnostic tests confirm the robustness of the estimated models. The Breusch–Godfrey test indicates no serial correlation in the residuals, the Jarque–Bera test confirms normality, and the Breusch–Pagan–Godfrey test shows homoskedasticity, demonstrating that the models satisfy the key assumptions of classical regression analysis. Overall, these findings suggest that Morocco’s agricultural development and environmental sustainability are closely interlinked, with energy transition, trade, and labor dynamics playing critical roles. Policymakers should therefore integrate strategies that promote clean energy adoption, sustainable labor practices, and trade policies that enhance agricultural productivity while mitigating environmental pressures.
The analysis demonstrates that Morocco’s agricultural GDP, CO2 emissions, renewable energy consumption, trade openness, and agricultural employment are dynamically interlinked, with long-term cointegration and short-term adjustments confirmed through the ARDL framework. While CO2 emissions and renewable energy consumption have contrasting impacts in the short and long term, trade openness consistently supports agricultural growth, and Granger causality tests reveal unidirectional predictive relationships among key variables. Robustness checks indicate no issues with autocorrelation, heteroskedasticity, or residual normality, highlighting the reliability of the models. These results underscore the importance of integrating energy transition, trade policies, and labor strategies to promote sustainable agricultural development in Morocco while balancing environmental objectives.
Author Contributions
Conceptualization, T.M., H.C., T.A.M, J.E.B and Y.E.O.; methodology, T.M. and Y.E.O.; software, T.M., H.C., T.A.M and Y.E.O.; validation, T.M., H.C., T.A.M and J.E.B.; formal analysis, T.M.; investigation, T.M., T.A.M and J.E.B.; resources, T.M.; data curation, T.M., and Y.E.O.; writing—original draft preparation, T.M., J.E.B and Y.E.O.; writing—review and editing, T.M., H.C and J.E.B.; visualization, T.M., H.C and Y.E.O.; supervision, T.M., H.C and T.A.M.; project administration, T.M., H.C., T.A.M and Y.E.O.; funding acquisition, T.M., H.C., T.A.M, J.E.B and Y.E.O.; All authors have read and agreed to the published version of the manuscript.
Funding
This research received no external funding.
Institutional Review Board Statement
Not applicable.
Informed Consent Statement
Not applicable.
Data Availability Statement
The original contributions presented in this study are included in the article. Further inquiries can be directed to the corresponding authors.
Conflicts of Interest
The authors declare no conflicts of interest.
References
- Ali, S. ARDL approach to renewable energy and CO2 emissions in developing economies: Evidence from Pakistan. Energy Policy 2024, 171, 113243. [Google Scholar]
- Ben Jebli, M.; Ben Youssef, S. Energy consumption, economic growth and environmental sustainability: Evidence from North African countries. Renewable and Sustainable Energy Reviews 2017, 72, 1235–1245. [Google Scholar]
- Destek, M. A.; Sinha, A. The role of agricultural employment and energy transition in environmental sustainability. Environmental Science and Pollution Research 2020, 27, 43567–43582. [Google Scholar]
- Grossman, G. M.; Krueger, A. B. Economic growth and the environment. Quarterly Journal of Economics 1995, 110(2), 353–377. [Google Scholar] [CrossRef]
- IRENA. Renewable energy and sustainable agriculture: Pathways to carbon neutrality; International Renewable Energy Agency: Abu Dhabi, 2022. [Google Scholar]
- Liu, X.; Chen, Y.; Wang, F. Agricultural growth, energy consumption, and CO2 emissions in developing economies: A dynamic panel approach. Journal of Cleaner Production 2021, 278, 123882. [Google Scholar]
- Sarkodie, S. A.; Strezov, V. Empirical analysis of the pollution haven and halo effects in developing countries. Environmental Science and Pollution Research 2019, 26, 34589–34606. [Google Scholar]
- Shahbaz, M.; Solarin, S. A.; Mahmood, H. Trade openness, energy consumption and environmental degradation: Evidence from developing countries. Renewable and Sustainable Energy Reviews 2020, 131, 110027. [Google Scholar]
- Zhang, X.; Li, Y.; Chen, H. Agricultural value added and CO2 emissions: A dynamic panel analysis for China. Journal of Cleaner Production 2023, 397, 136433. [Google Scholar]
- Apergis, N.; Payne, J. E. Renewable energy, output, CO2 emissions, and the role of financial development in Europe. Energy Economics 53 2016, 19–27. [Google Scholar]
- Balsalobre-Lorente, D.; Driha, O. M.; Bekun, F. V.; Adedoyin, F. F. The asymmetric impact of renewable energy consumption on economic growth and CO2 emissions in emerging economies. Renewable Energy 181 2022, 903–917. [Google Scholar]
- Bouri, E.; Molnár, P.; Azzi, G.; Roubaud, D.; Hagfors, L. I. On the hedge and safe haven properties of Bitcoin: Is it really more than a diversifier? Finance Research Letters 20 2017, 192–198. [Google Scholar] [CrossRef]
- Jebli, M. B.; Youssef, S. B.; Ozturk, I. How do renewable energy consumption and trade openness impact CO2 emissions? Evidence from a global panel analysis. Energy Economics 54 2016, 14–23. [Google Scholar]
- Lean, H. H.; Smyth, R. Renewable energy consumption–economic growth nexus in ASEAN countries: Panel cointegration and causality evidence. Energy Economics 59 2016, 451–460. [Google Scholar]
- Ozturk, I.; Acaravci, A. The long-run and causal analysis of energy, growth, openness and CO2 emissions in Turkey. Energy Economics 36 2013, 262–267. [Google Scholar] [CrossRef]
- Paramati, S. R.; Ummalla, M.; Vadlamannati, K. C. Economic growth, renewable and non-renewable energy consumption, and CO2 emissions in BRIC countries: Evidence from panel ARDL. Energy Economics 63 2017, 144–151. [Google Scholar]
- Pata, U. K. Renewable and non-renewable energy consumption, carbon emissions, and economic growth: Evidence from Turkey. Environmental Science and Pollution Research 28 2021, 36537–36549. [Google Scholar]
- Pesaran, M. H.; Shin, Y.; Smith, R. J. Bounds testing approaches to the analysis of level relationships. Journal of Applied Econometrics 2001, 16(3), 289–326. [Google Scholar] [CrossRef]
- Sharif, A.; Mensi, W.; Mohd, S. The dynamic relationship between CO2 emissions, oil prices, and economic growth: Global evidence from wavelet-based analysis. OPEC Energy Review 2017, 41(2), 256–278. [Google Scholar]
- Tagwi Aluwani, D. Agricultural productivity and environmental sustainability: The role of CO2 emissions, trade, and renewable energy. Journal of Agricultural Economics 2023, 74(2), 215–234. [Google Scholar]
- Ullah, S.; Adebayo, T. S.; Kirikkaleli, D.; Binu, O. Renewable energy consumption, environmental degradation, and ecological footprint: The effect of economic growth in G7 economies. Sustainable Cities and Society 69 2021, 102805. [Google Scholar]
- Wei, Y.; Ullah, S.; Zeng, J.; Rasool, A.; Zaib, S. Modeling the nexus among financial development, trade openness, economic growth, and environmental quality: New evidence from Belt and Road Initiative economies. Science of the Total Environment 784 2021, 147131. [Google Scholar]
- Zoundi, Z. CO2 emissions, renewable energy and the Environmental Kuznets Curve: Evidence from panel cointegration. Renewable and Sustainable Energy Reviews 72 2017, 1067–1075. [Google Scholar] [CrossRef]
- Tarı, R. Econometrics, 7th ed.; Umuttepe Publications: Kocaeli, Turkey, 2011. [Google Scholar]
- Gujarati, D. Örneklerle Ekonometri, 1st ed.; Bolatoğlu, N., Ed.; BB101: Ankara, Turkey, 2016. [Google Scholar]
- Zivot, E.; Andrews, D.W.K. Further Evidence on the Great Crash, the Oil-Price Shock, and the Unit-Root Hypothesis. J. Bus. Econ. Stat. 1992, 10, 251–270. [Google Scholar] [CrossRef]
- Granger, C.W.J. Investigating causal relations by econometric models and cross-spectral methods. Econometrica 1969, 37, 424–438. [Google Scholar] [CrossRef]
- Sims, C.A. Macroeconomics and reality. Econometrica 1980, 48, 1–48. [Google Scholar] [CrossRef]
- Sohag, K.; Taşkın, F.D.; Malik, M.N. Green economic growth, cleaner energy and militarization: Evidence from Turkey. Resour. Policy 2019, 63, 101407. [Google Scholar] [CrossRef]
- Mohsen, Bahmani-Oskooee; Raymond, Ng. Long-run demand for money in Hong Kong: An application of the ARDL model. International Journal of Business and Economics 2002, 1(2), 147–155. [Google Scholar]
Figure 1.
CUSUM Stability Test for Morocco. Note: The straight lines represent the 5% significance bounds.
Figure 1.
CUSUM Stability Test for Morocco. Note: The straight lines represent the 5% significance bounds.
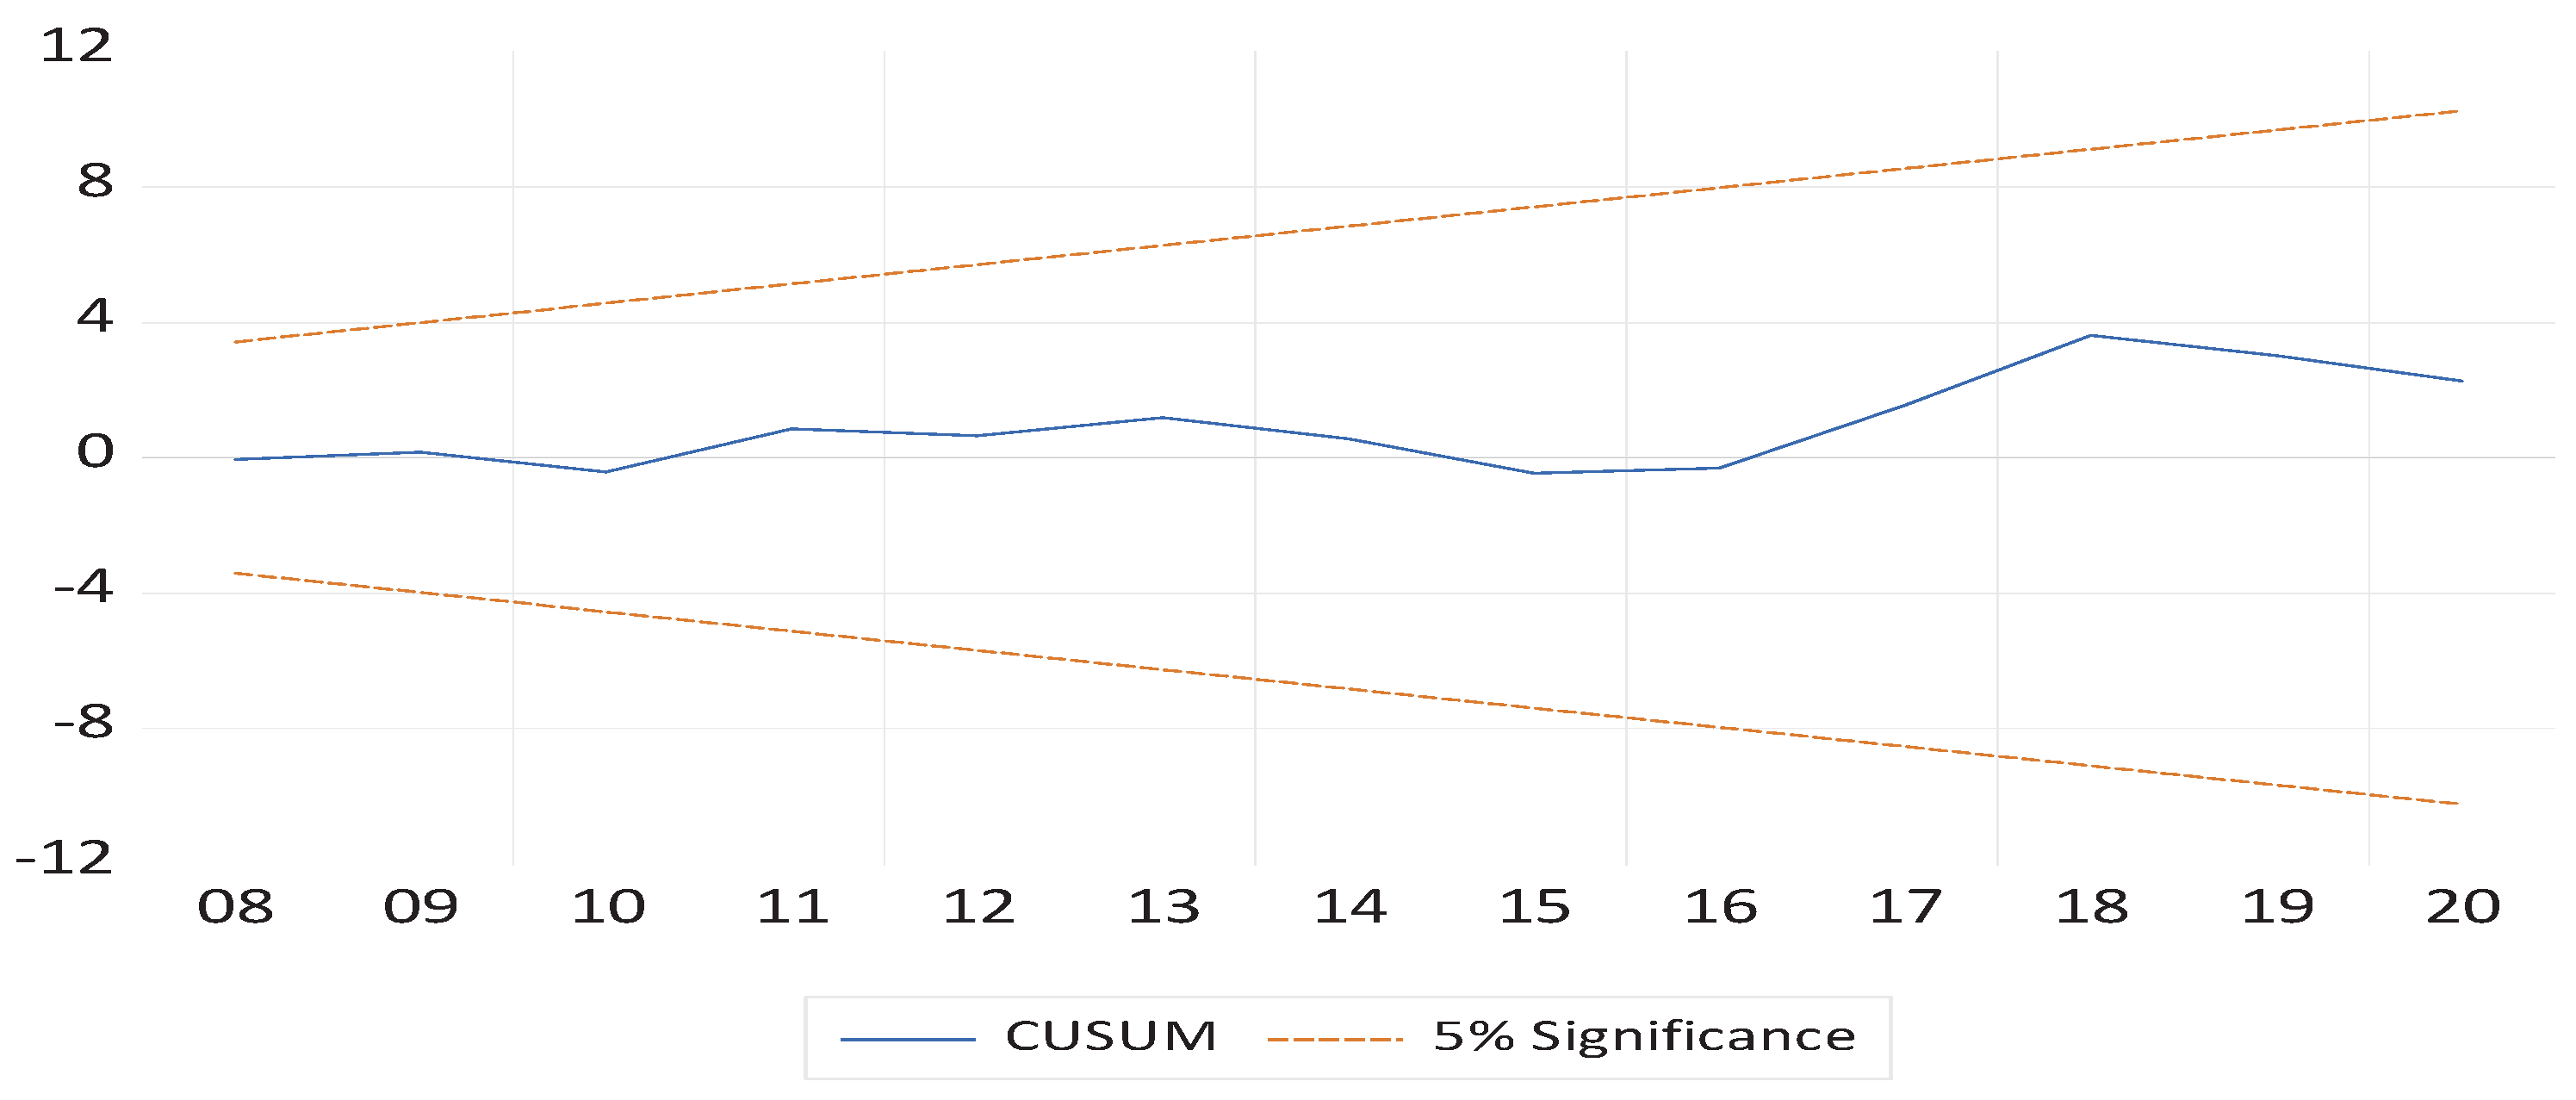
Figure 2.
CUSUMSQ Stability Test for Morocco. Note: The straight lines represent the 5% significance bounds.
Figure 2.
CUSUMSQ Stability Test for Morocco. Note: The straight lines represent the 5% significance bounds.
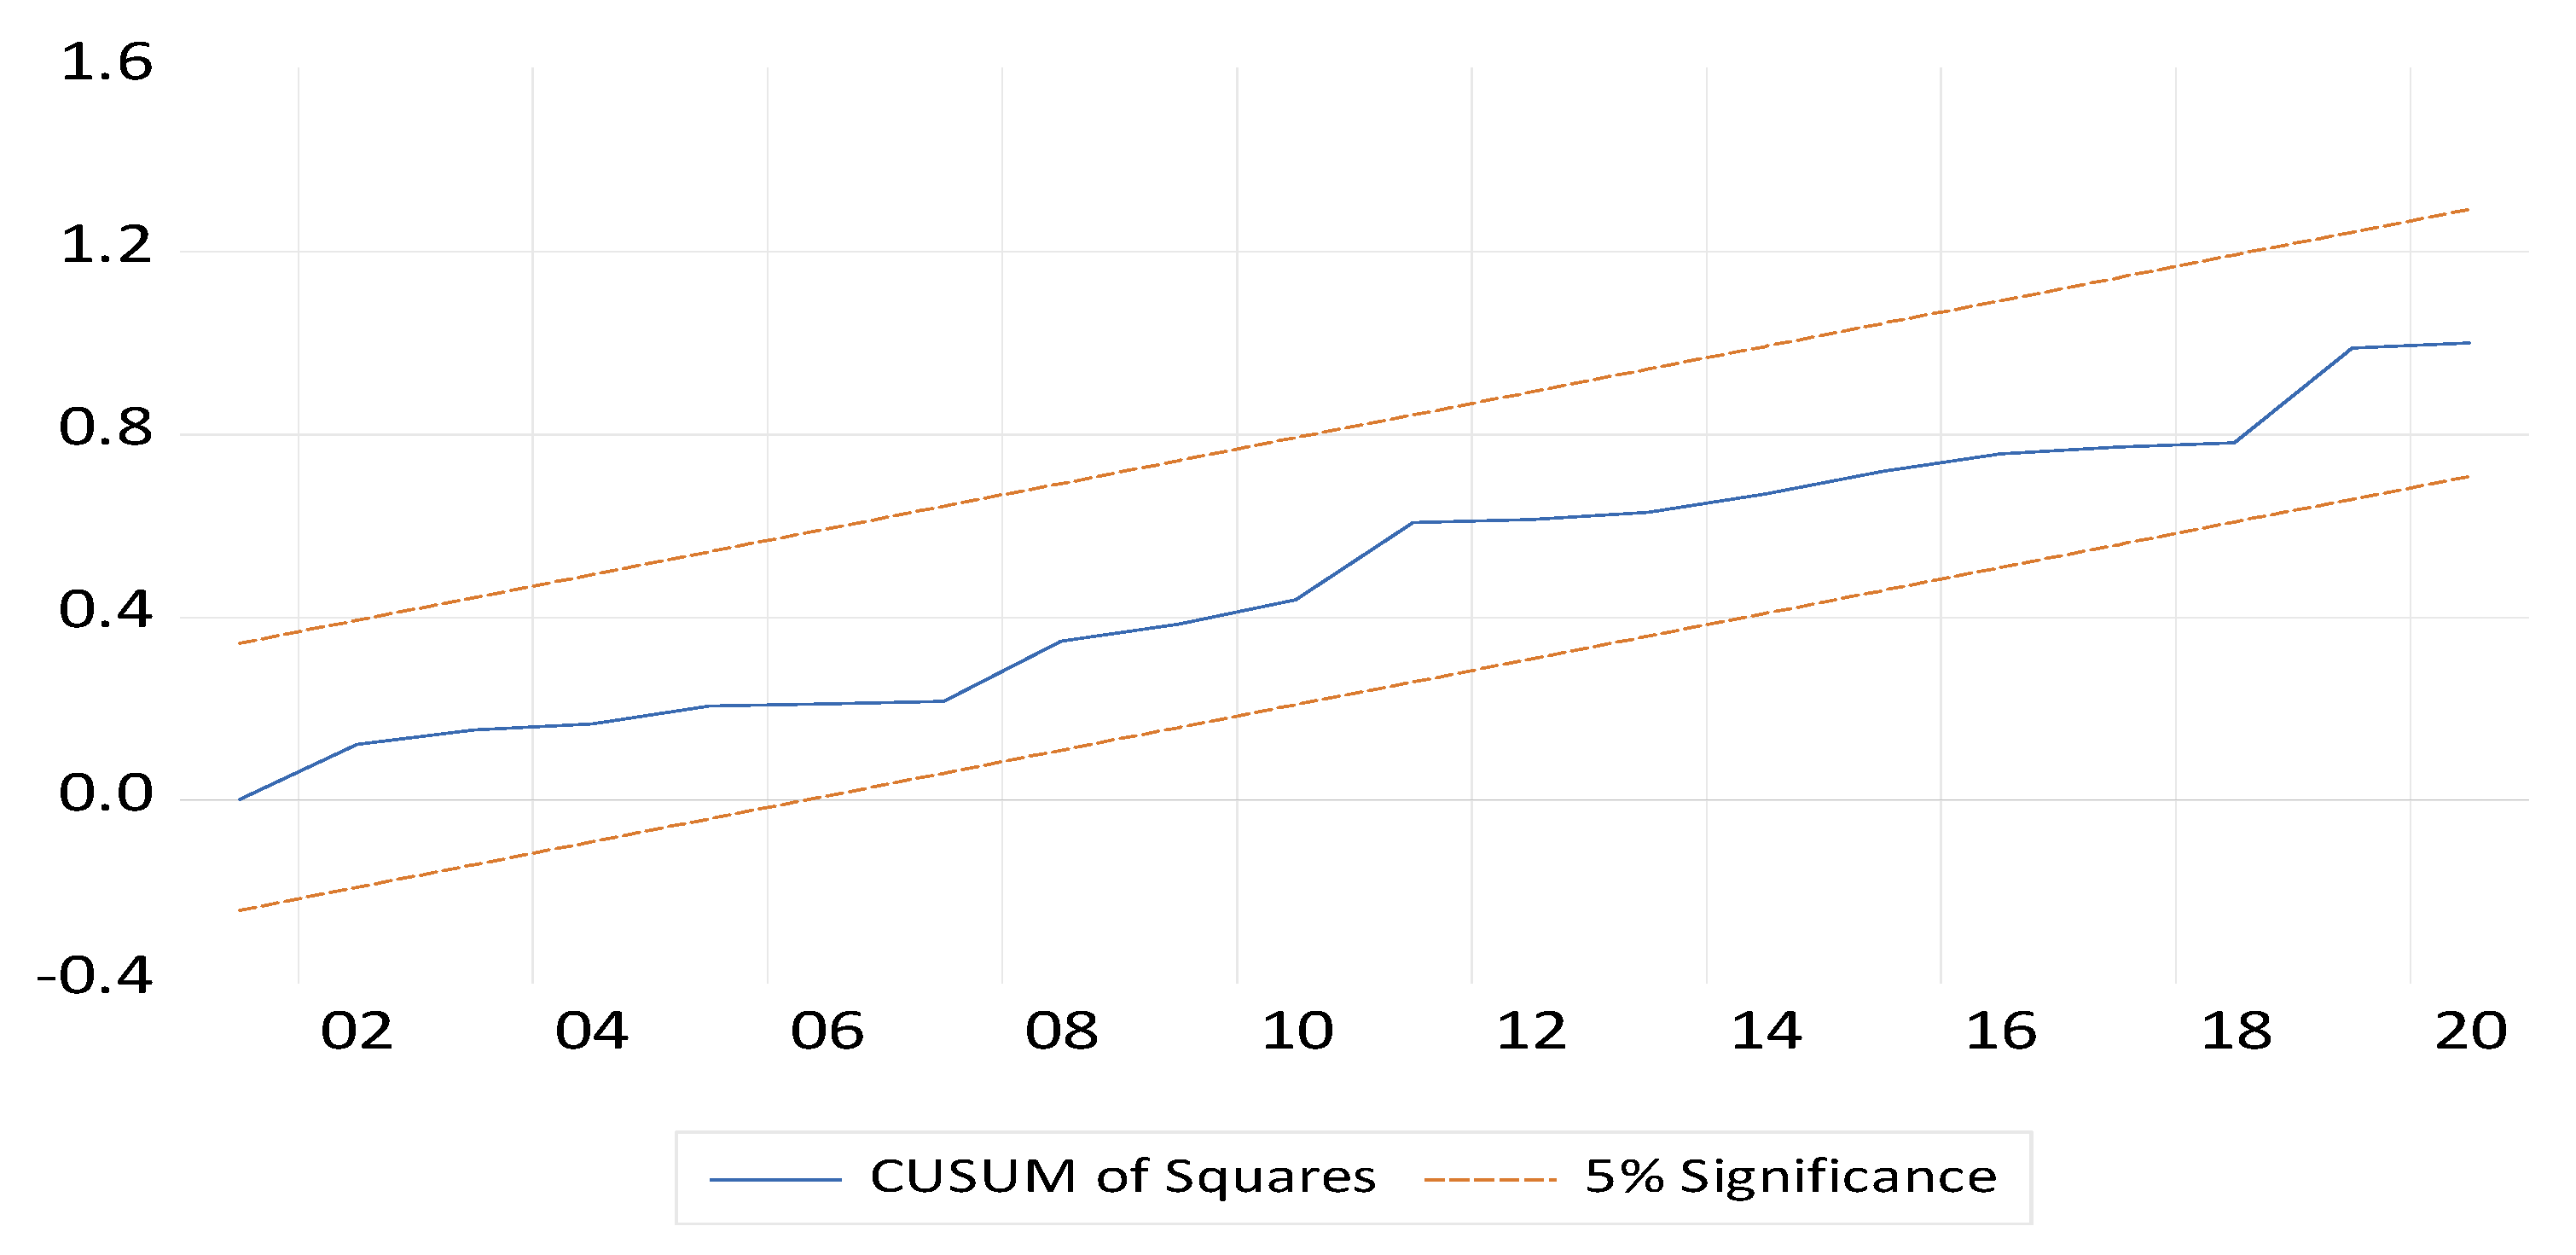
Table 1.
Data description and sources.
| Variable | Code | Description | Unit | Source | ||
|---|---|---|---|---|---|---|
| CO2 emissions | Annual carbon dioxide emissions | Metric tons per capita | World Bank | |||
| Agricultural GDP | AGDP | Growth rate of agricultural GDP | Percentage | World Bank | ||
| Agricultural employment | Share of agricultural employment in total employment | Percentage | World Bank | |||
| Energy | Renewable energy consumption | Percentage | World Bank | |||
| International trade | Trade as a percentage of GDP | Percentage | World Bank |
Table 6.
Results of the long-term relationship between the variables.
| Variable | Coefficient | Std. Error | t-Statistic | Prob. |
| Log(CO2) | -0.816161 | 0.159368 | -5.121232 | 0.0002*** |
| Log(AEMP) | 0.136774 | 0.138566 | 0.987072 | 0.3416 |
| Log(ENR) | -0.488774 | 0.165032 | -2.961698 | 0.0110** |
| Log(INTT) | 1.389307 | 0.218927 | 6.345976 | 0.0000*** |
| C | 3.552693 | 1.527026 | 2.326544 | 0.0368** |
Note: *, **, and *** indicate significance at the 10%, 5%, and 1% levels, respectively.
Table 7.
Short-Run Relationship Results Between the Variables.
| Variable | Coefficient | Std. Error | t-Statistic | Prob. | |
| D Log(CO2) | 0.612723 | 0.257268 | 2.381652 | 0.0332** | |
| D(LOGENR) | 0.220731 | 0.138638 | 1.592141 | 0.1354 | |
| D(LOGENR(-1)) | 1.035552 | 0.163535 | 6.332298 | 0.0000*** | |
| D(LOGENR(-2)) | 1.379719 | 0.157531 | 8.758371 | 0.0000*** | |
| D(LOGENR(-3)) | 0.941452 | 0.145748 | 6.459464 | 0.0000*** | |
| D(LOGINTT) | 0.146754 | 0.200607 | 0.731551 | 0.4774 | |
| D(LOGINTT(-1)) | -1.551997 | 0.219350 | -7.075442 | 0.0000*** | |
| D(LOGINTT(-2)) | -0.562390 | 0.157662 | -3.567066 | 0.0034*** | |
| CointEq(-1)* | -1.738110 | 0.116334 | -14.94064 | 0.0000*** | |
| R-squared | 0.959450 | Akaike info criterion | -2.725364 | ||
| Adjusted R-squared | 0.941428 | Schwarz criterion | -2.293418 | ||
| Durbin-Watson stat | 1.833622 | Hannan-Quinn criter. | -2.596924 | ||
Note: *, **, and *** indicate significance at the 10%, 5%, and 1% levels, respectively.
Table 10.
Diagnostic tests.
| Diagnostic test | Maroc |
| Breusch-Godfrey Serial Correlation LM Test | Prob > 0,05 |
| Heteroskedasticity Test: Breusch-Pagan-Godfrey | Prob > 0,05 |
| Residual Normality Test – Jarque–Bera | Prob > 0,05 |
Disclaimer/Publisher’s Note: The statements, opinions and data contained in all publications are solely those of the individual author(s) and contributor(s) and not of MDPI and/or the editor(s). MDPI and/or the editor(s) disclaim responsibility for any injury to people or property resulting from any ideas, methods, instructions or products referred to in the content. |
© 2026 by the authors. Licensee MDPI, Basel, Switzerland. This article is an open access article distributed under the terms and conditions of the Creative Commons Attribution (CC BY) license (http://creativecommons.org/licenses/by/4.0/).
Copyright: This open access article is published under a Creative Commons CC BY 4.0 license, which permit the free download, distribution, and reuse, provided that the author and preprint are cited in any reuse.


