

Submitted:
18 March 2026
Posted:
19 March 2026
You are already at the latest version
Abstract
In the context of global warming, extreme precipitation on the Qinghai-Tibet Plateau has intensified significantly. Understanding the internal structure of precipitation events and their response to rising temperatures is crucial for elucidating these intensification mechanisms. Focusing on the Hehuang Valley, this study constructed an event-scale dataset using hourly observations from 15 meteorological stations (2015–2024), introducing “Inter-event Maximum Temperature” as a key thermal driver. By integrating clustering, trend tests, and logistic regression, we analyzed the spatiotemporal evolution of precipitation extremes. Results indicate that: (1) regional precipitation exhibits a pattern of fluctuating frequency but increasing intensity; (2) the proportion of uniform precipitation has decreased while non-uniform types, especially rear-peak events, have increased significantly; (3) spatial heterogeneity is strongly influenced by topography, with extreme precipitation concentrated on windward slopes and in valley contractions;(4) Inter-event maximum temperature exerts a significant non-linear positive effect, where a 1°C increase raises the odds ratio for extreme precipitation occurrence by approximately 13.4%. These results confirm that antecedent thermal accumulation enhances extremes by increasing atmospheric water-holding capacity and convective instability. While decadal-scale uncertainties remain due to the limited 10-year data span, these findings provide a scientific basis for disaster prevention and water resource management in high-altitude basins.
Keywords:
hehuang valley
; extreme precipitation
; tmax_inter
1. Introduction
Against the backdrop of global warming, the intensity and frequency of extreme precipitation events have been increasing worldwide[1], emerging as a central theme in research on regional hydrological cycles and disaster risks[2].According to the Clausius-Clapeyron (C-C) relation, the atmospheric water-holding capacity increases by approximately 7% for every 1°C rise in temperature [3]. This relationship is markedly amplified in plateau regions, where precipitation intensity can increase by as much as 15% per degree Celsius of warming[4].
Previous studies have extensively explored the statistical relationship between temperature and total precipitation at daily and longer timescales [5,6]. Some research has focused on the impacts of large-scale circulation patterns, monsoon intensity, and moisture transport pathways on extreme precipitation[7,8], while others have evaluated the spatiotemporal evolution of extreme precipitation indices based on station data from the Tibetan Plateau and its surrounding areas[9,10,11]. However, systematic investigations from an "event-based" perspective specifically focusing on the internal structural characteristics of individual precipitation events and the thermodynamic background between events remain insufficient. During the intervals between successive precipitation events, high temperatures can significantly modulate subsequent precipitation extremes by enhancing surface evapotranspiration, increasing atmospheric moisture-holding capacity, and altering convective instability. Yet, targeted observational evidence and statistical verification for this quantitative process are still lacking. Existing studies predominantly utilize concurrent daily mean or maximum temperature indicators [12], rarely accounting for the Tmax_inter, a thermodynamic constraint directly linked to the precipitation process. Consequently, it remains challenging to fully elucidate the potential nonlinear response between preceding heat and extreme precipitation.
The Hehuang Valley, situated on the northeastern margin of the Tibetan Plateau (TP), exhibits dual characteristics of both plateau and mountainous terrain, making it one of the most sensitive and vulnerable regions to global climate change [13]. This region serves as a transition zone between the northeastern TP and the Loess Plateau, acting as a critical headwater conservation area for the upper Yellow River as well as a densely populated and urbanized corridor[14]. Characterized by steep topographic relief and the convergence of the Westerlies and the Asian monsoon, the precipitation mechanisms here are exceptionally complex; while total precipitation remains modest, its interannual and seasonal variability is pronounced. Once extreme precipitation events occur, they are highly prone to triggering secondary disasters such as flash floods, landslides, and debris flows, threatening regional ecological security and socio-economic development[15]. Consequently, a detailed characterization of the spatiotemporal evolution of precipitation extremes in the Hehuang Valley and the elucidation of their driving mechanisms are of significant scientific and practical importance for regional disaster prevention and mitigation.
Building upon these considerations, this study focuses on the Hehuang Valley and utilizes hourly precipitation and temperature data from 15 national reference meteorological stations during the warm season (May–September) from 2015 to 2024 to construct an event-based precipitation database. Extreme precipitation is defined using event identification and quantile threshold methods. On this basis, a suite of analytical techniques including trend analysis, cluster analysis, spatial interpolation, and logistic regressionis integrated to deepen the understanding of the formation mechanisms underlying precipitation extremes in the Hehuang Valley, specifically from the perspectives of event scale and antecedent thermodynamic conditions. This research provides high-resolution empirical evidence for extreme precipitation variations in a typical canyon-valley region of the northeastern Tibetan Plateau. Furthermore, it offers targeted scientific support for regional water resource management and early warning systems for flash floods and geological disasters.
2. Study Area Overview
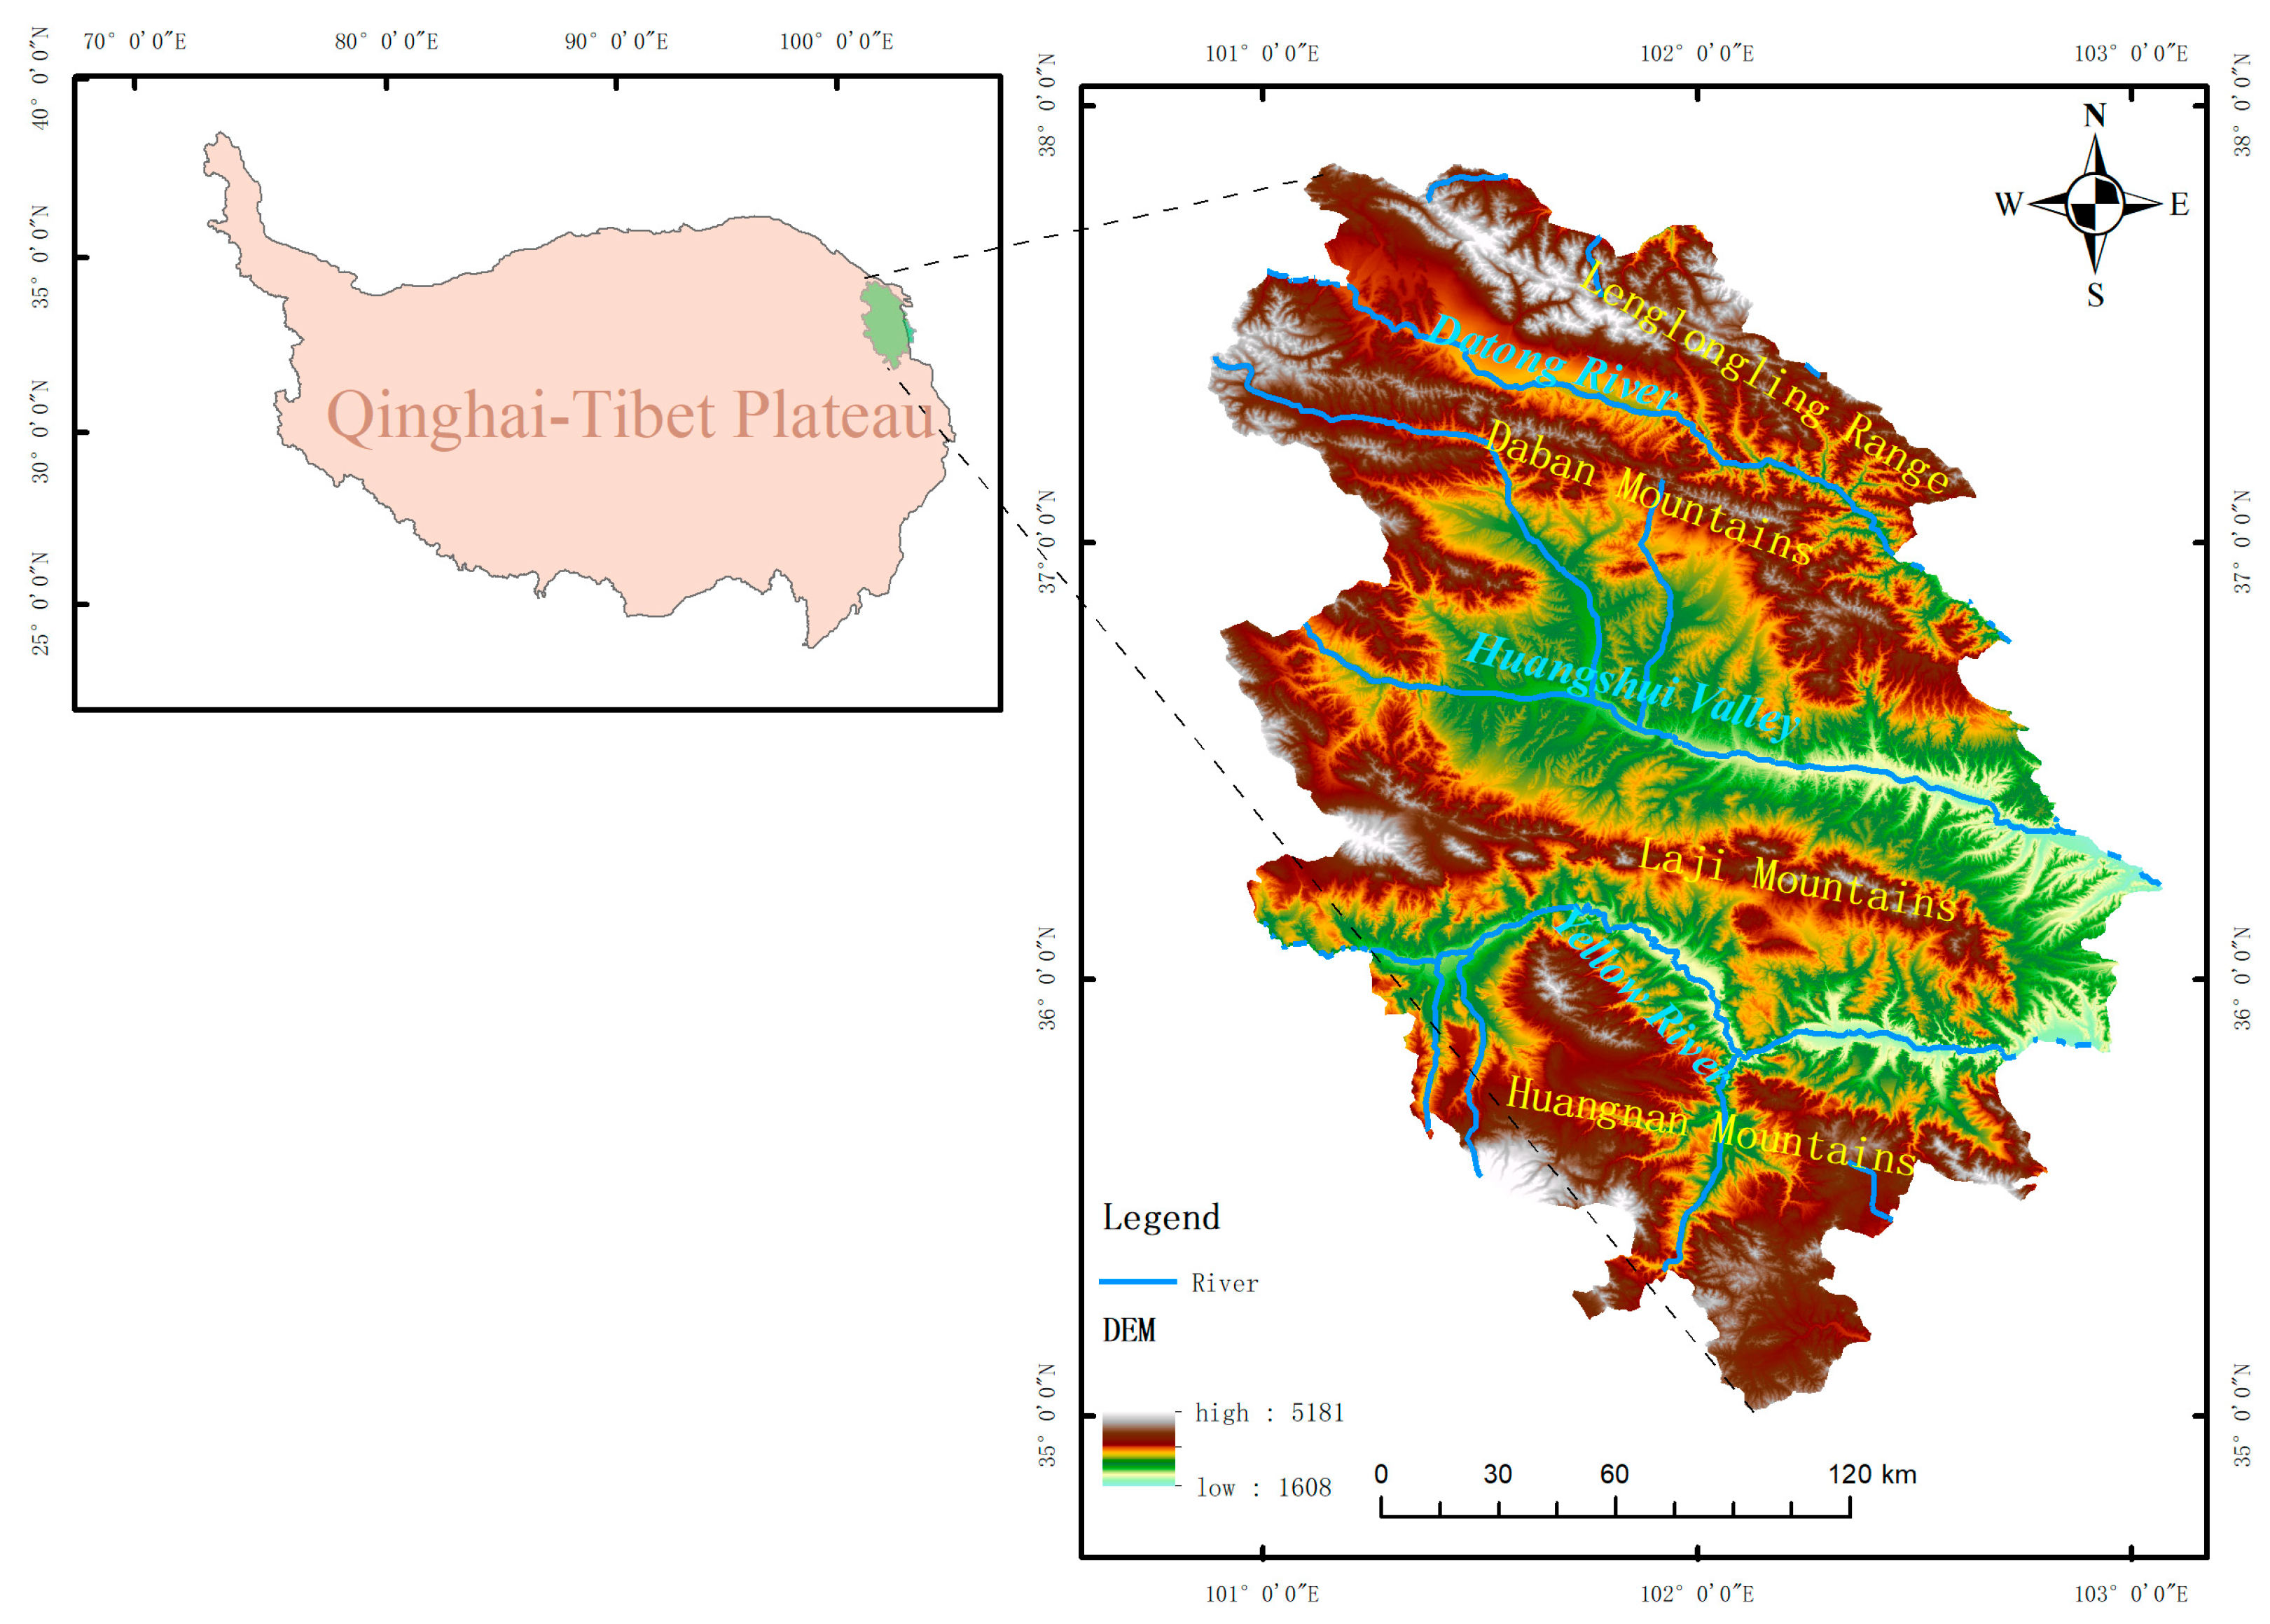
The Hehuang Valley, located on the northeastern margin of the Tibetan Plateau (TP) and the eastern section of the Qilian Mountains, serves as a pivotal transition zone between the Loess Plateau and the TP. This high-altitude alluvial valley, formed by the Yellow River and its primary tributary, the Huangshui River, possesses a distinctive geomorphological structure described as "four mountain ranges flanking three valleys." From north to south, these features include the Lenglongling Range, the Datong River Valley, the Daban Mountains, the Huangshui Valley, the Laji Mountains, the Yellow River Valley, and the Huangnan Mountains[16]. The elevation of the valley floor ranges from approximately 2,200 to 2,800 m, whereas the surrounding northern and southern mountains frequently exceed 3,000 m, with peaks reaching above 5,000 m. This substantial topographic relief creates complex dynamical conditions for regional atmospheric circulation and land-surface processes. The regional climate is classified as a plateau-temperate continental climate, characterized by low mean annual temperatures (typically3–8°C) and pronounced diurnal and seasonal thermal fluctuations. Mean annual precipitation is relatively modest and spatially heterogeneous, ranging from 300 to 500 mm at the valley floor [17]. It exhibits a distinct increasing gradient from northwest to southeast and from upstream to downstream, reflecting the integrated control of orographic effects and moisture transport. Precipitation is highly seasonal, predominantly concentrated in the summer (May–September); under the coupled influence of the East Asian Summer Monsoon (EASM) and the mid-latitude Westerlies, summer rainfall accounts for a significant portion of the annual total [18]. In the context of global warming, the intensification of extreme precipitation events has been observed across the traditionally arid regions of Northwest China [19]. When acting upon the widely distributed unconsolidated Tertiary and Quaternary sediments, these extreme events frequently trigger geological hazards such as landslides and debris flows, posing severe threats to the region [20,21,22,23].
Figure 1.
Overview of the study area(The base map was generated using Shuttle Radar Topography Mission (SRTM) data with a 30m resolution, sourced from https://earthexplorer.usgs.gov.).
Figure 1.
Overview of the study area(The base map was generated using Shuttle Radar Topography Mission (SRTM) data with a 30m resolution, sourced from https://earthexplorer.usgs.gov.).
3. Data and Methods
3.1. Data Sources and Preprocessing
This study utilized hourly precipitation data from 15 national reference meteorological stations within the study area for the warm season (May–September) spanning 2015 to 2024. To ensure the completeness and continuity of the hourly time series, missing values in the observation sequences were filled using linear interpolation.
Identification of Precipitation Events: Precipitation events were identified based on a 1 mm/h intensity threshold. An event is defined as starting when hourly precipitation reaches or exceeds 1 mm and terminating after six consecutive hours of no precipitation [24]. Based on these event-based hourly sequences, key characteristic variables, including total precipitation amount and average precipitation intensity, were calculated for each event.
Definition of Extreme Precipitation: Extreme precipitation events (EPEs) were defined using the quantile threshold method. Specifically, all precipitation events at each station were ranked by their total precipitation amount; the top 5% of events were classified as extreme, while the remaining 95% were categorized as non-extreme events. This site-specific approach accounts for the spatial heterogeneity of climatological backgrounds and avoids the biases inherent in applying a universal absolute threshold, making it more suitable for a comparative climatological analysis of regional-scale extremes [25,26].
Inter-event Maximum Temperature(Tmax_inter): The inter-event maximum temperature is defined as the maximum temperature recorded during the dry interval between two successive precipitation events.
3.2. Research Methodology
3.2.1. Trend Analysis
To reveal the temporal variation characteristics and trend significance of precipitation amount and intensity in the study area, a combination of Theil-Sen slope estimation and the Mann-Kendall (MK) trend test was employed [27,28]. The Theil-Sen estimator is a non-parametric statistical method characterized by high computational efficiency and low sensitivity to measurement errors and outliers; thus, it is widely applied in the trend analysis of long-term time series [29]. The Mann-Kendall test is a rank-based non-parametric approach that does not require the assumption of a specific data distribution and exhibits strong robustness against outliers, making it highly suitable for evaluating trend significance in hydro-meteorological time series [30]. By calculating the MK statistic Z and its corresponding significance level (P-value), the statistical reliability of trends in precipitation amount and intensity was determined. The integration of these two methods enables a quantitative description of the magnitude of change via Sen's slope while mitigating the interference of data distribution characteristics on significance detection through the MK test, thereby enhancing the scientific rigor and reliability of the findings[31].
3.2.2. Cluster Analysis
To scientifically classify precipitation types and reveal the internal structural characteristics of various precipitation processes, this study employs K-means clustering analysis[32]. K-means clustering is a widely used partition-based algorithm designed to segment a dataset into a predefined number of clusters. The core principle of the algorithm involves an iterative process to identify a partitioning scheme for the clusters that minimizes a specified cost function [33]. Compared to subjective classification methods, clustering analysis enables the automatic grouping of precipitation events based on the inherent objective features of the data, thereby effectively mitigating subjective biases[34]. This approach provides a robust classificatory foundation for subsequent investigations into the spatiotemporal evolution and formation mechanisms of distinct precipitation types.
3.2.3. Spatial Analysis
To clearly characterize the spatial heterogeneity and overall patterns of precipitation in the study area, this study employs the Inverse Distance Weighting (IDW) interpolation method. This approach enables the construction of region-scale continuous spatial distribution fields based on discrete point observations [35].
The IDW method is rooted in Tobler’s First Law of Geography, which posits that "near things are more related than distant things"[36]. It calculates values at ungauged locations by taking a weighted average of the data from surrounding observation stations, where the weights are inversely proportional to the distance between the observation and interpolation points. This method is characterized by its straightforward logic and easily adjustable parameters, making it particularly suitable for precipitation interpolation in regions significantly influenced by complex terrain and local moisture conditions. The spatial distribution maps generated through IDW provide an intuitive representation of spatial gradients and local anomalies, offering critical support for analyzing the formation mechanisms and regional variations of precipitation patterns[37].
3.2.4. Logistic Regression Analysis
To deeply explore the nonlinear modulation mechanism of Tmax_inter on the occurrence of extreme precipitation events (EPEs), this study introduces a binary logistic regression model for quantitative analysis. Given that "extreme precipitation" and "non-extreme precipitation" are binary categorical variables, conventional linear regression is inadequate for directly characterizing the relationship between their occurrence probability and temperature. The logistic regression model establishes a nonlinear mapping between the independent variable and the dependent variable (the probability of EPE occurrence) [38]. The dependent variable Y is defined to represent the categorical property of a precipitation event as follows:
The Tmax_inter is selected as the primary explanatory variable (independent variable X). Letting P denote the probability of an extreme precipitation event occurring, defined as P = P (Y = 1/X), the logistic regression model can be expressed as:
In these equations, P/(1-P) represents the odds, defined as the ratio of the probability of an extreme event occurring to the probability of it not occurring. The term is the intercept, while denotes the regression coefficient, which characterizes both the direction and the magnitude of the impact of temperature fluctuations on the odds of extreme precipitation occurrence.
4. Analysis Results
4.1. Increase in Precipitation Intensity
Based on the hourly precipitation observation data from 2015 to 2024 in the Hehuang Valley, a comparative analysis of temporal trends was conducted between the mean states of precipitation events (mean amount, intensity, Tmax_inter, and frequency) and their corresponding extreme states (extreme amount, extreme intensity, extreme Tmax_inter, and extreme frequency) using the Mann-Kendall test and Sen’s slope estimation (Figure 2).The results indicate that over the past decade, precipitation in the Hehuang Valley has exhibited a distinct evolutionary pattern characterized by "intensified intensity, fluctuating declines in frequency, and a significant warming of the thermodynamic background." Notably, the rate of change for extreme events is substantially higher than that of the mean states, suggesting a pronounced shift toward more extreme precipitation regimes in the region.
Regarding precipitation amount (Figure 2a), the mean amount for all precipitation events exhibited an increasing tendency (Z = 1.61, p = 0.11). Although it did not pass the 0.05 significance level test, the proximity to the 0.1 confidence level suggests a potential upward trend in precipitation amount. For extreme events, the Sen’s slope of the mean precipitation amount reached 1.35 mm·a⁻¹(Z=1.43,p=0.152). The magnitude of this increase was notably larger than that for all events, indicating a stronger tendency toward increasing amounts in individual extreme events, despite also not reaching the 0.05 significance level. In terms of precipitation intensity (Figure 2b), the mean intensity for all events showed a marginally significant increasing trend (Z = 1.61, p = 0.11), consistent with the trend in precipitation amount. In contrast, the MK test for extreme precipitation intensity yielded a Z-value of 0.18 (p = 0.86). This very high p-value indicates that extreme precipitation intensity did not follow a simple monotonic linear trend at the decadal scale; instead, it was characterized by pronounced interannual oscillations.
The Tmax_inter exhibits the most pronounced upward trend among the investigated variables (Figure 2c). Although the trends for both all events and extreme events did not pass the 0.05 significance level, the proximity to this threshold (Z = 1.79, p = 0.07) strongly suggests an increasing tendency in the Tmax_inter. Notably, the warming rate preceding extreme precipitation events reaches as high as 0.44 ℃/a, which is substantially higher than the 0.18 ℃/a observed for all events. This discrepancy in warming rates indicates that extreme precipitation events are increasingly fostered within environments characterized by more intense surface heating. Such dramatic antecedent warming not only accelerates surface evapotranspiration and enhances near-surface atmospheric instability but also provides a more robust energy foundation for the subsequent eruption of extreme precipitation. The heightened sensitivity of extreme precipitation to preceding warming further underscores the critical role of thermodynamic forcing in the intensification of precipitation extremes in the Hehuang Valley.
The frequency of precipitation events exhibited a slight downward trend (Figure 2d). The Sen’s slopes for the frequency of all precipitation events and extreme precipitation events were -2.25 events·a⁻¹ and -0.14 events·a⁻¹, respectively, with both yielding negative Mann-Kendall Z-statistics. Although these trends show limited statistical significance (p > 0.05), the downward tendency, when coupled with the previously noted increases in precipitation amount and intensity, reflects a fundamental adjustment in the regional precipitation structure. Specifically, the precipitation regime is gradually shifting from a "high-frequency, low-intensity" pattern toward a "low-frequency, high-intensity, and high-volume" mode. This phenomenon is consonant with thermodynamic theoretical expectations: as atmospheric moisture-holding capacity increases, the convection initiation threshold is elevated, which suppresses the occurrence of weak precipitation. However, once precipitation is triggered, it is more likely to develop into deep moist convection. This shift also reveals that under the context of global warming, the intensification of the hydrological cycle is primarily manifested through the concentrated release of moisture via extreme events, a process characterized by efficient moisture scavenging. Consequently, this leads to a significant increase in the disaster risk associated with individual extreme precipitation events [39](Li et al., 2025).
4.2. Changes in Precipitation Types
Based on the K-means clustering method, precipitation processes were categorized into three types: front-peaked, back-peaked, and uniform. The interannual evolution of both the absolute frequency and relative proportion of each type was subsequently analyzed using the Mann-Kendall trend test and Sen’s slope estimation (Figure 3).
In terms of occurrence frequency, uniform-type precipitation (Figure 3a) remains the dominant mode in the Hehuang Valley, with its annual frequency far exceeding that of the other two categories. However, its absolute count exhibits a downward inclination (Sen’s slope = -6.00 events·a-1, Z = -1.34, p = 0.15). Although this does not pass the 0.05 significance level, it indicates a clear decreasing trend in uniform precipitation events. The proportion of uniform-type events showed a Sen’s slope of -1.23%·a-1 with an MK statistic of Z = -1.79 (p = 0.07), which approaches the threshold of statistical significance. These results suggest that the relative contribution of precipitation events characterized by high persistence and gentle intensity profiles is declining annually. The contraction of this "steady-state" precipitation proportion implies that the overall stability of regional precipitation processes is weakening.
The absolute frequency of front-peaked precipitation events (Figure 3b) exhibited a non-significant, fluctuating upward trend (Z = 0.36, p = 0.73), primarily modulated by interannual climate variability. In terms of relative proportion, however, front-peaked events demonstrated an increasing tendency, with a Sen’s slope of 1.02 %·a-1 and an MK test statistic of Z = 1.79 (p = 0.07). This near-significant upward trend indicates that a higher proportion of precipitation events tend to reach their peak intensity during the early stages of the event process. This shift is likely associated with the aforementioned warming of the thermodynamic background; intense surface heating during the warm season facilitates the rapid development of convective systems, leading to precipitation processes characterized by an "early burst and high intensity."
Among the three precipitation patterns, the trend for back-peaked precipitation events (Figure 3c) is the most statistically robust. Although they exhibit the lowest absolute frequency (averaging approximately 10–20 events per year), their relative proportion shows a statistically significant upward trend, with a Sen’s slope of 0.13%·a-1 and an MK statistic of Z = 2.15 (p = 0.03), successfully passing the 95% confidence level test. The significant increase in the proportion of back-peaked events carries profound physical implications; it suggests that precipitation systems increasingly undergo prolonged periods of energy accumulation or moisture transport, causing the peak intensity to occur during the terminal stage of the event. In the context of the complex terrain of the Hehuang Valley, this phenomenon may be attributed to the delayed development of mountain-valley breeze circulations or orographic cloud systems. The proliferation of back-peaked precipitation not only alters the intra-event distribution of water resources but also increases the complexity of disaster mitigation. Due to the "peak-lag" characteristic, peak rainfall intensity is more likely to coincide with the later stages of an event when soil moisture is nearing saturation, thereby increasing the susceptibility to secondary disasters such as landslides and debris flows.
A comprehensive comparison of the evolution of the three event types (Figure 3) reveals a distinct compensatory shift in the precipitation structure of the Hehuang Valley: the proportion of uniform-type precipitation events is declining, while the proportions of front-peaked and back-peaked events are increasing significantly. This structural reorganization indicates that, against the backdrop of regional climate warming, precipitation events are undergoing a morphological transformation from "gentle and uniform" to "peak-concentrated and non-uniform." Although the change in total precipitation frequency is not statistically significant, the intra-event concentration of rain intensity is intensifying. This extremization of internal temporal distribution serves as a critical signal of a shift in regional precipitation properties. It further elucidates the underlying mechanism of why extreme precipitation intensity can strengthen significantly even when the increase in total precipitation volume remains limited.
4.3. Spatial Heterogeneity of Precipitation Changes
Figure 4a–c illustrate the spatial distribution of Sen’s slopes for the mean precipitation amount, mean precipitation intensity, and mean Tmax_inter in the Hehuang Valley from 2015 to 2024. These patterns reflect a significant spatial coupling between precipitation temperature variations and the regional topographic configuration, which is characterized by "high-altitude northern and southern peripheries and a low-lying central valley floor."
Regarding the trends in mean precipitation amount and intensity (Figure 4a–b), the Sen’s slopes generally range from -0.05 to 0.57 mm·a-1, exhibiting a characteristic spatial pattern of "central valley intensification and surrounding mountain reduction." This configuration is closely tied to topographic features and urban distribution. The central Hehuang Valley, specifically along the Huangyuan–Xining–Huangzhong–Ping’an–Ledu and Guide–Jianzha–Xunhua axes, represents a series of typical valley-basin urban clusters characterized by relatively open terrain and high urbanization. The orientation of the Hehuang Valley aligns with major moisture transport pathways, facilitating the forced lifting of warm, moist air as it flows along the valley. This alignment promotes the initiation and rapid development of extreme convection. When large-scale moisture conditions improve and local instability increases, the amplification effect of orographic lifting on extreme precipitation becomes particularly pronounced, as evidenced by Sen’s slopes for extreme precipitation that far exceed the regional average. Furthermore, many high-value slope bands are situated at the intersections of main river valleys and tributary mountain valleys, particularly in valley-mouth regions characterized by steep DEM gradients and significant topographic convergence. These locations favor the convergence of low-level wind fields and moisture, acting as "locked" positions for local vertical motion and precipitation development. Consequently, the spatial distribution of extreme precipitation presents distinct patchy and belt-like high-value zones that are highly consistent with topographic relief and valley morphology, forming typical "topography-sensitive units." Additionally, urban expansion along the valleys in areas such as Xining and Ping’an has altered the land-surface energy budget and boundary-layer structure. The urban heat island (UHI) effect enhances local instability and increases the probability of extreme convection, while increased surface roughness facilitates turbulent exchange, which, when coupled with moisture transport, induces local precipitation. Regarding the mean inter-event temperature, an upward trend is observed across the entire region, with slopes tending to be higher in high-altitude mountainous areas and plateau platforms. Reduced snow and ice cover at these elevations lowers the surface albedo and enhances net radiation absorption. This process leads to elevation-dependent warming (EDW), where warming rates at high-DEM elevations significantly exceed those at low elevations, resulting in the high-value clustering shown in Figure 4c. Conversely, the lower warming slopes in Xining, Huangzhong, and Huangyuan may be attributed to increased precipitation, which exerts a cooling effect that mitigates the warming trend.
The Sen’s slopes for extreme precipitation amount range approximately from -0.45 to 3.47 mm·a-1, a numerical span significantly larger than that of the mean precipitation amount. This suggests that extreme events exhibit a more robust and sensitive response to changing climatic conditions. Spatially, the high-value clusters of positive trends are concentrated in high-altitude mountainous regions and the mountain-valley transition zones, with moderate-to-high value patches also appearing at several valley confluences. This highlights the marked increase in extreme precipitation within these topography-sensitive areas. In contrast, the central valley floor and portions of the downstream regions are dominated by moderate positive values or trends near zero, with only isolated areas exhibiting weak negative trends. Overall, the intensification of extreme precipitation amount is most prominent in high-altitude areas characterized by significant orographic lifting. The Sen’s slopes for extreme precipitation intensity range from -0.25 to 4.00 ·h-1·a-1, with positive values far outweighing negative ones. While most regions exhibit an upward trend, the magnitude of the Sen’s slopes remains relatively low across much of the study area. However, the most rapid intensification of extreme precipitation intensity is observed in the Huzhu–Datong–Xining region. These high-value zones align closely with the forced lifting zones on the southern slopes of the Qilian Mountains, the moisture convergence zones at the terminus of water vapor transport in the Hehuang Valley, and areas where meso and micro-scale systems are active within the complex mountain-valley terrain. Under a warming climate, the increase in atmospheric moisture-holding capacity allows deep convective processes in topography-sensitive areas to access additional moisture supply and intensify rapidly. Consequently, these regions have become "hotspots" for the most significant enhancement of extreme precipitation intensity. This underscores a typical "topography-dominated intensification" characteristic of extreme precipitation in the Hehuang Valley, where the amplification effect of mountain lifting and moisture convergence on the "extreme tail" of the precipitation distribution is particularly salient. The Sen’s slopes for the Tmax_inter associated with extreme precipitation range from 0.03 to 0.77 ℃·a-1. These values are consistently positive, indicating a uniform warming trend across the Hehuang Valley during the dry intervals preceding and following extreme events. Notably, the warming magnitude is generally higher than that observed for all precipitation events (Figure 4c). Spatially, the highest warming rates are distributed across high-altitude mountains and plateau platforms, whereas warming is comparatively subdued in the central urbanized valleys. This discrepancy may be attributed to large-scale ecological restoration projects,such as the "Grain for Green" program and mountain closure for afforestation implemented since 2000. These initiatives have significantly increased regional vegetation cover and modulated soil hydrological processes and the land-surface energy balance, thereby mitigating the increase in Tmax_inter within the valley floor [40].
4.4. Nonlinear Response of Precipitation to Temperature
The preceding analysis demonstrates that extreme precipitation in the Hehuang Valley is characterized by intensification and a structural shift toward non-uniform patterns. According to the principles of atmospheric thermodynamics, surface heating serves as a critical precursory factor driving the development of deep moist convection (DMC). To verify this mechanism, this study adopts the Tmax_inter as a thermodynamic indicator. Violin plots (Figure 5) are utilized to characterize the morphological evolution of its probability distribution, and a binary logistic regression model (Figure 6) is integrated to quantify the nonlinear modulation of Tmax_inter on the occurrence of extreme precipitation.
Figure 5 employs violin plots to illustrate the density distribution characteristics of extreme precipitation probability across different intervals of Tmax_inter , The figure intuitively demonstrates that antecedent Tmax_inter exerts a significant modulatory effect on the occurrence probability of extremes. When Tmax_inter is low (< 20℃), the violin shapes are extremely compressed and closely aligned with the zero baseline, with the probability distribution highly concentrated in the low-value range. This indicates that under insufficient thermal conditions, atmospheric stratification remains relatively stable, hindering the development of the intense convection required for extreme precipitation. As Tmax_inter crosses the 20℃ threshold, the morphology of the probability distribution undergoes a marked transformation. The violin plots stretch significantly in the vertical direction, and the center of gravity of the distribution gradually shifts upward. This vertical elongation represents a substantial increase in the dispersion of the probability distribution, implying that the accumulating thermal energy begins to erode atmospheric stability. Consequently, both the likelihood and the uncertainty of extreme precipitation occurrence increase simultaneously. In the high-temperature intervals exceeding 30℃, the distribution morphology exhibits a prominent "long-tail" characteristic, with the bulk of the probability density shifting toward the positive/higher-value range. This suggests that under high thermal backgrounds, extreme precipitation events transition from occasional stochastic occurrences to high-frequency response events characterized by a high degree of physical determinism.
To overcome the discrete nature of bin-based statistics, a binary logistic regression model was constructed (Figure 6) to quantify the continuous response function of extreme precipitation probability relative to the Tmax_inter. The fitted curve exhibits a characteristic sigmoid growth pattern, which effectively smooths the stochastic fluctuations inherent in the observational data.
The regression results indicate that the coefficient for the Tmax_inter. is positive and statistically significant (p < 0.001). Regarding the probability evolution trend, the curve remains relatively flat in the low-temperature range. However, as the temperature exceeds 20℃, the slope of the curve increases markedly, suggesting that the sensitivity of extreme precipitation to temperature rise reaches its peak at this stage. Based on the Odds Ratio (OR) of approximately 1.134 calculated by the model, every 1℃ increase in Tmax_inter. ceteris paribus results in a 13.4% increase in the odds of an extreme precipitation event occurring.
At the rightmost end of Figure 6 (>35℃), the observed probability points exhibit a slight downturn, deviating from the ascending trajectory of the fitted logistic regression curve. In this plot, the bubble size represents the sample size. This phenomenon is primarily attributable to the rarity of extreme heat exceeding 35℃ within the high-altitude context of the Hehuang Valley, which results in a limited sample size for this specific interval. Consequently, the observed decline in probability likely reflects stochastic fluctuations caused by sample scarcity rather than a universal climatic pattern.
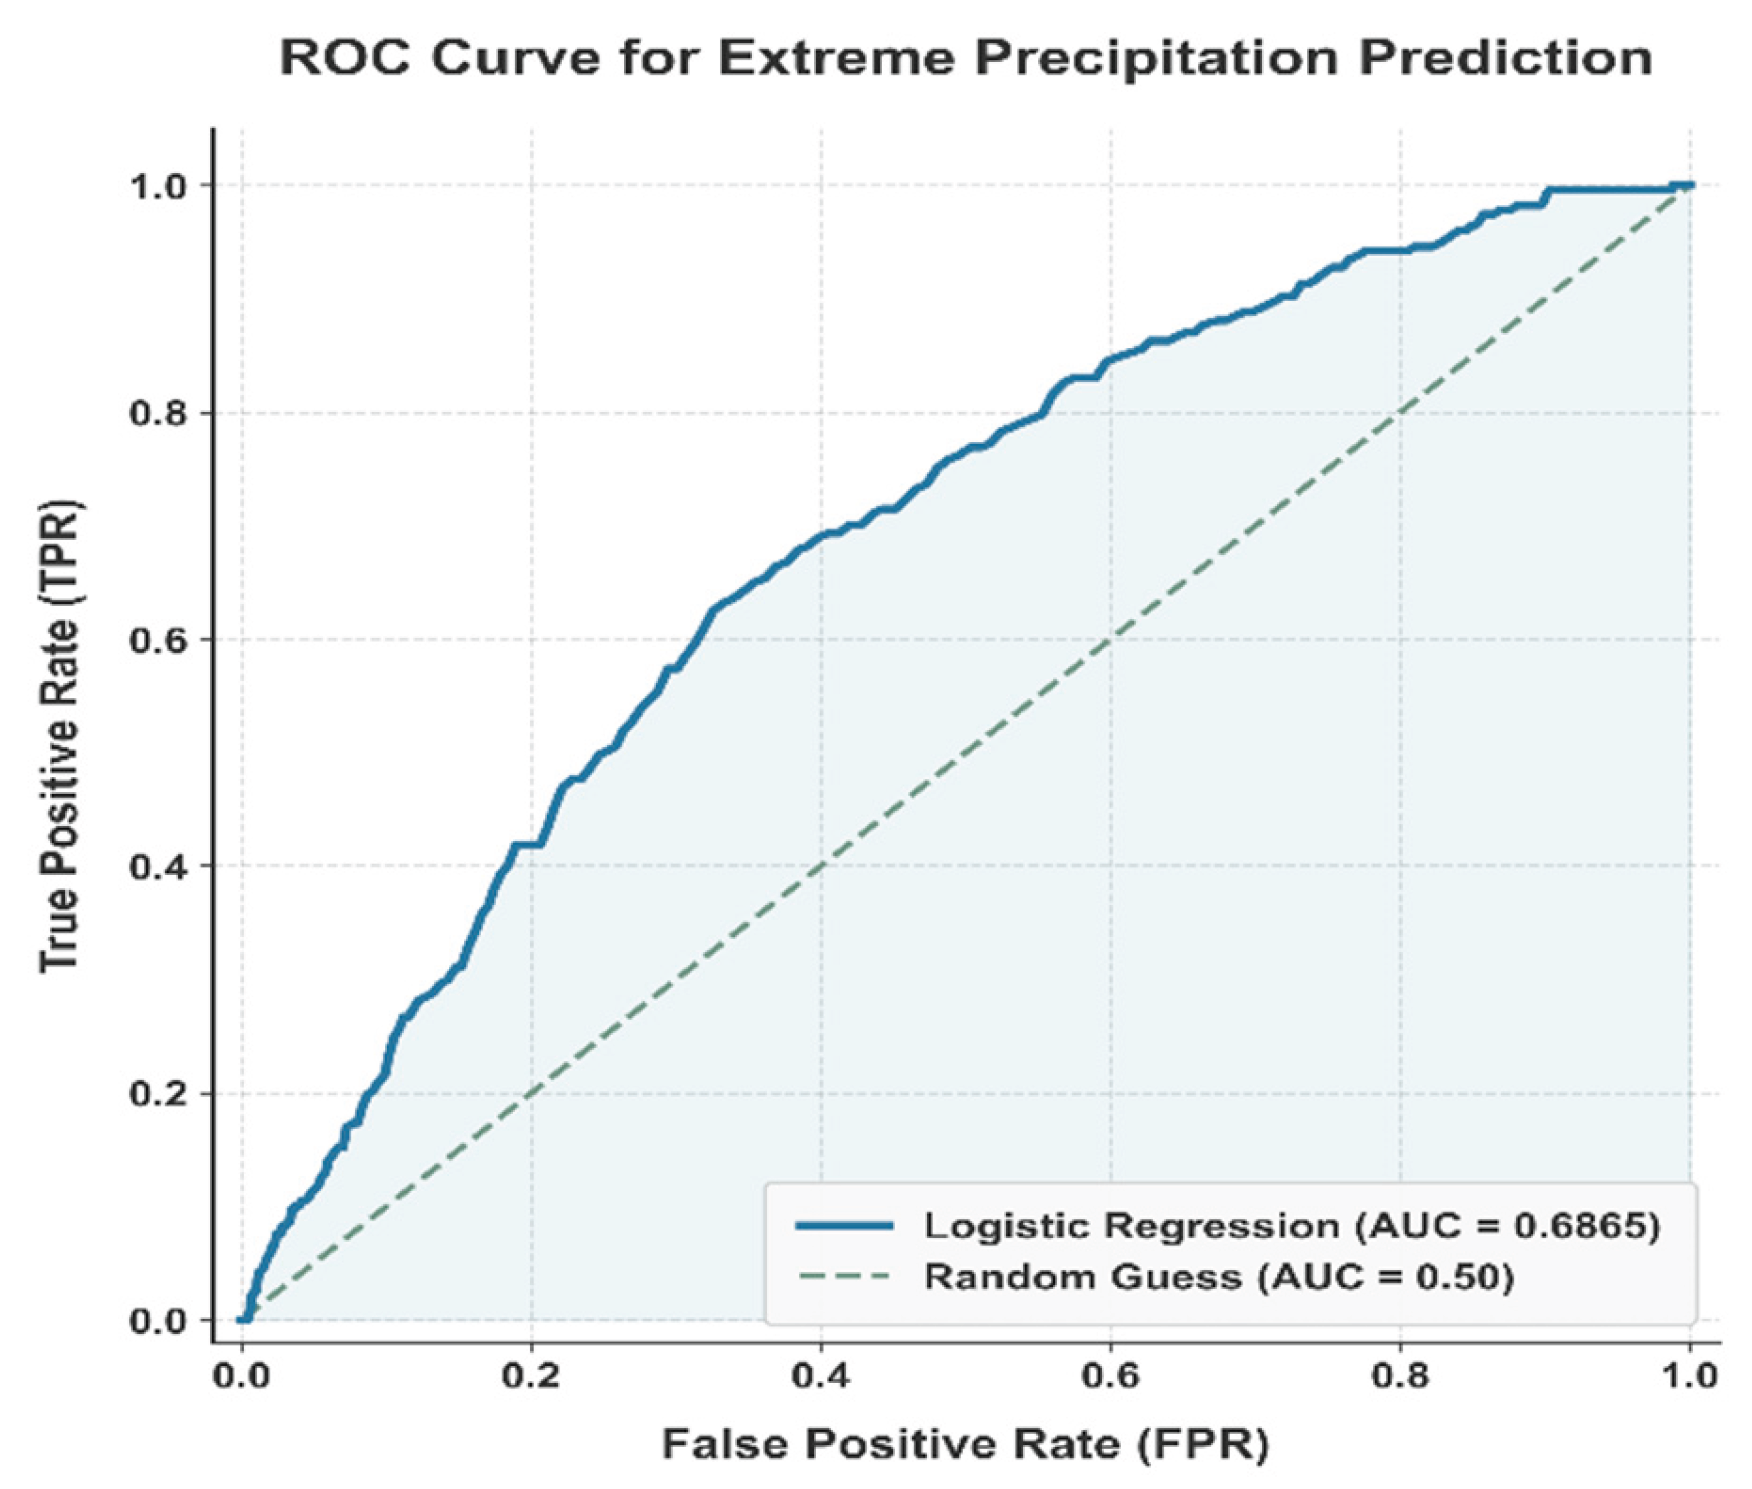
To further objectively evaluate the predictive and discriminative capacity of the inter-event maximum temperature regarding extreme precipitation events, a Receiver Operating Characteristic (ROC) curve was plotted based on the aforementioned binary logistic regression model, and the Area Under the Curve (AUC) was calculated (Figure 7). The results indicate that by relying solely on the inter-event maximum temperature as a single thermal constraint, the model achieved an AUC value of 0.6865. Given that extreme precipitation is a highly complex physical process driven by the interplay of multidimensional factors—such as complex topography, local moisture fluxes, and atmospheric dynamic lifting—an AUC value approaching 0.7 for a single thermodynamic variable robustly demonstrates that the inter-event maximum temperature is a core dominant factor for extreme precipitation in the Hehuang Valley. This highlights its strong independent value as an early warning indicator. Furthermore, this evaluation not only statistically reaffirms the critical role of antecedent thermal accumulation in the genesis of regional extreme precipitation, but also provides a solid baseline reference for establishing threshold-based early warning systems in basin flood control operations.
5. Discussion
Our findings demonstrate that extreme precipitation in the Hehuang Valley is non-linearly driven by antecedent thermal forcing and strongly modulated by local topography. Specifically, a 1°C increase in the inter-event maximum temperature raises the odds of an extreme precipitation event by 13.4%, representing a significant regional amplification of the Clausius-Clapeyron relation. This localized thermal accumulation accelerates convective instability, which, when coupled with elevation-dependent warming and moisture convergence in specific valley orientations, turns windward slopes and valley contractions into distinct hotspots for extreme convection. Consequently, global warming does not uniformly intensify rainfall but rather weaponizes these specific topography-sensitive units. Concurrently, a structural shift towards non-uniform, particularly rear-peak precipitation events, critically threatens regional disaster resilience. Because the peak rainfall in these events coincides with near-saturated soil conditions, the triggering thresholds for secondary hazards like shallow landslides and debris flows are drastically lowered. This "peak-lag" characteristic necessitates the urgent recalibration of early warning systems in high-altitude basins.
While this study successfully isolates the thermodynamic constraints of precipitation extremes using a 10-year high-resolution dataset, capturing decadal climatic oscillations remains limited. Furthermore, because precipitation extremes are governed by a complex interplay of both thermodynamic and dynamic processes, future research must integrate atmospheric dynamic diagnostics. Investigating the synergistic driving mechanisms between regional thermal accumulation and large-scale circulation patterns or vertical wind shear will be essential. Coupling these high-resolution meteorological findings with advanced spatial analysis could significantly advance the quantitative assessment of disaster vulnerability and systemic resilience across these critical watersheds.
6. Conclusions
Based on high-resolution meteorological observation data from 2015 to 2024 in the Hehuang Valley, this study systematically analyzed the spatiotemporal differentiation of precipitation processes at the event scale and quantified the nonlinear influence of antecedent thermal conditions on extreme precipitation. The primary conclusions are summarized as follows:
- Evolution of Precipitation Structure and Spatial Differentiation
Over the past decade, the mean intensity of precipitation events in the Hehuang Valley has followed an increasing trend, which is accompanied by a fundamental shift in the intra-event temporal structure of these processes. The frequency and relative proportion of uniform-type precipitation have declined while non-uniform patterns have become more prevalent. Among these patterns, back-peaked events have demonstrated a particularly significant increase in their relative contribution to total rainfall. Spatially, topographic configurations strongly modulate the variations in precipitation and its associated extremes. The most pronounced intensification occurs on the windward slopes of the Qilian Mountains and in valley-mouth regions because of the combined effects of orographic lifting and moisture convergence, which collectively reflect distinct spatial heterogeneity across the region.
- 2.
- Nonlinear Modulation Mechanism of Antecedent Thermal Conditions on Extreme Precipitation
A significant nonlinear positive correlation exists between the maximum temperature during the inter-event period and the probability of extreme precipitation occurrence. Statistical modeling reveals that for every 1°C increase in this maximum temperature, the odds ratio for an extreme precipitation event increases by approximately 13.4%. This result confirms that within the context of regional warming, antecedent thermal conditions exert a pronounced amplification effect on the extremity of subsequent precipitation. This process is primarily driven by the expansion of atmospheric moisture-holding capacity, which is often associated with Clausius-Clapeyron scaling, and the simultaneous intensification of convective instability.
Author Contributions
Conceptualization, T.WL. and L.FG.; methodology, T.WL. and M.WD.; validation, C.Q., L.HM. and Z.J.; formal analysis, T.WL. and L.JJ.; resources, L.FG.; data curation, T.WL. and L.HM.; writing—original draft preparation, T.WL.; writing—review and editing, L.FG., M.WD., Z.Q., C.Q., L.HM., Z.J. and L.JJ.; visualization, T.WL. and Z.J.; supervision, L.FG.; project administration, L.FG.and Z.Q.; funding acquisition, L.FG. and C.Q. All authors have read and agreed to the published version of the manuscript.
Funding
This research was funded by the Key Basic Research Program of Qinghai Province, grant number 2024-ZJ-904-01; and the "Research on the Process and Mechanism of the Impact of Meteorological Disasters on the Ecological Environment" project, grant number 2019YFA0606902. The APC was funded by the "Research on the Process and Mechanism of the Impact of Meteorological Disasters on the Ecological Environment" project, grant number 2019YFA0606902.
Institutional Review Board Statement
Not applicable.
Informed Consent Statement
Not applicable.
Data Availability Statement
The hourly precipitation data presented in this study are not publicly available due to confidentiality restrictions, but can be obtained upon reasonable request by applying to the relevant meteorological departments. The Shuttle Radar Topography Mission (SRTM) DEM data used for spatial analysis are openly available and can be sourced from the USGS EarthExplorer (https://earthexplorer.usgs.gov).
Conflicts of Interest
The authors declare no conflicts of interest. The funders had no role in the design of the study; in the collection, analyses, or interpretation of data; in the writing of the manuscript; or in the decision to publish the results.
Abbreviations
The following abbreviations are used in this manuscript:
| C-C | Clausius-Clapeyron |
| DEM | Digital Elevation Model |
| DMC | Deep Moist Convection |
| EASM | East Asian Summer Monsoon |
| EDW | Elevation-Dependent Warming |
| EPEs | Extreme Precipitation Events |
| Tmax_inter | Inter-event Maximum Temperature |
| TP | Tibetan Plateau |
References
- Moustakis, Y.; Onof, C.; Paschalis, A. Atmospheric convection, dynamics and topography shape the scaling pattern of hourly rainfall extremes with temperature globally. Commun. Earth Environ. 2020, 1, 1234567890. [Google Scholar] [CrossRef]
- Cui, P.; Wang, Y.; Zhang, G.T.; Zhang, Z.T.; Lei, Y.; Wang, H.; et al. Disaster risk prevention under climate change: Current status, challenges, and scientific issues. Adv. Clim. Change Res. 2025, 21, 449–460. [Google Scholar]
- Pall, P.; Allen, M.R.; Stone, D.A. Testing the Clausius–Clapeyron constraint on changes in extreme precipitation under CO2 warming. Clim. Dyn. 2006, 28, 351–363. [Google Scholar] [CrossRef]
- Ombadi, M.; Risser, M.; Rhoades, A.; Varadharajan, C. A warming-induced reduction in snow fraction amplifies rainfall extremes. Nature 2023, 619, 1–6. [Google Scholar] [CrossRef]
- Ding, Z.Y.; Ha, Y.; Zhong, Z. Summer extreme precipitation patterns and synoptic-scale circulation precursors over the Tibetan Plateau. Sci. China Earth Sci. 2024, 54, 1653–1666. [Google Scholar] [CrossRef]
- Feng, B.; Meng, X.H.; Yang, X.Y.; Deng, M.S.; Zhao, L.; Li, Z.G.; Shang, L.Y. Temperature and precipitation assessment and extreme climate events prediction based on the Coupled Model Intercomparison Project Phase 6 over the Qinghai-Xizang Plateau. Plateau Meteorol. 2025, 44, 265–278. [Google Scholar]
- Cao, Y.; You, Q.L.; Cai, Z.Y. Relationship between the summer extreme precipitation in the Qinghai-Tibet Plateau and large-scale circulations from 1961 to 2019. J. Glaciol. Geocryol. 2021, 43, 1290–1300. [Google Scholar]
- Hu, Y.Y.; Zhang, Z.Y.; Jian, M.Q.; You, J.L. Variation of summer meridional water vapor transport over East Asia and its impact on extreme precipitation. J. Trop. Meteorol. 2020, 36, 784–794. [Google Scholar]
- Zhang, W.Q.; Liu, L.; Lun, Y.R.; Li, X.P.; Xu, Z.X. Spatial-temporal variation characteristics of future extreme precipitation and its elevation dependency over the Qinghai-Tibet Plateau. J. Soil Water Conserv. 2023, 37, 149–158. [Google Scholar] [CrossRef]
- Luan, L.; Zhai, P.M. Changes in rainy season precipitation properties over the Qinghai-Tibet Plateau based on multi-source datasets. Adv. Clim. Change Res. 2023, 19, 173–190. [Google Scholar]
- Feng, X.L.; Shen, H.Y.; Li, W.Z.; Wang, Q.C.; Duan, L.J.; Li, H. Spatiotemporal changes for extreme precipitation in wet season over the Qinghai-Tibetan Plateau and the surroundings during 1961–2017. Plateau Meteorol. 2020, 39, 694–705. [Google Scholar]
- Wang, R.J.; Huang, D.Q. Characteristics of compound heatwaves and precipitation extremes of warming season in China from 1979 to 2024. Adv. Earth Sci. 2025, 40, 974–986. [Google Scholar]
- Yang, D.; Song, J.P.; Yang, Z.S.; Chen, D.J. Spatiotemporal dynamics of land use transition on the Qingzang Plateau over the past 120 years. Geogr. Res. 2025, 44, 2080–2102. [Google Scholar]
- Xu, B.; Mao, X.F.; Li, J.M.; Tang, W.J.; Wei, X.Y. Constructing ecological security pattern of the Hehuang Valley based on MSPA and circuit theory. Ecol. Sci. 2025, 44, 161–170. [Google Scholar] [CrossRef]
- Cui, P.; Guo, X.J.; Jiang, T.H.; Zhang, G.T.; Jin, W. Disaster effect induced by Asian Water Tower change and mitigation strategies. Bull. Chin. Acad. Sci. 2019, 34, 1313–1321. [Google Scholar] [CrossRef]
- Zhang, Z.X. Geography of Qinghai; Qinghai People's Publishing House: Xining, China, 2004; pp. 62–210. [Google Scholar]
- Cheng, Y.Z.; Zhao, W.T.; Jiao, J.Y.; Zhang, L.P.; Cao, X.; Chen, T.D.; et al. Soil conservation effect of cropland use change in the Yellow River-Huangshui River Valley over the past 20 years. Sci. Soil Water Conserv. 2023, 21, 55–63. [Google Scholar] [CrossRef]
- Li, H.H.; Huang, Y.M.; Guo, W.; Hou, H.Y.; Fan, M.Y.; Qi, X.P.; et al. Influence of land use and land cover patterns on water quality at different spatio-temporal scales in Hehuang Valley. Environ. Sci. 2022, 43, 4042–4053. [Google Scholar] [CrossRef]
- Wang, G.; Wang, D.; Trenberth, K.; Erfanian, A.; Yu, M.; Bosilovich, M.G.; Parr, D. The peak structure and future changes of the relationships between extreme precipitation and temperature. Nat. Clim. Change 2017, 7, 268–274. [Google Scholar] [CrossRef]
- Zhao, D.L.; Lancuo, Z.M.; Hou, G.L.; Xu, C.J.; Li, W.Z. Assessment of geological disaster susceptibility in the Hehuang Valley of Qinghai Province. J. Geomech. 2021, 27, 83–95. [Google Scholar]
- Liang, Y.; Zhao, J.; Wei, Z.; Lai, Q.; Zhang, Z.; Chen, H.; Dong, J. Deformation characteristics and triggering mechanisms of the Huzhu landslide in Qinghai: an “air–space–ground–subsurface” perspective. Landslides 2025, 22. [Google Scholar] [CrossRef]
- Ma, W.D.; Fei, D.Q.; Liu, F.G.; Zhou, Q.; Chen, Q.; Zhi, Z.M.; et al. Analysis of the causes of the Datong August 17 mountain flood disaster in Qinghai Province based on disaster system theory. Yellow River 2023, 45, 41–46. [Google Scholar]
- Huang, W.B.; Ma, L.; Guo, R.X.; Duan, B.L.; Tan, D.; Li, J.; et al. Comparative analysis of precipitation extremes in two major rainstorm events at the edge of the subtropical high. Plateau Meteorol. 2025. [Google Scholar] [CrossRef]
- Zhang, L.-M.; Lü, Q.; Deng, Z.-H.; Zhang, J. Probabilistic approach to determine rainfall thresholds for rainstorm-induced shallow landslides using long-term local precipitation records. Eng. Geol. 2025, 353, 108139. [Google Scholar] [CrossRef]
- Zhai, P.M.; Pan, X.H. Change in extreme temperature and precipitation over northern China during the second half of the 20th century. Acta Geogr. Sin. 2003, 58, 1–10. [Google Scholar]
- Zhai, P.M.; Wang, C.C.; Li, W. A review on study of change in precipitation extremes. Adv. Clim. Change Res. 2007, 144–148. [Google Scholar]
- Wessels, K.J.; van den Bergh, F.; Scholes, R.J. Limits to detectability of land degradation by trend analysis of vegetation index data. Remote Sens. Environ. 2012, 125, 10–22. [Google Scholar] [CrossRef]
- Che, T.; Hao, X.H.; Dai, L.Y.; Li, H.Y.; Huang, X.D.; Xiao, L. Snow cover variation and its impacts over the Qinghai-Tibet Plateau. Bull. Chin. Acad. Sci. 2019, 34, 1247–1253. [Google Scholar] [CrossRef]
- Zhao, Z.L.; Jiang, X.; Su, Y.; Yin, L.J.; Luo, T.; Zhao, W.Q.; Luo, J.H. Analysis of vegetation changes and influencing factors in Guiyang city over the past 33 years based on the kNDVI and OPGD model. Environ. Sci. 2025, 46, 5839–5849. [Google Scholar] [CrossRef]
- Peng, T.; Fan, Y.Y.; Yi, X.Y. Spatio-temporal characteristics of precipitation concentration in typical basins southwestern Hubei during recent 30 years. Water Sav. Irrig. 2025, 1–16. https://link.cnki.net/urlid/42.1420.TV.20251114.1823.018.
- Ke, J.H.; He, W.T.; Huang, W.Q.; Luo, R.B. Research on the multidimensional evolution patterns of extreme heat events in China. Geogr. Res. 2025, 44, 1755–1769. [Google Scholar]
- Zhang, J.P.; Liu, X.Y. Research and application of K-means algorithm based on cluster analysis. Appl. Res. Comput. 2007, 24, 166–168. [Google Scholar] [CrossRef]
- Sun, M. Research on multi-source data fusion correction and spatiotemporal variation of precipitation in the hinterland of the Qinghai-Tibet Plateau. Ph.D. Thesis, Nanjing University of Information Science and Technology, Nanjing, China, 2024. [Google Scholar] [CrossRef]
- Zhang, L.N.; Jiang, Z.C.; Liu, D.Y.; Liu, X.B. Data processing method of cross-correlation flow based on K-means cluster analysis and multiple linear regression. Pet. Tubul. Goods Instrum. 2024, 10, 52–56, 62. [Google Scholar] [CrossRef]
- Fang, L.D.; Liao, W.H.; Wang, M.Y.; Song, W.Z. Research of the inverse distance weighted interpolation method considering the elevation. Yellow River 2015, 37, 38–41. [Google Scholar] [CrossRef]
- Zhu, A.X. A brief discussion on the three laws of geography. Geogr. Educ. 2023, 3–7. [Google Scholar]
- Zhang, F.T. The space-time characteristics of seasonal precipitation in southwest China and its relationship with large-scale climate indices. Ph.D. Thesis, Nanjing University, Nanjing, China, 2017. [Google Scholar] [CrossRef]
- Zhang, H.R.; Yu, B.; Xu, P.; Zeng, F.X. Analysis of landslide susceptibility in the upper reaches of the Yellow River based on logistic regression model. Yellow River 2025, 47, 35–39. [Google Scholar]
- Li, J.P.; Chen, W.; Zhou, T.J.; Liu, Y.M.; Huang, G.; Liu, X.D.; et al. Progress in atmospheric circulation and climate system dynamics research in China over the past century. Acta Meteorol. Sin. 2025, 83, 582–636. [Google Scholar]
- Li, X.Y.; Xin, Z.B.; Yang, J.L.; Liu, J.H. The spatiotemporal changes and influencing factors of vegetation NDVI in the Hehuang Valley of Qinghai Province from 2000 to 2020. J. Soil Water Conserv. 2024, 38, 79–90, 103. [Google Scholar] [CrossRef]
Figure 2.
Trends in precipitation events.
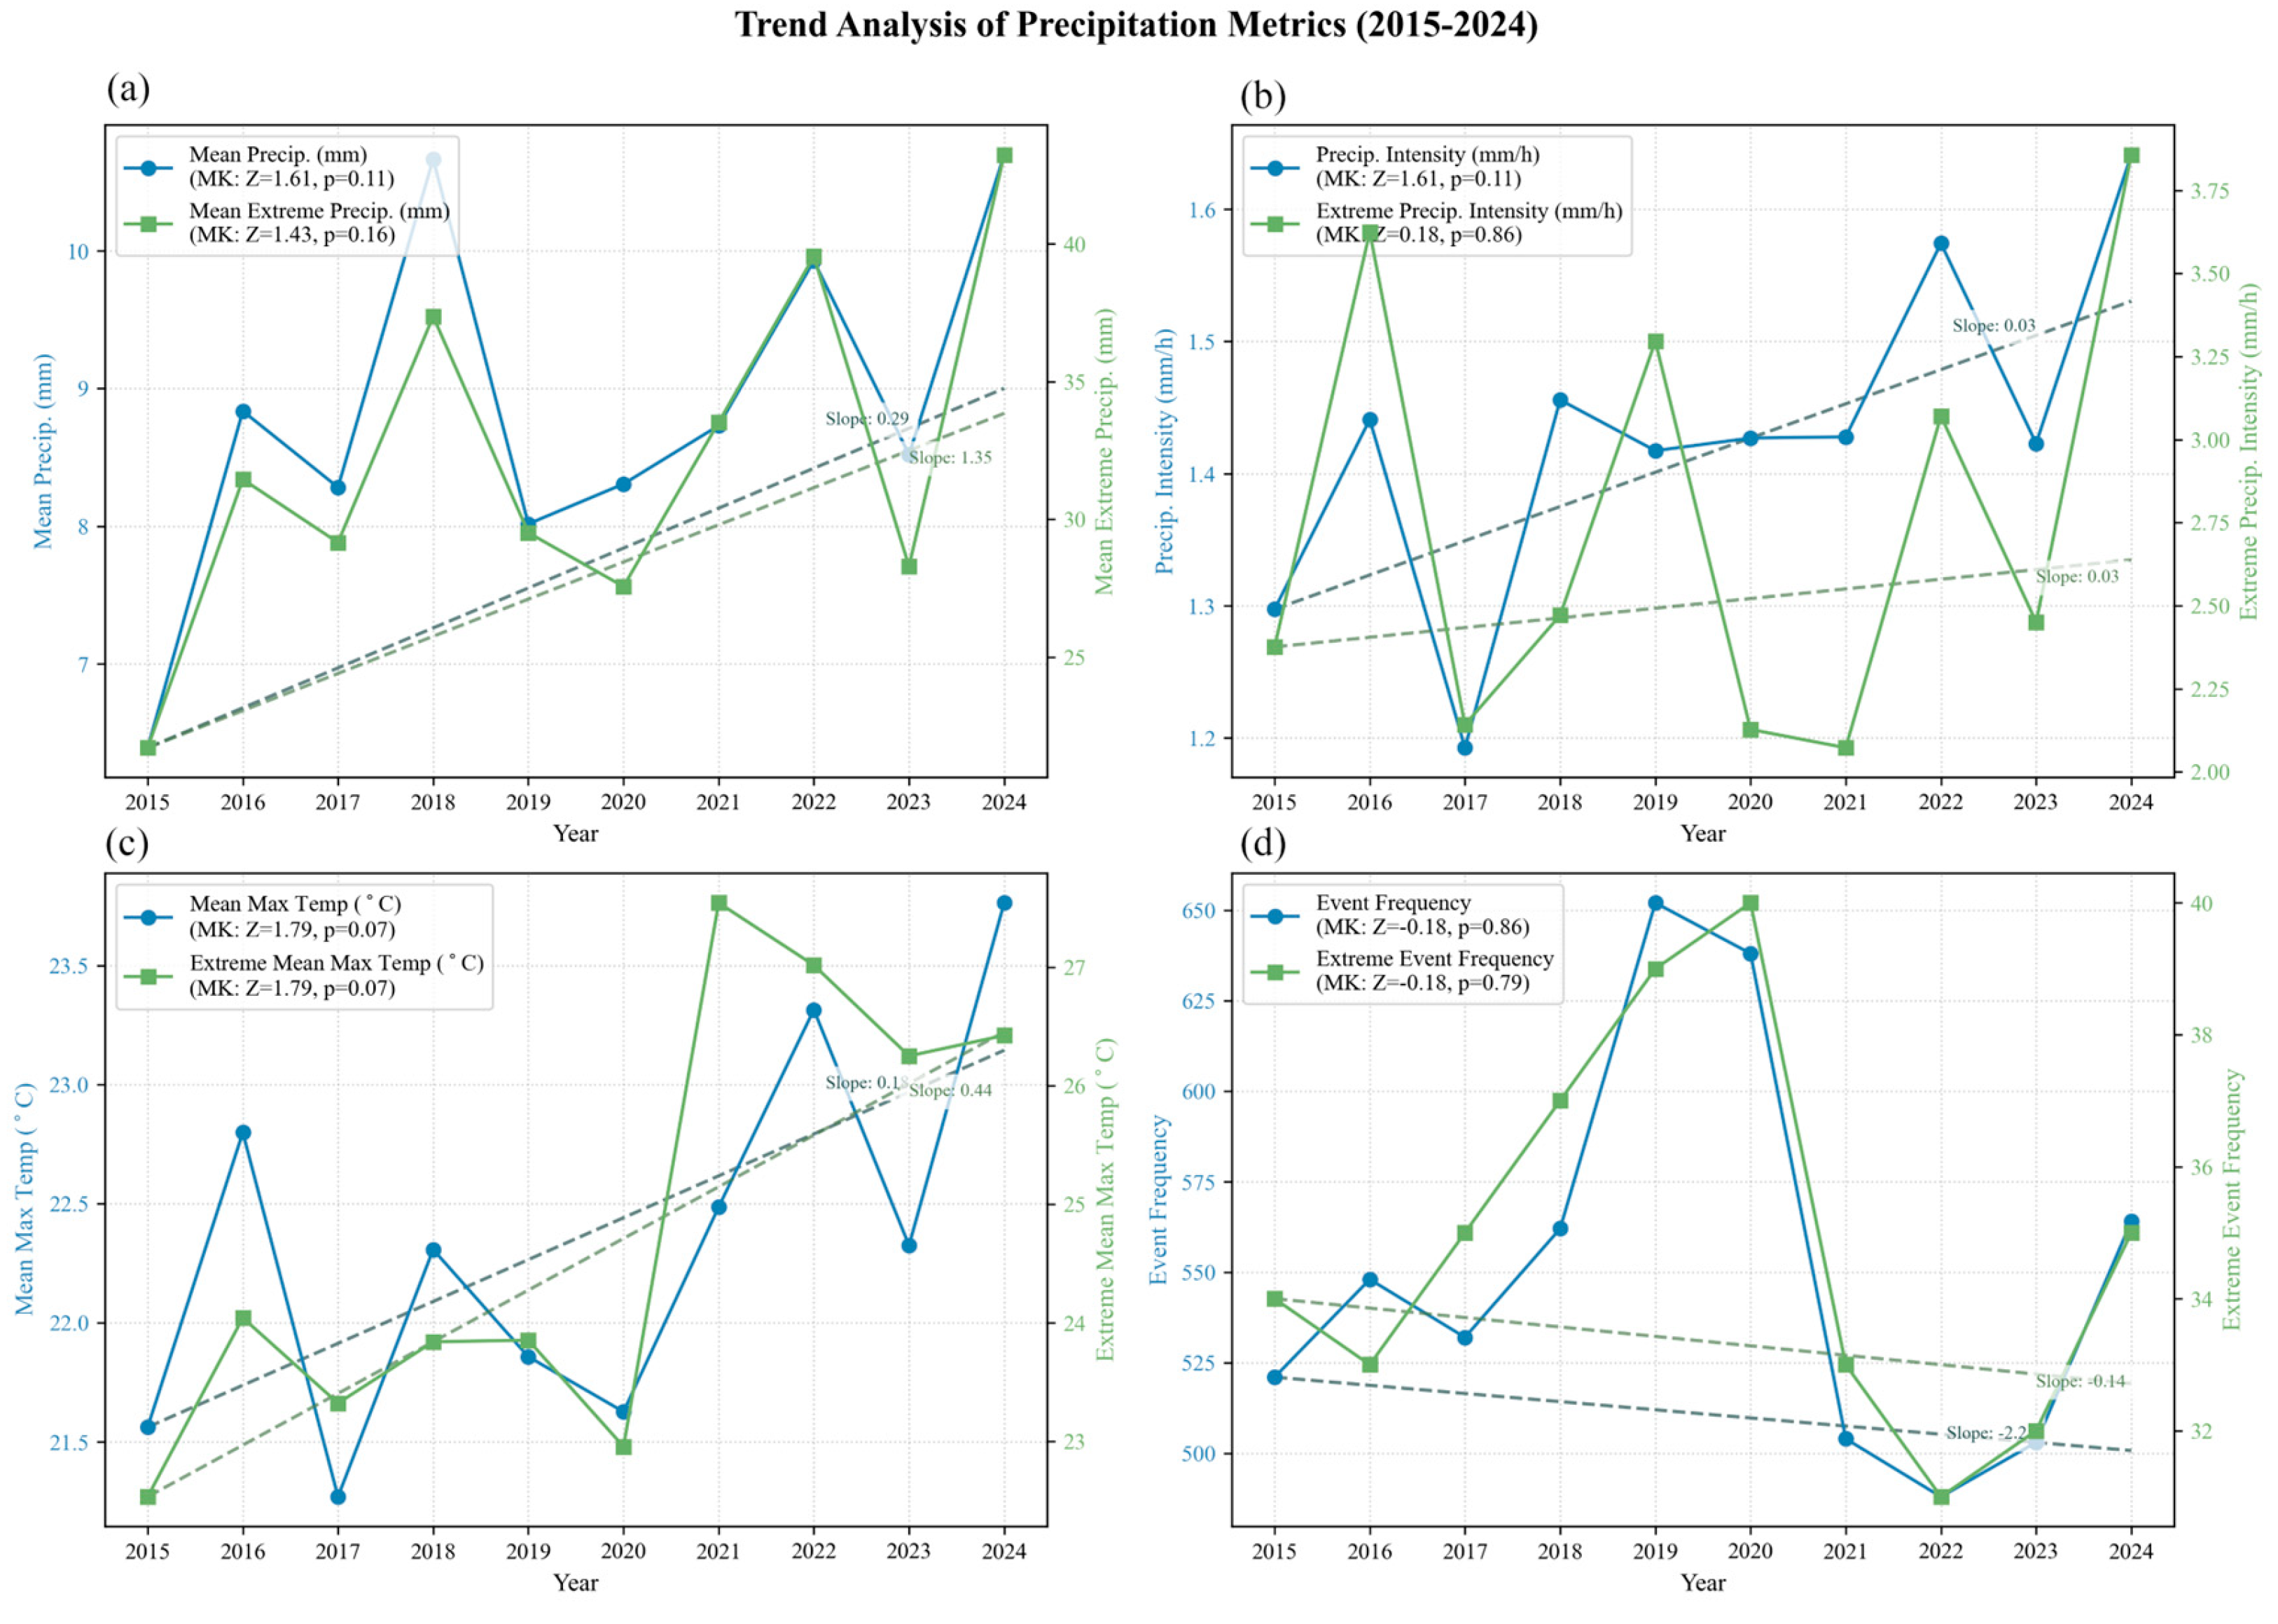
Figure 3.
Trends in the number of precipitation types.
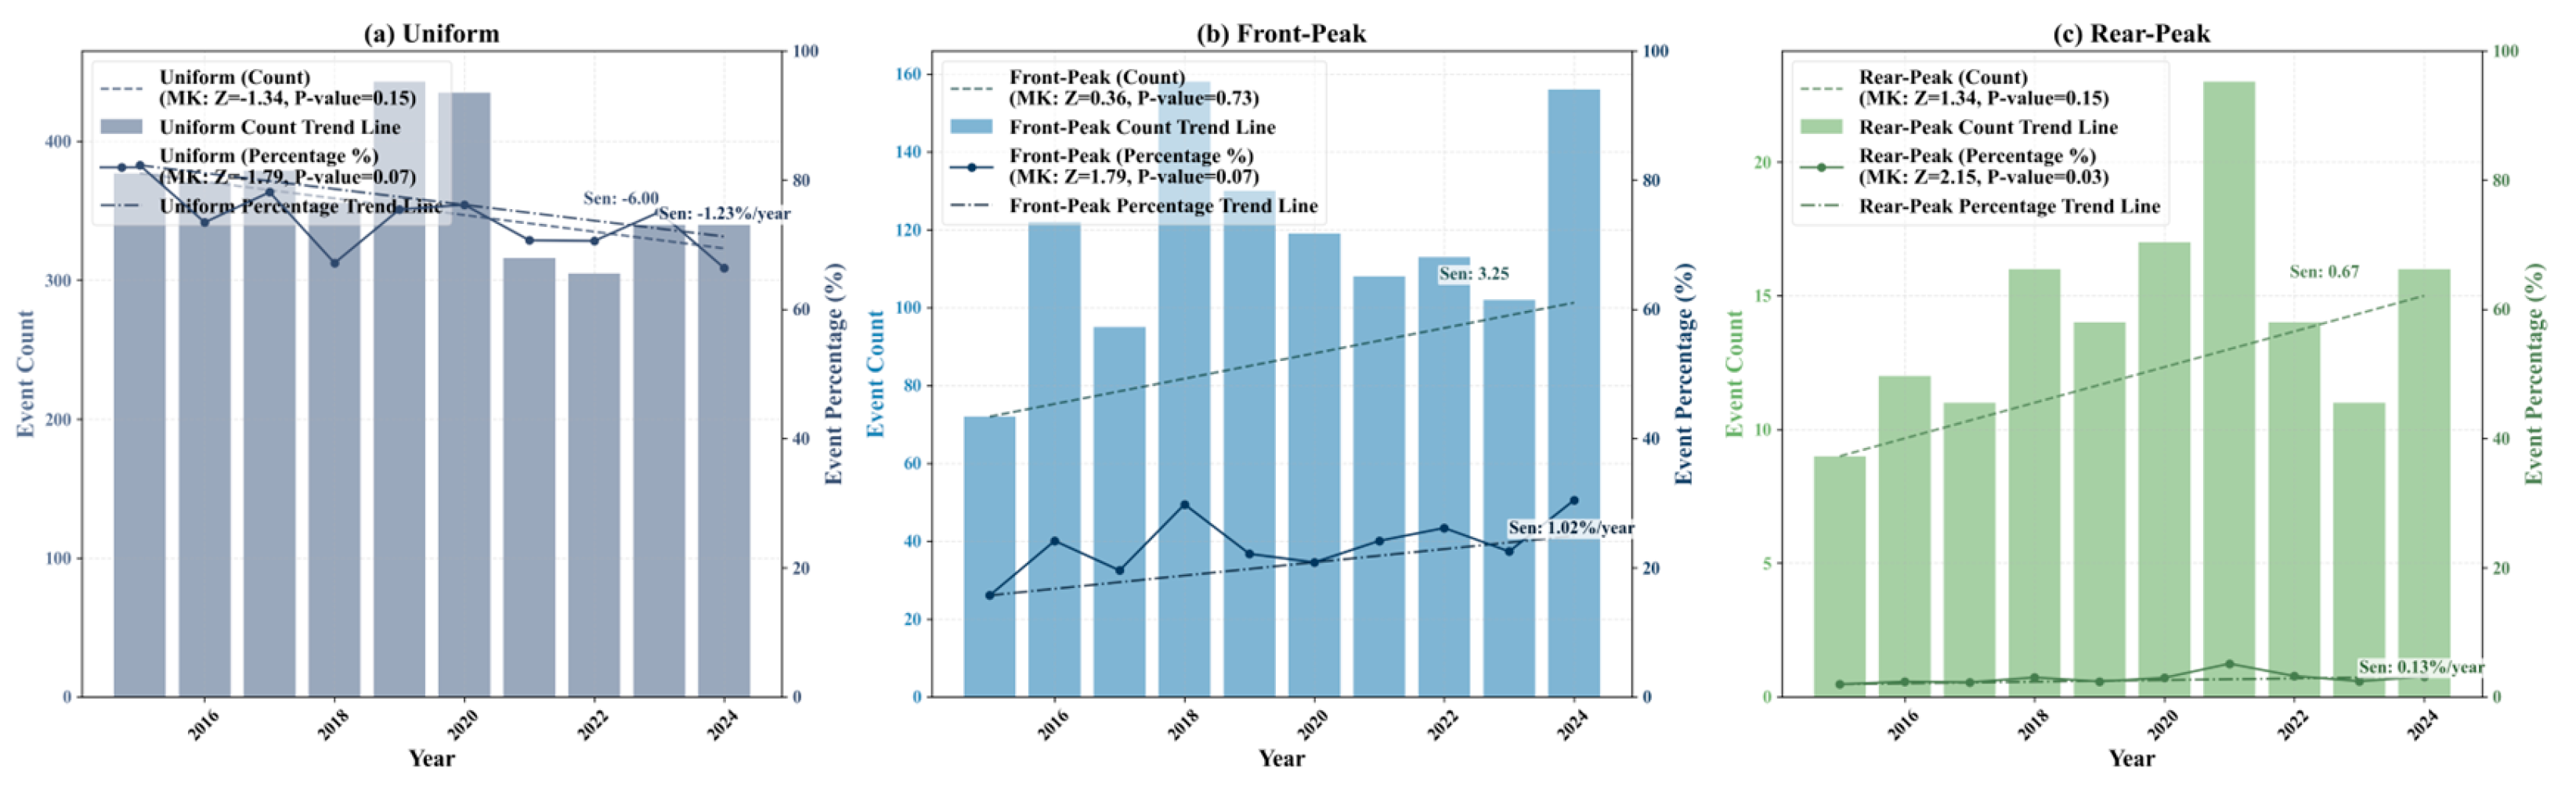
Figure 4.
Spatial variation trends of precipitation.
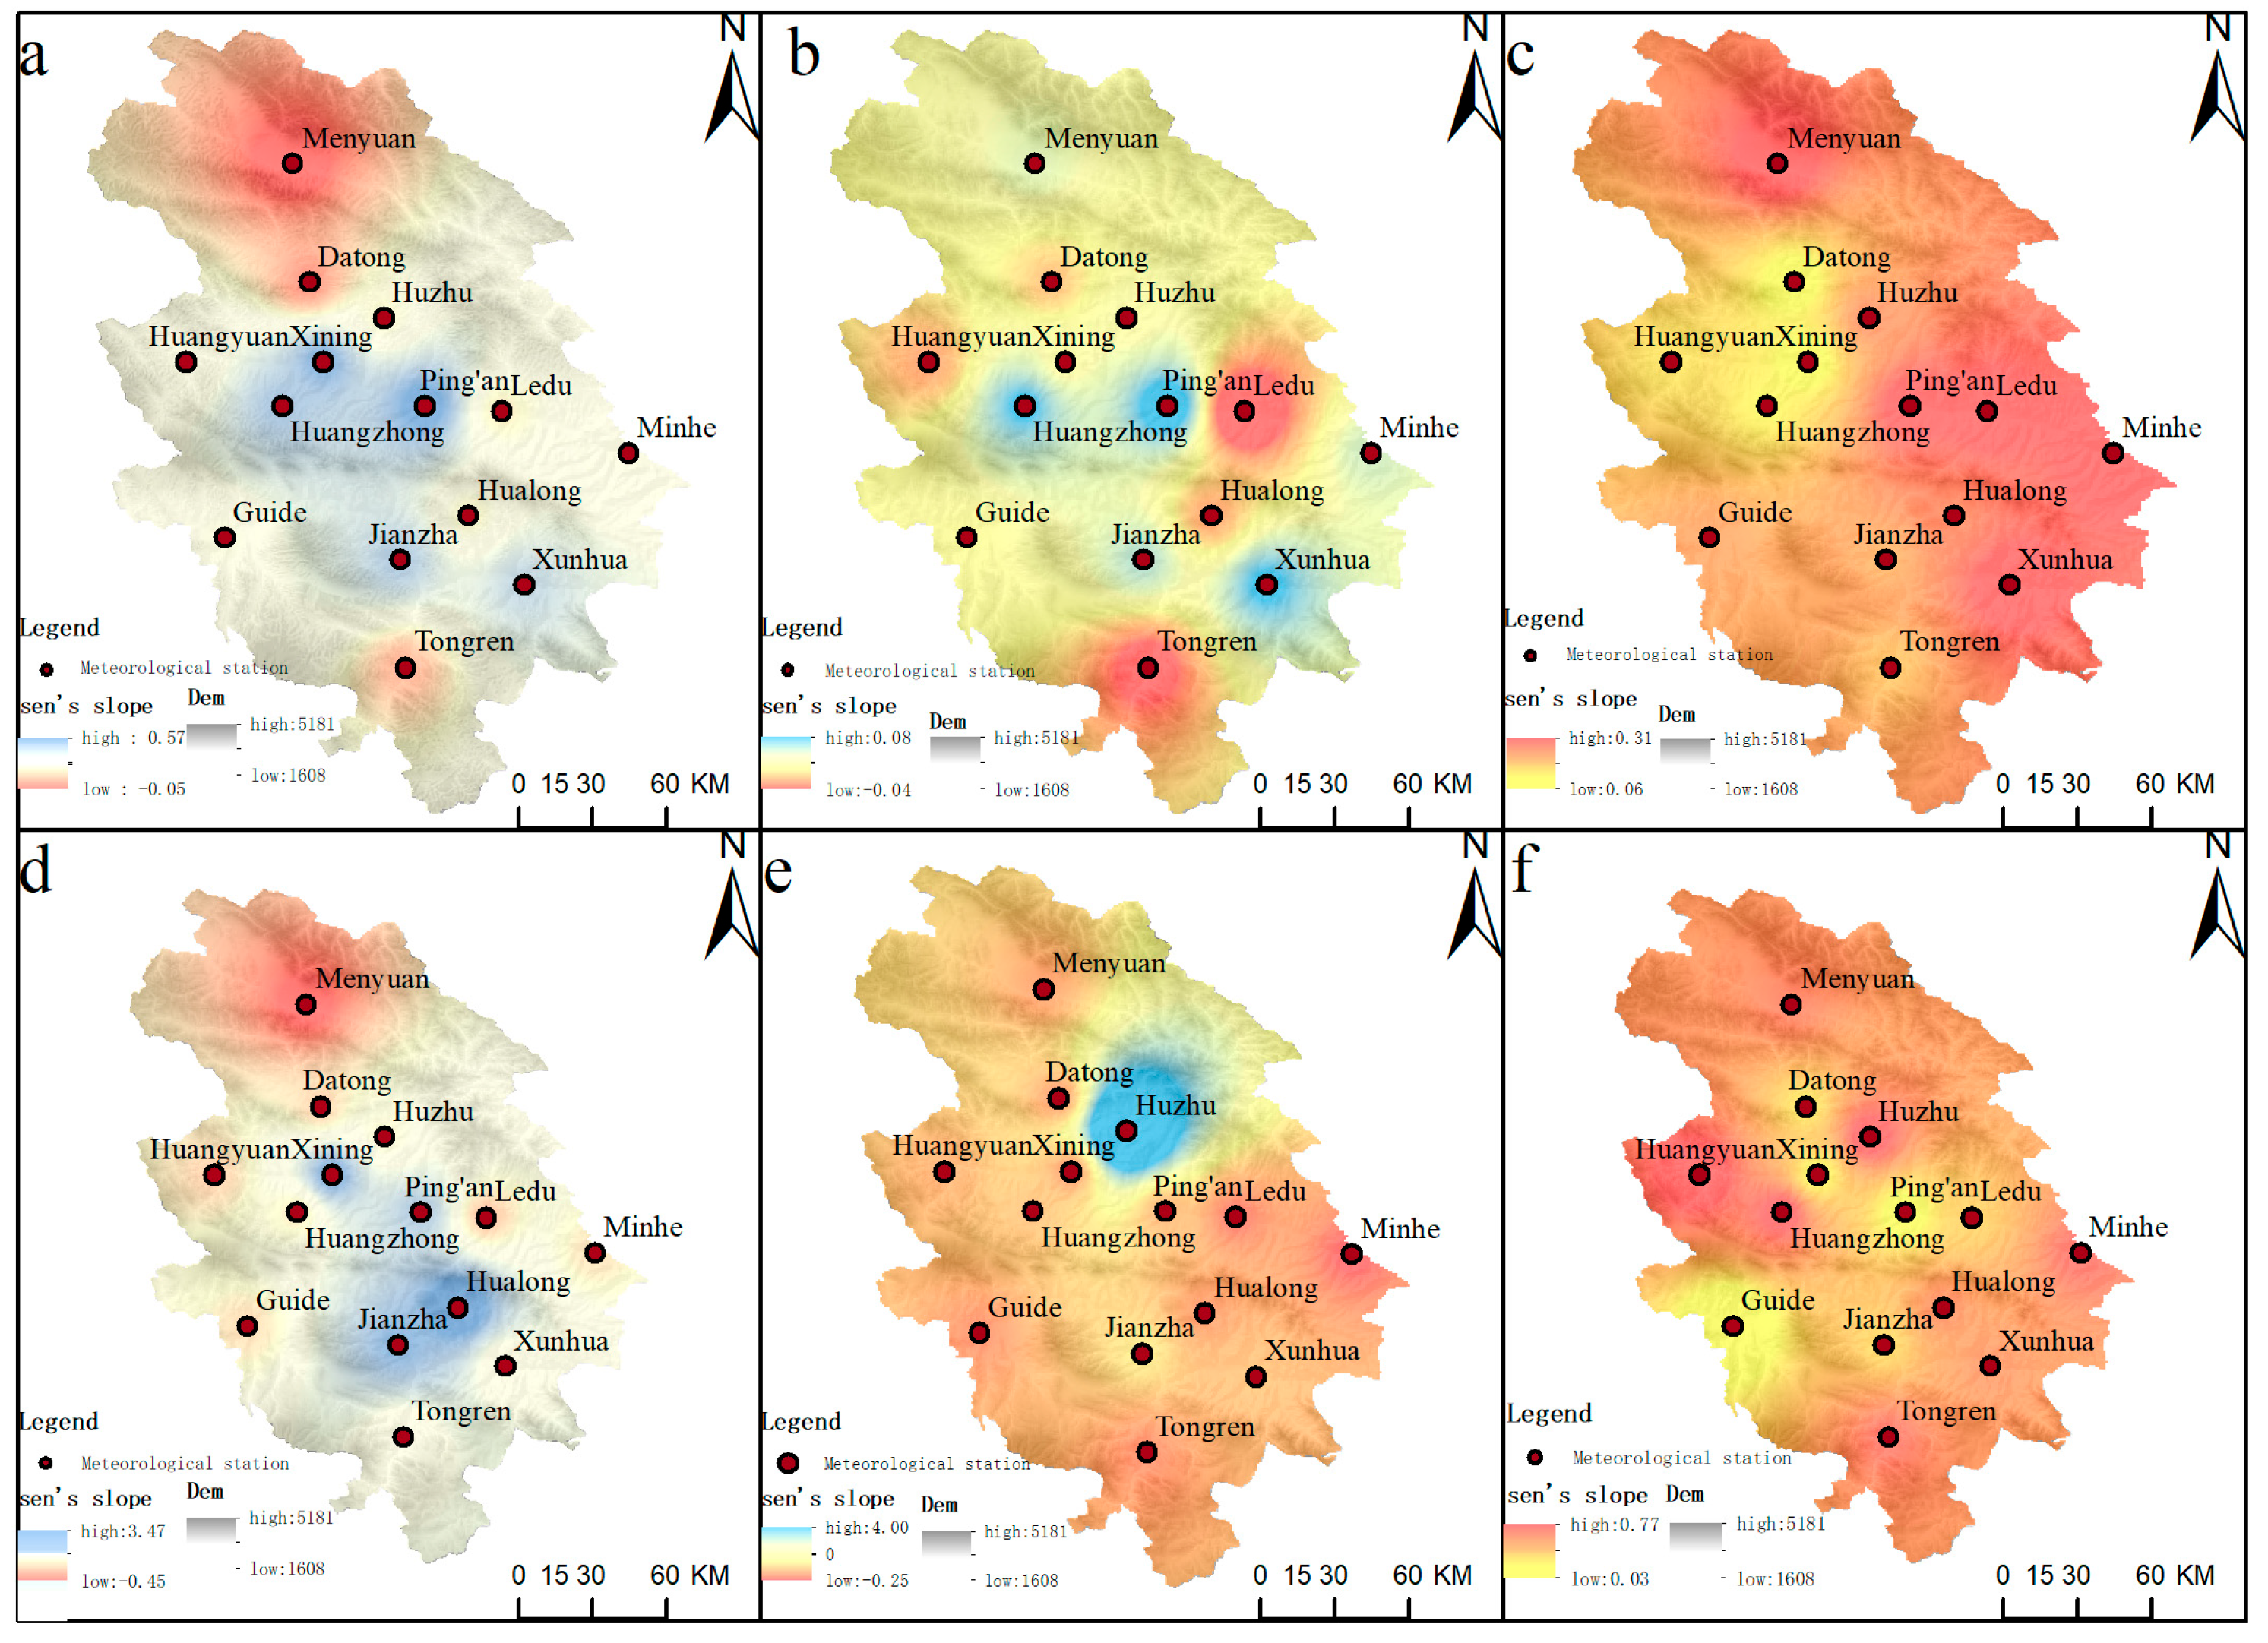
Figure 5.
Violin plot of the relationship between extreme precipitation events and maximum temperature during inter-event periods.
Figure 5.
Violin plot of the relationship between extreme precipitation events and maximum temperature during inter-event periods.
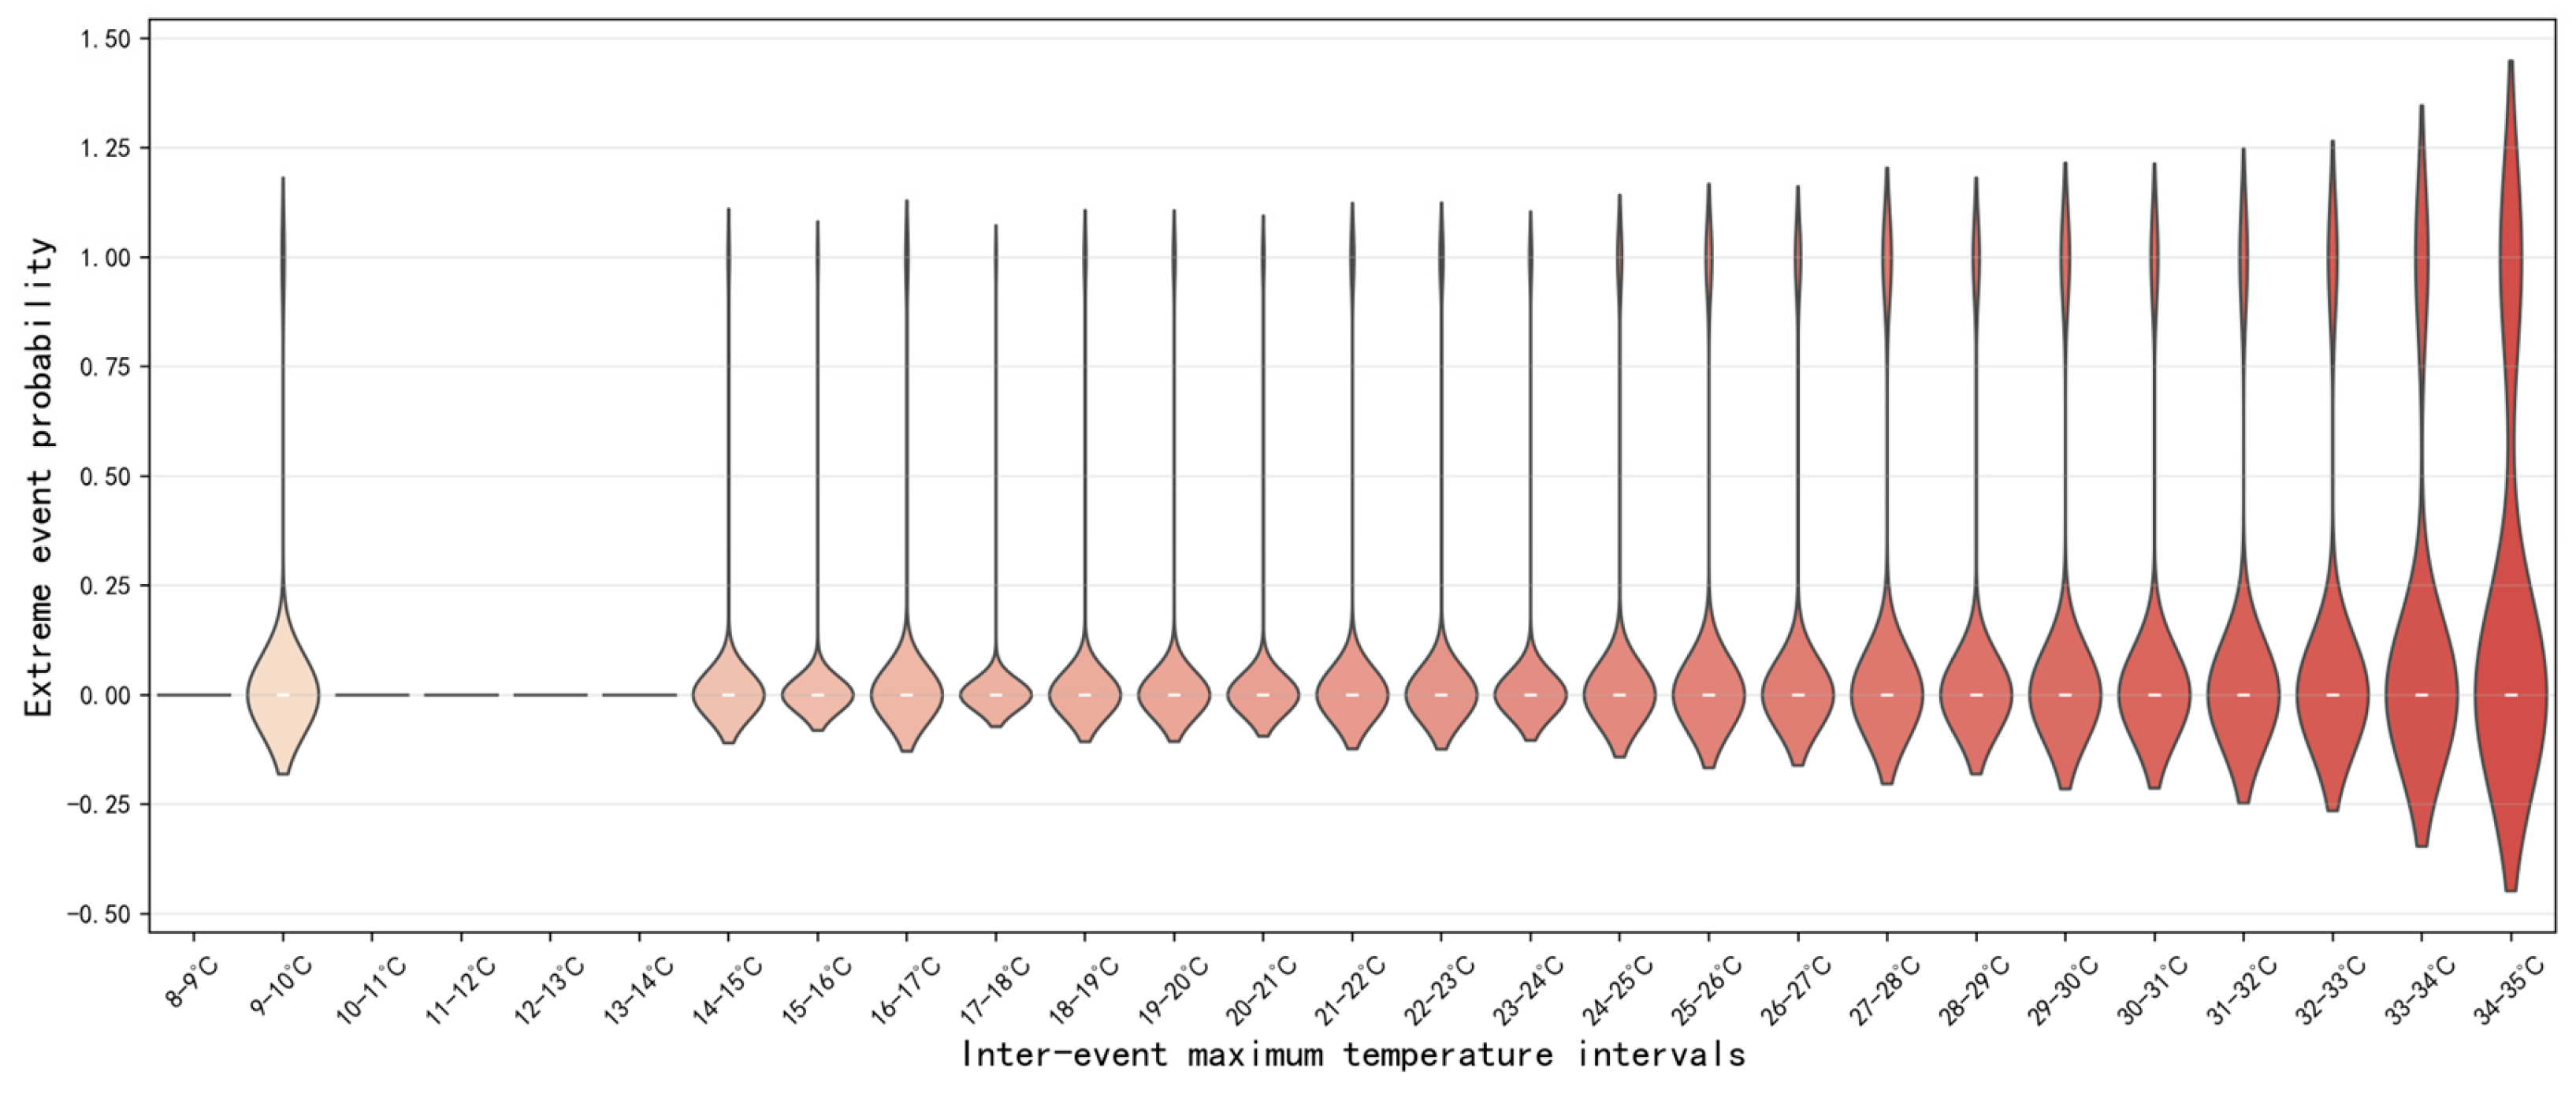
Figure 6.
Relationship between extreme precipitation and high temperature during inter-event periods.
Figure 6.
Relationship between extreme precipitation and high temperature during inter-event periods.
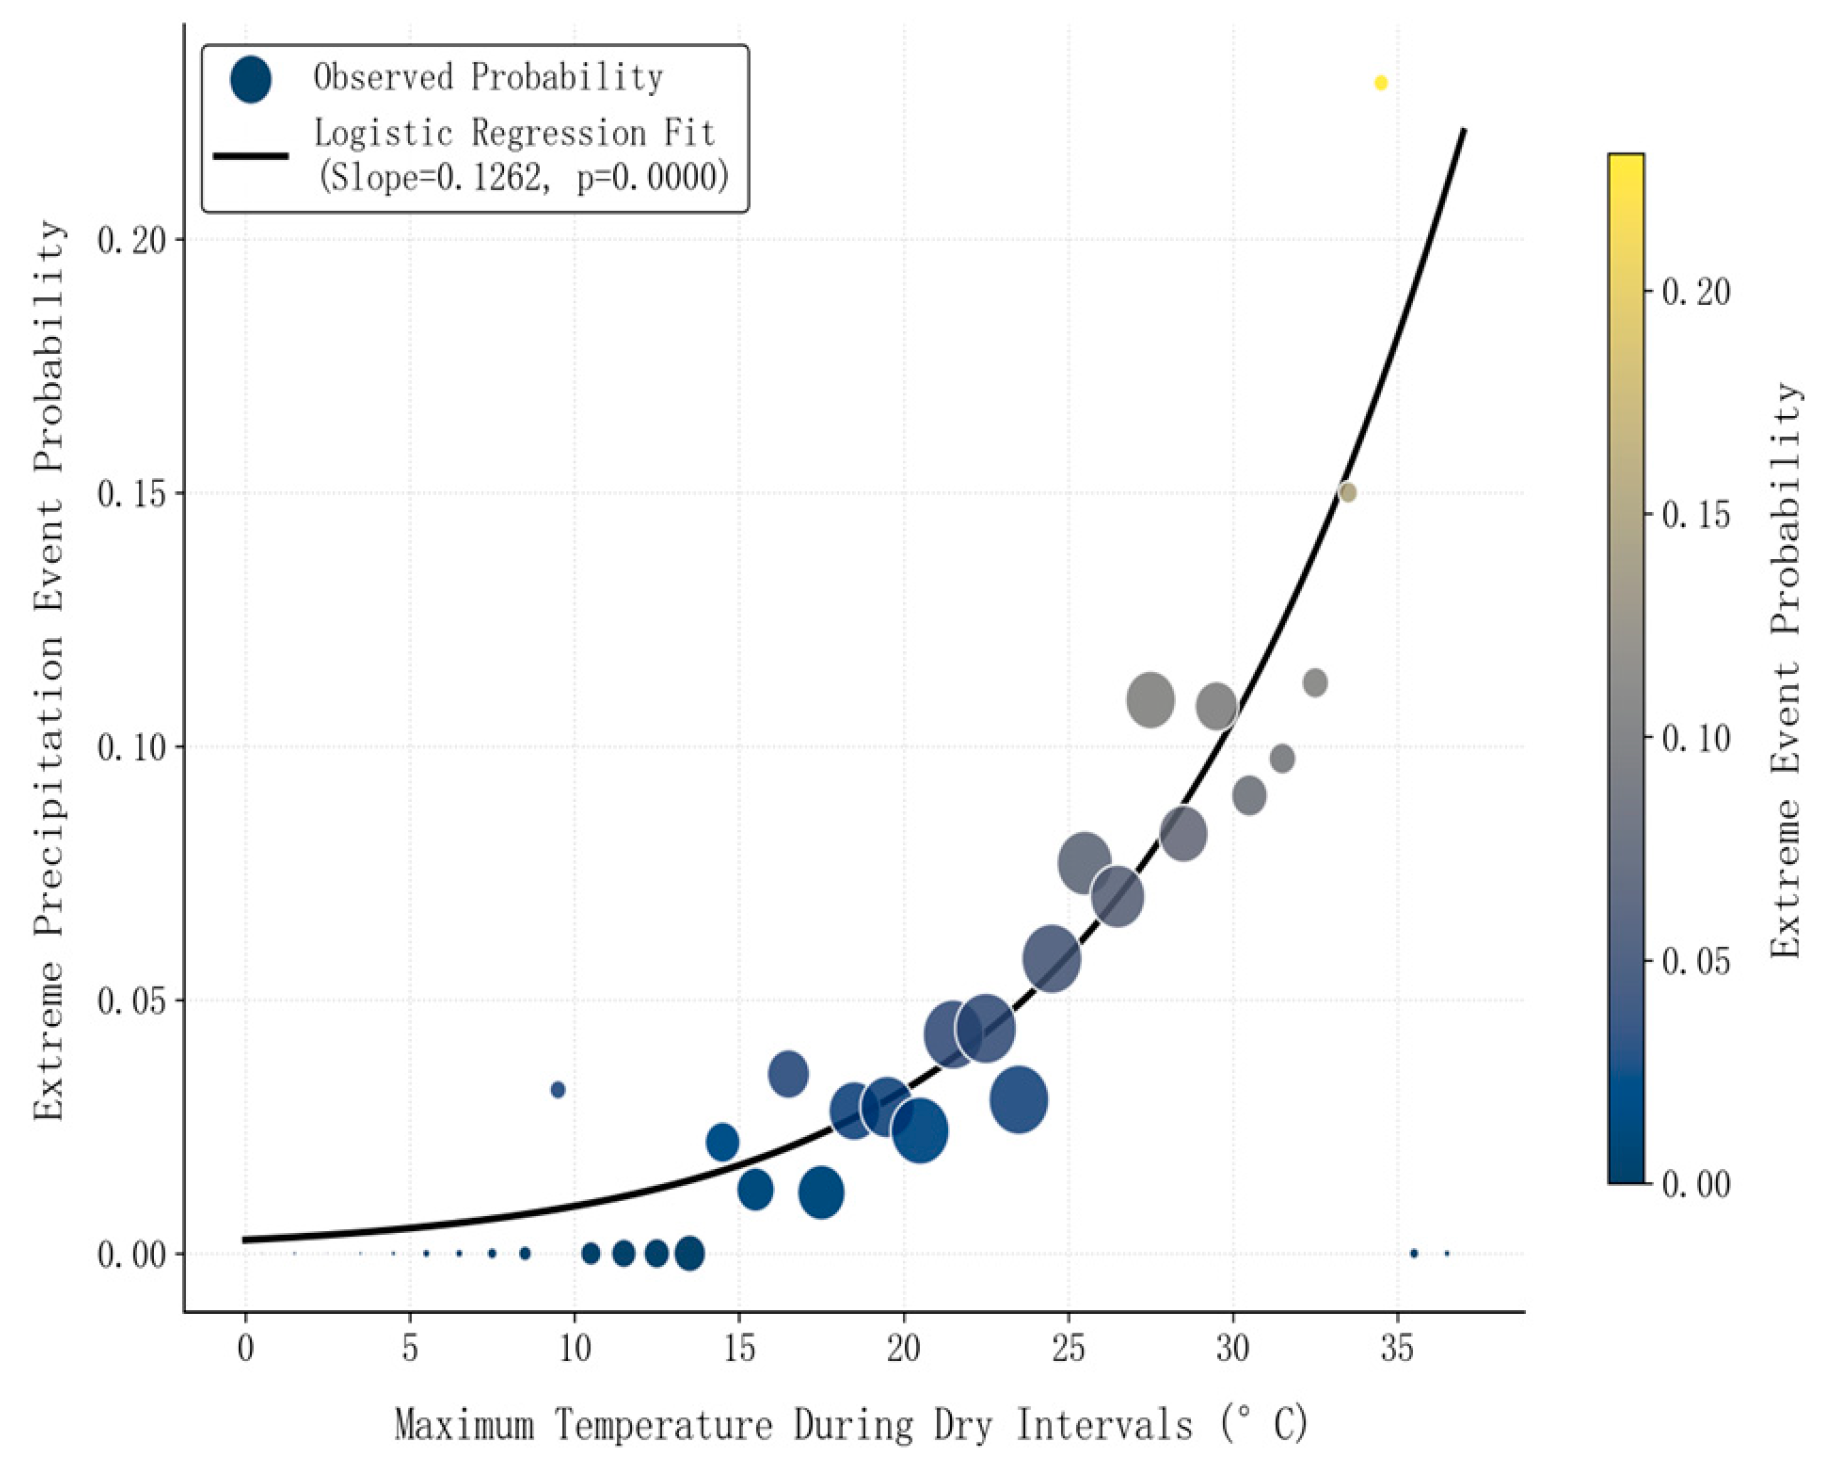
Figure 7.
ROC Curvo for Extreme Preclpitatlon Predictlon.
Disclaimer/Publisher’s Note: The statements, opinions and data contained in all publications are solely those of the individual author(s) and contributor(s) and not of MDPI and/or the editor(s). MDPI and/or the editor(s) disclaim responsibility for any injury to people or property resulting from any ideas, methods, instructions or products referred to in the content. |
© 2026 by the authors. Licensee MDPI, Basel, Switzerland. This article is an open access article distributed under the terms and conditions of the Creative Commons Attribution (CC BY) license (http://creativecommons.org/licenses/by/4.0/).
Copyright: This open access article is published under a Creative Commons CC BY 4.0 license, which permit the free download, distribution, and reuse, provided that the author and preprint are cited in any reuse.


