

Submitted:
18 March 2026
Posted:
19 March 2026
You are already at the latest version
Abstract
In the ecotones, trees growth and population are the most sensitive to the changing hydrothermal regime. Here we analyzed Larix sibirica and Populus laurifolia response to the moisture changes in the unique refugia that bordered the Mongolian desert in the southern Siberia. The age of old-growth trees (A>500 y) suggests that refugia have existed throughout the Holocene. We aimed to analyze (1) larch and poplar growth dependence on the climate variables, (2) treelines shift into the desert and (3) ground cover GPP (gross primary production) dynamics. We used on-ground survey, dendroecological analysis and remote sensing data. Beyond the refugia, trees were established after the warming onset in the study area (c. 1980). Since that, growth of both species has increased and has been controlled by atmospheric and soil droughts (measured by the SPEI and scPDSI indices, correspondingly). Summer winds impair trees’ growth via increased evapotranspiration. We found that both larch and poplar treelines shifted into southward sandy dunes. Although poplar is a less drought-resistant species, its treeline was shifting ahead of the larch one with a mean speed of 5.6 m/y vs 0.8 for larch. The mean and max treeline shifts were 260 and 450 m for poplar and 35 m and 70 m for larch. During the warming, the poplar population has dramatically increased (+300% vs + 46% for larch). P. laurifolia occupied climate-caused new niches ahead of drought-resistant L. sibirica due to its high anemophily and seed production. We found that increasing GPP trends in both refugia and in adjacent sandy dunes caused phenomenon of “desert greening”. The treelines migration into the desert contradict the predicted shrinkage of the tree range within its southern boundary. However, the projected increase of moisture deficit at the 2080–2100 may impair that phenomenon. Nevertheless, current changes in the hydrology regime are favorable for trees growth and expansion into the adjacent Mongolian desert.
Keywords:
larch treeline shift
; poplar treeline migration
; larch refugia
; forest – desert ecotone
; trees in desert
; larch range in Siberia
; poplar range in Siberia
; southward trees’ migration
1. Introduction
Larch (Larix spp.) is the dominant conifer species in Siberia. Larch-dominant communities (Larix sibirica Ledeb., L. gmelinii Rupr. and L. cajanderi Mayr.) are the largest forest formation in Russia, which covering more than 40% of the forested area. The majority of these larch-dominant forests (>95%) are located in Siberia and cover about 70% of the permafrost zone. In severe climatic habitats, they form pure stands.
Due to its high cold-resistance, larch forms treelines in northern and alpine forest-tundra ecotones. Larch is highly drought-resistant due to its high efficiency of water use [1]. This allows larch to grow at a semi-desert level of precipitation and to populate forest-steppe ecotones. A deep and well-developed root system allows larch to grow on drained soils with poor water and mineral content. However, within the permafrost zone, the root system of larch is shallow (up to 30 cm or less).
Larches are anemochoric species with a lifespan of up to 600–700 years (up to more than 1,000 y in the north of Eastern Siberia). Larches are the most photophilous, shade-intolerant, and fast-growing conifer species. These species are also well adapted to wildfires and populate post-fire burns with abundant seedlings [2]. In a warmer and drier climate, larch has been considered a potential substitute for precipitation-sensitive Abies sibirica Ledeb., Pinus sibirica Du Tour, and Picea obovata Ledeb. in the southern lowlands of Siberia [3]. Observed climate changes are mostly favorable for larch species within the majority of their range. Thus, since warming onset , L. sibirica tree growth in general has increased and larch-dominant forest densification has been observed in the Ural and Siberian Mountains [4,5,6]. Larch trees are moving uphill in the mountains and northward in the polar tundra [7,8].
However, in the changing hydrothermal regime, larch may experience moisture limitation, followed by a growth decrease, which has been documented within larch’s southern lowland habitats and at high latitudes [5,7,9,10]. Prognostic models suggest that changes in tree ranges and growth will primarily occur in ecotones between the forest and non-forest areas [11]. Thus, larch-dominant forests within the forest-steppe ecotone (the Trans-Baikal zone) have experienced thinning and mortality due to an increased fire rate [2]. Globally, according to Mamet et al. [12], Larix spp. have experienced northern expansion and southern retraction as the species respond to the changing climate.
Meanwhile, there is still a handful of data about regarding the larch response to the changing hydrological regime at its southern range. In this paper, we aimed to analyze larch growth and area changes in the unique larch refugia that located at the northern boundary of the Mongolian desert, on the very edge of the larch range. Together with larch, Populus laurifolia also is present in these refugia, although this species is less drought-resistant. P. laurifolia is a typical species in Southern Siberia and is often found within river valleys and rarely in the forest-steppe ecotone. Both species are growing on sandy dunes.
Tested hypothesis: the changing hydrological regime might stimulate the growth of Larix sibirica and Populus laurifolia and facilitate treeline migration into the sandy desert.
We are seeking answers to the following questions:
What are the trees’ growth dynamics in the refugia?
What climatic variables controlled tree growth?
What are the treelines shift since the warming onset? What is treelines migration rate?
2. Materials and Methods
The study was based on field survey data, Terra/MODIS and high-resolution satellite time series, as well as UAV (Unmanned Aerial Vehicle) data, tree growth index (GI) data, and regression analysis between the GI and eco-climate variables. In addition, we modeled the moisture deficit with the horizon 2051-2020 and 2081–2100.
2.1. Study Area
The study sites were located at the northern boundary of the Mongolian Deserts. The sites included two larch refugia, i.e., “Tes-Hem” (the main site) and “Kara-Haya” (supplementary site) (Figure 1).
Larch and poplar formed clusters with a canopy closure up to 0.4, as well as growing as separate single trees. The mean crown closure in refugia is about 0.1. Old-growth larches were also present in the multi-stem forms. The mean height of larches is about 13 m, the maximal ones is about 18 m; the mean and max diameters are 27 and 38 cm. The mean and max heights of poplar trees are about 2 m and 4 m; the mean diameter is 6.5 cm. Both species grow on nutrient-poor sandy soils (Figure 2).
On-ground vegetation is formed by shrubs and few grass species. The ground cover closure is of about ~10-15%. It is composed of Berberis sibirica Pall., Cotoneaster melanocarpus Fisch., Caragana bungei Ledeb., Artemisia spp., Agropyron spp., Oxytropis tragacanthoides Fisch., Hedysarum fruticosum Pall., and Thesium tuvinense Krasnob.. Rare small moss communities (Rhytidium rugosum (Hedw.) Kindb. + Polytrichum sp.) are located in the larch shade.
2.2. Ground Survey Data
Fieldwork was conducted in 2025. Temporary test plots sites (N = 12) with a radius of 9.8 m (S ~0.03 ha) were established within the elevation range of 1100–1240 m a.s.l. We described relief features (elevation a.s.l., aspect, and slope steepness) and obtained geobotanical and soil type data. We measured tree height and DBH (diameter at breast height, 1.3 m), described tree physiognomy, stand closure, regeneration density, and vitality. For dendrochronological analysis, trees were randomly selected within an area of approximately 1.0 ha. Samples (cores) were taken at the DBH height or at the root collar level with an increment borer. In total, 78 larch and 17 poplar trees were sampled.
2.3. Climatic Variables
Air temperature and precipitation data were obtained from the ERA5-Land database and from the nearest weather station Erzin (WMO index #36307, 50°16’N, 95°10’E, H = 1102 m, distance to the study sites is 10–20 km) using the AISORI online database [13]. Atmospheric and soil droughts were estimated based on the Standardized Precipitation Evapotranspiration Index (SPEI) index [14], the Self-Calibrated Palmer Drought Severity Index (scPDSI) [15], and soil moisture content.
The SPEI is a proxy for atmospheric drought [16]. An increase in the SPEI indicates a decrease in atmospheric drought, and vice versa. The SPEI was calculated based on precipitation and evaporation data extracted from the ERA5-Land database using the SPEI library (v.1.8.1) [16,17] within the RStudio environment (v.2025.09.1, build 375 [18].
The scPDSI was calculated in RStudio using the R programming language (v.4.5.1) [19] and the scPDSI library (v0.1.3) [20]. The input parameters were total monthly precipitation and potential evapotranspiration, which were extracted from the ERA5-Land database [21]. Negative values of the scPDSI indicate drought conditions, and positive ones indicate wet conditions [15].
We estimated the total water content below ground by using equivalent water thickness anomalies (EWTA) obtained from GRACE (Gravity Recovery and Climate Experiment). The monthly EWTA data were downloaded using the NASA GRACE(-FO) Data Analysis Tool [22] for the period of 2002–2024 with a spatial resolution of one degree. The EWTA is a measure that quantifies changes in the total amount of water stored on land, including soil moisture, snow, and groundwater, relative to the 2004–2009 time-mean baseline [23]. These gravimetric data represent the vertical thickness of a layer of water that would result from the measured change in terrestrial water mass [24]. The EWTA provides a valuable tool for monitoring drought [25,26], the water cycle [27], and their impact on vegetation [28,29,30]. Hereafter, we use the term “total water content” (TWC) instead of EWTA.
2.4. Moisture Deficit Prognosis
Moisture deficit (MD), i.e., the difference (Δ) between precipitation (PRE) and potential evaporation (PEV) during the period of growth, is a valuable variable that controlling tree growth in arid areas. To estimate PRE and PEV, we applied monthly climate data extracted from CMIP6, based on the CNRM-CM6-1-HR model with a spatial resolution of ~0.5 º × 0.5 º [31]. This model was chosen because its values are close to the average of all models presented in the IPCC WGI Interactive Atlas tool [32]. We analyzed data corresponding to the climatic scenarios SSP2-4.5, SSP3-7.0, and SSP5-8.5 [33,34]. We fitted the forecast data (PRE and PEV) to the historical data extracted from the ERA5-Land database using the simple shift method. For this, forecasted monthly MD values were shifted by an amount equal to the average difference between the forecast and actual data for 2015–2024 (the overlap period between the prognostic and historical data). We calculated and compared ΔMD between 2000–2024 and 2081–2100.
2.5. Remote Sensing Data
Remote sensing data were used to determine treeline locations and count trees. For this purpose, we used a UAV (Unmanned Aerial Vehicle) DJI Mavic 3 Multispectral, which provided scenes with 5-cm resolution. Scenes with 50% overlap were obtained during the fieldwork in July 2025. In total, 1,300 scenes were obtained. Scenes were preprocessed using Agisoft Metashape software [35]. We also analyzed high-resolution satellite scenes (QuickBird, WorldView-3, and Pleiades Neo4 with resolutions of 2.0–3.7 m) obtained from freely available web services [36]. The latest best quality scene was dated to the year 2024. Analysis of scenes was based on ESRI ArcGIS software, together with the expert interpretation and semi-automatic classification procedures.
2.6. Dendroclimatic Analysis
The total sample size included cores from 78 larches (73 at the Tes-Hem site and 5 at the Kara-Haya site) and 17 poplars (Tes-Hem site). Tree-ring widths were measured with a precision of 0.01 mm. Missing rings were detected by the cross-dating method. The quality of cross-dating was checked using the COFECHA 6.02 software [37,38]. Age trends were eliminated by negative exponential or negative linear regression methods using the ARSTAN 6.02 software [39,40]. Standard and residual tree-ring chronologies were generated. Tree-ring chronologies (in mm) are a proxy of the annual radial increment. Standard chronologies are biweight robust mean values of indexed raw chronologies. Residual chronologies were generated from standard chronologies by eliminating the autoregressive component using AR modeling. Growth chronologies of L. sibirica for the Tes-Hem and Kara-Haya sites were merged because both chronologies were strongly correlated (r = 0.68). We used a unitless growth index (GI) as the metric of tree growth increment. The GI is a normalized tree-ring chronology with an average of 1.0 and relatively constant dispersion. We used the residual chronologies in the dendroclimatic analysis [41]. We analyzed correlations between the trees’ GI and climate variables (air temperature, precipitation, SPEI, and scPDSI).
2.7. Treelines Shift Analysis
Treelines shift was measured based on field studies, satellite and UAV scenes. The shifts were measured as a distance between southern refugia boundary and current treelines location. To estimate treelines evolution, we try analyze a the age-classes as a function of distance from refugia. However, there was no explicit dependence between poplar age and the distance from the refugia. Poplar trees are highly prolific: a single mature tree can release tens of millions of seeds in a season. Seeds are lightweight and attached to hairs that act as parachutes. They parachute through the air, swept away often hundreds of meters or even kilometers from the parent tree. Therefore, seedlings establishment may occurred annually within the whole distance between refugia and treelines boundaries. Because of that, the proxy of the mean treelines migration rate was estimated. For the onset of trees migration, we assume the year of warming onset (c. 1980). That was supported by fact that age of all trees beyond refugia boundary was less than 50 years, i.e., approximately coincided with the year of warming onset. See, please, also Discussion section.
2.8. Vegetation Productivity Data
The gross primary productivity (GPP) of the vegetation cover was estimated using the MODIS MOD17A3HGF product (2001–2025) [42]. These data represent raster composites of annual GPP values (kg C/m2) with a spatial resolution of 500 meters [43]. Time series data were obtained from the EarthData geoportal [44]. The original GPP data were converted into multi-band images. The average values were determined for specific areas within the 250-meter buffer zones around the study sites using the exactextract algorithm [45]. This algorithm is implemented as a Python library for extracting and summarizing raster dataset values [46].
The GPP trends were calculated for each pixel based on the Theil–Sen algorithm using the pyMannKendall library (v.1.4.2) [47]. This is a non-parametric method based on the Mann–Kendall test used to analyze time series data for consistently increasing or decreasing trends [48]. Spatial changes in GPP values between 2022–2024 and 2001–2003 were estimated using the Mann-Whitney U-test implemented in the SciPy Python library [49].
2.9. Statistical Analysis
We used StatSoft Statistica (v.10) [50], R (v. 4.5.1) [51] along with RStudio (v. 2025) [52], and Microsoft Excel for the statistical analysis. Geospatial analysis was performed using ESRI ArcGIS software and Python. The GPP trends were calculated based on the Theil–Sen algorithm [48] using Python. Changes in GPP were estimated using the Mann–Whitney U-test. Trends in the total water content (EWTA) and the growth index were assessed based on simple linear regression using standard methods. The difference between projected and historical climate variables was estimated using the t-test.
3. Results
3.1. Eco-Climate Variables Dynamics
Within the study area, a continuous increase in both summer and annual air temperatures has been observed since c. 1980 (Figure 3a). A continuous moisture regime improvement (i.e., an increase in precipitation and a decrease in atmospheric and soil drought) was observed since 1950s and reached its maximum c. 1985–1990, when both droughts were minimal (Figure 3b-d). Since then, drought increased until c. 2010, with consequent decrease during the last decade (Figure 3b-d). Gravimetric measurements also indicated a total water content increase during the last decade (Figure 3e).
Wind is a significant variable that influences tree vigor. The prevailing winds blow from the west. Maximum speed occurs in December–January (3.2 m s–1) and decreases to 0.6±0.1 m s–1 during in the growth period (May–September). Since the warming onset, the maximum winter wind speed has been gradually decreasing (Figure 4).
3.2. The Chronology of Tree Growth Index
The larch population consists of two cohorts: old-growth trees (age up to 500+ years) and a young generation (age up to 60 years). The great age of the old trees suggests that the refugium may have existed throughout the Holocene. Larch growth chronologies indicated warming in the 18th century and subsequent periods of warming and cooling (Figure 5a). The formation of the young cohort corresponded to the period of decreased atmospheric and soil drought in 1980–1990 (Figure 3b–e; Figure 5c). The growth of young larches was similar to that of old-growth trees (Figure 5c). Since the warming onset (c. 1980), the growth of both cohorts has increased, with a subsequent depression until c. 2008. The subsequent decrease in atmospheric and soil drought in the last decade (Figure 3b-e) stimulated the growth of larch trees, especially in the young cohort (Figure 5a,b).
The poplar tree chronology is more stochastic in comparison with the larch chronology. Similar to larch, poplar growth decreased in the 1990s, with a subsequent growth increase in the 21st century (Figure 5d).
3.3. Tree Growth Dependence on Climate Variables
Air temperature impairs the growth of young larch and poplar trees (mostly in June). Old larch is less sensitive to air temperature (Figure 6a). The growth of larch and poplar is controlled by moisture variables: precipitation, and atmospheric and soil droughts. Old-growth larch is less sensitive to moisture in comparison with young larch (r = 0.30–0.49 versus 0.45–0.75) (Figure 6b–d). This is attributed to differences in root habitat zone, which is evidently deeper in old trees.
Summer (July) winds impaired larch growth. Presumably, this is due to water loss via increases evapotranspiration (Figure 7).
3.4. GPP Dynamics of On-Ground Vegetation
Alongside trees, an increase in the productivity (GPP) of the on-ground vegetation occurred in about 75% of the area of the sandy dunes (Figure 8). The ground cover vegetation is composed of small shrubs. Since the beginning of observations (2002–2006), the mean GPP in the last five years (2020–2024) has increased by 250 kgC/ha. The rate of GPP increase was ~19 kgC/ha/y. Currently, the mean vegetation GPP is 2080 kgC/ha with maximum values around 6000 kgC/ha.
The GPP of ground cover vegetation correlated with the growth index of larch and poplar trees (Figure 9).
3.5. Trees Migration into Desert
Surprisingly, the less drought-resistance poplar trees migrated into the desert faster and further than larches. Since warming onset in the study area (c. 1980), the mean treeline shifts for poplar and larch treelines were 35 ± 5 m (max = 70 m) and 260 ± 10 m (max = 450 m), respectively (Figure 10). The mean speeds of larch and poplar treelines shift were 0.8 m/y and 5,6, respectively. Based on the on-ground studies, the age of larch and poplar trees beyond the refugium boundary was <50 years.
3.6. The Moisture Deficit Projections
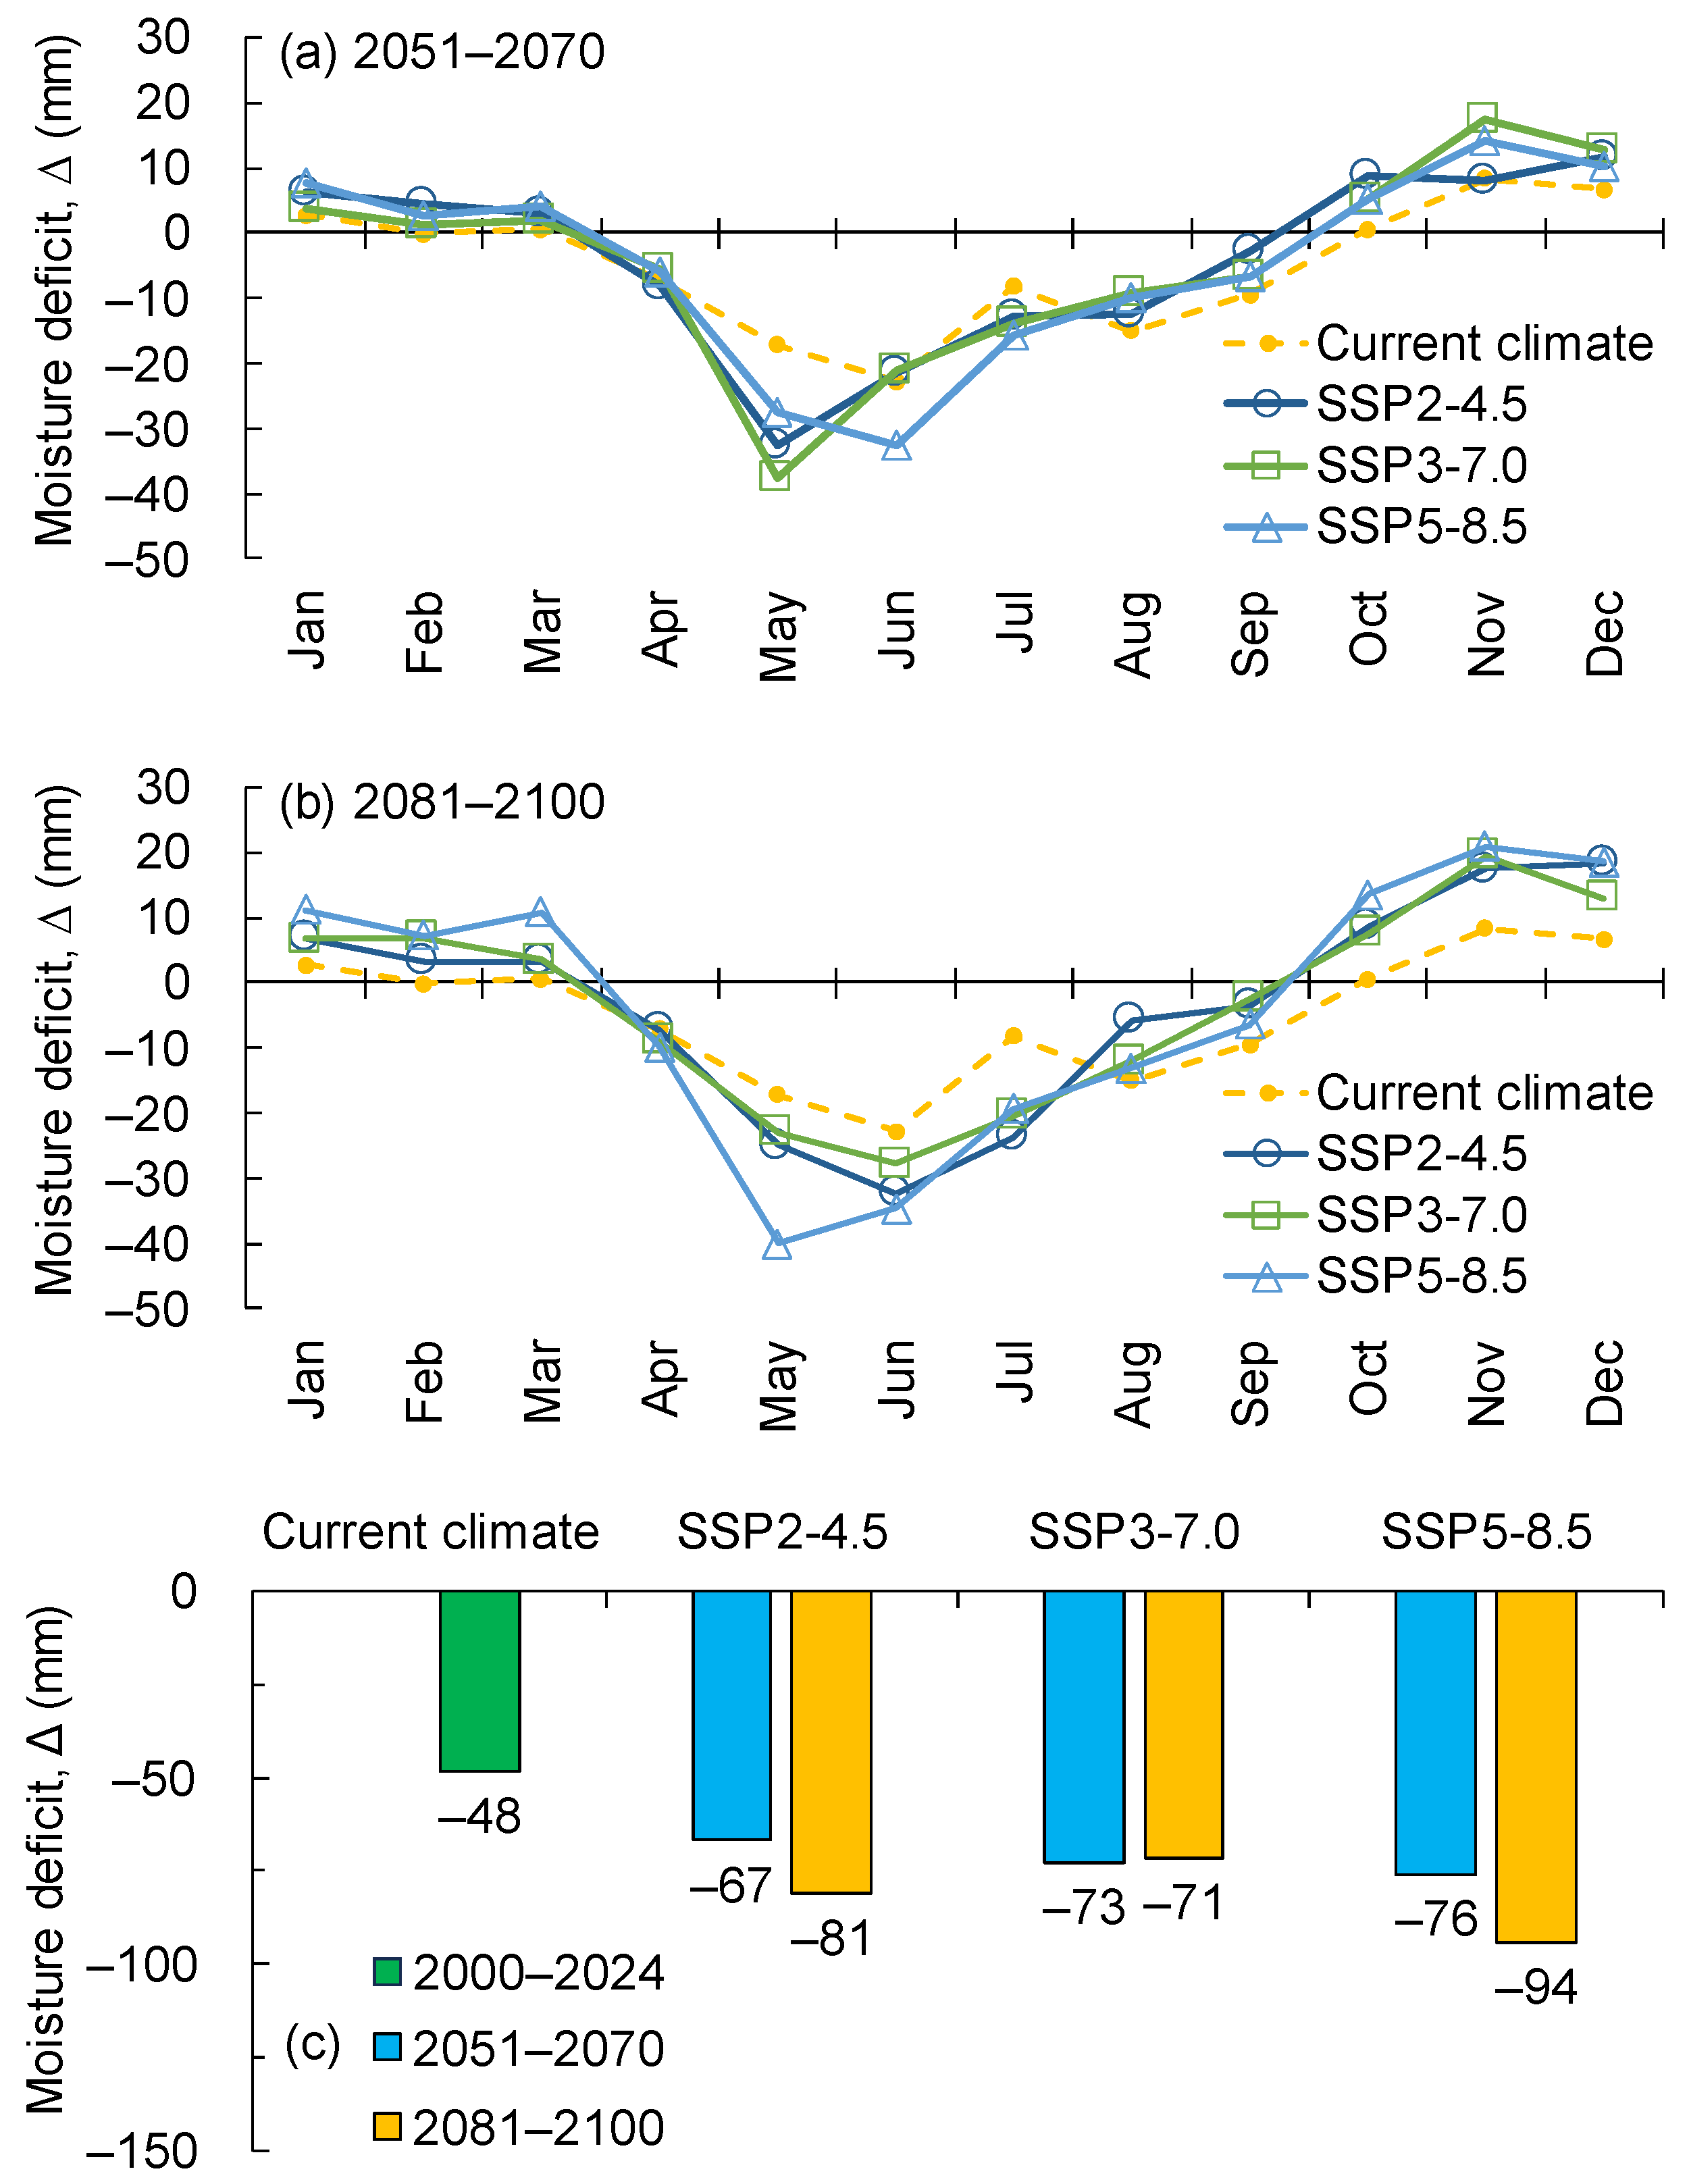
The growth of both larch and poplar species is controlled by the hydrological regime. i.e., by atmospheric and soil droughts (Figure 6). An important indicator of the hydrological regime is the moisture deficit (MD) i.e., the difference (∆) between precipitation and potential evaporation. Based on the climate scenarios SSP2-4.5, SSP3-7.0, and SSP5-8.5 [32,33,34], we estimated moisture deficit values for the horizons 2051–2070 and 2081–2100. According to all scenarios, the moisture deficit will increase, especially at the beginning of the growth period. Over time (2051–2070 vs 2081–2100), the moisture deficit will increase (Figure 11).
4. Discussion
Under a changing moisture regime, the most significant changes in tree growth, vigor, and range are expected (and observed) within the forest–non-forest ecotones. In this work, we focused on larch and poplar growth and treeline evolution within the refugia–sandy dunes ecotone or, in a broader view, at the northern boundary of Mongolian deserts. We considered the growth, establishment, and migration of both species since the warming onset, which occurred in the study area since c. 1980. The period of warming onset coincided with a local maximum of moisture supply, i.e., the minimal atmospheric and soil droughts (Figure 3 b-d).
These unique refugia is located at the edge of the larch habitat along the geographical meridian. The age of the oldest larches exceeds 500 years, which suggests the existence of that “last larch frontier” throughout the Holocene. Tree survival in the refugia is facilitated by site relief features. Namely, trees grow on sheltered downwind north-west and south-west slopes and within local depressions. These are the zones of snow accumulation and lower evaporation. Together with larch, a few old (the age up to 200+ years) poplar trees sheltered in the refugia.
Both drought-resistant larch and less resistant poplar have been slowly migrating into the adjacent desert. Unexpectedly, poplar trees which are less drought-resistant, migrated ahead of drought-resistant larch (the mean and max treeline shifts were 260 and 450 m for poplar and 35 m and 70 m for larch.
The principal cause of this was the species’ seed production and the distance of dissemination. It is known that seed availability, alongside climate variables, is the key factor that limits tree establishment and migration. Mature larch may produce million of seeds, although over 50% of larch seeds may be empty. In addition, larch produces cones mostly in 3–4 years on average. Larch is an anemophily species, however, the regular radius of dissemination is about 30–40 m from the parent tree.
Poplar is are much more prolific: a mature tree can release annually tens of millions of seeds. Seeds attached to hairs that act as parachutes and may swept away even kilometers from the parent tree. In addition, poplar lateral roots radiate out more than 30 meters from the parent tree and establishes sucker shoots. In addition, regeneration density (i.e., trees with age < 10 years) for poplar reached 900 seedlings/ha, whereas larch regeneration was sporadic. The maximal shift of the poplar treeline was approximately 400+ m which is within the radius of seed dispersal. It is known that seedling establishments is strongly controlled by microsite conditions. Once proper climate-driven niches arise, seed germination may result in seedling establishment within a few years. The maximum age of trees beyond refugia does not exceed 50 years, which approximates the period since the warming onset (c. 1980) which suggest that trees’ colonization of the dunes occurred since that during consequent favorable years during which poplar seeds spreads over hundred meters. That’s why there is no explicit dependence between the poplar or larch age and the distance from the refugia. That is why the classical method of tree migration rate estimation based on age class analysis as a function of distance from mother trees hardly works in this case. Therefore the average migration rate of both species was estimated based on the beginning of sands colonization since warming onset. The estimated poplar mean migration rate was about 5,6 m/y, whereas larch rate was one order lower (0.8 m/year). However, the latter was about twice higher than larch migration rate into the alpine tundra [53].
The growth of both species is controlled by moisture variables, i.e., an atmospheric (SPEI) and soil (scPDSI) droughts which are the derivatives of precipitation and air temperature. Poplar trees are a comparatively higher sensitive to available moisture (Figure 6c, d). Old-growth larch is less sensitive to moisture stress than young larch, which is evidently related to its deeper roots. Younger trees are also more sensitive to negative temperature influence (Figure 6a). However, in the mountains (southern Siberian and northern China) temperature stimulates larch growth [5,9]. It is notable that summer winds impaired larch growth, whereas the influence of winter winds was insignificant (Figure 7). This influence is explained by increased water loss through evapotranspiration. Typically, winter winds impair tree growth via desiccation and snow abrasion [53]. However, in the study area, the winter wind speed is low (~3.0 m/s) (Figure 4b, c).
Alongside the moisture regime improvement, elevated atmosphere CO2 concentration in also facilitated trees growth and productivity. For example, CO2 rise mitigated drought-induced productivity losses by 5.7 ± 0.9% [54]. That issue needs further studies.
Contrary to the reported shrinkage of the larch range at its southern edge (e.g., in the Trans-Baikal zone, Western Sayan Mountains, and Mongolian Mountains [2,5,55]), larch is expanding its range into the Mongolian desert. Similarly, Scots pine (Pinus sylvestris L.) at its southern edge in Central Siberia has increased growth and regeneration density in the 21st century [56,57]. Meanwhile, in general, larch and Scots pine have decreased their growth in the Asian arid zone in the 21st century [58,59].
The increase in larch and poplar growth coincided and correlated with the increase in vegetation GPP within the sandy dunes. In fact, a “greening phenomenon” has been observed on the northern boundary of the Mongolian desert. A similar “steppe greening” phenomenon has been reported in the nearby Tuva Hollow [56,57]. It is worthy of note that increased vegetation growth facilitated sand stabilization and suppressed northward desert migration.
In general, we observed a unique event of southward migration of trees at the edge of their range, whereas a number of publications describe northward shifts of tree habitats (e.g., [11,60]). For example, P. tremuloides has experienced negative climate-driven changes in North American forests [61]. Larix gmelinii decline and mortality have been described in the Trans-Baikal zone [12,62]. Betula spp. decline was reported in Northern Mongolia and the Trans-Baikal zone [63,64]. Conifer mortality at their southern range has been described in Europe and the Americas [65,66,67]. However, the predicted increase in moisture deficit (i.e., worsening of the hydrological regime) suggests a possible decrease of the larch and poplar range within the study area. Nevertheless, the currently changing climate is favorable for tree growth and southward migration into the Mongolian Desert.
5. Conclusions
At the southern edge of the larch and poplar ranges in Central Siberia, we observed an increase in tree growth and populations, while published studies reveal a shrinkage of tree species at their southern ranges throughout the boreal biome. Moreover, trees are migrating from refugia into sandy dunes. Notably, the less drought resistant P. laurifolia migration rate is about one order of magnitude higher than that of L. sibirica. Alongside this, sandy dunes are undergoing “greening” by increasing their GPP. Currently, climate warming is favorable for the growth of larch and poplar trees at the northern boundary of the Mongolian deserts.
Author Contributions
conceptualization, V.I.K., I.A.P.; methodology, V.I.K., I.A.P., S.T.I, A.S.S.; validation, V.I.K., I.A.P., S.T.I, A.S.S.; formal analysis, I.A.P., A.S.S., S.T.I.; investigation, V.I.K., I.A.P.; S.T.I., A.S.S.; resources, A.S.S., S.T.I., S.O.O.; data curation, I.A.P., A.S.S., S.T.I., A.M.S.; writing—original draft preparation, V.I.K., I.A.P., S.T.I.; visualization, I.A.P., A.S.S., S.T.I.; supervision, V.I.K. I.A.P.; project administration, V.I.K.; funding acquisition, V.I.K. Authors have read and agreed to the published version of the manuscript.
Funding
The research was funded by the Basic Project of the Federal Research Center “Krasnoyarsk Science Center of the Siberian Branch of the Russian Academy of Sciences”, no. FWES-2024-0023.
Data Availability Statement
The data presented in this study are openly available: climate data at https://cds.climate.copernicus.eu/cdsapp (accessed on 21 January 2026) and from the AISORI web-service (http://aisori-m.meteo.ru/waisori/; accessed on 21 January 2026); GPP data at https://lpdaac.usgs.gov/products/mod17a2hv006; EWTA data at NASA GRACE(-FO) (accessed on 21 January 2026) Data Analysis Tool (https://grace.jpl.nasa.gov/data/data-analysis-tool/; accessed on 21 January 2026); CMIP6 data at IPCC WGI Interactive Atlas service (https://interactive-atlas.ipcc.ch/; accessed on 21 January 2026).
Conflicts of Interest
The authors declare no conflict of interest.
Abbreviations
The following abbreviations are used in this manuscript:
| UAV | Unmanned Aerial Vehicles |
| GI | Growth Index |
| GPP | Gross Primary Production |
| PET | Potential Evaporation |
| MD | Moisture Deficit |
| SSP | Shared Socioeconomic Pathway |
| scPDSI | Self-Calibrated Palmer Drought Severity Index |
| SPEI | Standardized Precipitation Evapotranspiration Index |
| DBH | Diameter at Breast Height |
| WMO | World Meteorological Organization |
| TWC | Total Water Content |
| GRACE | Gravity Recovery And Climate Experiment |
| EWTA | Equivalent Water Thickness Anomalies |
| PRE | Precipitation |
| E | Evaporation |
| TS | Test Sites |
References
- Kloeppel, B.; Gower, S.; Treichel, I.; et al. Foliar carbon isotope discrimination in Larix species and sympatric evergreen conifers: a global comparison. Oecologia 1998, 114, 153–159. [CrossRef]
- Kharuk, V.I.; Shvetsov, E.G.; Buryak, L.V.; Golyukov, A.S.; Dvinskaya, M.L.; Petrov, I.A. Wildfires in the Larch Range within Permafrost, Siberia. Fire 2023a, 6, 301. [CrossRef]
- Kharuk, V.I.; Im, S.T.; Petrov, I.A.; Dvinskaya, M.L.; Shushpanov, A.S.; Golyukov, A.S. Climate-Driven Conifer Mortality in Siberia. Global Ecology and Biogeography 2021, 30(2), 543–556. [CrossRef]
- Shiyatov, S.G.; Terent’ev, M.M.; Fomin, V.V.; et al. Altitudinal and horizontal shifts of the upper boundaries of open and closed forests in the Polar Urals in the 20th century. Russ. J. Ecol. 2007, 38, 223–227. [CrossRef]
- Kharuk, V.I.; Petrov, I.A.; Golyukov, A.S.; et al. Larch growth across thermal and moisture gradients in the Siberian Mountains. J. Mt. Sci. 2023b, 20, 101–114. [CrossRef]
- Kirdyanov, A.V.; Prokushkin, A.S.; Tabakova, M.A. Tree-ring growth of Gmelin larch under contrasting local conditions in the north of Central Siberia. Dendrochronologia 2013, 31, 114–119. [CrossRef]
- Kharuk, V.I.; Ranson, K.J.; Petrov, I.A.; Dvinskaya, M.L.; Im, S.T.; Golyukov, A.S. Larch (Larix dahurica Turcz) growth response to climate change in the Siberian Permafrost Zone. Reg. Environ. Change 2018. [CrossRef]
- Grigoriev, A.A.; Shalaumova, Y.V.; Vyukhin, S.O.; Balakin, D.S.; Kukarskikh, V.V.; Vyukhina, A.A.; Camarero, J.J.; Moiseev, P.A. Upward Treeline Shifts in Two Regions of Subarctic Russia Are Governed by Summer Thermal and Winter Snow Conditions. Forests 2022, 13, 174. [CrossRef]
- Zhang, X.; Ba, X.; Chang, Y.; Chen, Z. Increased sensitivity of Dahurian larch radial growth to summer temperature with the rapid warming in Northeast China. Trees 2016, 30, 1799–1806. [CrossRef]
- Kharuk, V.I.; Petrov, I.A.; Dvinskaya, M.L.; et al. Comparative reaction of larch (Larix sibirica Ledeb) radial increment to climate change in the forest-steppe and highlands of Southern Siberia. Contemp. Probl. Ecol. 2018, 11(4), 388–395. [CrossRef]
- Anderegg, W.R.L.; Wu, C.; Acil, N.; Carvalhais, N.; Pugh, T.A.M.; Sadler, J.P.; Seidl, R. A climate risk analysis of Earth’s forests in the 21st century. Science 2022, 377, 1099–1103. [CrossRef]
- Mamet, S.D.; Brown, C.D.; Trant, A.J.; Laroque, C.P. Shifting global Larix distributions: Northern expansion and southern retraction as species respond to changing climate. J. Biogeogr. 2019, 46(1), 30–44.
- Specialized arrays for climate research. All-Russia Research Institute of Hydrometeorological Information – World Data Center. Available online: http://aisori-m.meteo.ru/waisori/index.xhtml?idata=2 (accessed on 21 January 2026). (In Russian).
- Liu, Q.; Yang, S.; Li, S.; Zhang, H.; Zhang, J.; Fan, H. The optimal applications of scPDSI and SPEI in characterizing meteorological drought, agricultural drought and terrestrial water availability on a global scale. Sci. Total Environ. 2024, 952, 175933.
- Wells, N.; Goddard, S.; Hayes, M.J. A self-calibrating Palmer Drought Severity Index. J. Clim. 2004, 17, 2335–2351.
- Beguería, S.; Vicente-Serrano, S.M. SPEI: Calculation of the Standardized Precipitation-Evapotranspiration Index. 2023. Available online: https://spei.csic.es. https://github.com/sbegueria/SPEI (accessed on 21 January 2026).
- Beguería, S.; Vicente-Serrano, S.M. SPEI: [R package]. Available online: https://cran.r-project.org/web/packages/SPEI (accessed on 21 January 2026).
- RStudio Desktop: [Software]. Available online: https://posit.co/download/rstudio-desktop (accessed on 21 January 2026).
- CRAN (RStudio mirror): [Repository]. Available online: https://cran.rstudio.com/ (accessed on 21 January 2026).
- scPDSI: [Software repository]. Available online: https://github.com/Sibada/scPDSI (accessed on 21 January 2026).
- Muñoz Sabater, J. ERA5-Land monthly averaged data from 1950 to present. Copernicus Climate Change Service (C3S) Climate Data Store (CDS), 2019. Available online: https://cds.climate.copernicus.eu/datasets/reanalysis-era5-land-monthly-means?tab=overview (accessed on 21 January 2026).
- GRACE Data Analysis Tool: [Online data service]. Available online: https://grace.jpl.nasa.gov/data/data-analysis-tool/ (accessed on 21 January 2026).
- Landerer, F.W.; Swenson, S.C. Accuracy of scaled GRACE terrestrial water storage estimates. Water Resour. Res. 2012, 48, W04531. [CrossRef]
- Wahr, J.; Molenaar, M.; Bryan, F. Time-variability of the Earth’s gravity field: Hydrological and oceanic effects and their possible detection using GRACE. J. Geophys. Res. 1998, 103(B12), 30205–30229. [CrossRef]
- Middendorf, K.; Dobslaw, H.; Jensen, L.; Eicker, A. Return levels of dry extreme events in terrestrial water storage from satellite gravimetry and CMIP6 global coupled climate models. J. Geophys. Res. Solid Earth 2025, 130(10), e2024JB031011. [CrossRef]
- Cheng, Y.; An, Q.; Liu, L.; Li, H.; Huang, G. Spatially distinct drought patterns and influencing factors across China: A machine learning approach with a comprehensive index. Ecol. Indic. 2025, 179, 114170. [CrossRef]
- Barbosa, S.A.; Jones, N.L.; Williams, G.P.; Teklu, H.; Yidana, S.M.; Pulla, S.T.; Sanchez, J.L.; Nelson, E.J.; Ames, D.P.; Miller, A.W. A multi-source approach to groundwater storage and recharge assessment in the Volta Basin. Sci. Total Environ. 2025, 1001, 180421. [CrossRef]
- Wang, Z.; Bi, Y.; Yang, F.; Zheng, J.; Yang, Y.; Zhang, S. Research of spatial-temporal variation and correlation of water storage and vegetation coverage in the Loess Plateau. Remote Sens. 2025, 17(17), 2983. [CrossRef]
- Kharuk, V.I.; Im, S.T.; Dvinskaya, M.L.; Golyukov, A.S.; Ranson, K.J. Climate-induced mortality of spruce stands in Belarus. Environ. Res. Lett. 2015, 10(12), 125006. [CrossRef]
- Kharuk, V.I.; Im, S.T.; Petrov, I.A.; Shvetsov, E.G. Permafrost Degradation and Vegetation Growth Beyond the Polar Circle in Siberia. Forests 2025, 16(1), 47. [CrossRef]
- Voldoire, A.; Saint-Martin, D.; Sénési, S.; Decharme, B.; Alias, A.; Chevallier, M.; Colin, J.; Guérémy, J.-F.; Michou, M.; Moine, M.-P.; Nabat, P.; Roehrig, R.; Salas y Mélia, D.; Séférian, R.; Valcke, S.; Beau, I.; Belamari, S.; Berthet, S.; Cassou, C.; Cattiaux, J.; Deshayes, J.; Douville, H.; Ethé, C.; Franchistéguy, L.; Geoffroy, O.; Lévy, C.; Madec, G.; Meurdesoif, Y.; Msadek, R.; Ribes, A.; Sanchez-Gomez, E.; Terray, L.; Waldman, R. Evaluation of CMIP6 DECK experiments with CNRM-CM6-1. J. Adv. Model. Earth Syst. 2019, 11(7), 2177–2213. [CrossRef]
- IPCC Interactive Atlas: [Online atlas]. Available online: https://interactive-atlas.ipcc.ch/ (accessed on 21 January 2026).
- Gutiérrez, J.M.; Jones, R.G.; Narisma, G.T.; Alves, L.M.; Amjad, M.; Gorodetskaya, I.V.; Grose, M.; Klutse, N.A.B.; Krakovska, S.; Li, J.; Martínez-Castro, D.; Mearns, L.O.; Mernild, S.H.; Ngo-Duc, T.; van den Hurk, B.; Yoon, J.H. Climate Change 2021: The Physical Science Basis. Contribution of Working Group I to the Sixth Assessment Report of the Intergovernmental Panel on Climate Change (Masson-Delmotte, V.; Zhai, P.; et al., Eds.); Cambridge University Press: Cambridge, UK, and New York, NY, USA, 2021; Interactive Atlas. Available online: https://interactive-atlas.ipcc.ch/ (accessed on 21 January 2026).
- IPCC. Climate Change 2023: Synthesis Report. Contribution of Working Groups I, II and III to the Sixth Assessment Report of the Intergovernmental Panel on Climate Change (Core Writing Team; Lee, H.; Romero, J., Eds.); IPCC: Geneva, Switzerland, 2023. Available online: https://www.ipcc.ch/report/ar6/syr/downloads/report/IPCC_AR6_SYR_FullVolume.pdf (accessed on 21 January 2026).
- Agisoft: [Company website]. Available online: https://www.agisoft.com/ (accessed on 21 January 2026).
- Google Earth: [Web-based interactive mapping service]. Available online: https://earth.google.com/web/ (accessed on 21 January 2026).
- Tree-Ring Laboratory Software Resources: [Web page]. Available online: https://www.ldeo.columbia.edu/tree-ring-laboratory/resources/software (accessed on 21 January 2026).
- Holmes, R.L. Computer-assisted quality control in tree-ring dating and measurement. Tree-Ring Bull. 1983, 44, 69–75.
- Tree-Ring Laboratory: Software Resources. Available online: https://www.ldeo.columbia.edu/tree-ring-laboratory/resources/software (accessed on 21 January 2026).
- Cook, E.R.; Holmes, R.L. Chronology Development, Statistical Analysis. Guide for Computer Program ARSTAN; Lab. of Tree Ring Res., the University of Arizona: Tucson, AZ, USA, 1986, pp. 50–65.
- Speer, J.H. Fundamentals of Tree-Ring Research; University of Arizona Press: Tucson, AZ, USA, 2010.
- Running, S.W.; Zhao, M. User’s Guide Daily GPP and Annual NPP (MOD17A2H/A3H) and Year-end Gap-Filled (MOD17A2HGF/A3HGF) Products NASA Earth Observing System MODIS Land Algorithm (For Collection 6.1); 2021. Available online: https://lpdaac.usgs.gov/documents/972/MOD17_User_Guide_V61.pdf (accessed on 21 January 2026).
- MOD17A2H V006: [Data product]. Available online: https://lpdaac.usgs.gov/products/mod17a2hv006 (accessed on 21 January 2026).
- NASA Earthdata: [Data portal]. Available online: https://www.earthdata.nasa.gov/ (accessed on 21 January 2026).
- exactextract: [Software repository]. Available online: https://isciences.github.io/exactextract/ (accessed on 21 January 2026).
- exactextract [Python package]. Available online: https://pypi.org/project/exactextract/ (accessed on 21 January 2026).
- pymannkendall [Python package]. Available online: https://pypi.org/project/pymannkendall/ (accessed on 21 January 2026).
- Hussain, M.; Mamouei, M.; Khatibi, R. pyMannKendall: A Python package for non-parametric Mann-Kendall family of trend tests. J. Open Source Softw. 2019, 4(39), 1556. [CrossRef]
- SciPy: [Scientific computing software]. Available online: https://scipy.org/ (accessed on 21 January 2026).
- StatSoft: [Statistical software and solutions provider]. Available online: http://statsoft.ru/ (accessed on 21 January 2026).
- R Project: [Free software environment for statistical computing and graphics]. Available online: https://www.r-project.org/ (accessed on 21 January 2026).
- Posit: [Software and tools for data science and R/Python development]. Available online: https://posit.co/ (accessed on 21 January 2026).
- Kharuk, V.I.; Petrov, I.A.; Im, S.T.; Golyukov, A.S.; Dvinskaya M. L.; Shushpanov, A.S. Tree clusters migration into alpine tundra, Siberia. J. Mountain Sci. 2022, 19(12), 3426–3440. [CrossRef]
- Lyu, H., Zhang, X., Su, J. et al. Warming overwhelms CO2-driven drought mitigation in alpine vegetation on the Qinghai-Tibetan Plateau. Commun. Earth Environ. 2026. [CrossRef]
- Juřička, D.; Novotná, J.; Houška, J.; Pařílková, J.; Hladký, J.; Pecina, V.; et al. Large-scale permafrost degradation as a primary factor in Larix sibirica forest dieback in the Khentii massif, northern Mongolia. J. For. Res. 2020, 31(1), 197–208. [CrossRef]
- Kharuk, V.I.; Petrov, I.A.; Shushpanov, A.S.; Im, S.T.; Ondar, S.O. Scots Pine at Its Southern Range in Siberia: A Combined Drought and Fire Influence on Tree Vigor, Growth, and Regeneration. Forests 2025, 16, 819. [CrossRef]
- Petrov, I.A.; Kharuk, V.I.; Shushpanov, A.S.; et al. Scots Pine (Pinus sylvestris L.) on the Southern Border of Its Range in Siberia: Growth Dynamics under Changing Climate Conditions. Contemp. Probl. Ecol. 2025, 18, 983. [CrossRef]
- Liu, H.; Williams, A.P.; Allen, C.D.; et al. Rapid warming accelerates tree growth decline in semi-arid forests of Inner Asia. Glob. Chang. Biol. 2013, 19, 2500–2510. [CrossRef]
- Wu, X.; Liu, H.; Guo, D.; Anenkhonov, O.A.; Badmaeva, N.K.; et al. Growth decline linked to warming-induced water limitation in hemi-boreal forests. PLoS ONE 2012, 7(8), e42619. [CrossRef]
- Boonman, C.C.F., Serra-Diaz, J.M., Hoeks S., et al. More than 17,000 tree species are at risk from rapid global change. Nat. Commun. 2024, 15, 166. [CrossRef]
- Boyd, M.A.; Berner, L.T.; Doak, P., Goetz, S. J.; Rogers, B.M.; Wagner, D.; Walker, X.J.; Mack, M.C. Impacts of climate and insect herbivory on productivity and physiology of trembling aspen (Populus tremuloides) in Alaskan boreal forests. Environ. Res. Lett. 2019, 14, 085010. [CrossRef]
- Buryak, L.V.; Kalenskaya, O.P.; Kukavskaya, E.A.; Luzganov, A.G. Zonal and geographical features of the impact of fires on forest formation of light coniferous stands in the south of Siberia; Nauka: Novosibirsk, Russia, 2022. (In Russian).
- Verhoeven, D.; de Boer, W.F.; Henkens, R.J.H.G.; Sass-Klaassena, U.G.W. Water availability as driver of birch mortality in Hustai National Park, Mongolia. Dendrochronologia 2018, 49, 127–133. [CrossRef]
- Kharuk V.I.; Kuzmichev V.V.; Im S.T.; Ranson K.J. Birch stands growth increase in Western Siberia. Scand. J. For. Res. 2014, 29(5), 421–426. [CrossRef]
- Martínez-Vilalta, J.; Lloret, F.; Breshears, D.D. Drought-induced forest decline: Causes, scope and implications. Biol. Lett. 2012, 8, 689–691. [CrossRef]
- Millar, C.I.; Stephenson, N.L. Temperate forest health in an era of emerging megadisturbance. Science 2015, 349, 823–826. [CrossRef]
- Davis, F.W.; Parkinson, A.-M.; Moritz, M.A.; Isaac, W.; Park, C.M.; D’Antonio, C.M. Increasing vulnerability of an endemic Mediterranean-climate conifer to changing climate and fire regime. Front. For. Glob. Change 2025, 8, 1516623. [CrossRef]
Figure 1.
Location of the study sites: 1 – “Tes-Hem”, 2 – “Kara-Haya”.
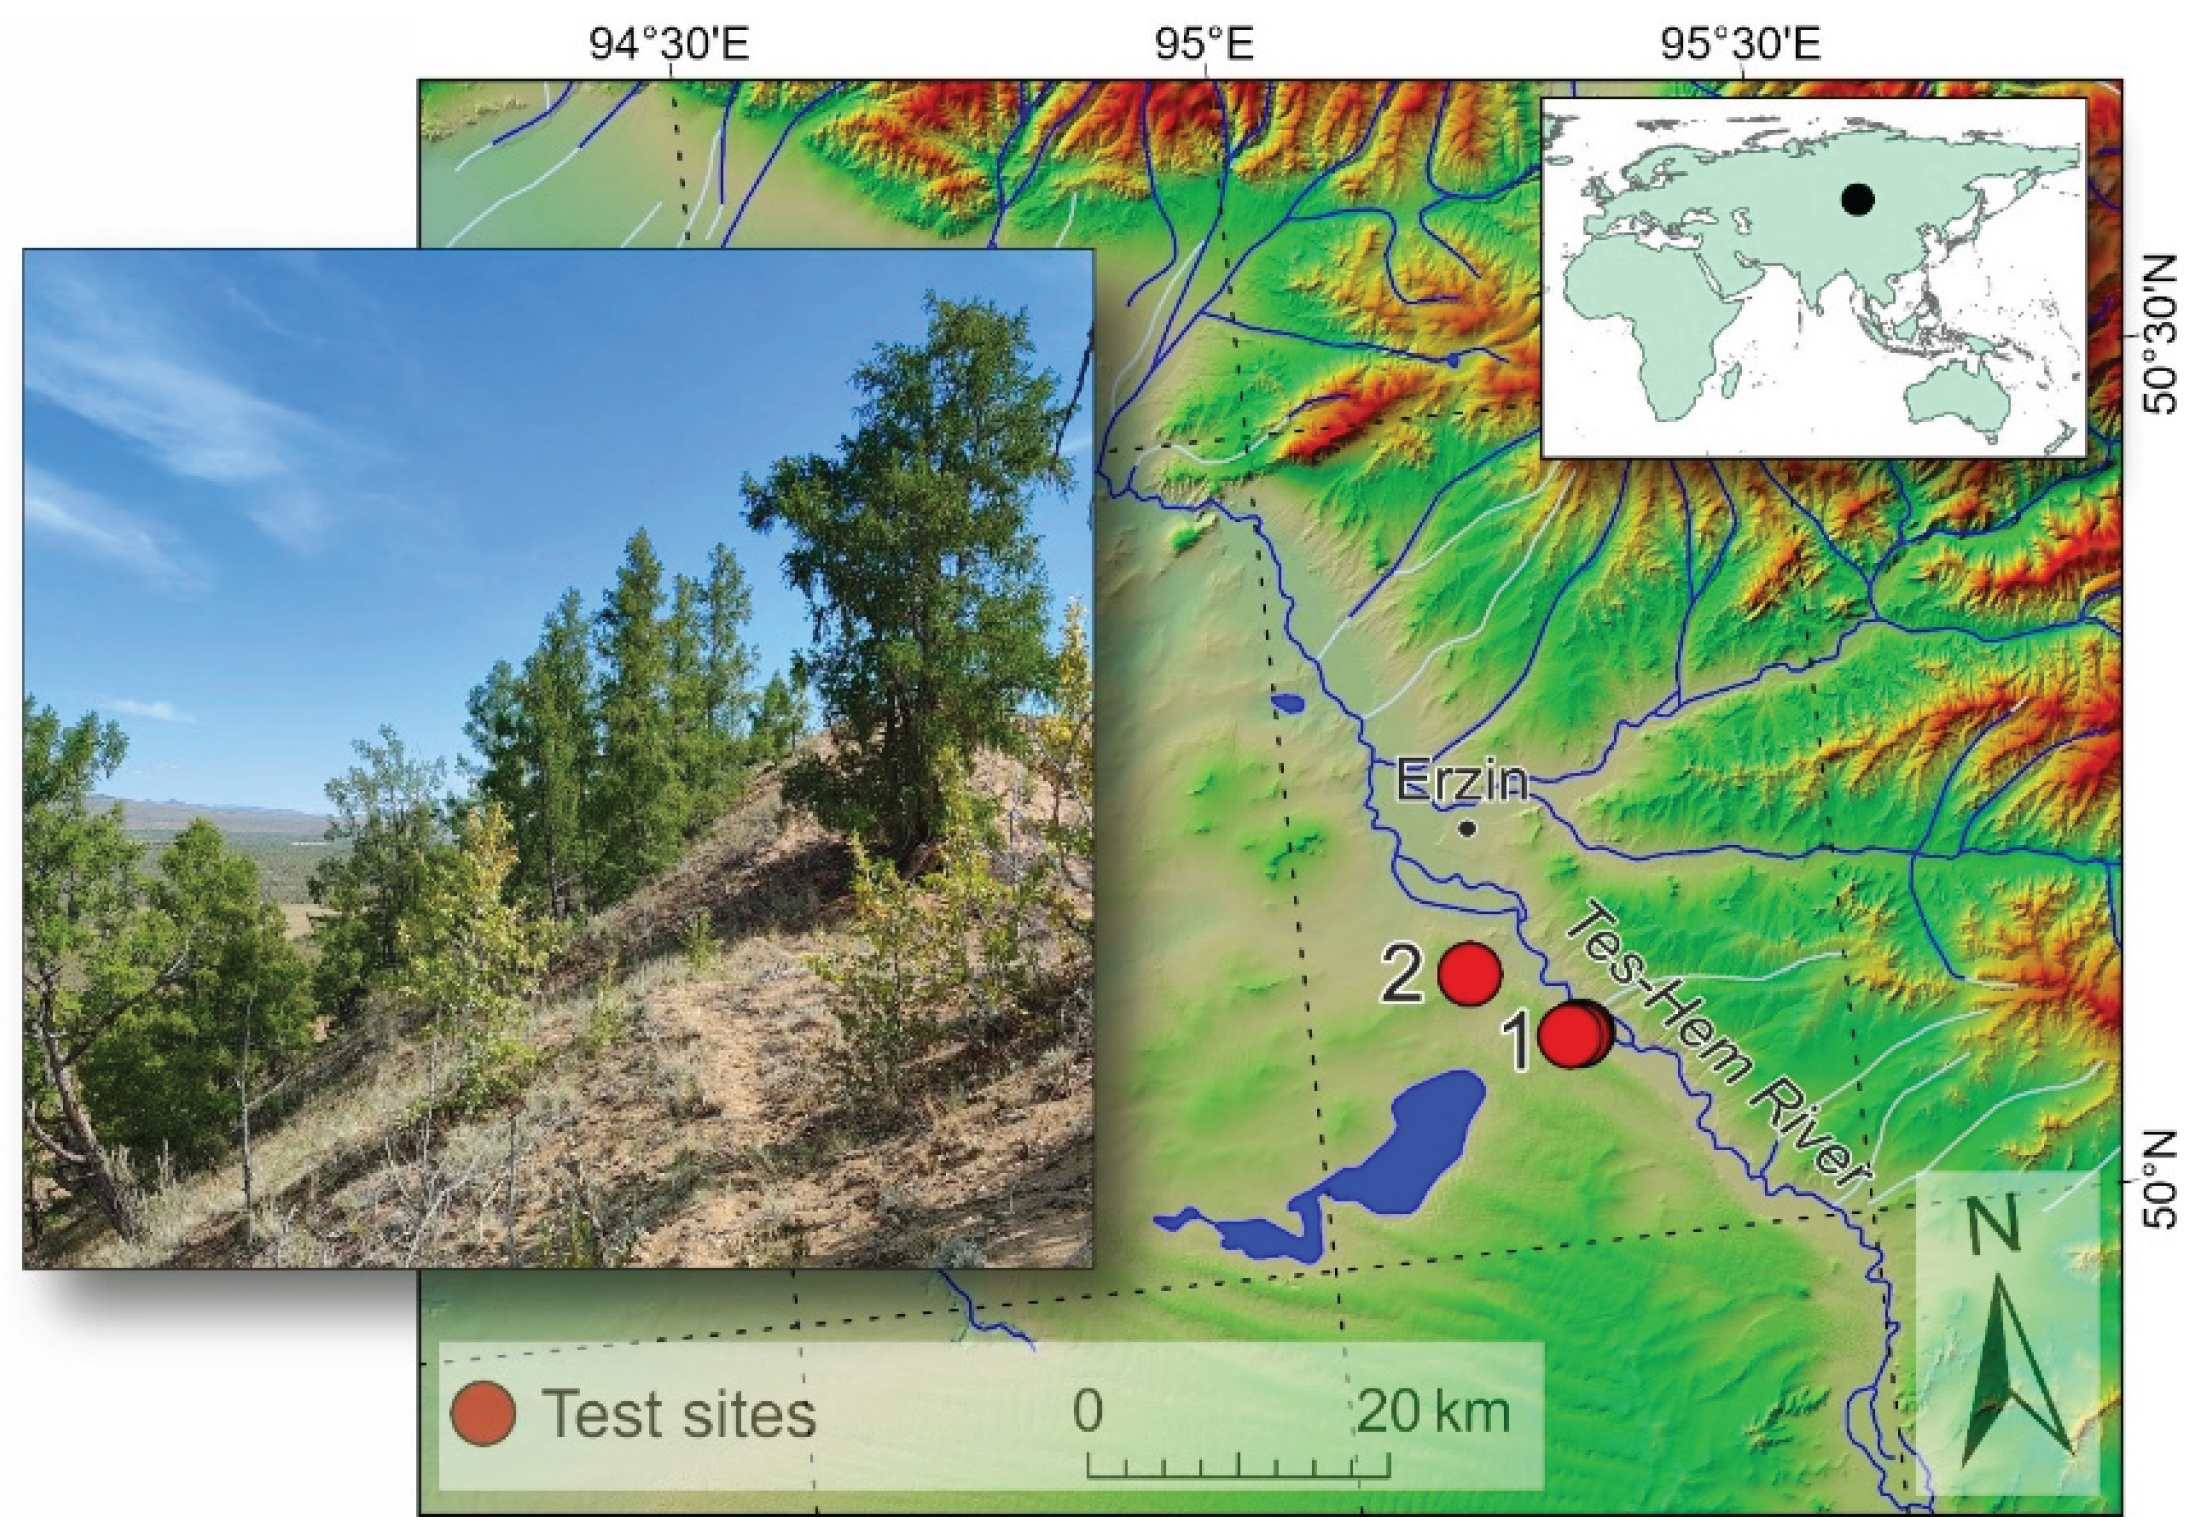
Figure 2.
(a, b) Old-growth larch and poplar trees and regeneration; (c) mature poplar and regeneration; (d) a specimen of a fossil old-growth polar tree with an estimated age of >300 years.
Figure 2.
(a, b) Old-growth larch and poplar trees and regeneration; (c) mature poplar and regeneration; (d) a specimen of a fossil old-growth polar tree with an estimated age of >300 years.
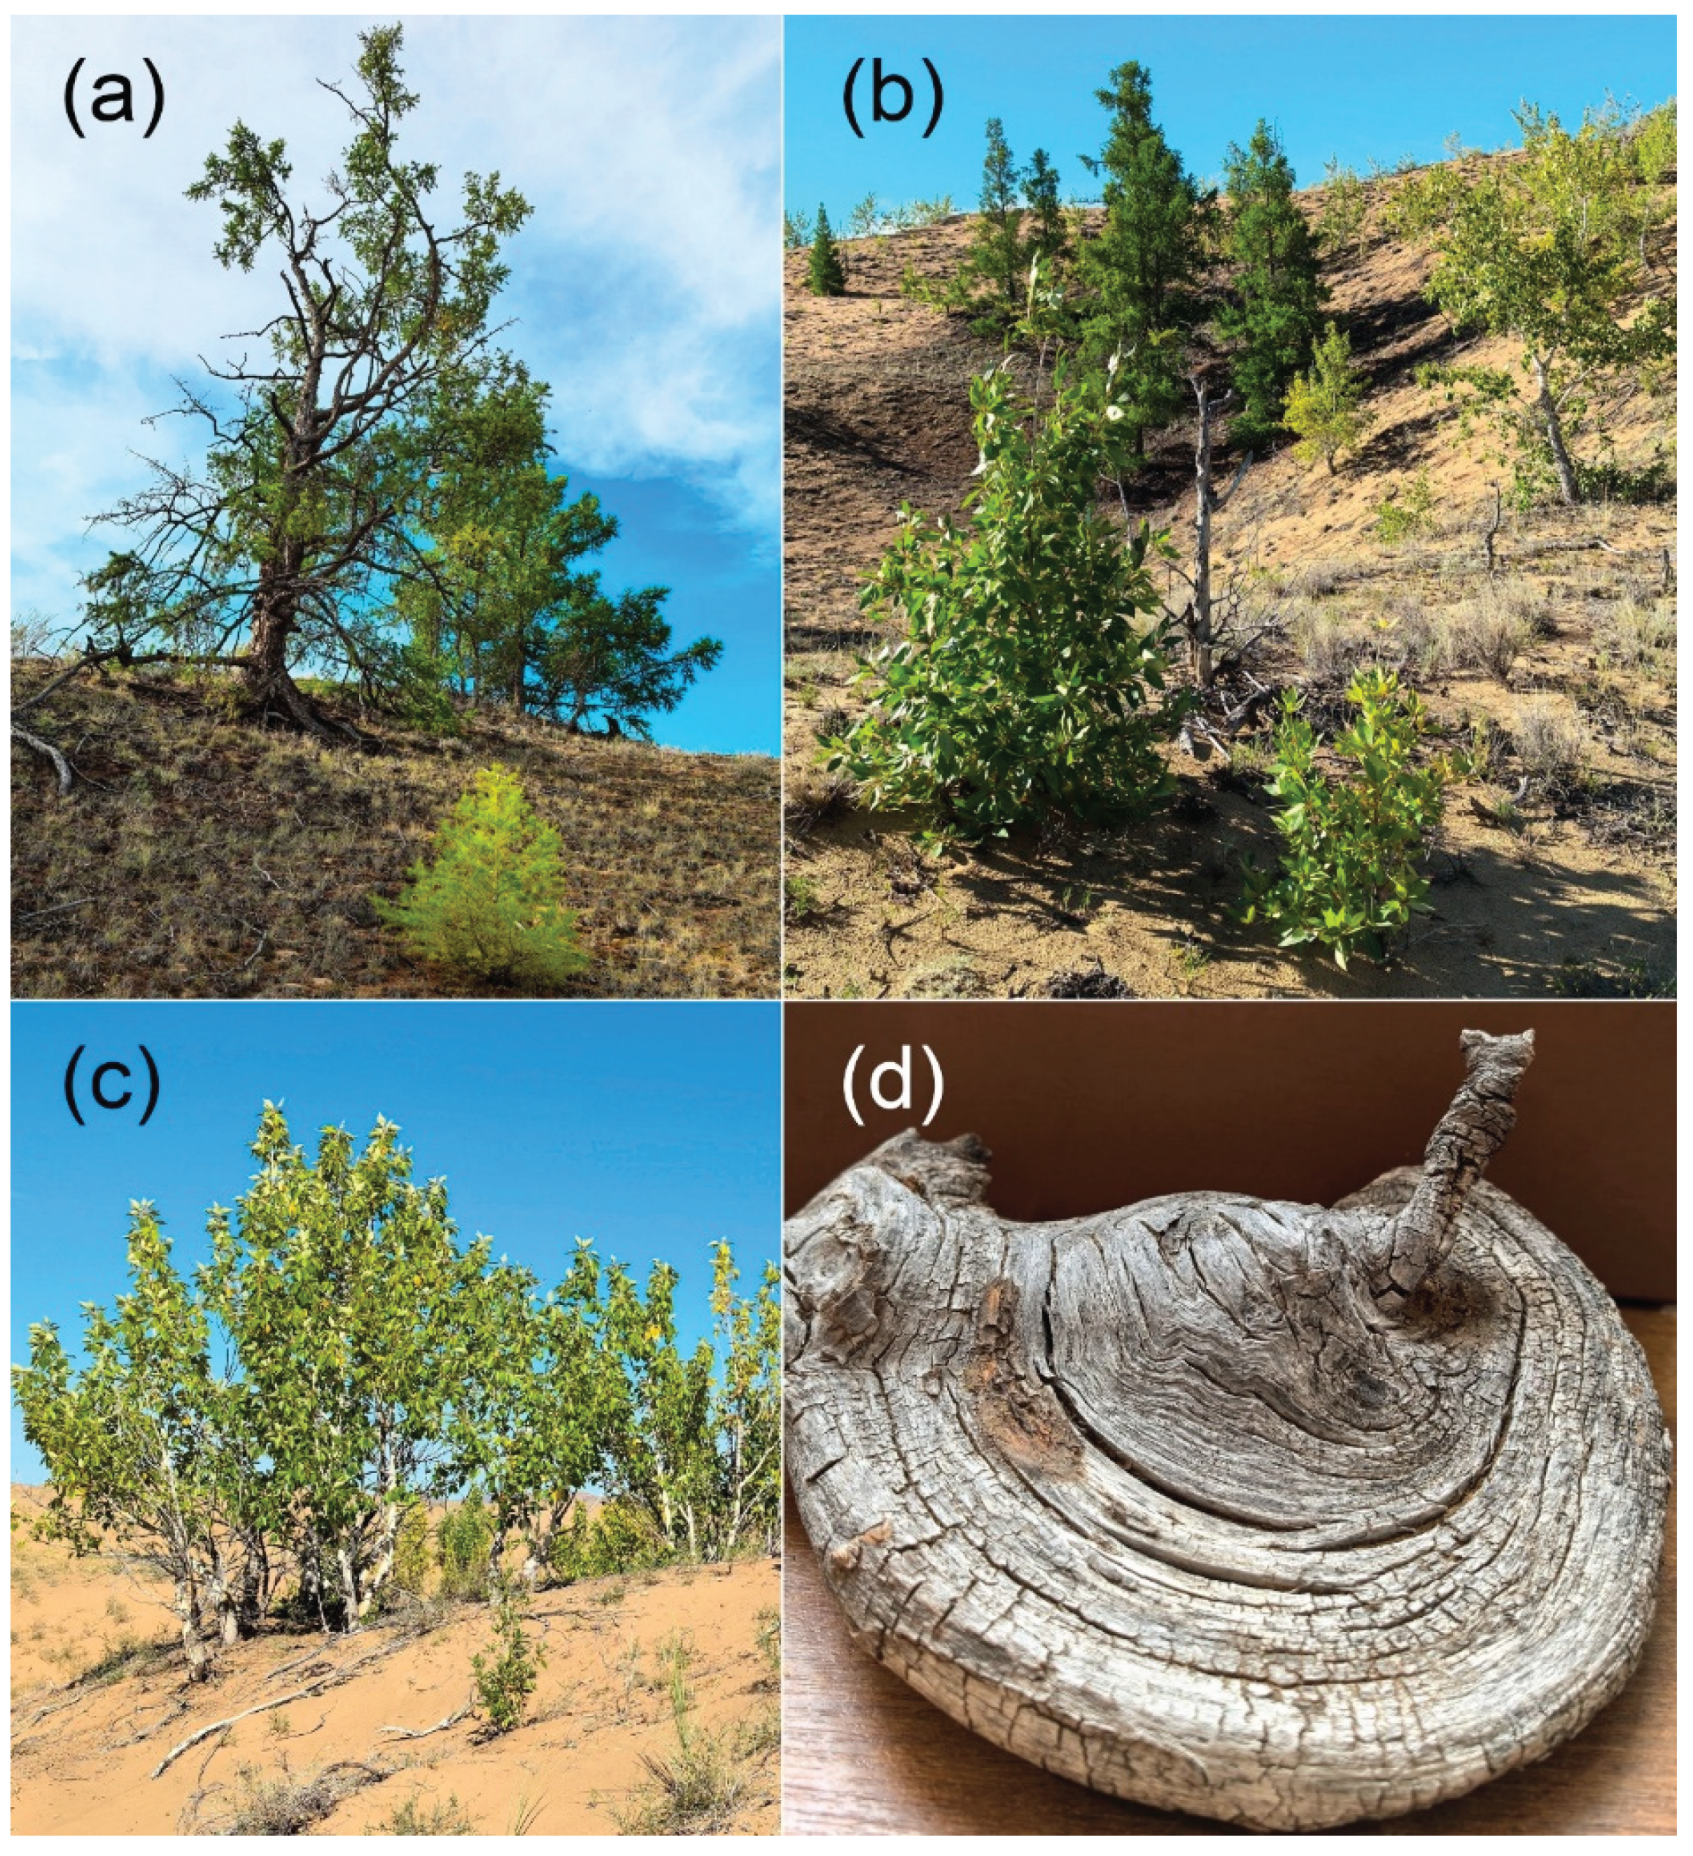
Figure 3.
(a) Air temperatures have risen since c. 1980. (b-e) Minimum atmospheric (SPEI) and soil (scPDSI) drought levels were observed in 1985–1990 years and during the last decade (shown by ovals). Note: a decrease in SPEI and scPDSI values indicates a drought increase. Trends are significant at p < 0.05.
Figure 3.
(a) Air temperatures have risen since c. 1980. (b-e) Minimum atmospheric (SPEI) and soil (scPDSI) drought levels were observed in 1985–1990 years and during the last decade (shown by ovals). Note: a decrease in SPEI and scPDSI values indicates a drought increase. Trends are significant at p < 0.05.
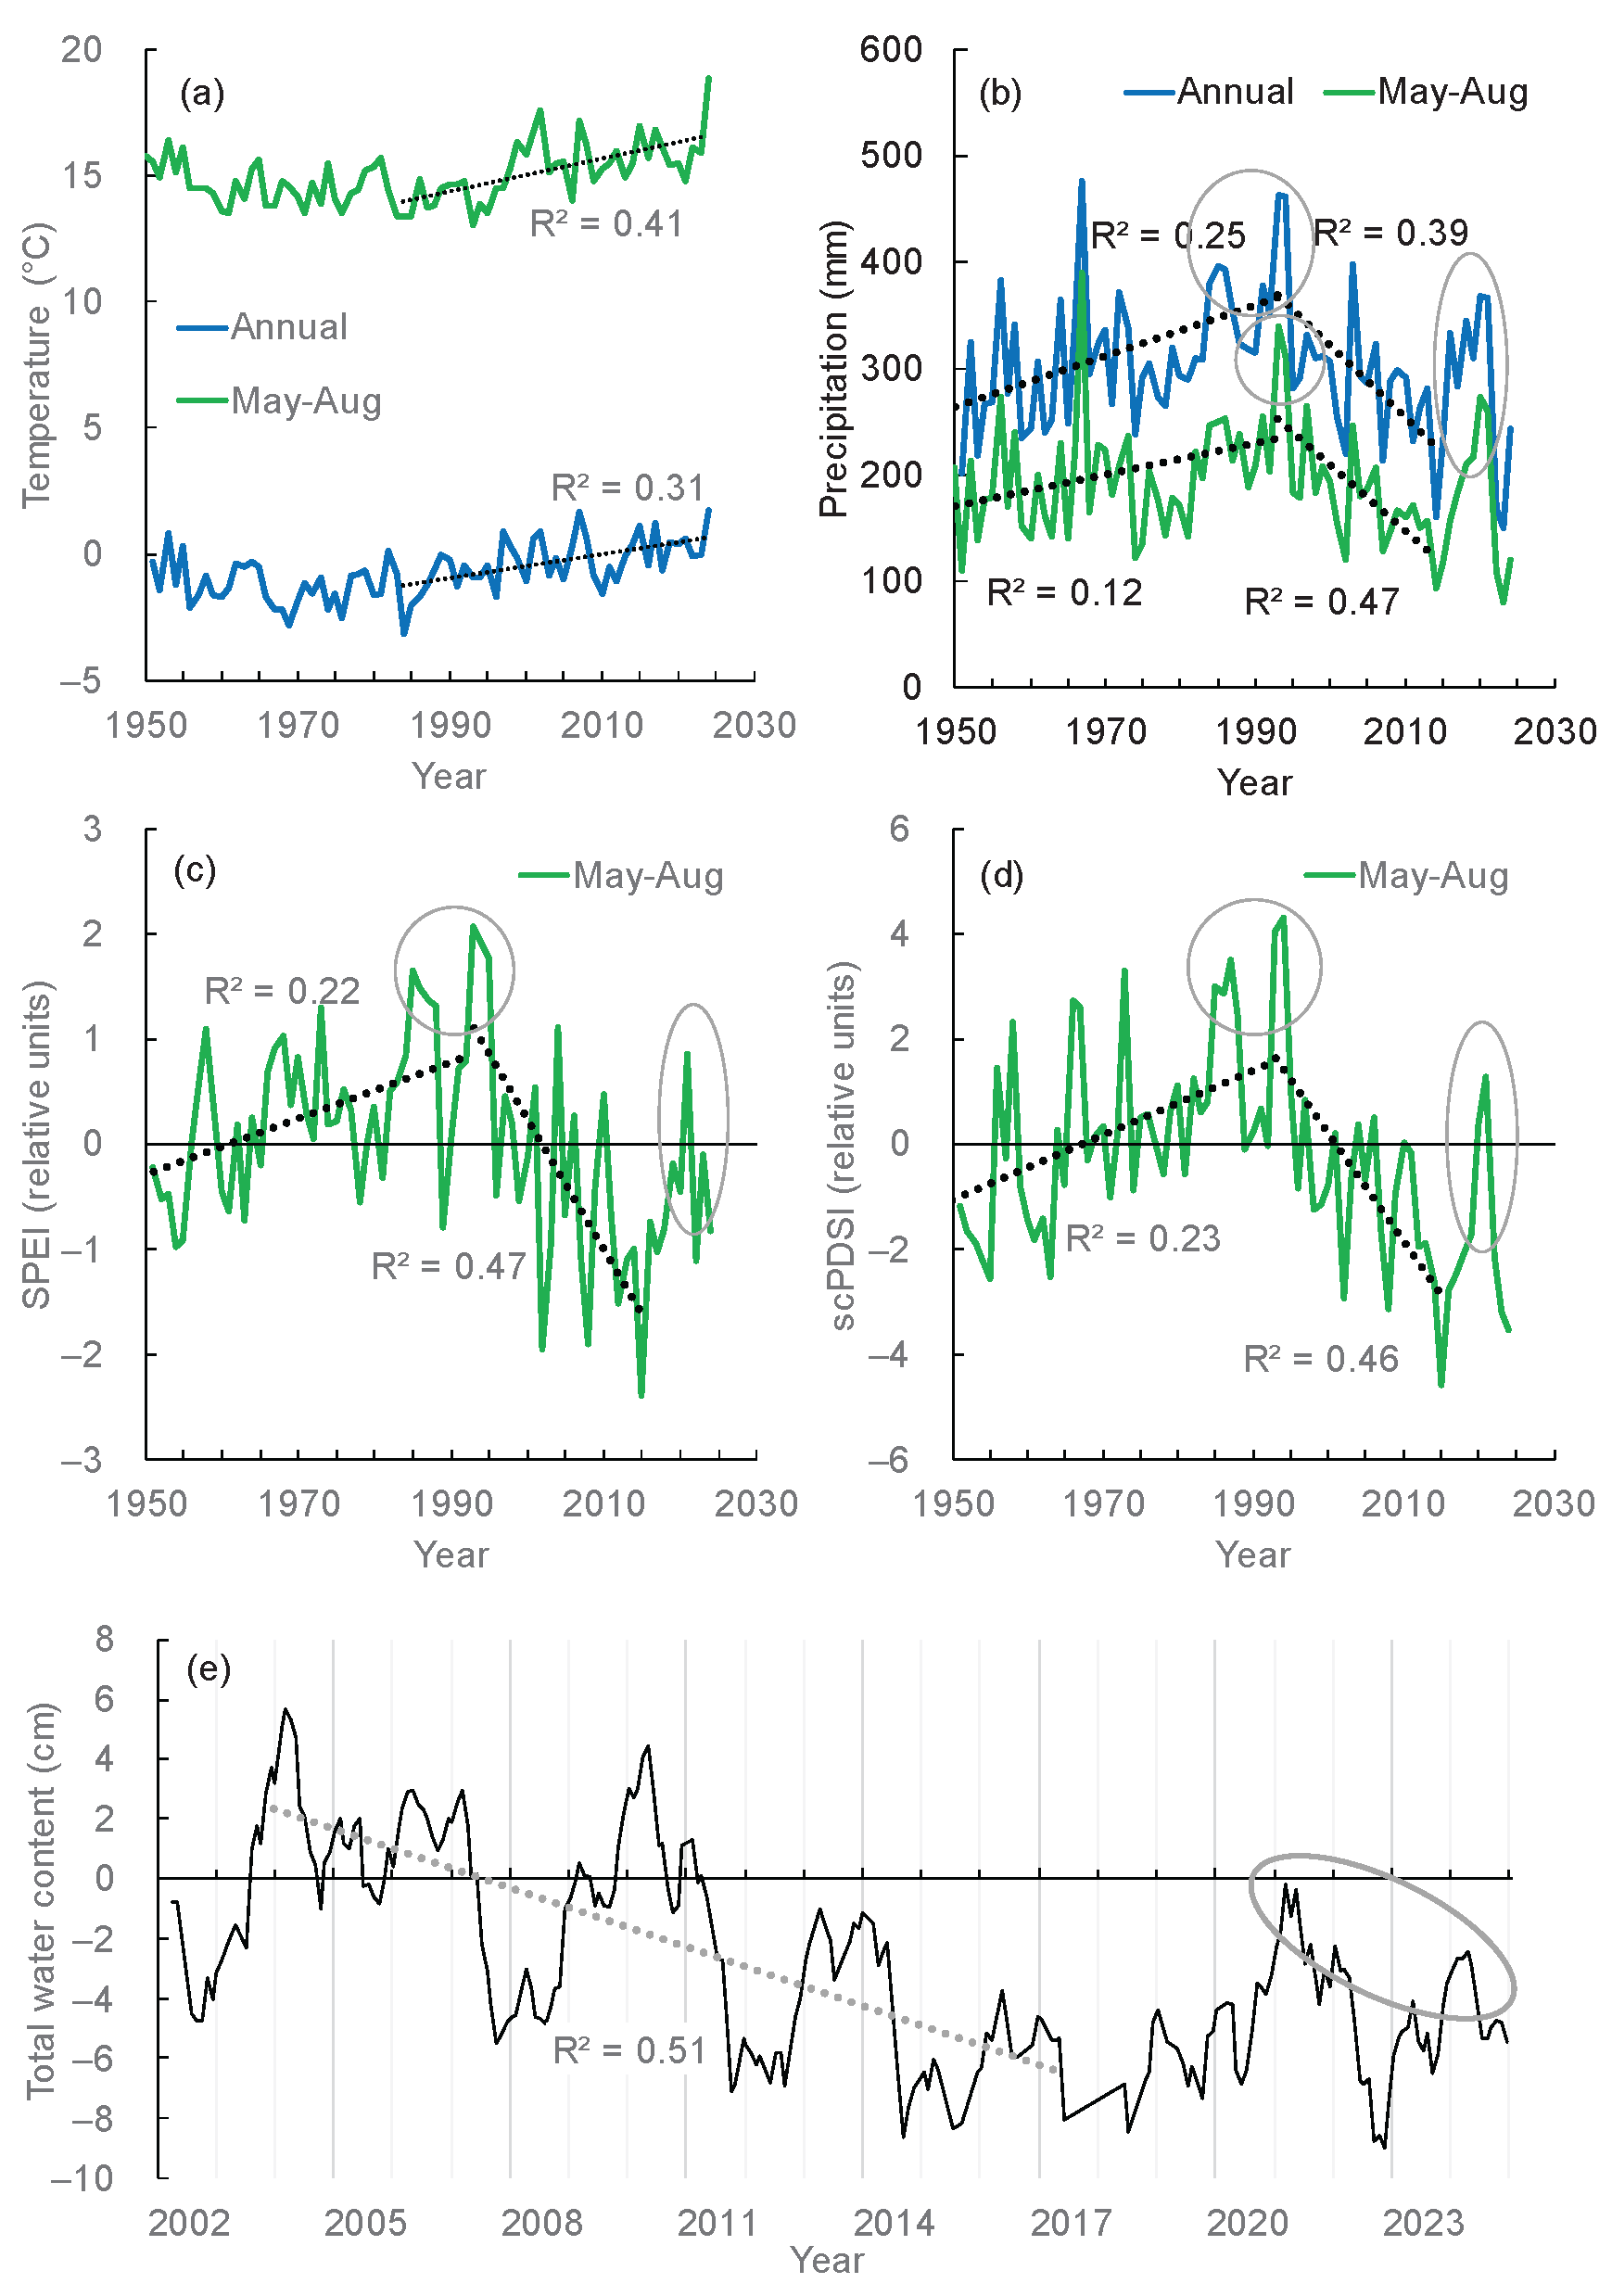
Figure 4.
Figure 4. (a) Prevailing winds blow from the west and northwest directions. (b) The maximum wind speed (up to 3.2 m s–1) occurs in December, whereas during May–September the speed falls to 0.6 ± 0.1 m s–1. (c) The maximum wind speed decreased from to 2.8 m s–1 (1975) to 2.3 m s–1 in 2024.
Figure 4.
Figure 4. (a) Prevailing winds blow from the west and northwest directions. (b) The maximum wind speed (up to 3.2 m s–1) occurs in December, whereas during May–September the speed falls to 0.6 ± 0.1 m s–1. (c) The maximum wind speed decreased from to 2.8 m s–1 (1975) to 2.3 m s–1 in 2024.
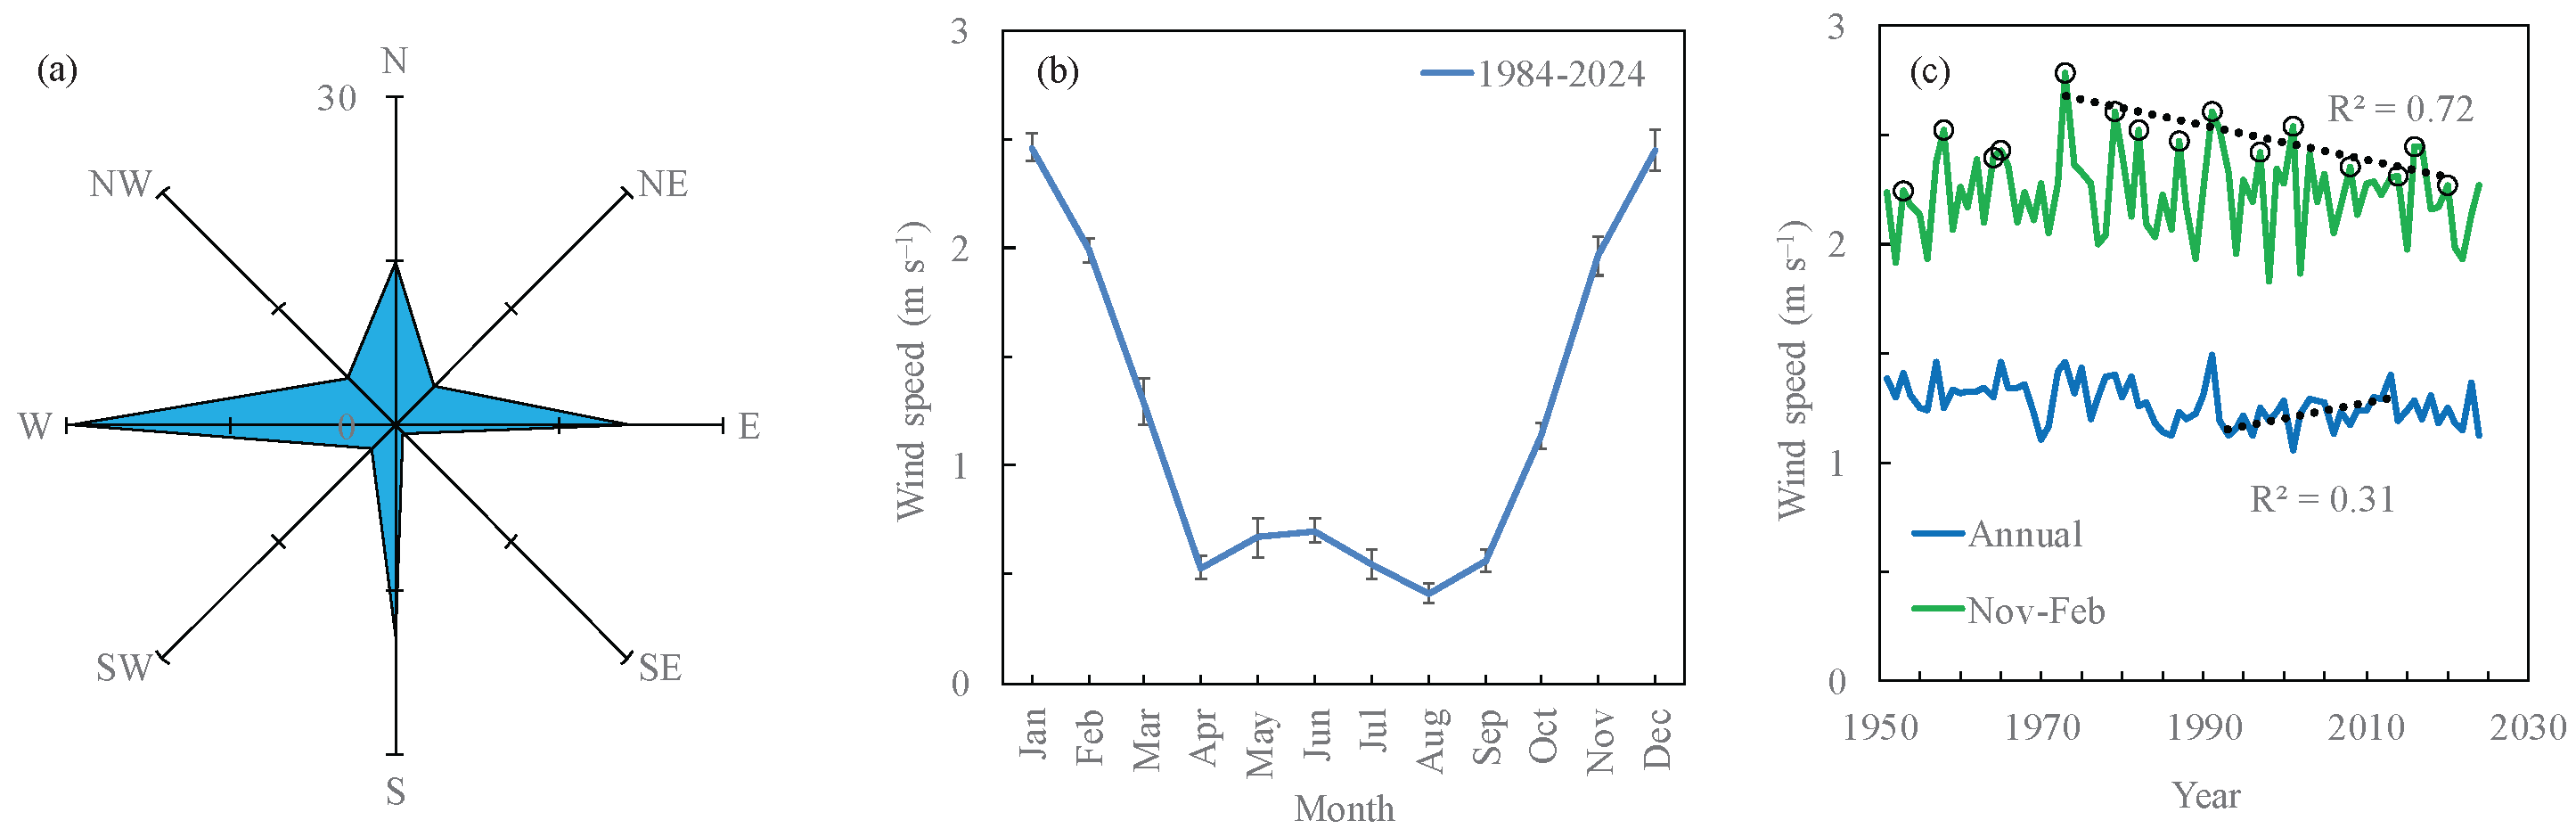
Figure 5.
The growth index of (a) old-growth larch and (c) young larch chronologies. (d) The poplar chronology is more stochastic in comparison with the larch chronology. A growth increase since the warming onset (c. 1980) switched to a decrease, followed by a subsequent increase in growth. Trends are significant at p < 0.05.
Figure 5.
The growth index of (a) old-growth larch and (c) young larch chronologies. (d) The poplar chronology is more stochastic in comparison with the larch chronology. A growth increase since the warming onset (c. 1980) switched to a decrease, followed by a subsequent increase in growth. Trends are significant at p < 0.05.
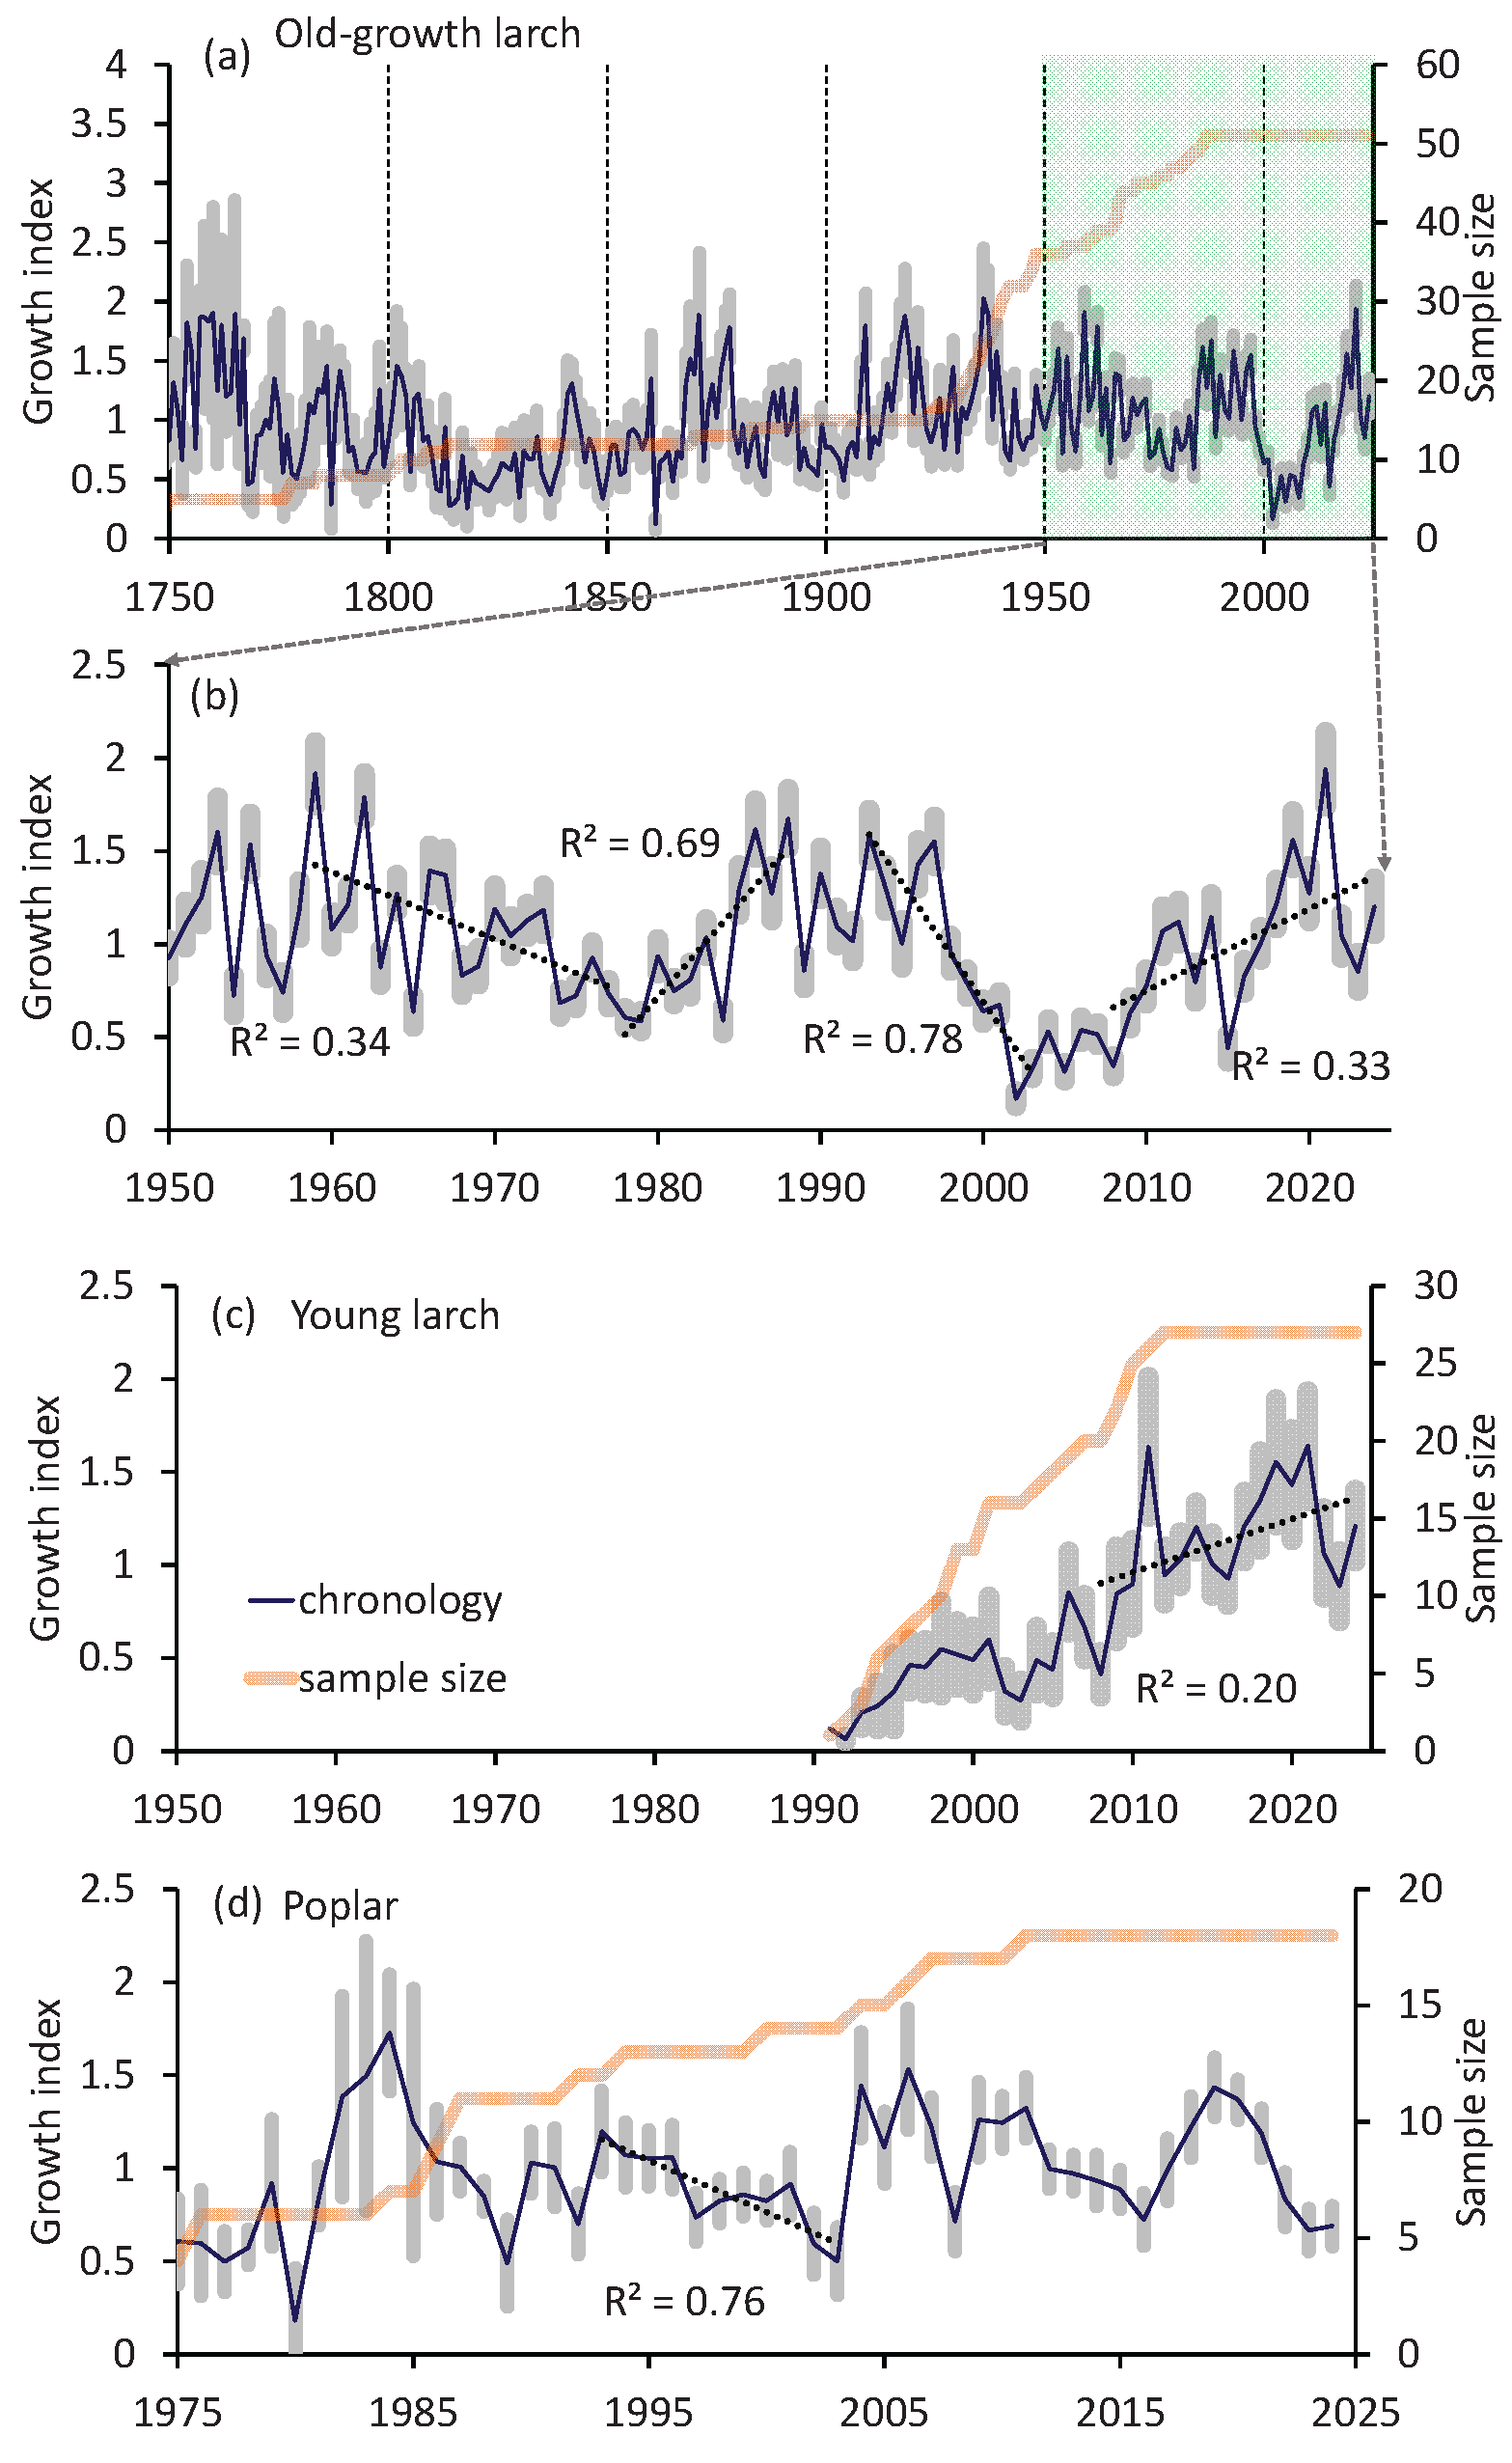
Figure 6.
(a) June-July temperatures impair young larch and poplar growth, whereas (b) June-July precipitation stimulates their growth. (c) Atmospheric and (d) soil droughts impair both species throughout the entire growth period. Old-growth larch is less sensitive to drought. Period: 2000–2024. Note: a decreases in SPEI and scPDSI values indicates a drought increase.
Figure 6.
(a) June-July temperatures impair young larch and poplar growth, whereas (b) June-July precipitation stimulates their growth. (c) Atmospheric and (d) soil droughts impair both species throughout the entire growth period. Old-growth larch is less sensitive to drought. Period: 2000–2024. Note: a decreases in SPEI and scPDSI values indicates a drought increase.
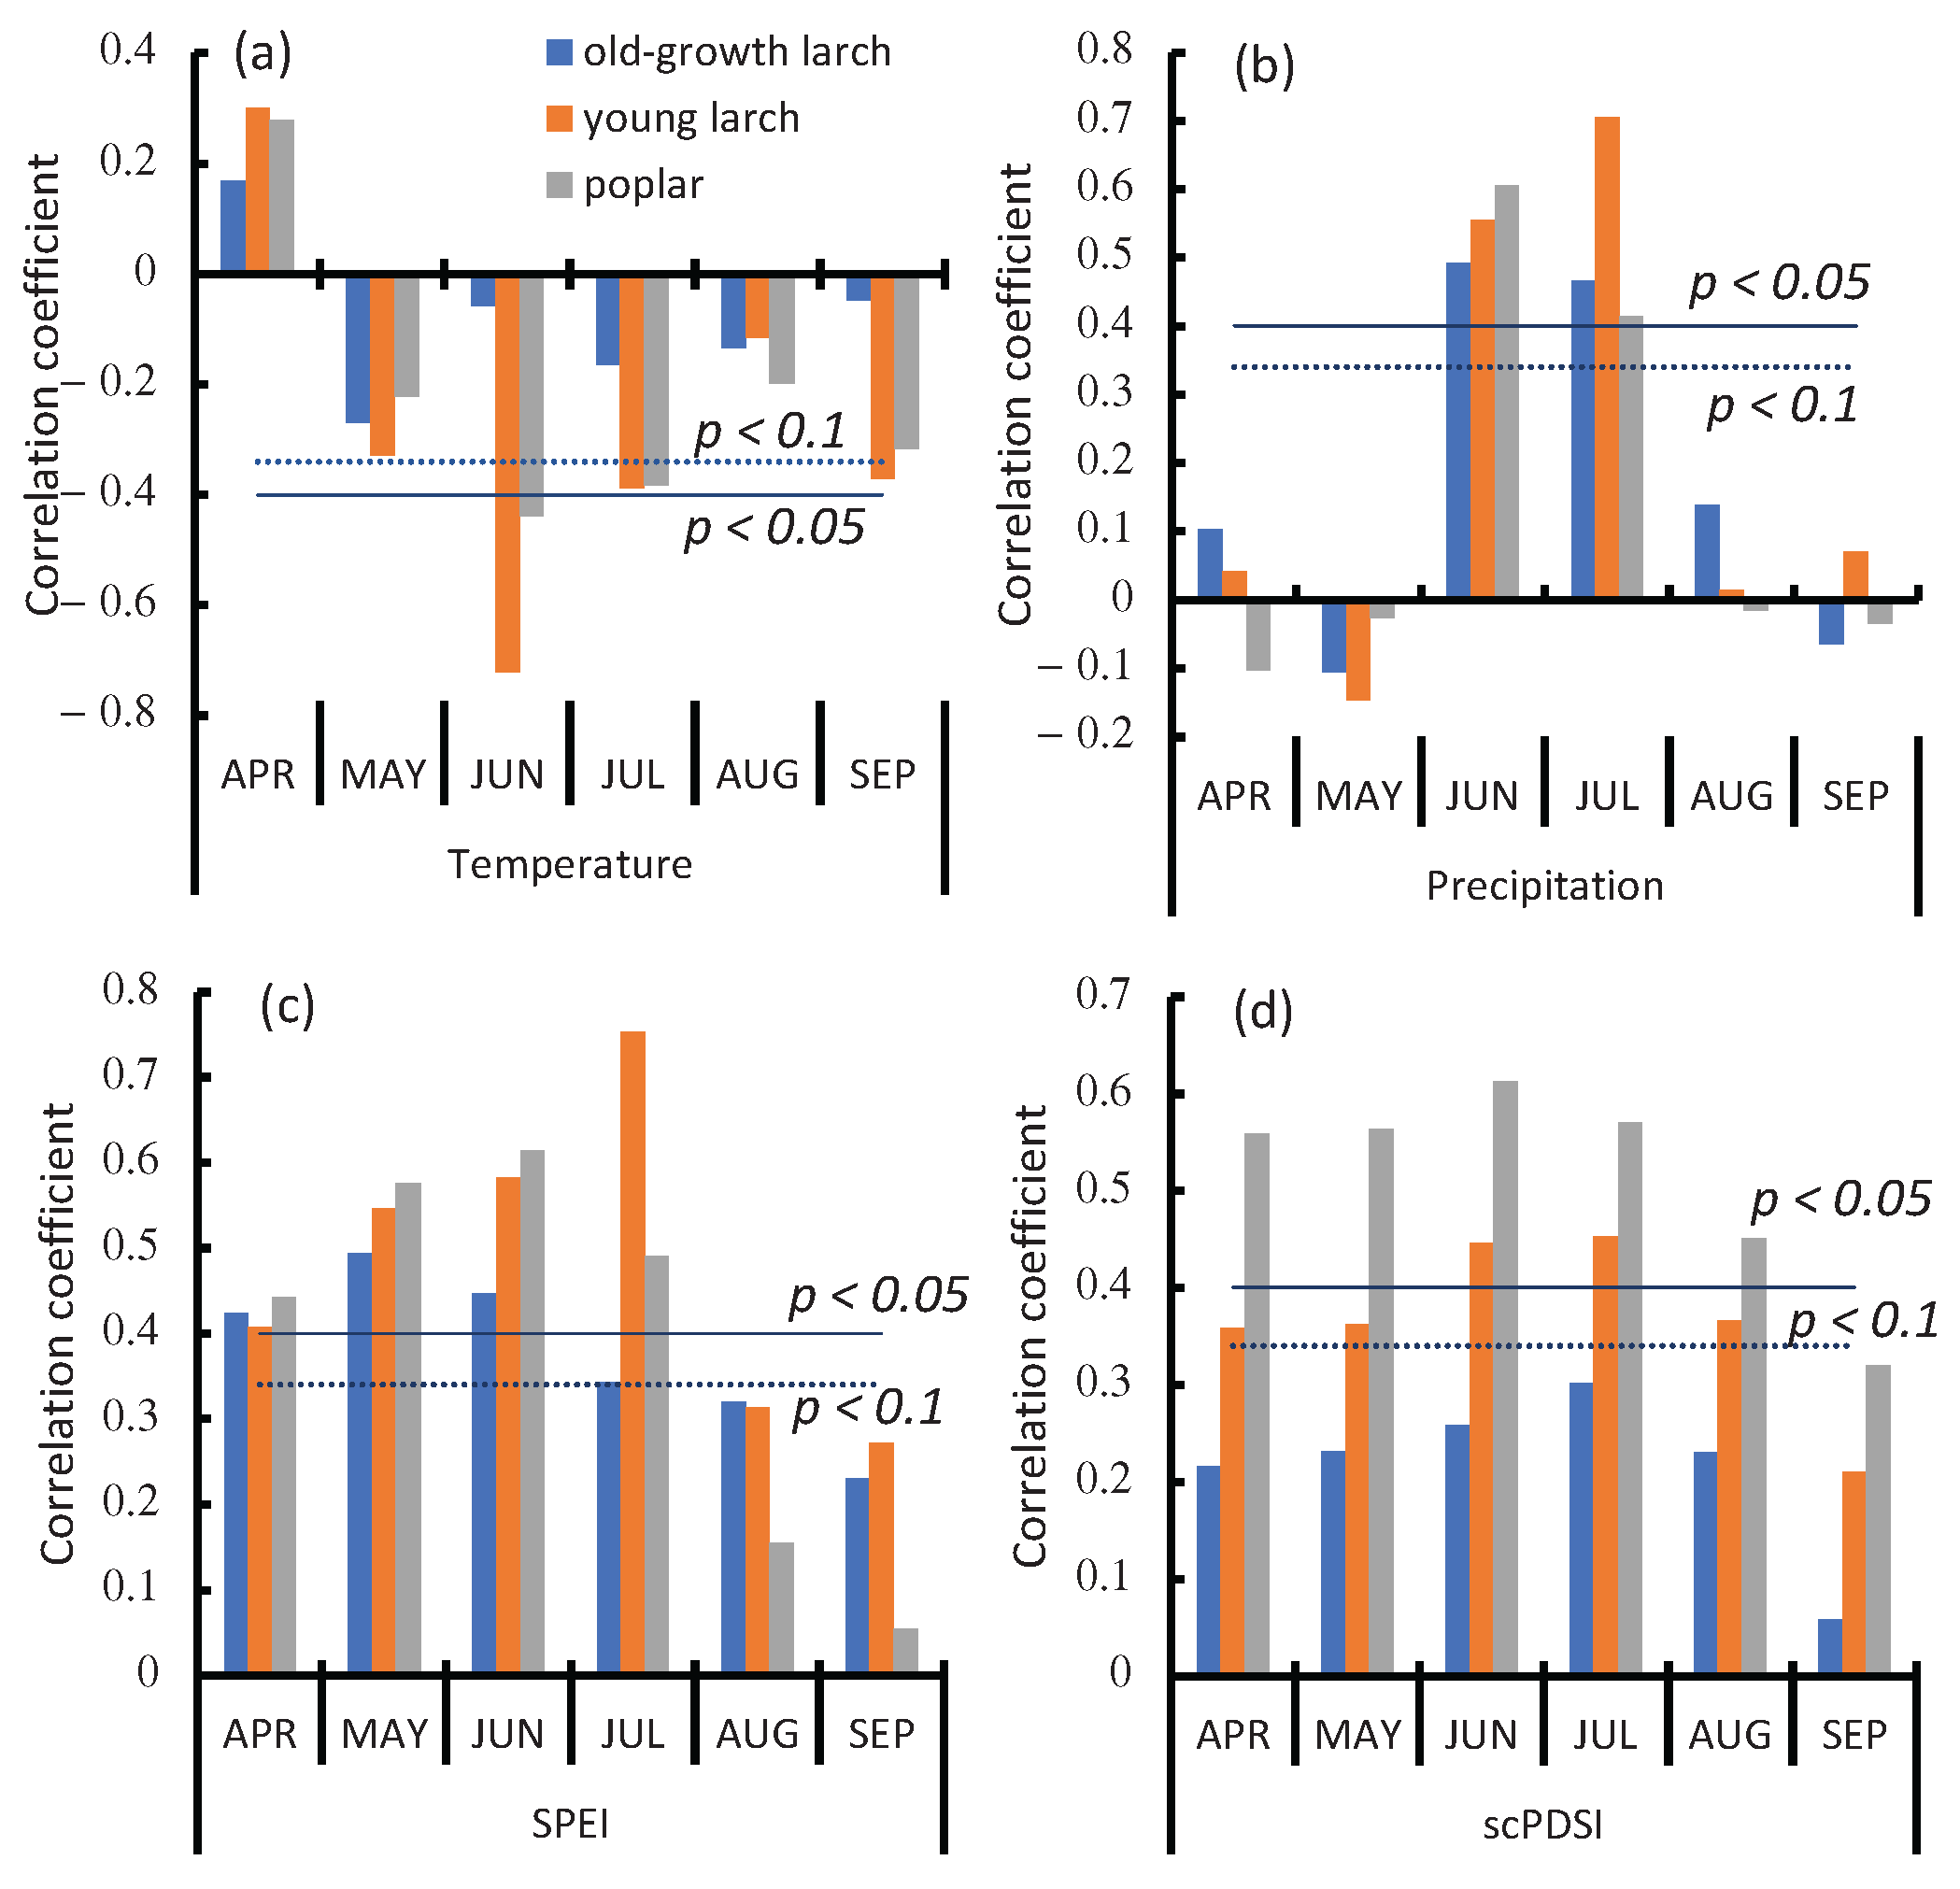
Figure 7.
The growth index of larch trees is impaired by summer (July) winds. Period: 1970–2024.
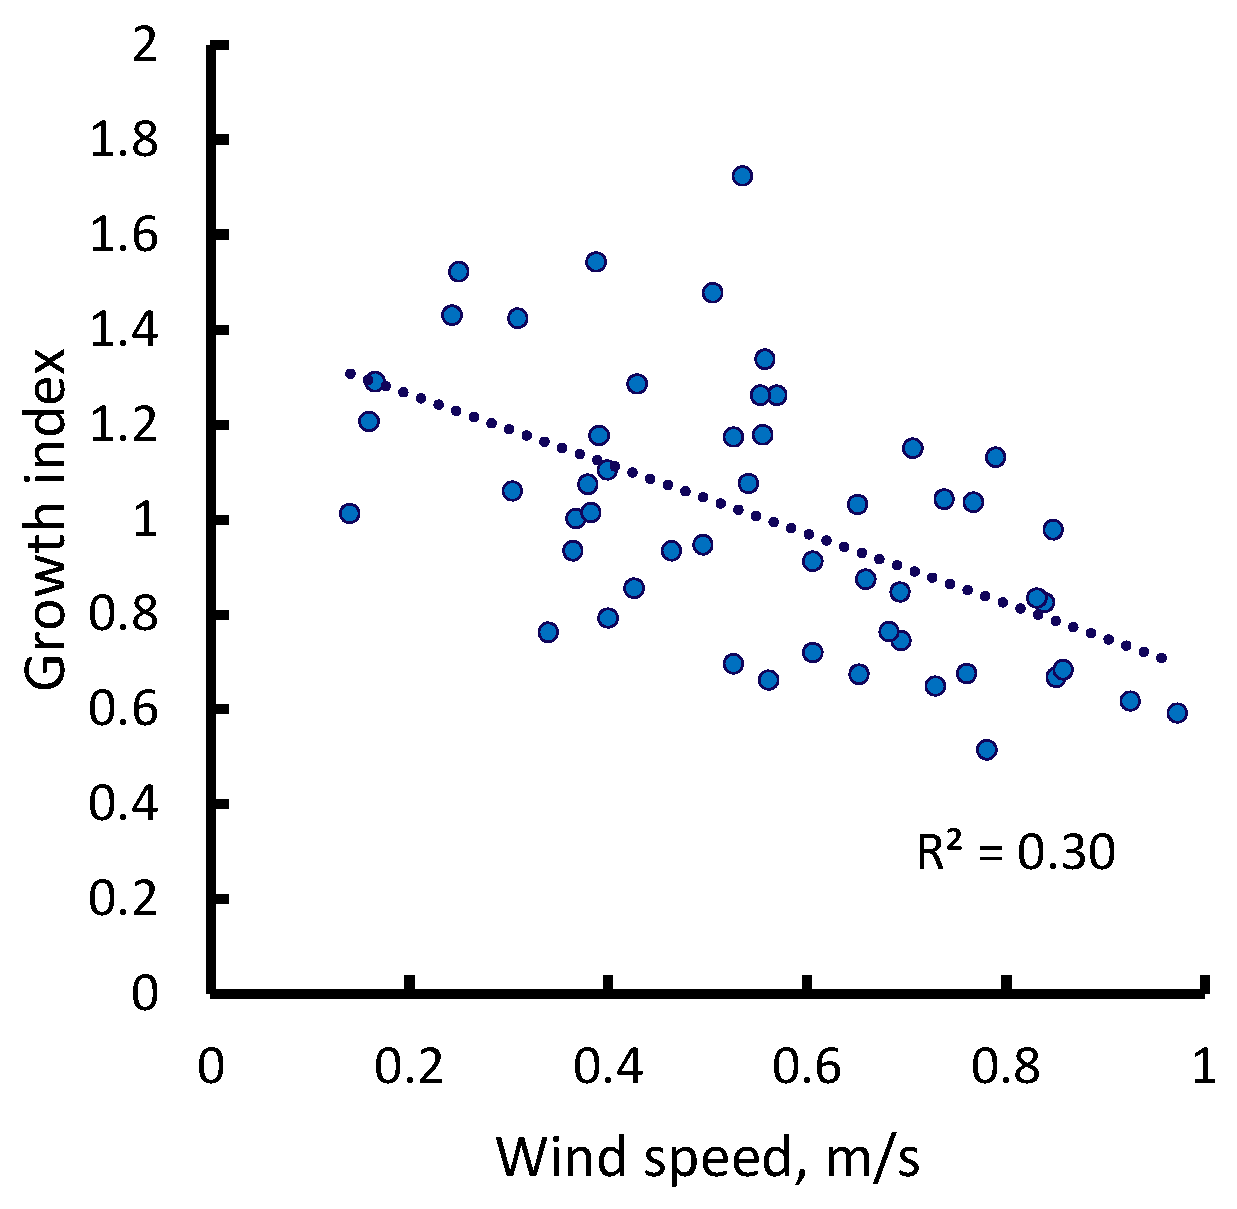
Figure 8.
(a) Positive GPP trends cover about 75% of the study area (S =140,700 ha) (p < 0.05). (b) In the 21st century, on-ground GPP was increasing. The GPP rate was ~19 kgC/ha/y (p < 0.01). (c) The mean ΔGPP increase was 250 kgC/ha (ΔGPP: 2020–2024 vs 2002–2006). (d) The GPP map for 2024 y. Mean GPP is 2080 kgC/ha. Study period: 2002–2024.
Figure 8.
(a) Positive GPP trends cover about 75% of the study area (S =140,700 ha) (p < 0.05). (b) In the 21st century, on-ground GPP was increasing. The GPP rate was ~19 kgC/ha/y (p < 0.01). (c) The mean ΔGPP increase was 250 kgC/ha (ΔGPP: 2020–2024 vs 2002–2006). (d) The GPP map for 2024 y. Mean GPP is 2080 kgC/ha. Study period: 2002–2024.
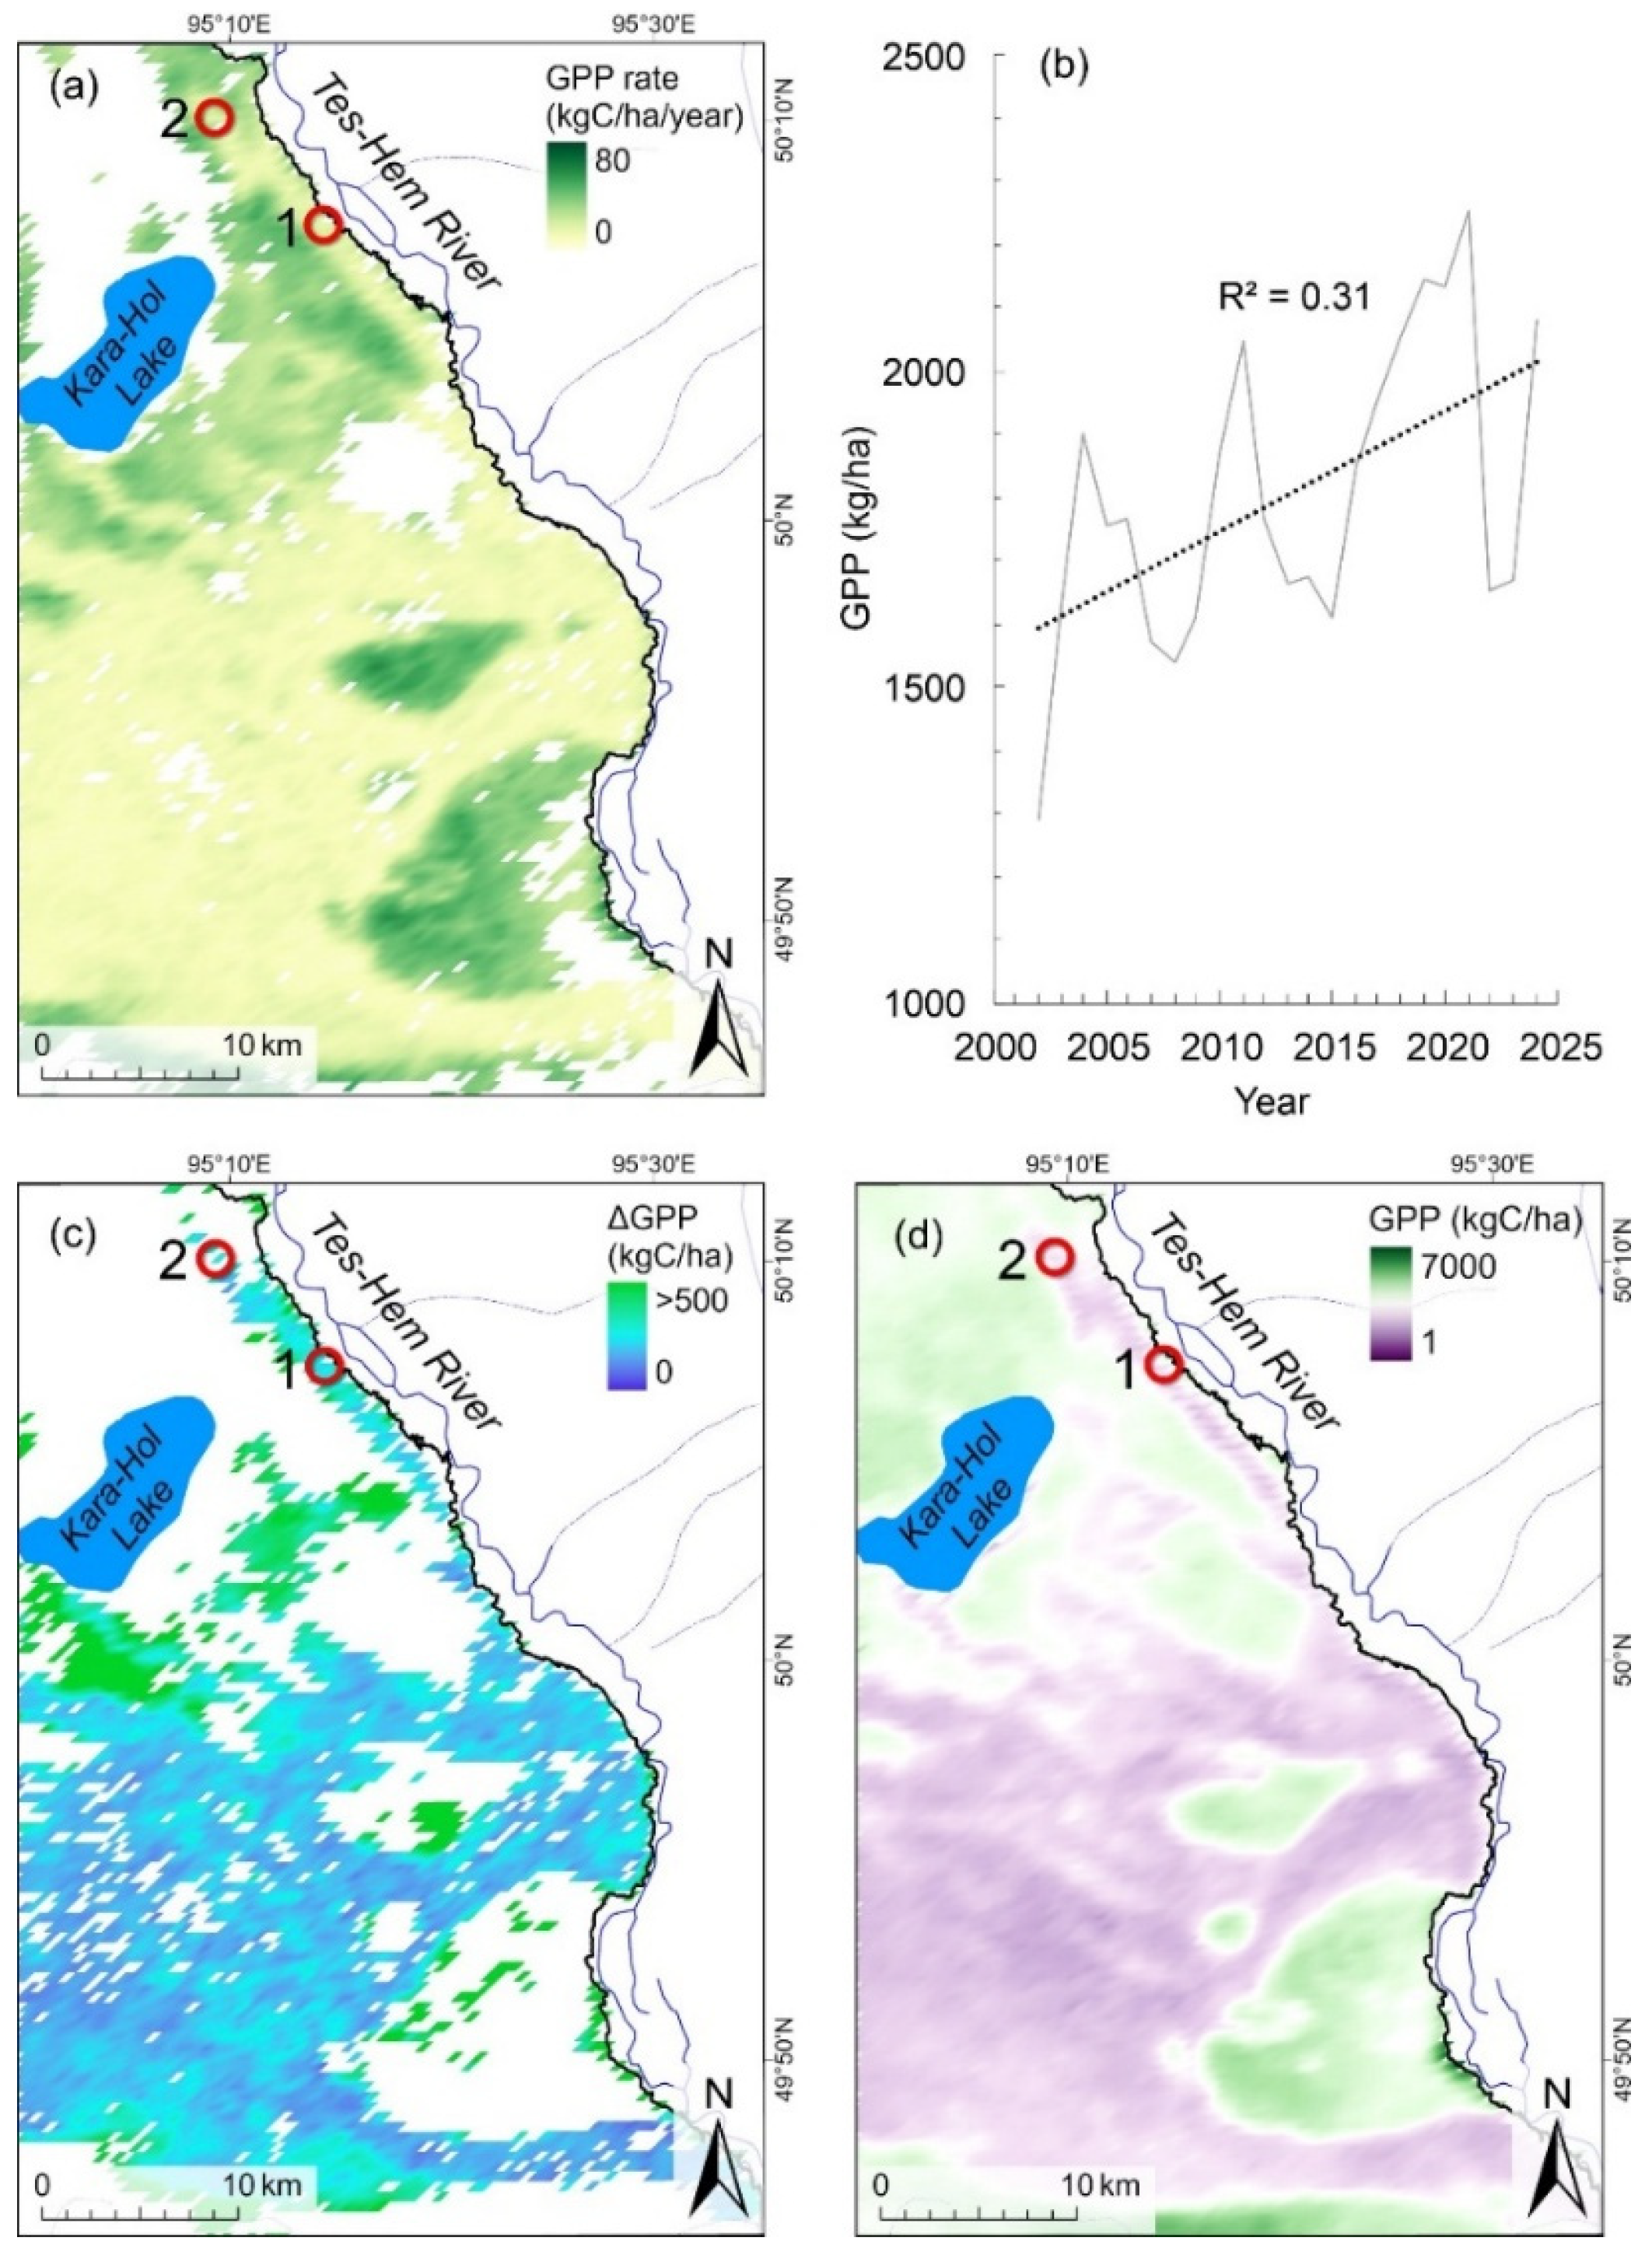
Figure 9.
Mean GPP positively correlates (p < 0.05) with the GI of larch (a) and poplar (b) trees. The analyzed period is 2002–2024.
Figure 9.
Mean GPP positively correlates (p < 0.05) with the GI of larch (a) and poplar (b) trees. The analyzed period is 2002–2024.
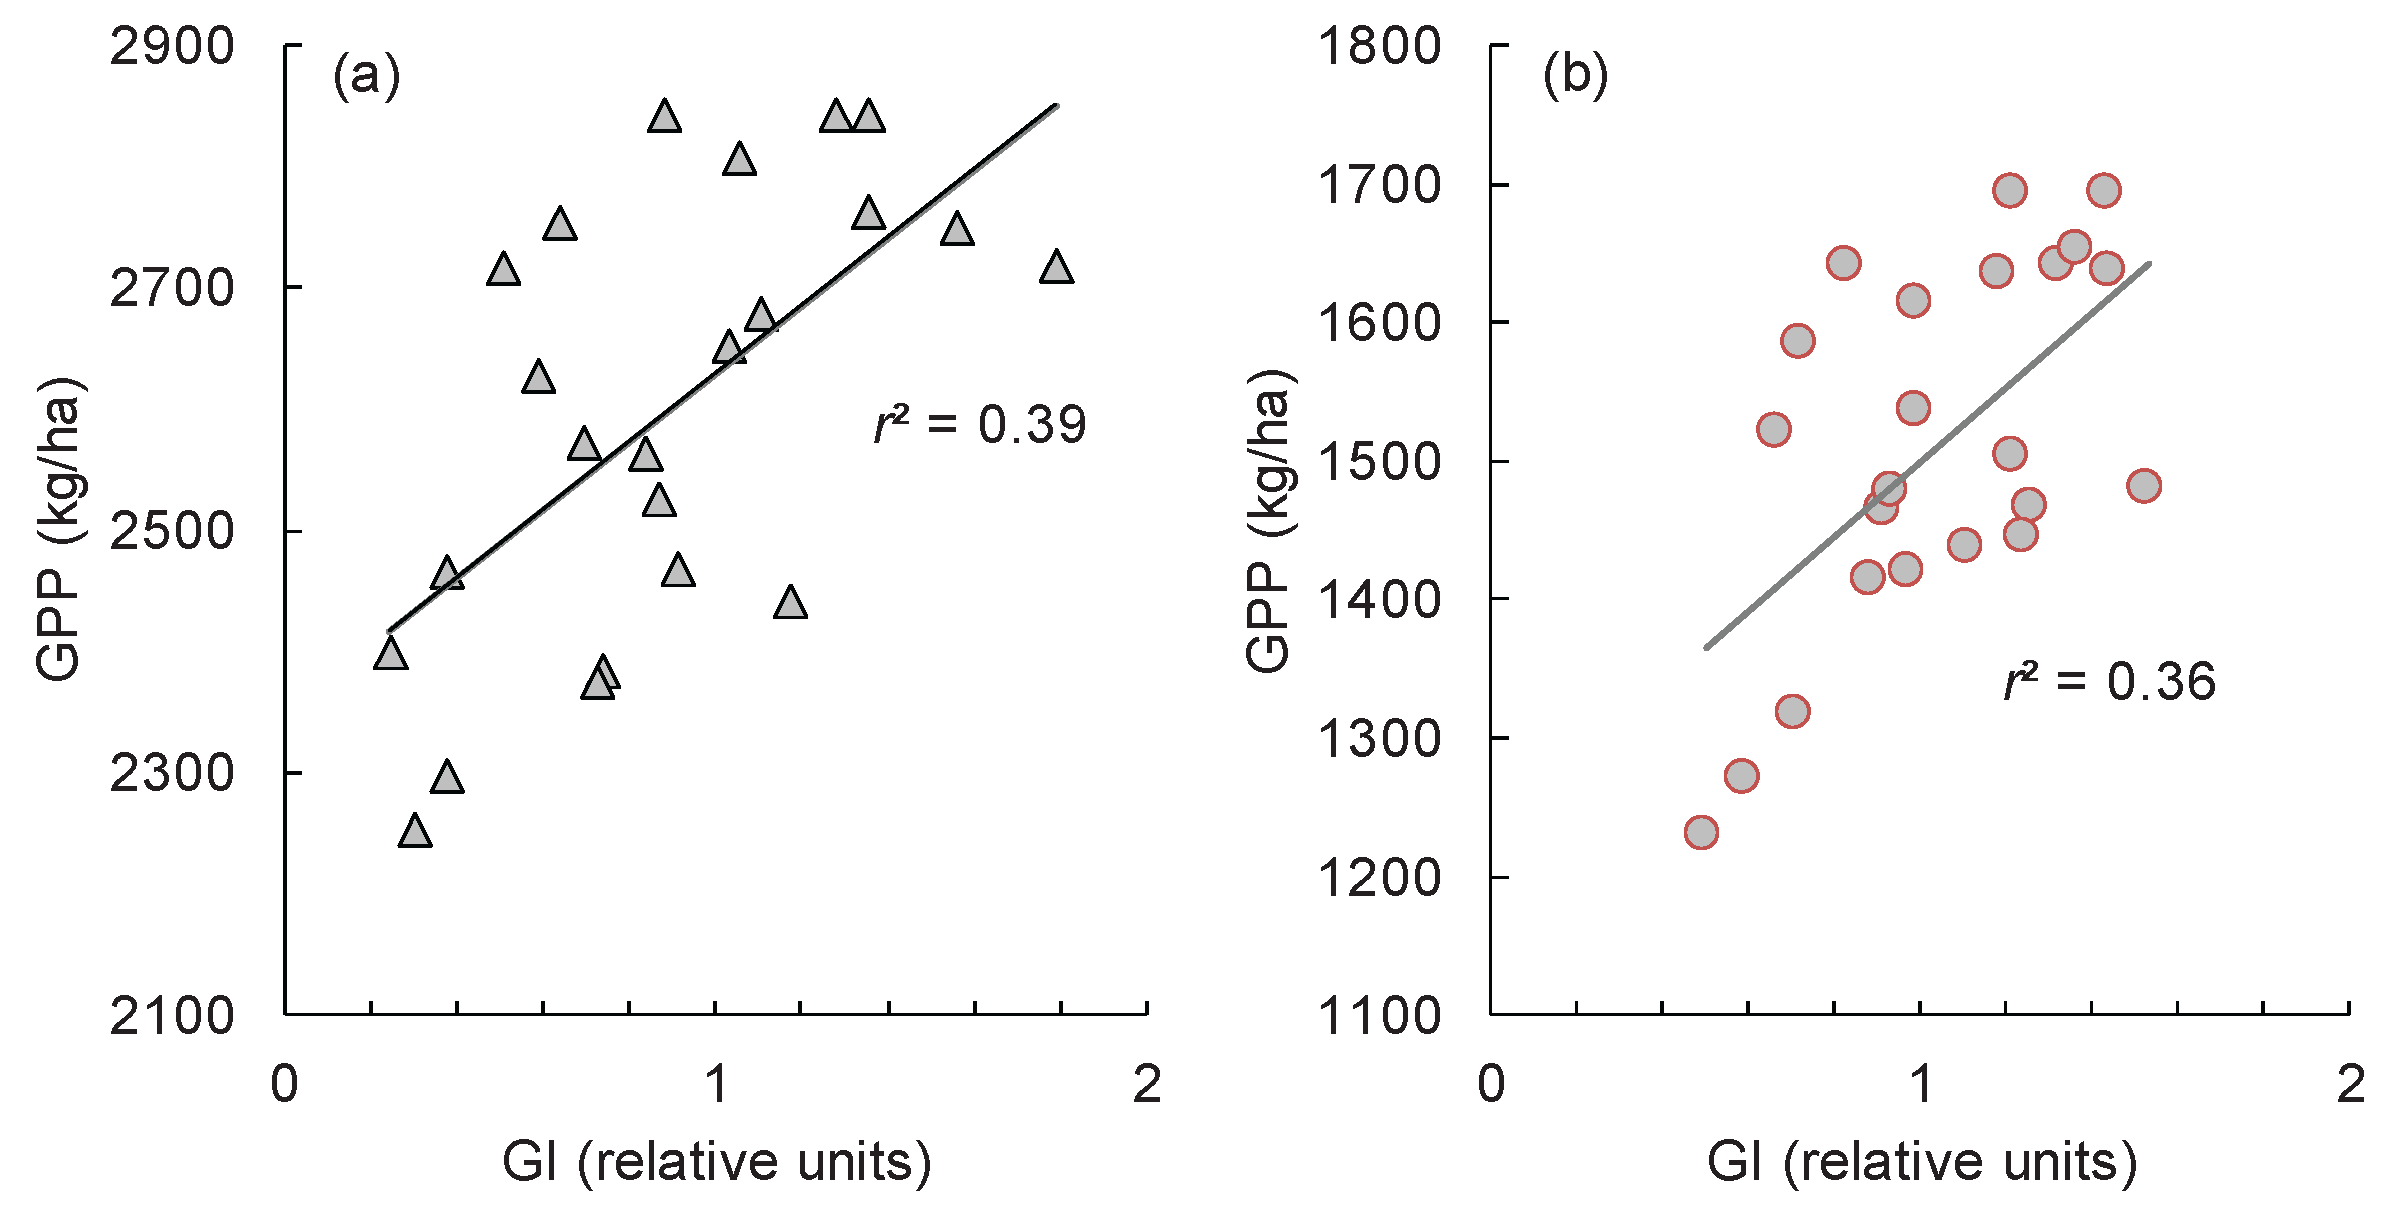
Figure 10.
Distribution of larch (red) and poplar (green) trees inside and beyond refugia. Left: refugia and current treeline locations versus elevation and distance from the refugia. Beyond the refugia, the age of both tree species is less than 60 years. Right: Overview of trees distribution within the Tes-Hem study site. The refugia are located on the downwind slope, i.e., in the wind-protected and snow accumulation zone.
Figure 10.
Distribution of larch (red) and poplar (green) trees inside and beyond refugia. Left: refugia and current treeline locations versus elevation and distance from the refugia. Beyond the refugia, the age of both tree species is less than 60 years. Right: Overview of trees distribution within the Tes-Hem study site. The refugia are located on the downwind slope, i.e., in the wind-protected and snow accumulation zone.
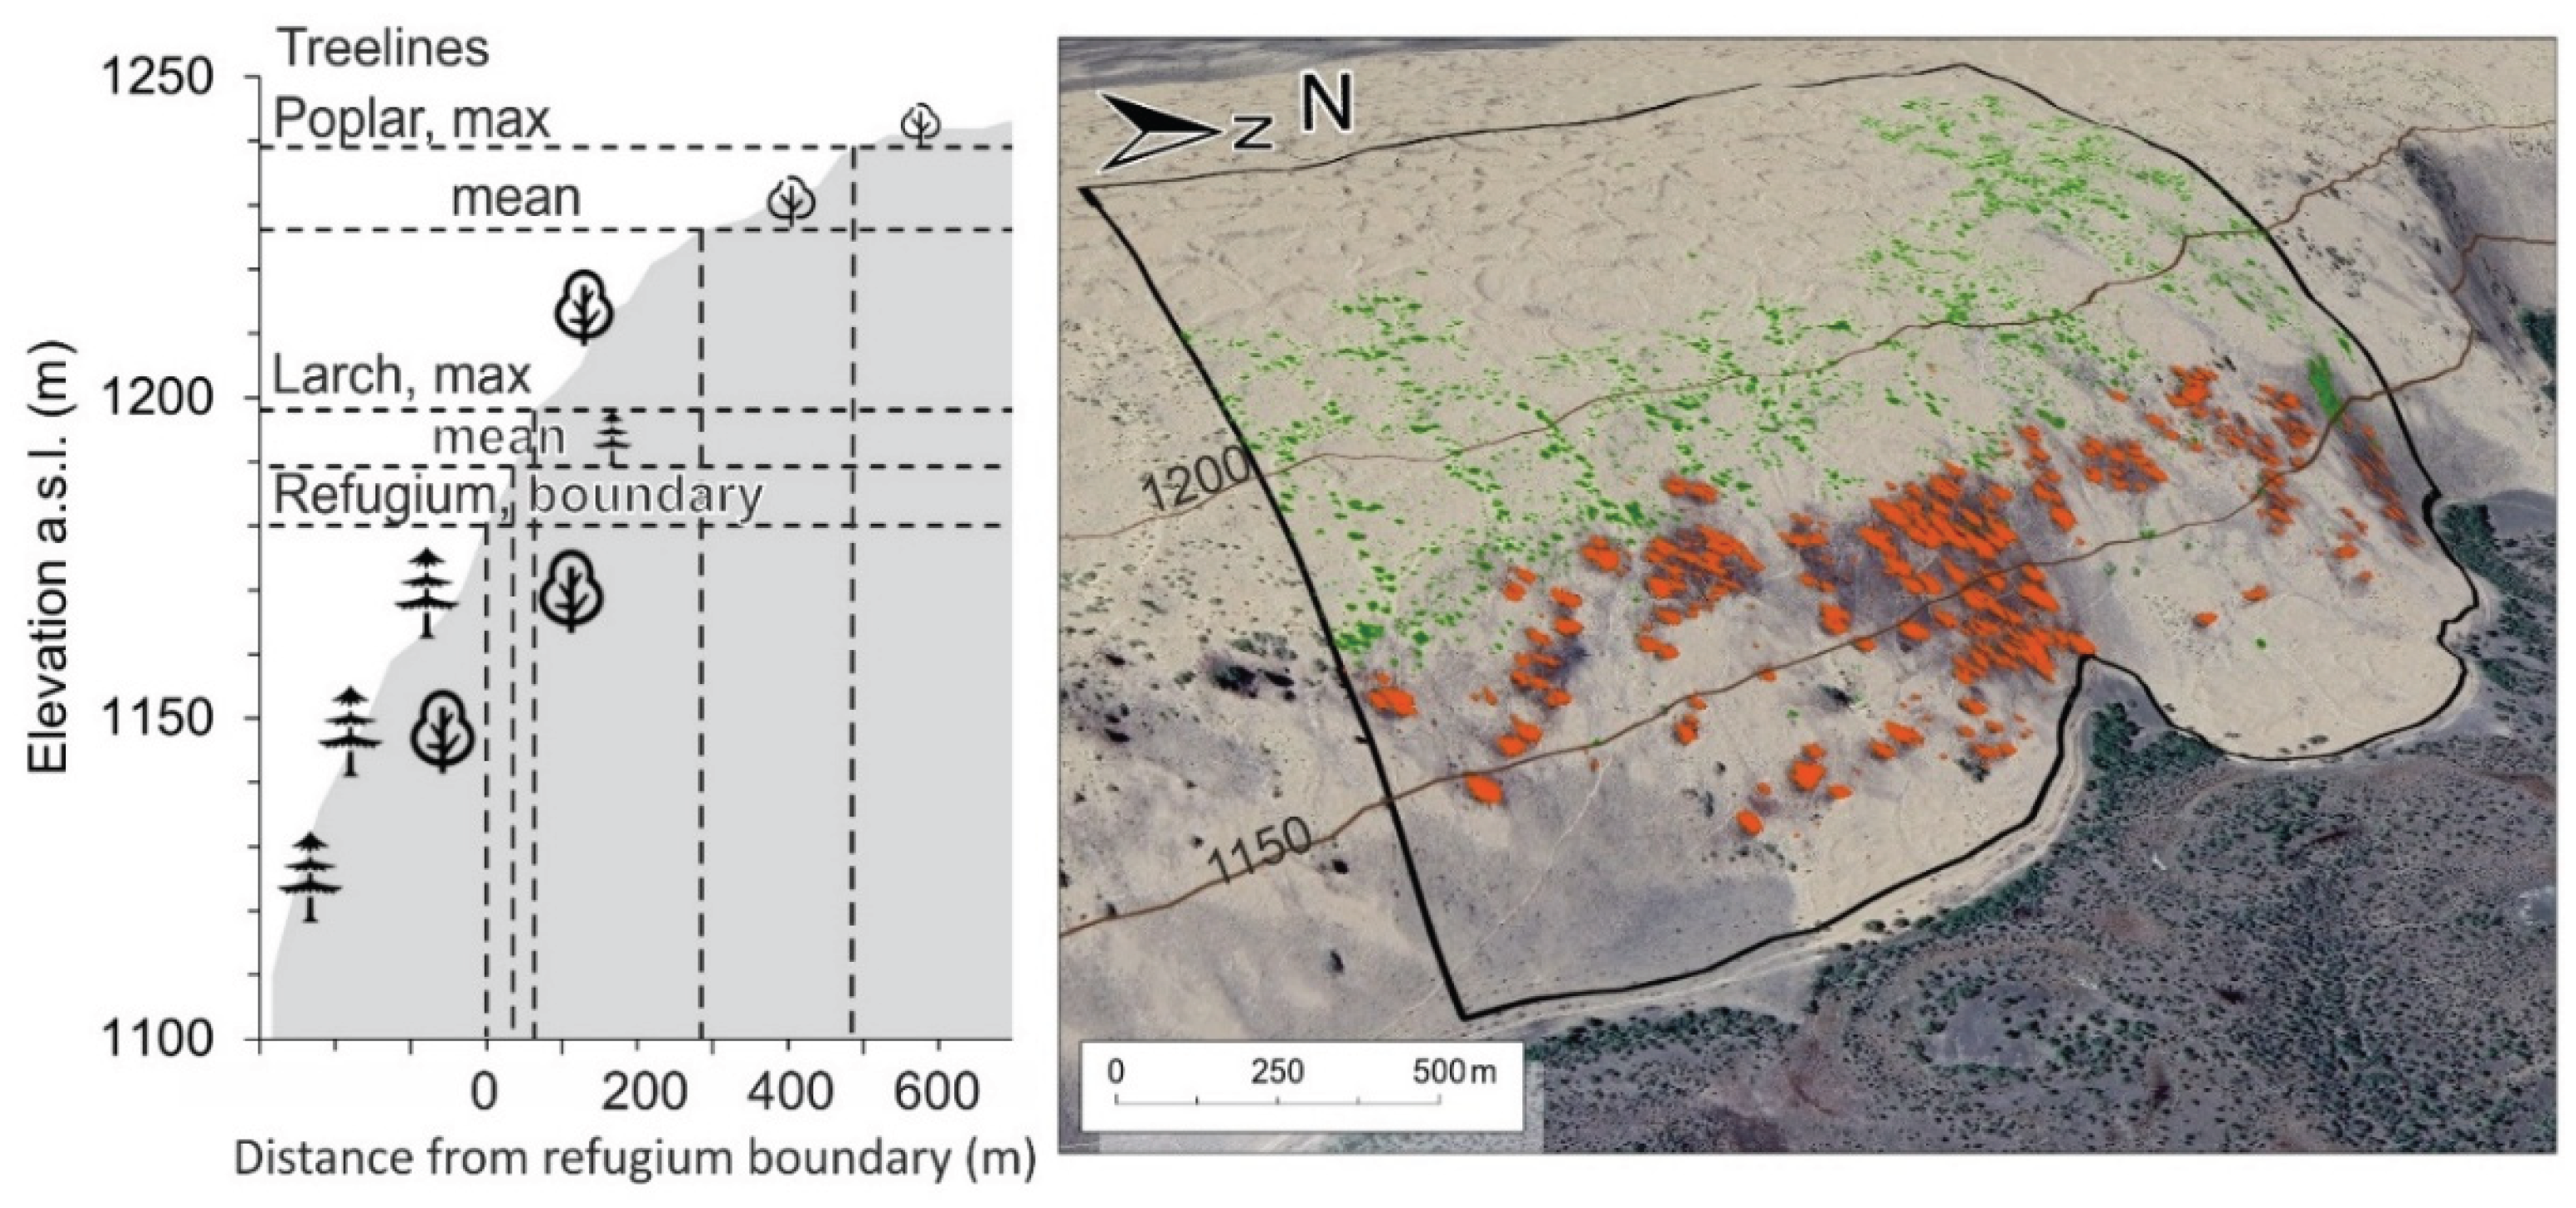
Figure 11.
Monthly (a, b) and May–July (c) moisture deficit in the current (2000–2024) and future (2051–2070, 2081–2100) climates (scenarios SSP2-4.5, SSP3-7.0, and SSP5-8.5). The moisture deficit in May–July will increase under all climate scenarios (with maximum values under SSP5-8.5) (p < 0.05).
Figure 11.
Monthly (a, b) and May–July (c) moisture deficit in the current (2000–2024) and future (2051–2070, 2081–2100) climates (scenarios SSP2-4.5, SSP3-7.0, and SSP5-8.5). The moisture deficit in May–July will increase under all climate scenarios (with maximum values under SSP5-8.5) (p < 0.05).
Disclaimer/Publisher’s Note: The statements, opinions and data contained in all publications are solely those of the individual author(s) and contributor(s) and not of MDPI and/or the editor(s). MDPI and/or the editor(s) disclaim responsibility for any injury to people or property resulting from any ideas, methods, instructions or products referred to in the content. |
© 2026 by the authors. Licensee MDPI, Basel, Switzerland. This article is an open access article distributed under the terms and conditions of the Creative Commons Attribution (CC BY) license (http://creativecommons.org/licenses/by/4.0/).
Copyright: This open access article is published under a Creative Commons CC BY 4.0 license, which permit the free download, distribution, and reuse, provided that the author and preprint are cited in any reuse.


