

Submitted:
17 March 2026
Posted:
18 March 2026
You are already at the latest version
Abstract
Phlebotomine sand flies, vectors of Leishmania parasites, remain poorly studied in southeastern Peru, a region with a high burden of cutaneous leishmaniasis (CL). Using modified UV light traps, we surveyed sand fly assemblages across four habitat types at Manu Biological Station during the wet season (March–May 2023): secondary forest, Guadua bamboo forest, fruit crop plots, and peridomicile habitats. A total of 2,641 sand flies representing 32 species were collected, with females comprising 74.5% of captures. Habitat type was the primary driver of assemblage composition, with minimum nightly temperature as the strongest environmental correlate. Sand fly abundance was highest in secondary forest (n = 921) and peridomicile habitats (n = 836), where assemblages were dominated by Nyssomyia shawi, a generalist species also captured indoors. Although Guadua bamboo forests harbored lower total abundance (n = 386), potential vector species comprised 92% of the assemblage compared to 42–86% in other habitats, and communities exhibited greater evenness. These findings suggest that expanding bamboo forests may pose an underrecognized risk for CL transmission. Additionally, peridomicile assemblages consisted largely of generalist species overlapping with adjacent forested habitats, indicating potential pathways for sylvatic-to-peridomestic spillover. Our findings underscore the importance of habitat-specific assemblage structure and vector dominance in shaping spatially heterogeneous transmission risk and highlight the need for habitat-targeted surveillance strategies in dynamic Amazonian landscapes.
Keywords:
phlebotominae
; leishmaniasis
; habitat associations
; post-agricultural landscapes
; vector ecology
1. Introduction
Female phlebotomine sand flies (Diptera: Psychodidae) are obligate blood feeders and serve as the primary vectors of several medically important pathogens. In the New World, 549 sand fly species have been recorded (Galati et al. 2025), 54 of which are recognized as proven or potential vectors of Leishmania parasites (Killick-Kendrick 1999; WHO 2010). Leishmaniasis ranks among the ten most significant neglected tropical diseases (WHO 2017) and remains a major public health concern across tropical and subtropical regions. The disease is currently endemic in 99 countries and territories worldwide. In 2024, Afghanistan, Algeria, Brazil, Colombia, Iran, Peru, and the Syrian Arab Republic each reported more than 5,000 cases of cutaneous leishmaniasis (CL) annually. Together, these countries accounted for approximately 83% of the global reported CL incidence (WHO 2024). In Peru, CL is endemic and persistent, with 4,850 and 3,667 cases reported by epidemiological week 52 in 2024 and 2025, respectively (MINSA 2025).
Despite its epidemiological importance, ecological and diversity studies of phlebotomine sand flies in Peru remain limited. A total of 175 sand fly species have been recorded nationally, including 70 reported from the Cusco region (Galati et al. 2025; Méndez-Cardona et al. 2025). Research within the Manu Biosphere Reserve, which borders Madre de Dios department, an area responsible for nearly 30% of national CL cases (MINSA 2022), has been restricted mainly to taxonomic surveys and a few seasonal abundance studies (Pérez et al. 1990; Pérez & Ogusuku 1994; Cáceres et al. 2001; Méndez-Cardona et al. 2025). To date, however, no systematic investigation has evaluated sand fly distribution across habitat types in this region of Peru, leaving a critical gap in our understanding of their ecological associations and potential roles in disease transmission.
Elsewhere in the Neotropics, habitat type and the degree of preservation have been shown to influence sand fly assemblages by altering species composition, richness, and abundance (Rebêlo et al. 2019). Disturbance-driven shifts in sand fly community structure often arise from changes in vegetation, microclimate, and host availability, which can favor generalist or potential vector species (de Oca-Aguilar et al. 2022). Such ecological restructuring can, in turn, affect disease dynamics by increasing human–vector contact or expanding the ecological range of competent Leishmania vectors. In southern Peru, climatic and environmental factors, particularly annual rainfall and the presence of humid forests, are considered key determinants of leishmaniasis incidence (Yupari-Azabache et al. 2023). Deforestation for logging, agriculture, grazing, road construction, and urban expansion has been associated with changes in sand fly density and elevated transmission risk (Massey et al. 2025). In the context of accelerating land-use change, leveraging environmental gradients and niche modeling to predict risk shifts under changing climate scenarios is essential for delineating the ecological limits of sand flies and anticipating future transmission (González et al. 2010).
Manu Biological Station, with its documented history of leishmaniasis among and its historical importance as a coca-growing estate under the Inca Empire and a late 19th-century farm known as Villa Carmen, provides an ideal setting to examine how sand fly assemblages are structured across habitats experiencing varying degrees of anthropogenic disturbance. This study offers the first systematic evaluation of habitat-specific sand fly communities in southeastern Peru. We test the hypothesis that sand fly assemblage composition and diversity vary across habitat types. Specifically, we (1) characterize species–habitat associations and indicator species across habitat types; (2) identify species invading the intradomicile and peridomicile settings; and (3) evaluate the influence of microclimatic variables on assemblage structure.
This study integrates ecological, spatial, and environmental analyses to reveal the dominant role of habitat in structuring sand fly assemblages and indicates the unique risk profile associated with bamboo-dominated forests. These findings establish a baseline for understanding habitat-driven vector dynamics and provide a framework for improving risk assessments and surveillance strategies for cutaneous leishmaniasis in the southwestern Amazon.
2. Methods
2.1. Study Site
Manu Biological Station, formerly known as Villa Carmen (N 12.8955, W 71.4038), is located in the buffer zone of the Manu National Park in southeastern Peru. Past agricultural activities have transformed the area around the station into a mosaic of habitats with varying degrees of human intervention, including secondary forest fragments, Guadua bamboo-dominated patches, fruit crop plots, and human dwellings. This heterogeneous landscape covers approximately 3,622 ha. The station experiences a humid tropical climate, with an annual precipitation of approximately 4,000 mm and distinct dry (August) and wet (November–March) seasons. Yearly mean temperature is 22 °C, reaching up to 32 °C on sunny days and dropping to 10 °C during “friajes” (cold fronts).
2.2. Entomological Sampling
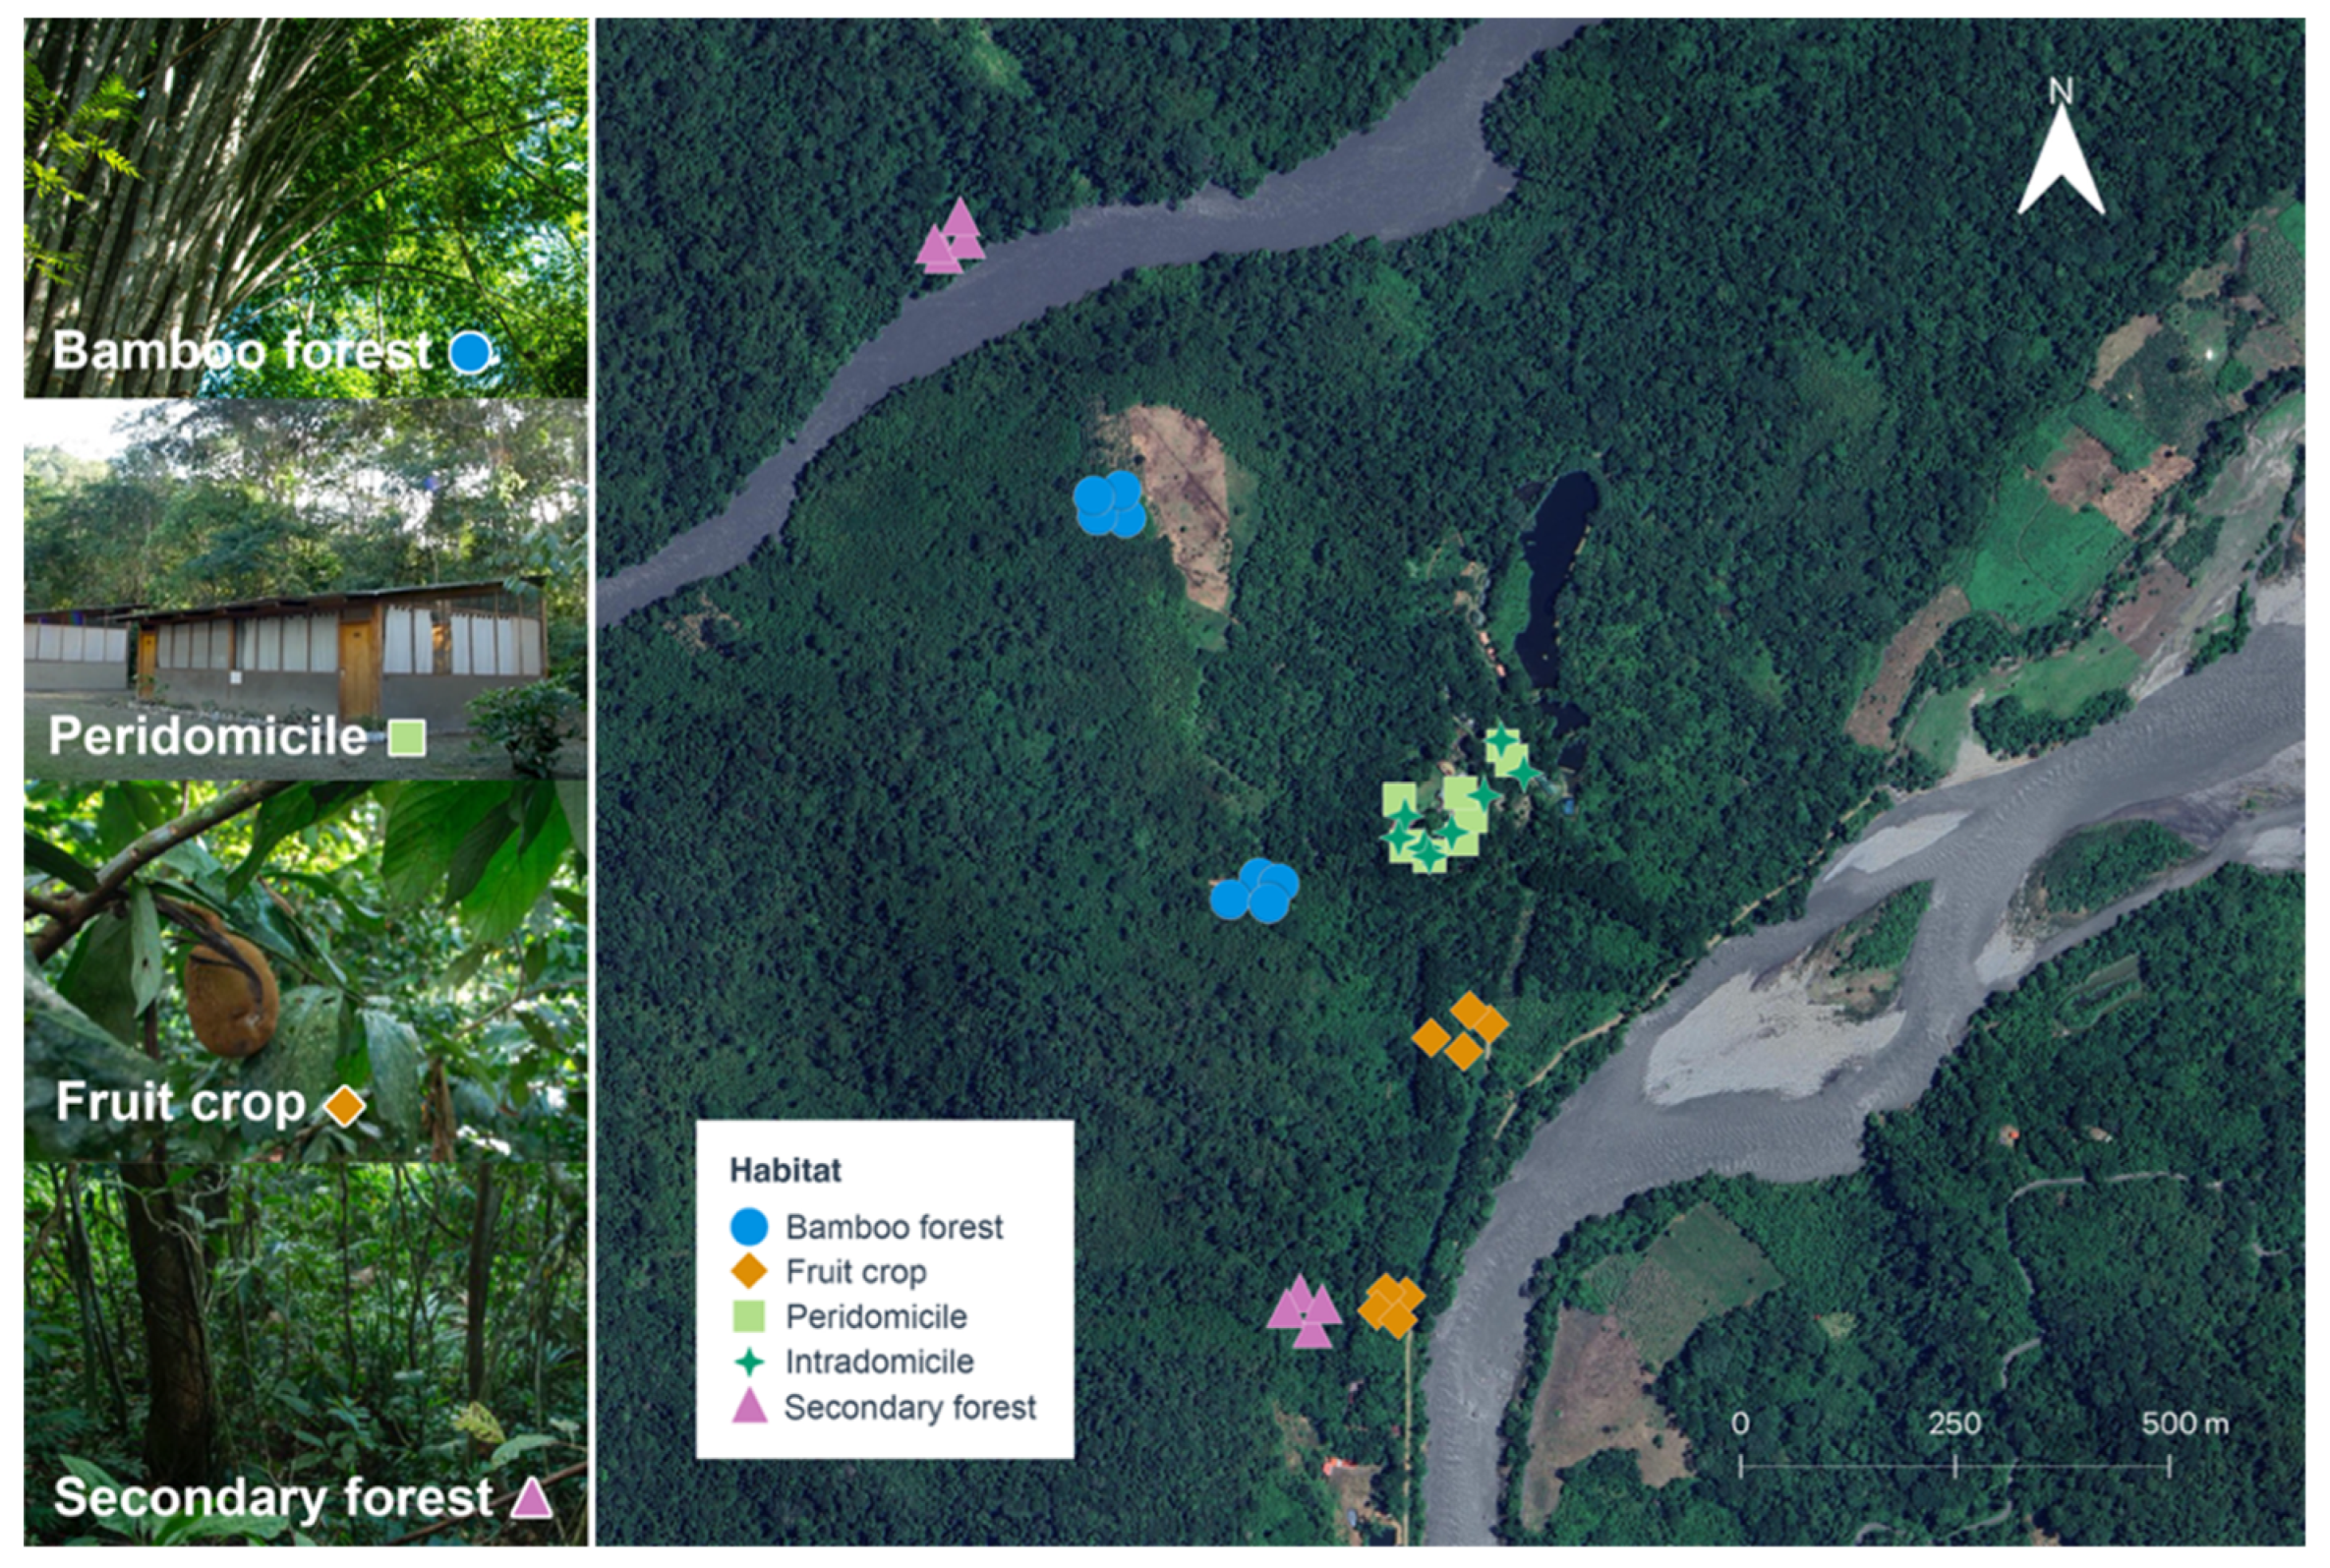
To assess differences in sand fly assemblages, we stratified sampling across four habitat types: secondary forest, Guadua bamboo forest, fruit crop plots, and peridomicile. We employed a balanced design with two replicate sites per habitat. In the three non-domicile habitats, two spatially distinct sites were selected, and one modified Katchy UV light trap (Méndez-Cardona et al. 2025) was deployed at each site. Hereafter, we refer to this trap as the Manu Micro Trap (MMT). For the peridomicile habitat, which was restricted to a single settlement, two separate buildings within the cluster were designated as replicate sites to maintain the balanced design. To evaluate sand fly penetration into buildings, paired MMT traps were deployed at each building: one placed intradomicile (indoors) and one peridomicile (outdoors).
A total of 10 MMT were operated concurrently (six non-domicile traps and four domicile traps). Traps were active from 18:00 h to 06:00 h the following day. To capture local variation and minimize position bias, traps were relocated each sampling night. Non-domicile traps were moved approximately 10 m within their respective sites, while domicile trap pairs were moved to different buildings within the cluster, while maintaining the indoor/outdoor pairing.
Figure 1.
Habitat types and sampling points where sand flies were collected in Manu Biological Station, Cusco, Peru. Shapes represent habitat type. Background imagery: © Google, Maxar Technologies, Airbus, accessed via QGIS v.3.34.12.
Figure 1.
Habitat types and sampling points where sand flies were collected in Manu Biological Station, Cusco, Peru. Shapes represent habitat type. Background imagery: © Google, Maxar Technologies, Airbus, accessed via QGIS v.3.34.12.
Sampling events lasted for a total of four nights, with each event occurring every 2 weeks over 2 months, from March to April 2023 (wet season). After each event, the traps were placed in plastic bags containing cotton balls soaked in ethyl acetate to immobilize specimens. Collected sand flies were then sorted and preserved in 70% ethanol for transport. In the laboratory, specimens were cleared in 10% potassium hydroxide (KOH) and fixed in saturated phenol for morphological identification using Galati’s (2018) taxonomic keys.
2.3. Environmental Data Collection
Microclimatic and structural habitat variables were measured at each trap site to assess their influence on sand fly assemblages. Temperature (T) and relative humidity (RH) were recorded at 30-minute intervals using dataloggers (Elitech RC-51H USB, CA, USA). From these data, we derived six specific microclimatic predictors for each sampling event: minimum temperature (Tmin), mean temperature (Tmean), and maximum temperature (Tmax) recorded during the 12-hour trapping period, as well as Tmin24, Tmean24, and Tmax24 covering the full 24-hour cycle preceding trap retrieval. Similarly, minimum, mean, and maximum relative humidity (RHmin, RHmean, RHmax) were calculated for the trapping period.
Habitat structure was quantified via foliage cover, crown cover, and crown porosity, estimated from digital cover photography analyzed with coveR package in R (v.1.1.1) (Chianucci et al. 2022). All photographs were captured at 1.5 m above ground using a Canon PowerShot SX70 HS (Canon Inc., Tokyo, Japan). Additionally, basal area was measured at each trap location using a wedge prism (BAF = 0.46 m²/ha) as a proxy for tree density and biomass.
2.4. Data Analysis
To identify sand fly species associated with specific habitats or combinations of habitats, an indicator species analysis was conducted using the indicspecies package (v1.7.15) in R (De Cáceres and Legendre 2009). Species diversity and richness were estimated with the iNEXT package (v3.0.1), which accounts for differences in sample completeness and allows standardized comparisons across sites and sampling occasions (Hsieh et al. 2025). Singleton species, i.e., those represented by a single individual, were excluded from multivariate analyses to minimize the influence of potential trapping bias and stochastic detection, which can disproportionately affect dissimilarity measures (Legendre & Legendre 2012; Poos & Jackson 2012). However, singletons were retained for all alpha-diversity and species richness estimates to ensure a representative account of community breadth and to avoid underestimating true species diversity.
Community composition patterns were explored using nonmetric multidimensional scaling (NMDS) based on Bray-Curtis dissimilarity matrices. These analyses were restricted to outdoor assemblages (secondary forest, bamboo, fruit crops, and peridomicile) while intradomicile collections were analyzed separately. NMDS was performed using the metaMDS function in the vegan package (v2.6-8) (Oksanen et al. 2024). We assessed the adequacy of the NMDS solution using ordination stress values, with a threshold of < 0.20 considered a usable representation of community patterns (Clarke 1993). In the resulting two-dimensional ordination plots, each point represents a specific habitat-night sample; proximity between points indicates similarity in sand fly species composition.
To statistically evaluate differences in community structure among habitats and across sampling dates, a permutational multivariate analysis of variance (PERMANOVA) was performed on Bray-Curtis dissimilarity matrices using the adonis2 function in vegan. Sites were treated as independent replicates, with trap nights averaged to avoid pseudoreplication. The model included habitat type and sampling date as fixed factors, along with their interaction. Homogeneity of multivariate dispersion was tested prior to interpretation using the betadisper function to ensure that significant results reflected differences in community composition rather than within-group variability.
Due to the low number of individuals captured inside homes, intradomicile collections were analyzed separately to characterize indoor penetration patterns. For each species, the proportion of females collected indoors was calculated relative to the total number of females captured in the peridomicile area. This proportional metric does not imply habitat preference but rather provides a standardized measure of indoor penetration relative to local outdoor abundance.
All analyses were conducted in R version 4.4.1 (R Core Team 2024). Statistical significance for PERMANOVA and indicator species analysis was assessed at α = 0.05 using 9999 permutations.
3. Results
A total of 2,641 sand flies, representing 32 species across nine genera, were collected (Table 1). Among the four outdoor habitats, abundance was highest in secondary forest (n = 921) and peridomicile environments (n = 836), followed by fruit crop plots (n = 454) and bamboo forest (n = 386). Intradomicile collections yielded only 44 specimens, representing 11 species. Overall, the captures were dominated by female, comprising 74.5% (1,969) of the total. This female bias was consistent across habitats: females comprised 82.0% of the peridomicile specimens, 71.9% of the specimens from abandoned crops, 71.5% of specimens from secondary forests, 62.8% of the specimens from bamboo forests, and 84.1% of the indoor specimens.
3.1. Sampling Completeness and Diversity
Sample completeness, estimated as sample coverage, exceeded 0.98 across all habitats, indicating that most individuals in each sample belonged to species that were detected at least once. Rarefaction and extrapolation curves suggested that observed species richness (q=0) captured 67.1–89.9% of the estimated total richness, with the lowest completeness in peridomicile habitats (25 observed vs. 37.2 estimated species; Table 2). This discrepancy suggests that while abundant species were sampled effectively, rare species remained undersampled.
Species richness (q=0) was highest in secondary forest (28 species) and peridomicile (25 species). However, Shannon diversity (q=1), which weights species by their abundance, was highest in fruit crop plots (10.88) and bamboo forests (8.33), and Simpson diversity (q=2), which emphasizes dominant species, followed the same pattern (Table 2). These contrasting patterns indicate that secondary forest and peridomicile assemblages were dominated by a few highly abundant species, whereas fruit crop and bamboo forest assemblages exhibited greater evenness in species abundances.
3.2. Species Composition and Potential Vector Abundance
Species composition differed among habitats. Nyssomyia shawi was the dominant species in secondary forest (54%), peridomicile (48%), and bamboo forest (32%), while Trichophoromyia spp. dominated in fruit crop plots (29%, Table 2). The number of recognized potential vector species was similar across habitats (10–11 species), but their representation varied markedly (Table 2). Potential vector species comprised the majority of the assemblage in bamboo forest (92%) and peridomicile (86%), yet the highest abundances occurred in the secondary forest (737) and the peridomicile (718). Thus, while bamboo forest exhibited the highest proportional dominance by vectors, the secondary forest and peridomicile harbored the greatest overall vector density.
3.3. Species Composition: Intradomicile vs. Peridomicile
Indoor abundances were significantly lower than in the immediate peridomicile, with only 44 individuals collected inside homes. Nyssomyia shawi was the most abundant indoor species (n=17; 14 females), though this represented only 4% of females of this species collected in the peridomicile (n=350). Psychodopygus llanosmartinsi was the second most common indoor species and exhibited greater indoor penetration, with 13 individuals captured indoors representing 11% of its peridomicile abundance (n=118). Other species appeared indoors in low numbers: Psychodopygus yucumensis (n = 4; 10% of peridomicile abundance) and Trichophoromyia sp. (n=3; 7%), and single specimens of Psathyromyia aragaoi and Psychodopygus hirsuta. Several species common in the peridomicile, including Evandromyia saulensis, Evandromyia walkeri, and Psychodopygus carrerai, were never captured indoors.
3.4. Indicator Species and Habitat Associations
Multilevel pattern analysis identified six indicator species significantly associated with specific habitats or their combinations (Figure 2). Only Psychodopygus yucumensis was uniquely associated with a single habitat (peridomicile; IndVal = 0.817, p = 0.015). Multiple species showed strong associations with two habitat types: Trichophoromyia macrisae with fruit crop plots and peridomiciles (IndVal = 0.995, p = 0.005), and two Trichophoromyia species (Tr. nr. sinuosa and Tr. auraensis) with fruit crop plots and secondary forest (IndVal = 0.920 and 0.777, respectively; both p = 0.005). Two species exhibited broad, three-habitat associations: Nyssomyia shawi (IndVal = 0.962, p = 0.01) with bamboo forest, peridomicile, and secondary forest, and Trichophoromyia sp. (IndVal = 0.987, p = 0.005) with fruit crop plots, peridomicile, and secondary forest. No significant habitat associations were detected for the remaining species.
3.5. Environmental and Temporal Drivers of Sand Fly Assemblages
PERMANOVA revealed that habitat type was the primary driver of assemblage structure (R² = 0.32, F = 5.29, p = 0.0001), with sampling date exerting a weaker but significant effect (R² = 0.14, F = 2.38, p = 0.0005)). The interaction between habitat and date was not significant (p=0.19), suggesting that habitat associations remained consistent throughout the study period. Tests for homogeneity of multivariate dispersion were conducted to ensure that significant PERMANOVA results reflected differences in assemblage composition rather than differences in within-habitat variability. Dispersion differed among habitats (F = 4.44, p = 0.012), driven primarily by higher variability among secondary forest samples. NMDS ordination (stress = 0.194) indicated that sand fly assemblage composition differed among habitat types (Figure 3). Although PERMANOVA detected temporal variation in assemblage composition, sampling dates did not form distinct clusters in ordination space.
Environmental vector fitting identified minimum temperature as the strongest correlate of assemblage composition. Both minimum nightly temperature (Tmin) (R² = 0.26, p = 0.012) and minimum temperature in the preceding 24 hours (Tmin24) (R² = 0.2, p = 0.041) were significantly associated with variation in assemblage composition across habitats (Figure 3). Movement along the Tmin vector in ordination space corresponded to shifts from peridomicile assemblages toward bamboo forest assemblages, indicating that differences between these habitats were associated with variation in minimum nightly temperature. Mean temperature (Tmean) (R² = 0.18, p = 0.058) and basal area (R² = 0.16, p = 0.077) showed marginal associations, whereas vegetation structure variables (foliage cover, crown cover, crown porosity) and humidity were not correlated with community composition (all p > 0.1).
4. Discussion
Sand fly assemblages in the southwestern Amazon are shaped predominantly by habitat type, with additional influences from temporal and microclimatic variation. The collection of 32 species, along with the new record of Evandromyia andersoni for the Cusco Department (Méndez-Cardona et al. 2025b), underscores the continued value of vector surveys in this understudied region. Habitat accounted for 32% of the variation in assemblage composition, while temporal factors explained 14%, indicating that spatial heterogeneity is the primary driver of assemblage structure. Significant differences in multivariate dispersion among habitats further suggest that within-habitat heterogeneity contributes to assemblage differentiation beyond simple shifts in average.
4.1. Peridomicile Assemblages and Generalist Vector Species
In ordination space, the peridomicile occupied a central position overlapping with secondary forest, bamboo, and fruit crop habitats (Figure 3), reflecting assemblages largely comprised habitat generalists common in adjacent environments. This pattern could suggest ecological spillover, wherein species from surrounding habitats regularly move into human-modified areas. A notable exception is Psychodopygus yucumensis, which showed exclusive association with peridomicile habitats, likely reflecting its anthropophilic behavior (Le Pont and Desjeux 1986).
The most abundant species across habitats, Nyssomyia shawi, demonstrates the ecological plasticity characteristic of important neotropical vectors such as Ny. whitmani in Brazil (Costa et al. 2007; Valdivia et al. 2021). Indicator species analysis confirmed its significant association with bamboo forest, secondary forest, and peridomicile habitats, and it was the most frequently captured species indoors. This distribution, combined with prior detection of Leishmania infections in Ny. shawi (Ryan et al. 1987; García et al. 2007), positions this species as a likely bridge vector connecting peridomestic and sylvatic transmission cycles.
Beyond Ny. shawi, other potential vectors may contribute to habitat-specific transmission pathways. Psychodopygus llanosmartinsi, the second most common species indoors, displayed a generalist distribution and has been implicated as vector of L. (V.) braziliensis in southeastern Peru (Zorrilla et al. 2017). Its frequent occurrence in peridomicile areas indicates substantial peridomestic transmission potential, consistent with observations from lowland sub-Andean Bolivia (Le Pont and Desjeux, 1986). Although female Trichophoromyia could not be identified to species, the presence of Th. auraensis, a putative vector of L. (V.) braziliensis (Valdivia et al. 2012; Teles et al. 2017), suggests additional transmission risk in secondary forests and fruit crop plots where these species were most abundant. Together, habitat-specific assemblage profiles, shaped by the ecological plasticity of potential vector species, have the potential to create distinct transmission pathways and mirror broader patterns of vector dominance in disturbed Neotropical environments (Nieves et al. 2014; Ramos et al. 2014; Valdivia et al. 2021; Durán-Luz et al. 2023).
4.2. Bamboo Forests: An Emerging Transmission Landscape
Guadua sp. dominated forests are rapidly expanding across the region following deforestation, fire, and land abandonment (Smith & Nelson, 2011; Virtanen et al. 2022; da Silva et al. 2021). We found that bamboo habitats support lower sand fly richness and abundance than secondary forests but maintain higher species diversity and evenness. Notably, potential vectors constituted 92% of the bamboo assemblage, even as the dominant Ny. shawi decreased in relative frequency (32%). This reduced dominance suggests that bamboo forests may provide suboptimal conditions for this otherwise ubiquitous species, potentially due to restricted breeding substrates, altered soil–litter properties, or reduced mammal host availability (Borges et al. 2014; André et al. 2022). Simultaneously, the presence of multiple vector species at moderate densities indicates that resilient generalists can successfully colonize these expanding habitats. Although we did not assess Leishmania infection in sand flies, the proportional dominance of putative vectors in expanding bamboo forests warrants targeted parasitological surveillance, as increasing human overlap poses a growing and underappreciated transmission risk.
4.3. Environmental Drivers of Sand Fly Assemblages
Temperature affects both vector survival and Leishmania development (Guzmán & Tesh 2000; Hlavacova et al. 2013), suggesting that fine-scale thermal variation modulates habitat-specific transmission. While structural variables like canopy cover and basal area were weak predictors, minimum nightly temperature (Tmin) and the 24-hour minimum (Tmin24) were significantly associated with assemblage composition. Critically, in our ordination analysis, the Tmin vector was oriented toward bamboo forest and peridomicile assemblages (Figure 3), indicating that variation in minimum temperature corresponded to differences between these habitats and the cooler secondary forest sites.
This pattern is consistent with microclimatic differentiation among habitat types, potentially creating environmental gradients that favor species with differing thermal tolerances (Vivero-Gomez et al. 2024). With ongoing warming trends documented across the Amazon basin (Flores et al. 2024), shifts in minimum temperatures could alter species distributions, potentially enhancing vector persistence in currently marginal habitats such as bamboo forests and expanding the geographic scope of transmission risk.
4.4. Study Limitations
This study has several limitations. First, collections were restricted to the wet season over a three-month period, likely underrepresenting the seasonal variation characteristic of Amazonian sand fly populations (Pérez and Ogusuku, 1994). Second, exclusive reliance on modified miniature light traps (MMT) may have introduced detection bias of species otherwise collected with human landing catch or found at different heights (McDermott and Mullens 2018). Multi-season sampling and complementary trapping methods would provide a more complete picture of how successional processes and microclimatic gradients shape sand fly assemblages and influence transmission risk in post-disturbance landscapes.
4.5. Implications for Surveillance and Future Research
Despite these limitations, our findings demonstrate that sand fly assemblage structure is strongly habitat-dependent, creating spatially heterogeneous transmission risk across the landscape. The low dissimilarity of peridomicile assemblages to those found in surrounding habitats, combined with the indoor occurrence of key vector species, highlights the peridomicile–forest interface as a critical zone for vector–human contact. Meanwhile, the high proportional representation of vectors in expanding bamboo forests suggests that landscape transformation may be creating novel transmission pathways that warrant closer epidemiological attention.
Our study provides an empirical foundation for developing habitat-targeted surveillance strategies. We recommend prioritizing two landscape features for monitoring efforts: (1) expanding Guadua bamboo forests, where high vector proportions coincide with ongoing habitat expansion, and (2) peridomicile areas, where high vector density directly overlaps with human activity. Parasitological screening of dominant vector species, particularly Ny. shawi and Ps. llanosmartinsi, is essential for confirming their roles in active transmission. Integrated surveillance linking vector distributions, mammalian reservoir hosts, and human case data across habitat gradients will be critical for understanding CL transmission risks in this rapidly changing Amazonian landscape and will proof invaluable for informing future land management and vector control decisions.
Funding
This work was supported by the Research Fellowship Program Agreement (#2022-51) provided to SMC by the International Conservation Fund of Canada Biome. Gordon and Betty Moore Foundation provided funds for the MMT and support for ALT and JAMM.
Institutional Review Board Statement
Not applicable.
Informed Consent Statement
Not applicable.
Data Availability Statement
Data is contained within this article.
Acknowledgments
We are grateful to the research fellows and staff of the Manu Biological Station for their support during field work. We also thank Yoosook Lee and Lawrence Reeves for their feedback and guidance in improving the writing.
Conflicts of Interest
The authors declare no conflicts of interest.
References
- André, C. L.; Côrtes, M. C.; Heming, N. M.; Galetti, M.; Alves, R. S. C.; Bovendorp, R. S. Bamboo shapes the fine-scale richness, abundance, and habitat use of small mammals in a forest fragment. Mammal research 2022, 67(2), 199–218. [Google Scholar] [CrossRef]
- Borges, L. H.; Calouro, A.; Botelho, A. L.; Silveira, M. Diversity and habitat preference of medium and large-sized mammals in an urban forest fragment of southwestern Amazon. Iheringia. Série Zoologia 2014, 104, 168–174. [Google Scholar] [CrossRef]
- Cáceres, A.; Quate, L.; Galati, E. A.; Baht, H. Flebotomínos (Diptera: Psychodidae) de San Pedro, distrito Kosñipata, Paucartambo - Cusco, y nuevos reportes para el Perú. Revista Peruana de Medicina Experimental y Salud Pública 2001, 18(1–2), 24–26. [Google Scholar]
- Clarke, K.R. Non-parametric multivariate analyses of changes in community structure. Australian Journal of Ecology 1993, 18, 117–143. [Google Scholar] [CrossRef]
- Costa, S.M.; Cechinel, M.; Bandeira, V.; Zannuncio, J.C.; Lainson, R.; Rangel, E.F. Lutzomyia (Nyssomyia) whitmani s.l. (Antunes & Coutinho, 1939) (Diptera: Psychodidae: Phlebotominae) and the epidemiology of American cutaneous leishmaniasis in Brazil. Memórias do Instituto Oswaldo Cruz 2007, 102, 149–153. [Google Scholar]
- Durán-Luz, J.; Ibáñez-Bernal, S.; Rebollar-Téllez, E. A.; Ibarra-Juárez, L. A. Diversity and spatio-temporal variation of phlebotomine sand flies (Phlebotominae: Diptera: Psychodidae) in three different types of land use and seasons in the state of Veracruz, Mexico. Revista Mexicana de Biodiversidad 94 2023, e5048. [Google Scholar] [CrossRef]
- Flores, B. M.; Montoya, E.; Sakschewski, B.; Nascimento, N.; Staal, A.; Betts, R. A.; Levis, C.; Lapola, D. M.; Esquível-Muelbert, A.; Jakovac, C.; Nobre, C. A.; Oliveira, R. S.; Borma, L. S.; Nian, D.; Boers, N.; Hecht, S. B.; ter Steege, H.; Arieira, J.; Lucas, I. L.; Berenguer, E.; Marengo, J. A.; Gatti, L. V.; Mattos, C. R. C.; Hirota, M. Critical transitions in the Amazon forest system. Nature 2024, 626(7953), 555–564. [Google Scholar] [CrossRef]
- Galati, E. A. B. Phlebotominae (Diptera, Psychodidae): classification, morphology and terminology of adults and identification of American taxa. In Brazilian sand flies: biology, taxonomy, medical importance and control; Springer International Publishing: Cham, 2018; pp. 9–212. [Google Scholar]
- Galati, E. A. B.; de Andrade, A. J.; Perveen, F.; Loyer, M.; Vongphayloth, K.; Randrianambinintsoa, F. J.; Prudhomme, J.; Rahola, N.; Akhoundi, M.; Shimabukuro, P. H. F.; Depaquit, J. Phlebotomine sand flies (Diptera, Psychodidae) of the world. Parasites & Vectors 2025, 18(1), 220. [Google Scholar] [CrossRef]
- García, A. L.; Téllez, T.; Parrado, R.; Rojas, E.; Bermúdez, H.; Dujardin, J. C. Epidemiological monitoring of American tegumentary leishmaniasis: Molecular characterization of a peridomestic transmission cycle in the Amazonian lowlands of Bolivia. Transactions of the Royal Society of Tropical Medicine and Hygiene 2007, 101(12), 1208–1213. [Google Scholar] [CrossRef]
- González, C.; Wang, O.; Strutz, S. E.; González-Salazar, C.; Sánchez-Cordero, V.; Sarkar, S. Climate change and risk of leishmaniasis in North America: Predictions from ecological niche models of vector and reservoir species. PLOS Neglected Tropical Diseases 2010, 4(1), e585. [Google Scholar] [CrossRef]
- Guzmán, H.; Tesh, R. B. Effects of temperature and diet on the growth and longevity of phlebotomine sand flies. Biomedica 2000, 20(3), 190–199. [Google Scholar] [CrossRef]
- Hlavacova, J.; Votypka, J.; Volf, P. The effect of temperature on Leishmania (Kinetoplastida: Trypanosomatidae) development in sand flies. Journal of Medical Entomology 2013, 50(5), 955–958. [Google Scholar] [CrossRef] [PubMed]
- Killick-Kendrick, R. The biology and control of phlebotomine sand flies. Clinics in Dermatology 1999, 17(3), 279–289. [Google Scholar] [CrossRef] [PubMed]
- Legendre, P.; Legendre, L. Numerical ecology, 3rd ed.; Elsevier: Oxford, UK, 2012. [Google Scholar]
- Massey, A. L.; Ferreira da Silva, D. J.; Vieira, C. J. da S. P.; Allen, J. M.; Canale, G. R.; São Bernardo, C. S.; Bronzoni, R. V. de M.; Peres, C. A.; Levi, T. Using iDNA to determine impacts of Amazonian deforestation on Leishmania hosts, vectors and their interactions. PLoS Neglected Tropical Diseases 2025, 19(3), e0012345. [Google Scholar] [CrossRef]
- McDermott, E. G.; Mullens, B. A. The dark side of light traps. Journal of Medical Entomology 2018, 55(2), 251–261. [Google Scholar] [CrossRef]
- Méndez-Cardona, S.; Lopera-Toro, A.; Morales-Monje, J. A.; Forsyth, A.; Cabrera-Quintero, O. L. Field evaluation of a commercial light trap for sand fly (Diptera: Psychodidae: Phlebotominae) surveillance in the Peruvian Amazon and new species records for Cusco Department. Journal of Vector Ecology 2025, 50(1), 60–68. [Google Scholar] [CrossRef] [PubMed]
- Méndez-Cardona, S.; Mendieta, S.; Cabrera-Quintero, O. L. Phlebotomine sand flies (Diptera: Psychodidae) from peridomestic environments at Los Amigos Biological Station, Madre de Dios, Peru. Acta Amazonica 2025b, 55, e55bc23418. [Google Scholar] [CrossRef]
- Ministerio de Salud (MINSA). Boletín Epidemiológico Volumen 34 Semana Epidemiológica 52 - 2025. 2025. Available online: https://epipublic.dge.gob.pe/uploads/boletin/boletin_202552_17_161149.pdf.
- Nieves, E.; Oraá, L.; Rondón, Y.; Sánchez, M.; Sánchez, Y.; Rojas, M.; Rondón, M.; Rujano, M.; González, N.; Cazorla, D. Effect of environmental disturbance on the population of sandflies and Leishmania transmission in an endemic area of Venezuela. Journal of Tropical Medicine 2014, 2014(1), 280629. [Google Scholar] [CrossRef]
- Le Pont, F.; Desjeux, P. Leishmaniasis in Bolivia: II. The involvement of Psychodopygus yucumensis and Psychodopygus llanosmartinsi in the selvatic transmission cycle of Leishmania braziliensis braziliensis in a lowland subandean region. Memórias do Instituto Oswaldo Cruz 1986, 81(3), 311–318. [Google Scholar] [CrossRef]
- de Oca-Aguilar, A. M.; Rebollar-Téllez, E. A.; Sosa-Bibiano, E. I.; López-Avila, K. B.; Torres-Castro, J. R.; Loría-Cervera, E. N. Effect of land use change on the phlebotomine sand fly assemblages in an emergent focus of cutaneous leishmaniasis in Yucatan, Mexico. Acta Tropica 2022, 235, 106628. [Google Scholar] [CrossRef]
- Oksanen, J.; Simpson, G.; Blanchet, F.; Kindt, R.; Legendre, P.; Minchin, P.; O’Hara, R.; Solymos, P.; Stevens, M.; Szoecs, E.; Wagner, H.; Barbour, M.; Bedward, M.; Bolker, B.; Borcard, D.; Carvalho, G.; Chirico, M.; De Caceres, M.; Durand, S.; Evangelista, H.; FitzJohn, R.; Friendly, M.; Furneaux, B.; Hannigan, G.; Hill, M.; Lahti, L.; McGlinn, D.; Ouellette, M.; Ribeiro Cunha, E.; Smith, T.; Stier, A.; Ter Braak, C.; Weedon, J. vegan: Community Ecology Package. R package version 2.6-8. 2024. Available online: https://CRAN.R-project.org/package=vegan.
- Pérez, E.; Ogusuku, E.; Monje, J.; Young, D. G. Lutzomyia (Diptera: Psychodidae) de Pillcopata (Cusco): Nuevos registros para el Perú y descripción de Lutzomyia deorsa n. sp. Revista Peruana de Entomología 1990, 33, 133–135. [Google Scholar]
- Pérez, E.; Ogusuku, E. Estacionalidad de Lutzomyia spp. (Diptera: Psychodidae) en Coloradito (Pilcopata, Cusco). Revista Peruana de Entomología 1994, 37(1), 89–96. [Google Scholar]
- Poos, M.S; Jackson, D.A. Addressing the removal of rare species in multivariate bioassessments: The impact of methodological choices. Ecological Indicators 2012, 18, 82–90. [Google Scholar] [CrossRef]
- Ramos, W. R.; Medeiros, J. F.; Julião, G. R.; Ríos-Velasquez, C. M.; Marialva, E. F.; Desmouliére, S. J. M.; Luz, S. L. B.; Pessoa, F. A. C. Anthropic effects on sand fly (Diptera: Psychodidae) abundance and diversity in an Amazonian rural settlement, Brazil. Acta Tropica 139 2014, 44–52. [Google Scholar] [CrossRef]
- R Core Team. R: A Language and Environment for Statistical Computing; R Foundation for Statistical Computing: Vienna, Austria, 2024; Available online: https://www.R-project.org/.
- Rebêlo, J. M. M.; Moraes, J. L. P.; Cruz, G. B. V.; Andrade-Silva, J.; Bandeira, M. D. C. A.; Oliveira Pereira, Y. N.; Santos, C. L. C. D. Influence of deforestation on the community structure of sand flies (Diptera: Psychodidae) in Eastern Amazonia. Journal of medical entomology 2019, 56(4), 1004–1012. [Google Scholar] [CrossRef]
- Ryan, L.; Lainson, R.; Shaw, J. J. Leishmaniasis in Brazil. XXIV. Natural flagellate infections of sandflies (Diptera: Psychodidae) in Pará State, with particular reference to the role of Psychodopygus wellcomei as the vector of Leishmania braziliensis braziliensis in the Serra dos Carajás. Transactions of the Royal Society of Tropical Medicine and Hygiene 1987, 81(3), 353–359. [Google Scholar] [CrossRef] [PubMed]
- da Silva, S. S.; Fearnside, P. M.; de Alencastro Graça, P. M. L.; Numata, I.; de Melo, A. W. F.; Ferreira, E. L.; de Aragão, L. E. O. e C.; Santos, E. A.; Dias, M. S.; Lima, R. C.; de Lima, P. R. F. Increasing bamboo dominance in southwestern Amazon forests following intensification of drought-mediated fires. Forest Ecology and Management 2021, 490, 119139. [Google Scholar] [CrossRef]
- Smith, M.; Nelson, B. W. Fire favours expansion of bamboo-dominated forests in the south-west Amazon. Journal of Tropical Ecology 2011, 27(1), 59–64. [Google Scholar] [CrossRef]
- Valdivia, H. O.; de los Santos, M. B.; Fernández, R.; Baldeviano, G. C.; Zorrilla, V. O.; Vera, H.; Lucas, C. M.; Edgel, K. A.; Lescano, A. G.; Mundal, K. D.; Graf, P. C. F. Natural Leishmania infection of Lutzomyia auraensis in Madre de Dios, Peru, detected by a fluorescence resonance energy transfer–based real-time polymerase chain reaction. The American Journal of Tropical Medicine and Hygiene 2012, 87(3), 511–516. [Google Scholar] [CrossRef]
- Valdivia, H. O.; Zorrilla, V. O.; Espada, L. J.; Pérez, J. G.; Razuri, H. R.; Vera, H.; Fernández, R.; Tong, C.; Ghersi, B. M.; Vásquez, G. M.; Burrus, R. G.; Lescano, A. G.; Montgomery, J. M. Diversity, distribution, and natural Leishmania infection of sand flies from communities along the Interoceanic Highway in the southeastern Peruvian Amazon. PLoS Neglected Tropical Diseases 2021, 15(2), e0009000. [Google Scholar] [CrossRef]
- Virtanen, P. K.; Apurinã, F.; Ruokolainen, K.; Manchineri, L. The role of Guadua bamboo in land management and Indigenous perspectives on Bamboo ecosystems in Southwestern Amazonia. Human Ecology 2022, 50(6), 1077–1088. [Google Scholar] [CrossRef]
- Vivero-Gomez, R.; Duque-Granda, D.; Rader, J. A.; Stuckert, A.; Santander-Gualdron, R.; Cadavid-Restrepo, G.; Moreno-Herrera, C. X.; Matute, D. R. Humidity and temperature preference in two Neotropical species of sand flies. Parasites & Vectors 2024, 17(1), 246. [Google Scholar] [CrossRef] [PubMed]
- World Health Organization (WHO). (2010). Control of the leishmaniases: Report of a meeting of the WHO Expert Committee on the Control of Leishmaniases, Geneva. (WHO Technical Report Series No. 949). World Health Organization.
- World Health Organization (WHO). (2017). Fact sheets: Neglected infectious diseases – Leishmaniasis. https://www3.paho.org/hq/dmdocuments/2017/2017-cha-leishmaniasis-factsheet-work.pdf.
- World Health Organization (WHO). Global Health Observatory: Leishmaniasis. 2023. Available online: https://www.who.int/data/gho/data/themes/topics/gho-ntd-leishmaniasis.
- Yupari-Azabache, I. L.; Díaz-Ortega, J. L.; Bardales-Aguirre, L. B.; Barros-Sevillano, S.; Paredes-Díaz, S. E. Cluster analysis of factors associated with leishmaniasis in Peru. Tropical Medicine and Infectious Disease 2023, 8(10), 484. [Google Scholar] [CrossRef] [PubMed]
- Zorrilla, V.; Vásquez, G.; Espada, L.; Ramírez, P. Update on tegumentary leishmaniasis and Carrion’s disease vectors in Peru. Revista Peruana de Medicina Experimental y Salud Pública 2017, 34(3), 485–496. [Google Scholar] [CrossRef]
Figure 2.
Heatmap depicting habitat associations of sand fly species from multilevel indicator species analysis. Filled cells indicate associations with corresponding habitats, with color intensity representing indicator values (IndVal). Panels show (A) non-significant associations (p ≥ 0.05), (B) non-specific associations (widespread species), and (C) significant associations (p < 0.05). Asterisks denote potential vectors.
Figure 2.
Heatmap depicting habitat associations of sand fly species from multilevel indicator species analysis. Filled cells indicate associations with corresponding habitats, with color intensity representing indicator values (IndVal). Panels show (A) non-significant associations (p ≥ 0.05), (B) non-specific associations (widespread species), and (C) significant associations (p < 0.05). Asterisks denote potential vectors.
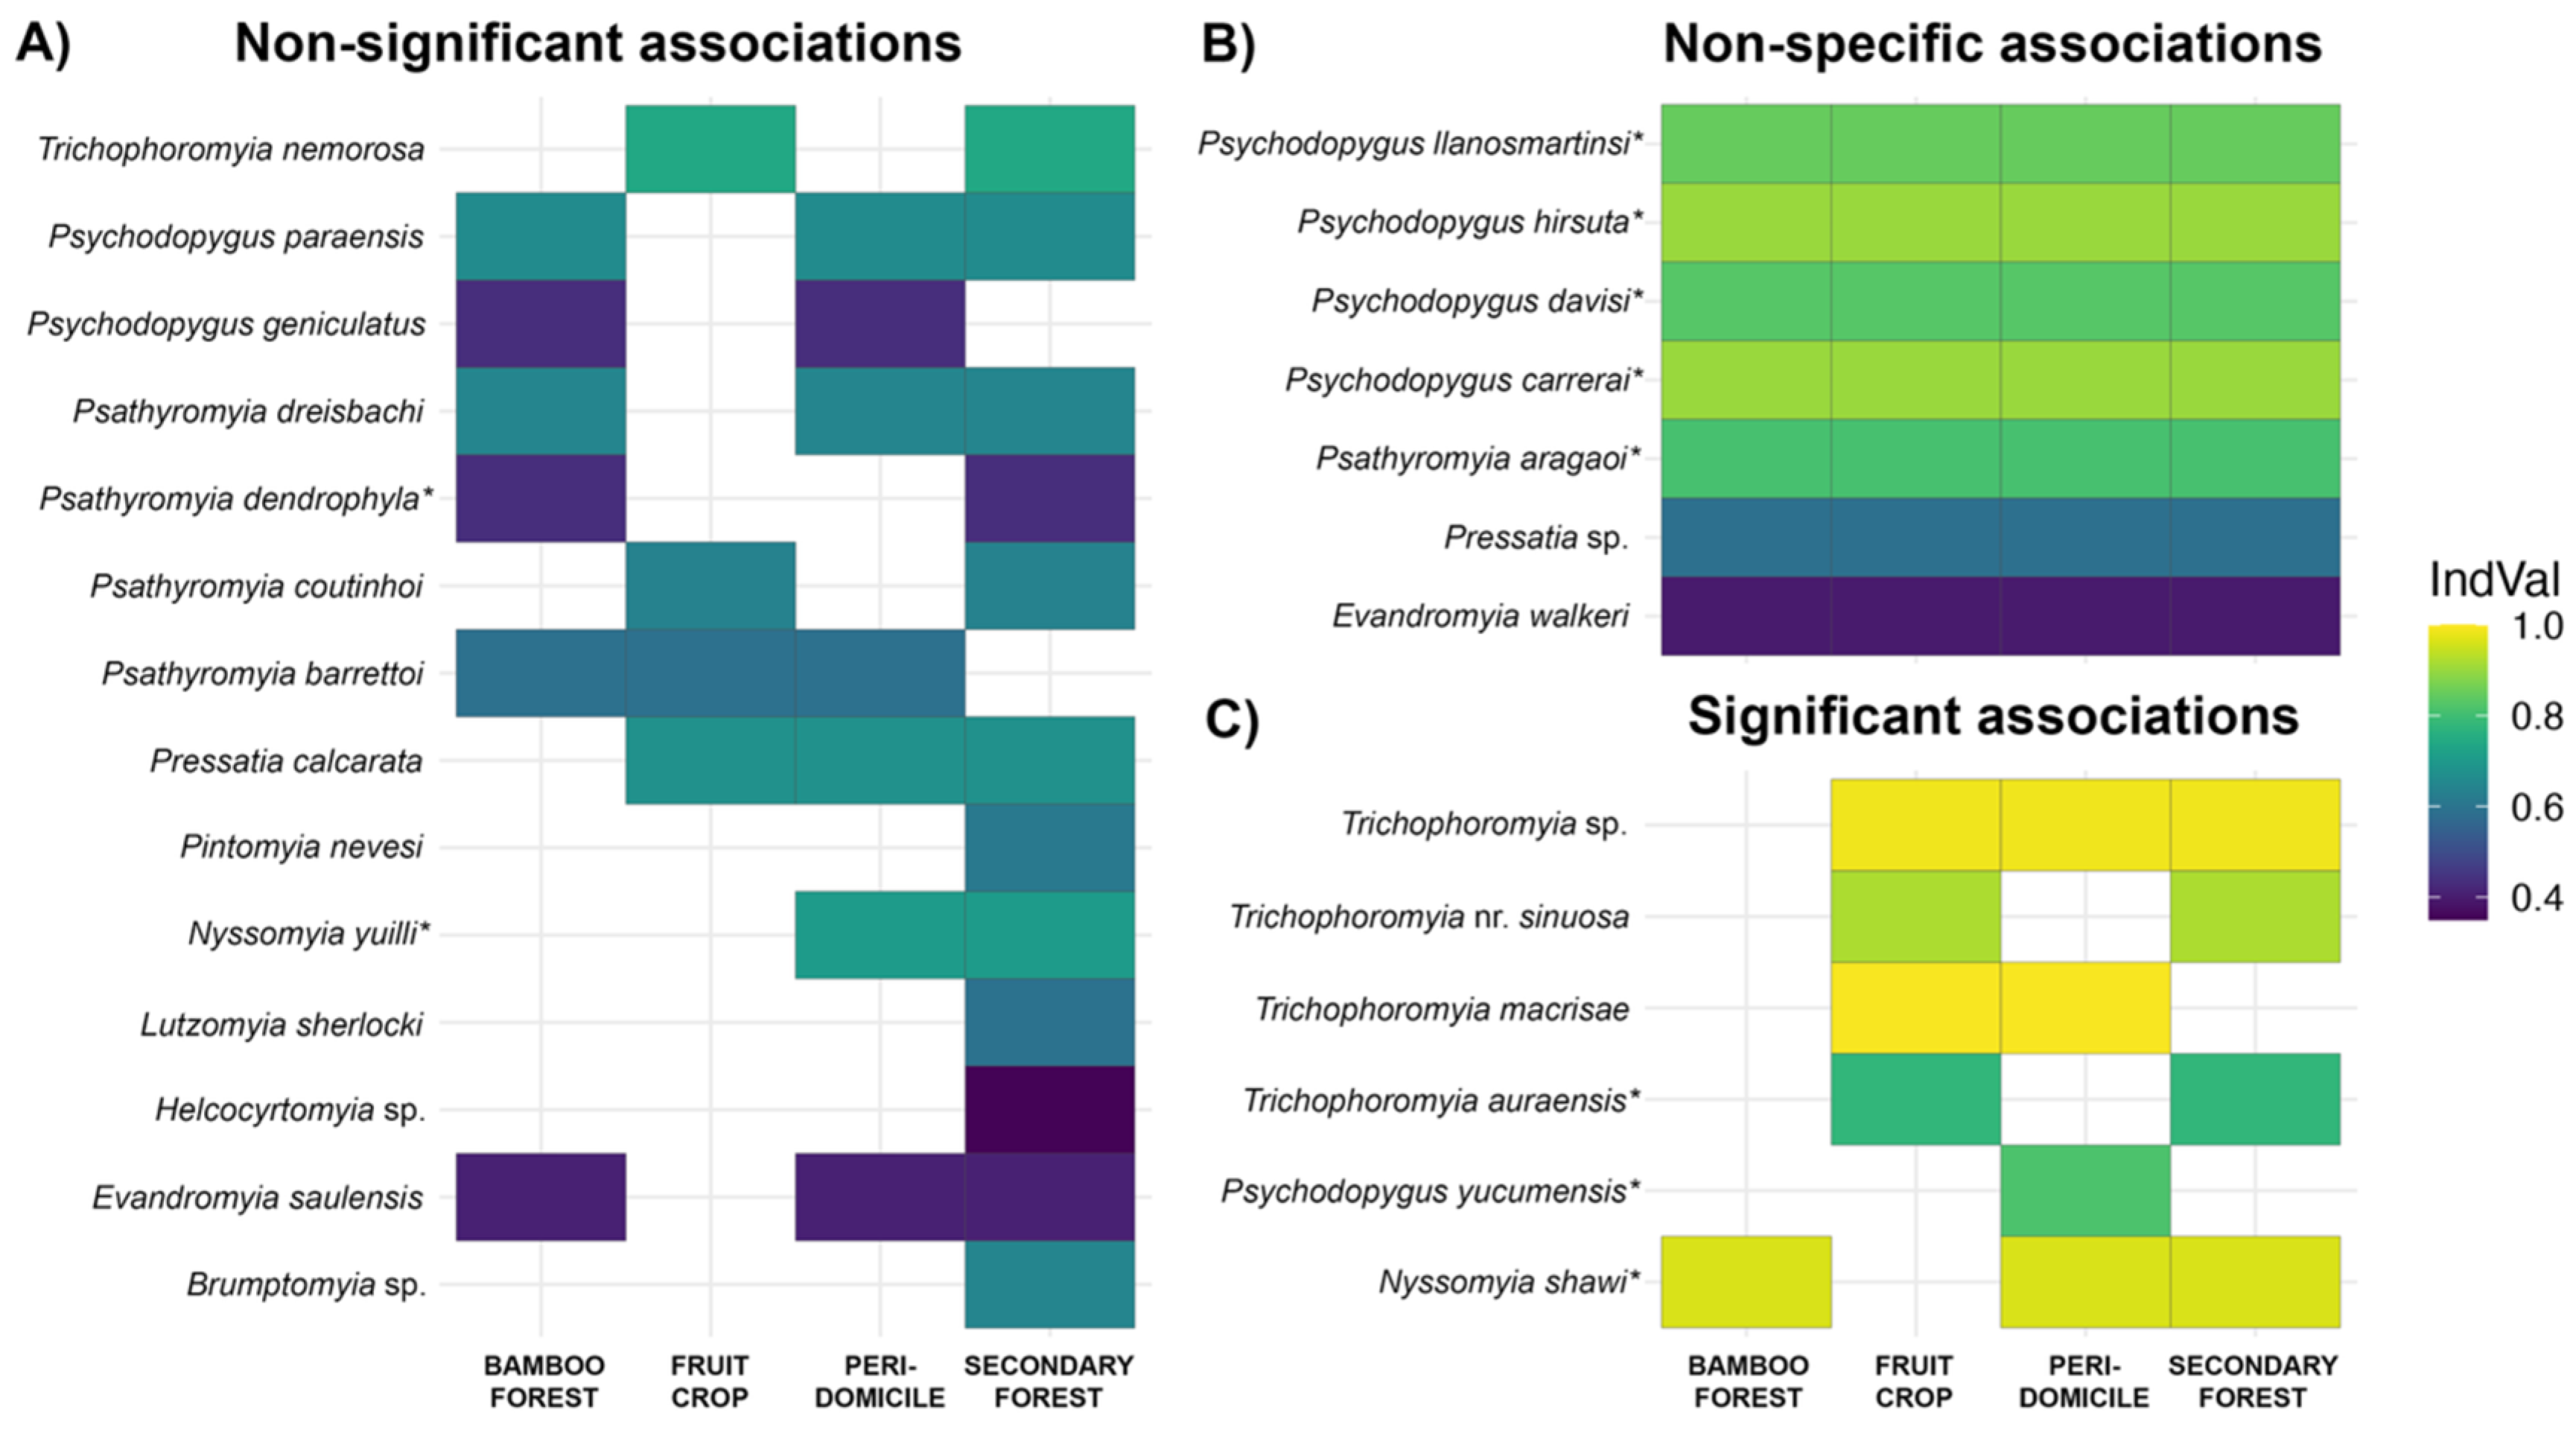
Figure 3.
Non-metric multidimensional scaling (NMDS) ordination of sand fly assemblage composition across habitats and sampling dates. Points represent individual collection events, colored by habitat type and shaped by sampling date. Environmental vectors indicate correlates of community composition, with arrow length proportional to correlation strength. Asterisks denote statistical significance (*p < 0.05). Stress value indicates the quality of the two-dimensional representation.
Figure 3.
Non-metric multidimensional scaling (NMDS) ordination of sand fly assemblage composition across habitats and sampling dates. Points represent individual collection events, colored by habitat type and shaped by sampling date. Environmental vectors indicate correlates of community composition, with arrow length proportional to correlation strength. Asterisks denote statistical significance (*p < 0.05). Stress value indicates the quality of the two-dimensional representation.
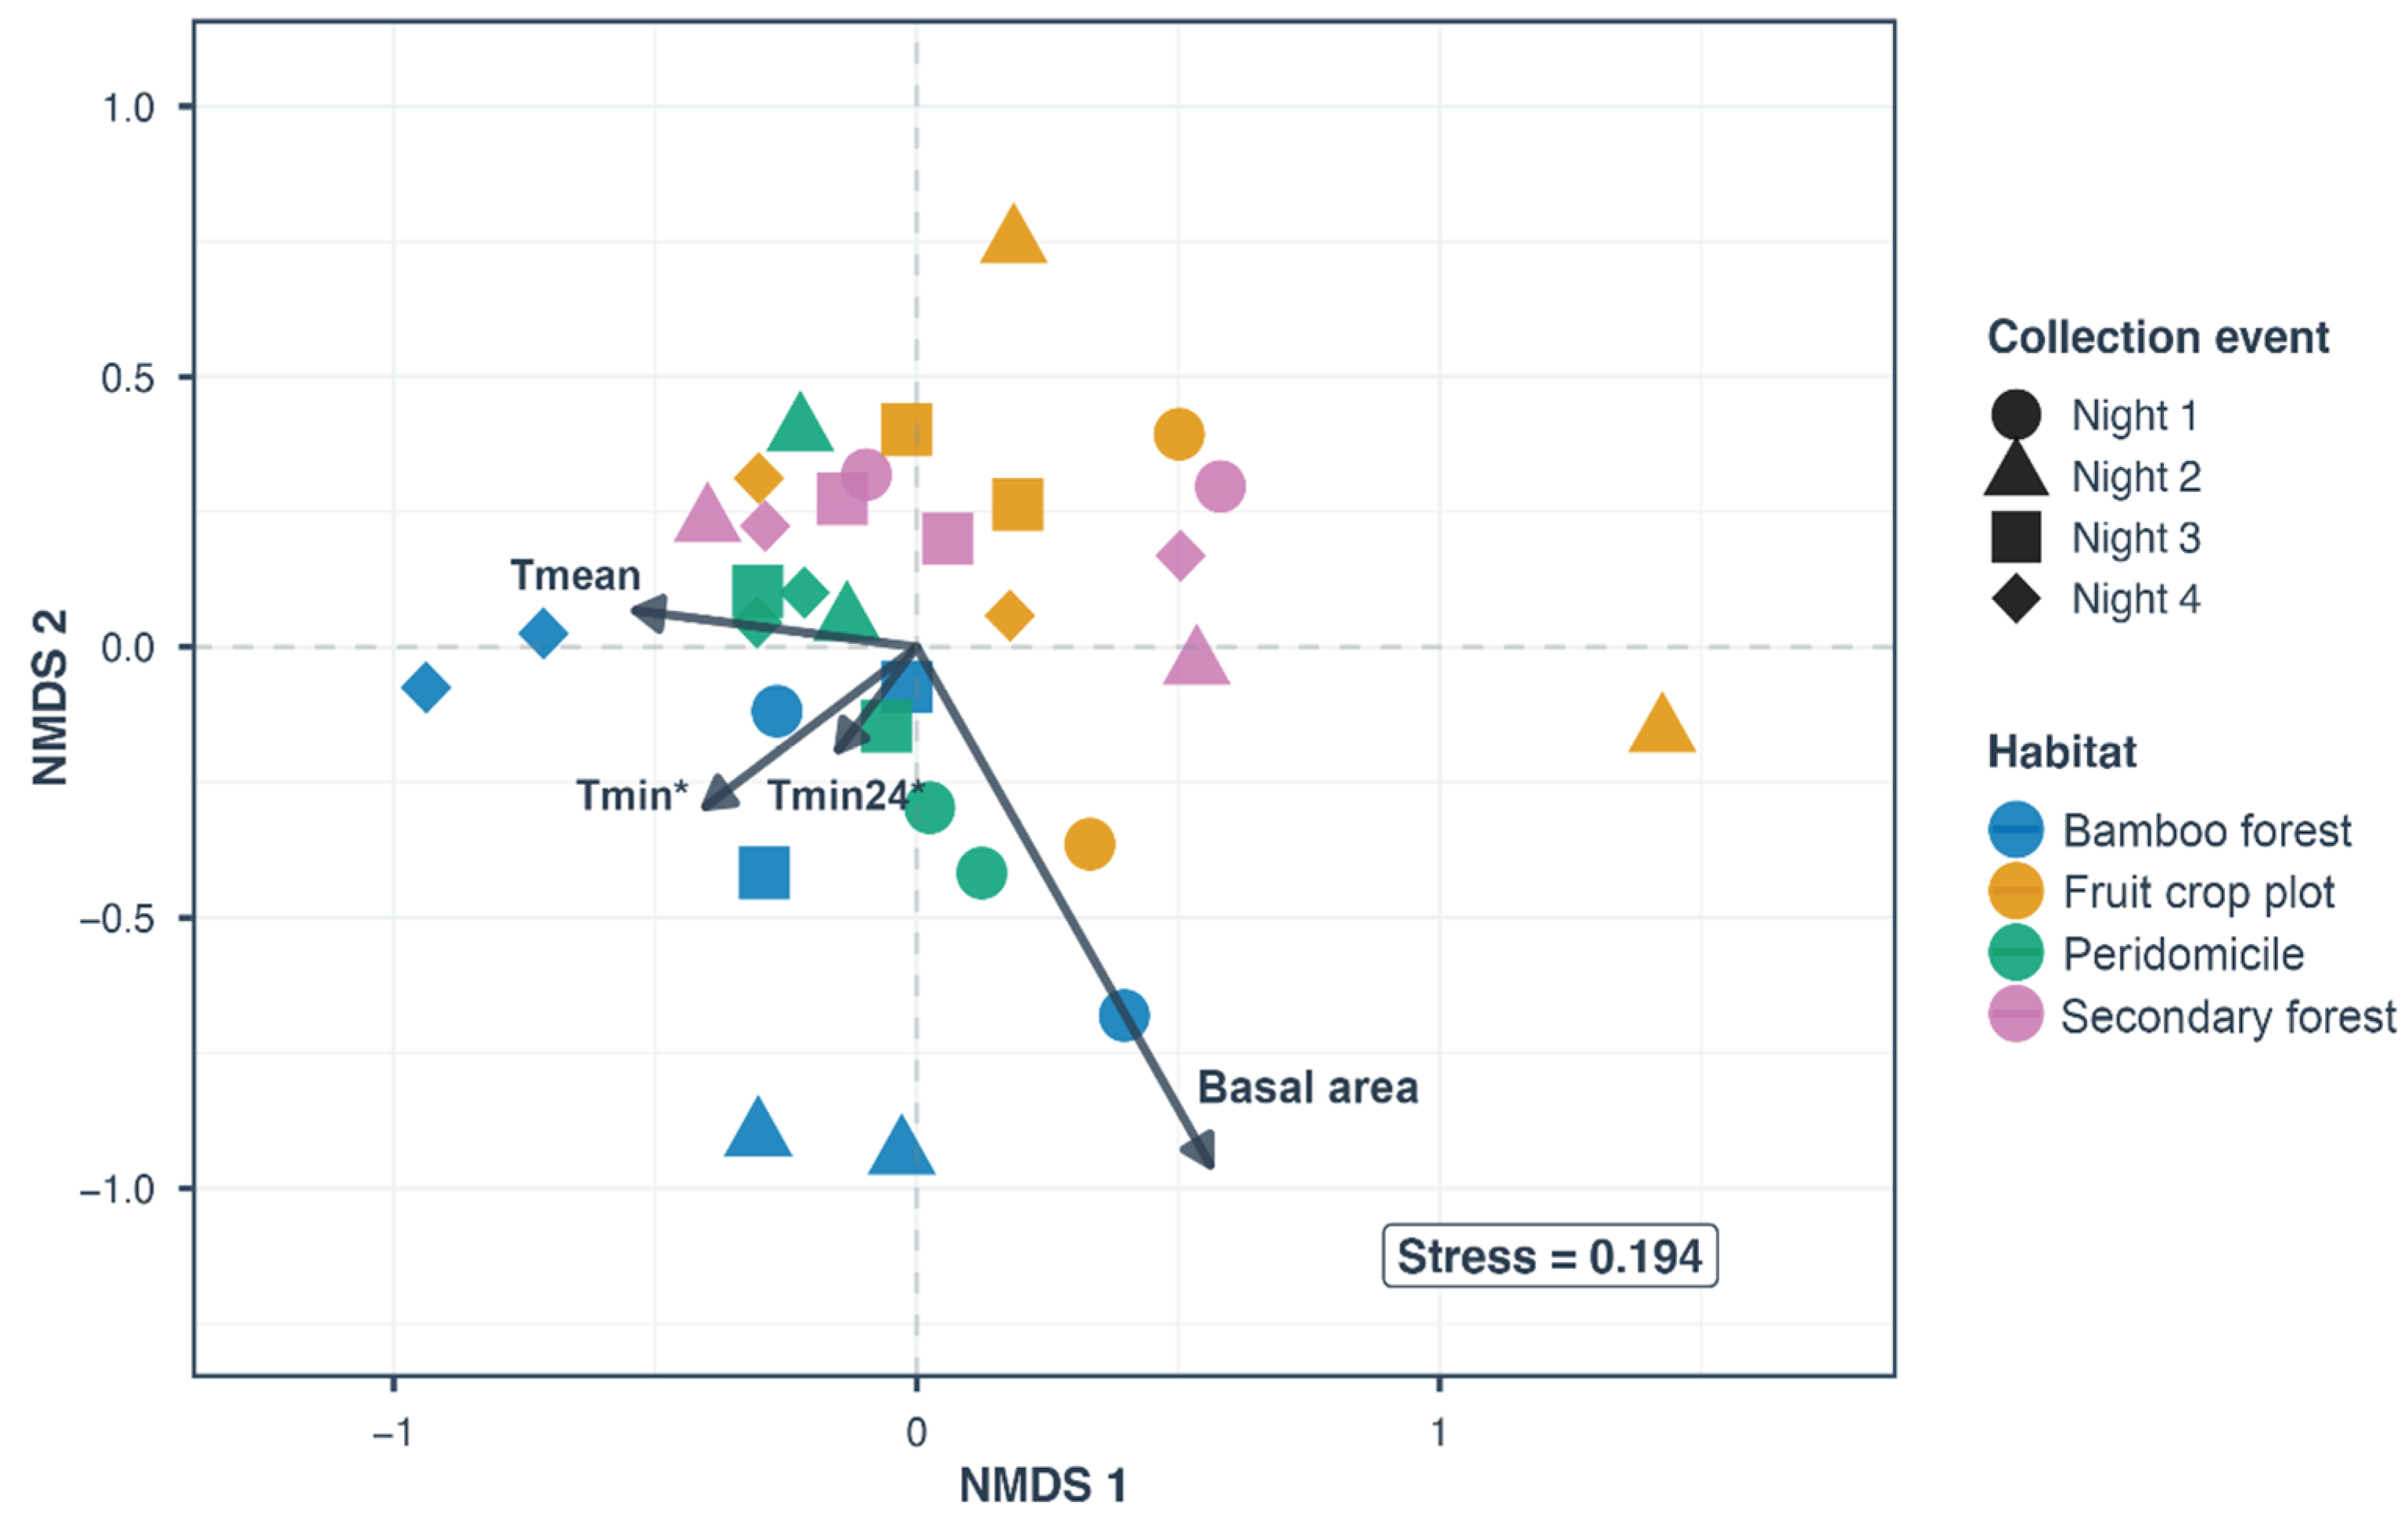

Table 1.
Sand fly abundance by species and habitat type, with percentage of females per species. Data represent pooled collections across all sampling nights at Manu Biological Station, Peru, March-May 2023. Asterisks denote potential vector species.
Table 1.
Sand fly abundance by species and habitat type, with percentage of females per species. Data represent pooled collections across all sampling nights at Manu Biological Station, Peru, March-May 2023. Asterisks denote potential vector species.
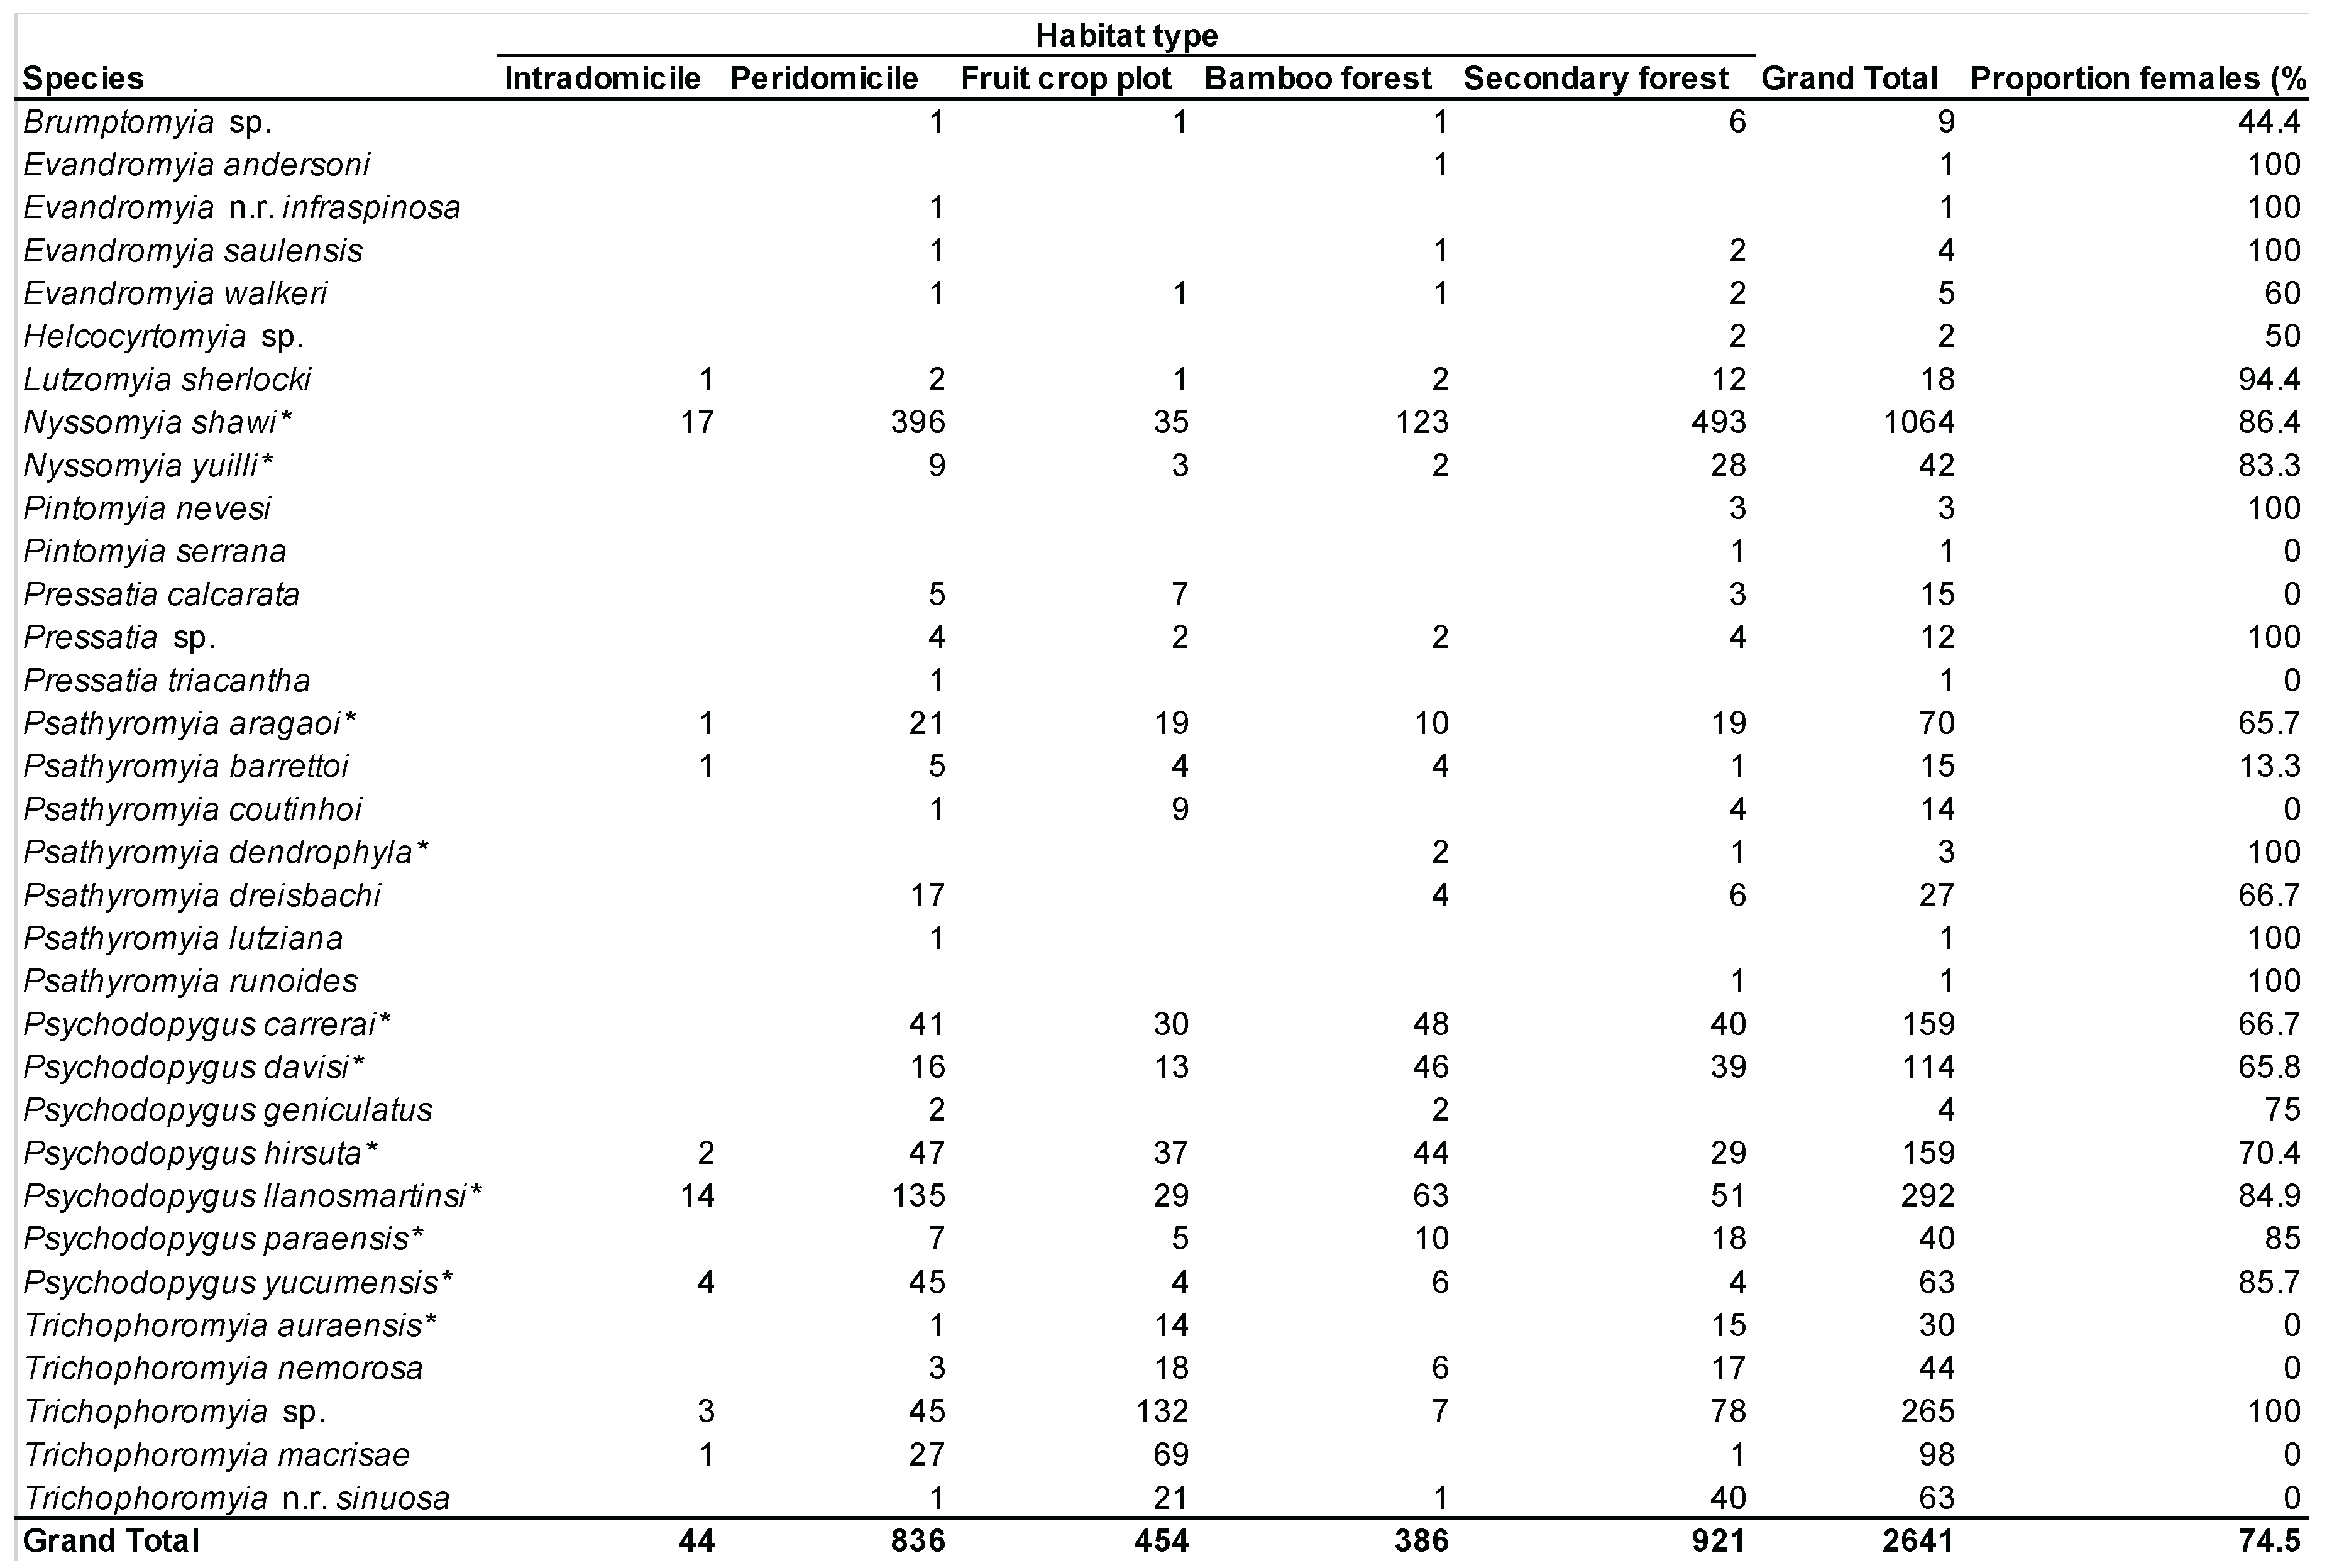 |
Table 2.
Sampling completeness, diversity metrics, and potential vector abundance for sand fly assemblages across habitat types.
Table 2.
Sampling completeness, diversity metrics, and potential vector abundance for sand fly assemblages across habitat types.
| Metric | Secondary Forest |
Fruit Crop Forest |
Bamboo Forest | Peridomicile |
| Sampling completeness | ||||
| Sample coverage (Cq=1) | 0.995 | 0.993 | 0.987 | 0.992 |
| Species coverage (Cq=0) | 0.871 | 0.824 | 0.898 | 0.671 |
| Diversity estimates | ||||
| Observed richness (q=0) | 28 | 21 | 22 | 25 |
| Estimated richness | 32.2 | 25.5 | 24.5 | 37.2 |
| Shannon diversity (q=1) | 6.9 | 10.88 | 8.33 | 6.81 |
| Simpson diversity (q=2) | 3.26 | 7.31 | 5.77 | 3.77 |
| Dominant species | Ny. shawi (54%) | Trichophoromyia spp. (29%) | Ny. shawi (32%) | Ny. shawi (48%) |
| Potential vectors | ||||
| Proportional abundance | 81% | 42% | 92% | 86% |
| Absolute abundance (n) | 737 | 189 | 354 | 718 |
Disclaimer/Publisher’s Note: The statements, opinions and data contained in all publications are solely those of the individual author(s) and contributor(s) and not of MDPI and/or the editor(s). MDPI and/or the editor(s) disclaim responsibility for any injury to people or property resulting from any ideas, methods, instructions or products referred to in the content. |
© 2026 by the authors. Licensee MDPI, Basel, Switzerland. This article is an open access article distributed under the terms and conditions of the Creative Commons Attribution (CC BY) license (http://creativecommons.org/licenses/by/4.0/).
Copyright: This open access article is published under a Creative Commons CC BY 4.0 license, which permit the free download, distribution, and reuse, provided that the author and preprint are cited in any reuse.


