

Submitted:
17 March 2026
Posted:
18 March 2026
You are already at the latest version
Abstract
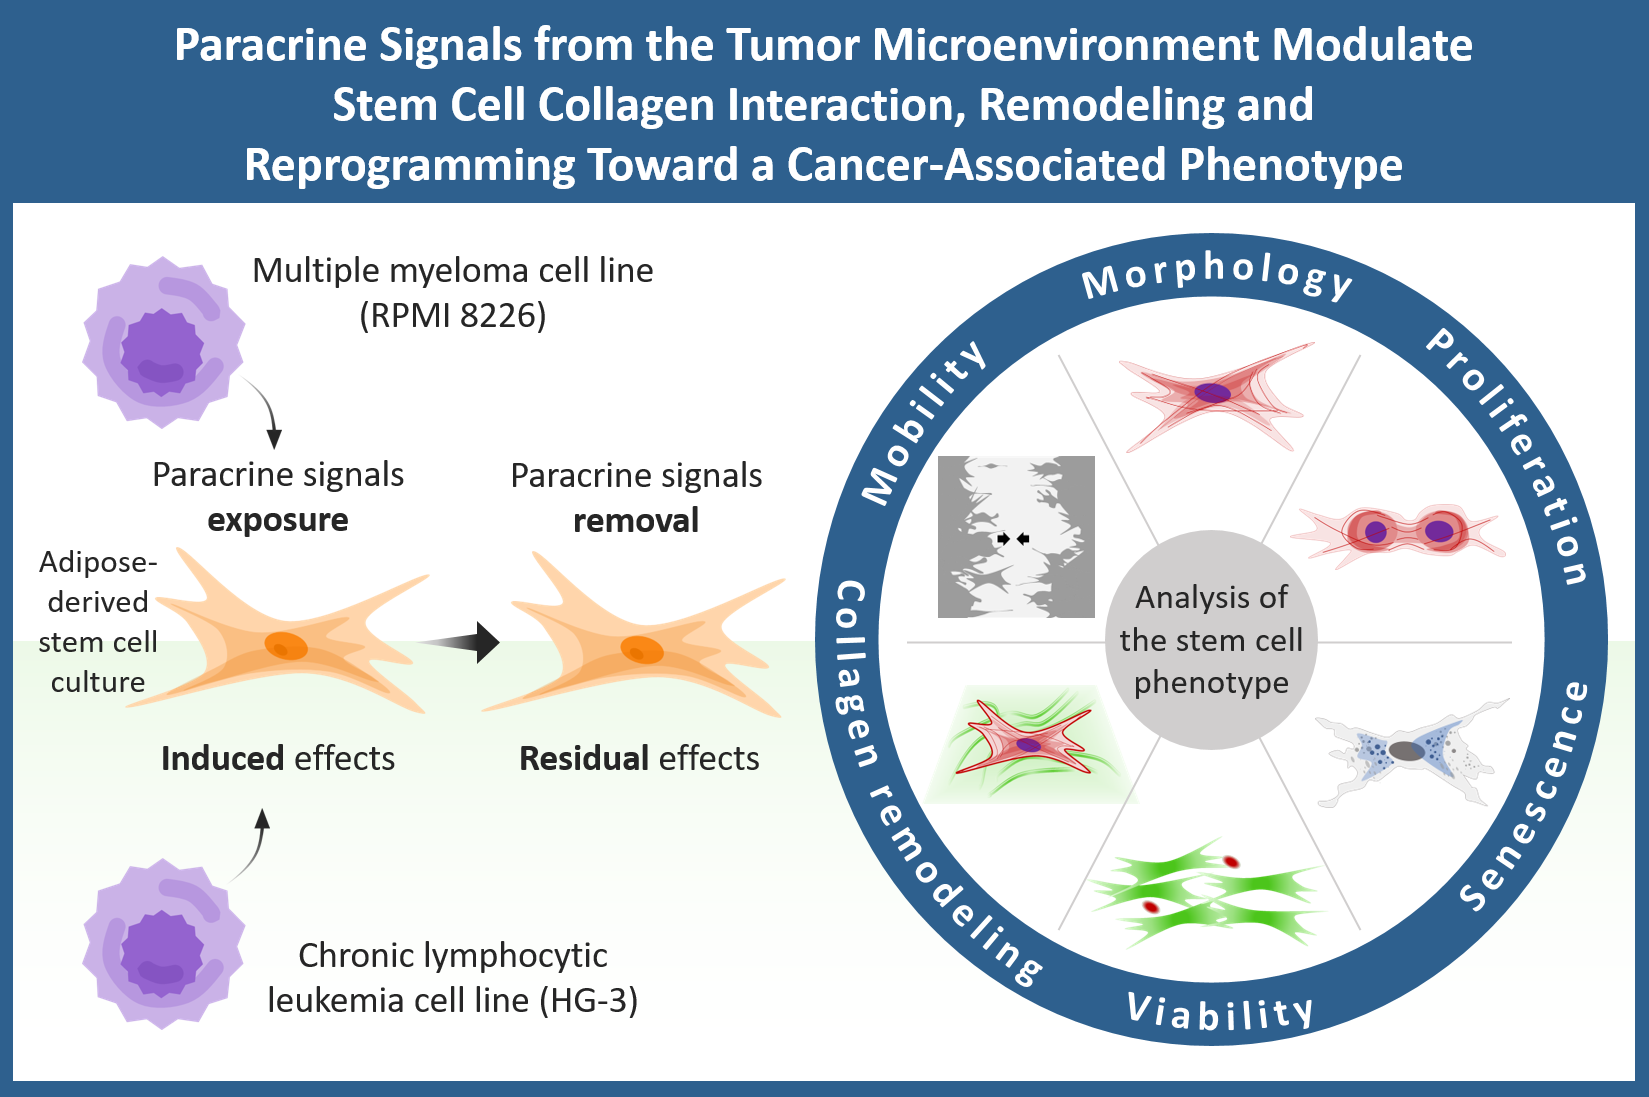
The tumor microenvironment is continuously shaped by reciprocal interactions between malignant cells and stromal components, with mesenchymal stem cells (MSCs) serving as key regulators of extracellular matrix (ECM) deposition and remodeling. In this study, we examined how cancer cell-derived secretomes from two hematological cancer cell lines, RPMI 8226 (multiple myeloma) and HG-3 (B-cell leukemia), influence the functional behavior of human adipose-derived MSCs (AD-MSCs). Exposure to these secretomes altered MSC proliferative capac-ity (2x faster doubling compared to the control), induced senescence (~3-4x higher than that of the control), and significantly modified MSC mediated colla-gen remodeling, as quantified using FITC-collagen coated substrata. Tumor con-ditioned media also reduced MSC spreading area (~2100 µm2 compared to the control ~2500 µm2) and induced distinct morphological changes indicative of a possible shift toward a cancer associated stromal phenotype. To assess the stabil-ity of these changes, MSCs were analyzed following a withdrawal of the cancer cell secretomes and further cultured in secretome-free environment, which re-vealed that most phenotypic and functional alterations were maintained and that the reprogramming is partially irreversible. These findings also demonstrate that the paracrine factors released by RPMI 8226 and HG-3 cells modulate MSC func-tionality upon interaction with collagen, providing insight into stromal contribu-tions to tumor progression.
Keywords:
tumor microenvironment
; mesenchymal stem cells (MSCs)
; cancer cell secretome
; MSC reprogramming
; collagen remodeling
; multiple myeloma and B-cell leukemia cell lines
1. Introduction
Mesenchymal stromal/stem cells (MSCs) are key regulators of tissue homeostasis and repair, owing to their multipotent regenerative potential, immunomodulatory properties and capacity to remodel the extracellular matrix (ECM) [1]. In recent years, increasing attention has been directed toward the remarkable plasticity of MSCs within pathological environments, particularly in the context of cancer.
The concept that tumors can recruit and reprogram MSCs into a pro-tumorigenic stromal population emerged in the early 2000s, when MSCs were first shown to home to sites of inflammation and neoplasia [2,3]. In this work we refer to this cell population as cancer-associated MSCs (CA-MSCs), even though the terms tumor-associated MSCs (TA-MSCs) and transformed MSCs are also widely used in the literature [4,5].
Subsequent studies demonstrated that once within the tumor microenvironment, MSCs undergo profound transcriptional, epigenetic, and functional reprogramming, acquiring immunosuppressive, angiogenic, and metastasis-supporting properties [6,7,8,9]. These findings established CA-MSCs as key architects of the tumor niche, capable of shaping malignant progression through reciprocal interactions with cancer cells. In this context, CA-MSCs help organize the tumor niche and modulate cancer progression [10,11], whereas cancer-associated fibroblasts (CAF), which have also been extensively studied, provide a similar and potentially complementary stromal influence. Yet their exact relationship remains uncertain because definitive CAF markers are still lacking [4,12,13,14].
Tumors actively reshape their microenvironment through a complex mixture of soluble factors, extracellular vesicles, cytokines, and matrix-modifying enzymes, collectively recognized as cancer cell secretome [15]. These paracrine signals can profoundly alter the phenotype and the function of resident or recruited stromal cells, including MSCs, driving their conversion into CA-MSCs, or CAF [16,17,18]. Nonetheless, CA-MSCs have emerged as critical contributors to tumor progression. They promote cancer cell proliferation, angiogenesis, immune evasion, and metastatic dissemination through secretion of pro-tumorigenic cytokines, remodeling of the ECM, and modulation of cancer cell mechanics [19]. Senescence is a particularly intriguing outcome of tumor-induced MSC reprogramming. While senescent MSCs exhibit reduced proliferative capacity, they often display a senescence-associated secretory phenotype (SASP) that enhances inflammation, ECM degradation, and tumor progression [20,21,22]. Paradoxically, several studies report that tumor-derived factors can simultaneously stimulate MSC proliferation and induce stress-related senescence markers, suggesting a dynamic transition from a proliferative burst to stress-induced premature senescence (SIPS) [23]. This dual behavior reflects the complex interplay between mitogenic and stress-inducing signals within the tumor microenvironment. This highlights the central role of the cancer cell secretome in shaping stromal cell behavior.
Hematological malignancies such as multiple myeloma and B-cell leukemias exhibit a pronounced dependence on their microenvironment, where stromal cells promote tumor survival, therapeutic resistance, and immune evasion [24,25,26]. Myeloma cells, for instance, release interleukin (IL) 6, transforming growth factor beta (TGF-β), vascular endothelial growth factor (VEGF) and exosomal micro ribonucleic acid (miRNAs) that reprogram bone marrow–derived MSCs (BM-MSCs) toward a senescent, pro-inflammatory and ECM-remodeling phenotype [27,28]. Likewise, leukemic B cells secrete soluble mediators capable of altering MSC proliferation, migration, differentiation, and matrix-degrading activity [29,30,31]. Given this strong niche dependency within the pathological bone-marrow environment, an important question is whether malignant hematologic cells exert comparable effects on MSCs from non-marrow tissues, such as adipose-derived MSCs (AD-MSCs). The presence of extramedullary myeloma and leukemic infiltration into adipose-rich tissues further suggests that AD-MSCs may represent alternative stromal targets relevant to disease dissemination. Yet, the impact of cancer-derived secretomes on the functional behavior of AD-MSCs—a widely distributed, readily accessible, and clinically relevant MSC population, remains poorly characterized. Moreover, because many clinical-grade MSC products originate from adipose or umbilical-cord tissue, understanding how myeloma or leukemia cells modulate these MSC types has direct implications for the safety and design of MSC-based therapies.
In this study, we investigated how cancer cell secretomes derived from two hematological cancer cell lines—RPMI 8226 (multiple myeloma) and HG-3 (B-cell leukemia)—affect key functional properties of human AD-MSCs. We examined changes in cell adhesion and spreading area, proliferation, senescence induction, and ECM remodeling using FITC-collagen as model system. Furthermore, we assessed whether these tumor-induced phenotypic alterations persist after removal of the secretome, providing insight into the stability of MSC reprogramming. Understanding how hematological cancer cell secretomes modulate AD-MSC behavior may shed light on the mechanisms underlying TA-MSC formation and reveal new aspects of stromal involvement in cancer progression.
2. Materials and Methods
2.1. Cells and Culturing
2.1.1. Cancer Cell Lines
The human multiple myeloma cell line RPMI 8226 (American Type Culture Collection, ATCC, USA) and the human chronic lymphocytic leukemia cell line HG-3 (purchased by Leibniz Institute DSMZ-German Collection of Microorganisms and Cell Cultures, Germany) were cultured in RPMI-1640 medium supplemented with 10% fetal bovine serum (FBS), 1% penicillin-streptomycin, and 2 mM L-glutamine (all from Sigma Aldrich, USA) in standard T25 or T75 tissue culture (TC) flasks (Corning, USA) at a seeding density of 5 × 10⁵ cells/ml and cultured under standard conditions (37 °C, 5% CO2).
2.1.2. Human Adipose Tissue-Derived Mesenchymal Stem Cells
Human AD-MSCs used for the experiments were obtained by Tissue Bank BulGen (Sofia, Bulgaria) with informed consent from donors prior to liposuction. Cells were cultured in DMEM/F12 medium supplemented with 10% FBS and 1% antibiotic-antimycotic solution (all from Sigma-Aldrich, USA) using small T25 TC flasks (Greiner Bioone, Meckenheim, Germany) in humidified thermostat at 37 °C, 5% CO2. Medium (typically 5 ml) was replaced every 2 to 3 days until cells reached ~90% confluency and then passaged using 0.05% trypsin/0.6 mM EDTA (Sigma-Aldrich, USA). Cells used for experiments were between passages 4 and 6.
2.2. Accumulation of Cancer Cell Secretome
Cancer cell secretomes were obtained from human multiple myeloma cell line RPMI 8226 and the human chronic lymphocytic leukemia cell line HG-3 under serum-free conditions. The cells were washed with phosphate buffered saline (PBS) (Sigma Aldrich, USA) via centrifuging at 400× g, and seeded at a density of 5 × 10⁵ cells in 5 mL serum-free RPMI 1640 medium with 1% penicillin-streptomycin, and 2 mM L-glutamine (all from Sigma Aldrich, USA), before being incubated for 72 h in standard conditions (37 °C, 5% CO2) to allow accumulation of soluble factors released by the cancer cells.
Following incubation, the conditioned media were collected and cleared by centrifugation at 400× g for 10 min to remove cell debris. The resulting supernatant was subsequently concentrated 10-times using Amicon Ultra centrifugal filters (Amicon, Schorndorf, Germany) with a 3 kDa molecular weight cutoff, according to the manufacturer’s instructions. Fresh cell media was subjected to the same treatment as the conditioned media, to be used later as a control. The protein concentration was measured using Bradford assay (Sigma-Aldrich, USA) and determined to be approximately 0.5 mg/ml for both cell lines. Concentrated secretomes and empty controls were aliquoted and stored at −80 °C until use.
2.3. Treatment with Cancer Cell Secretome
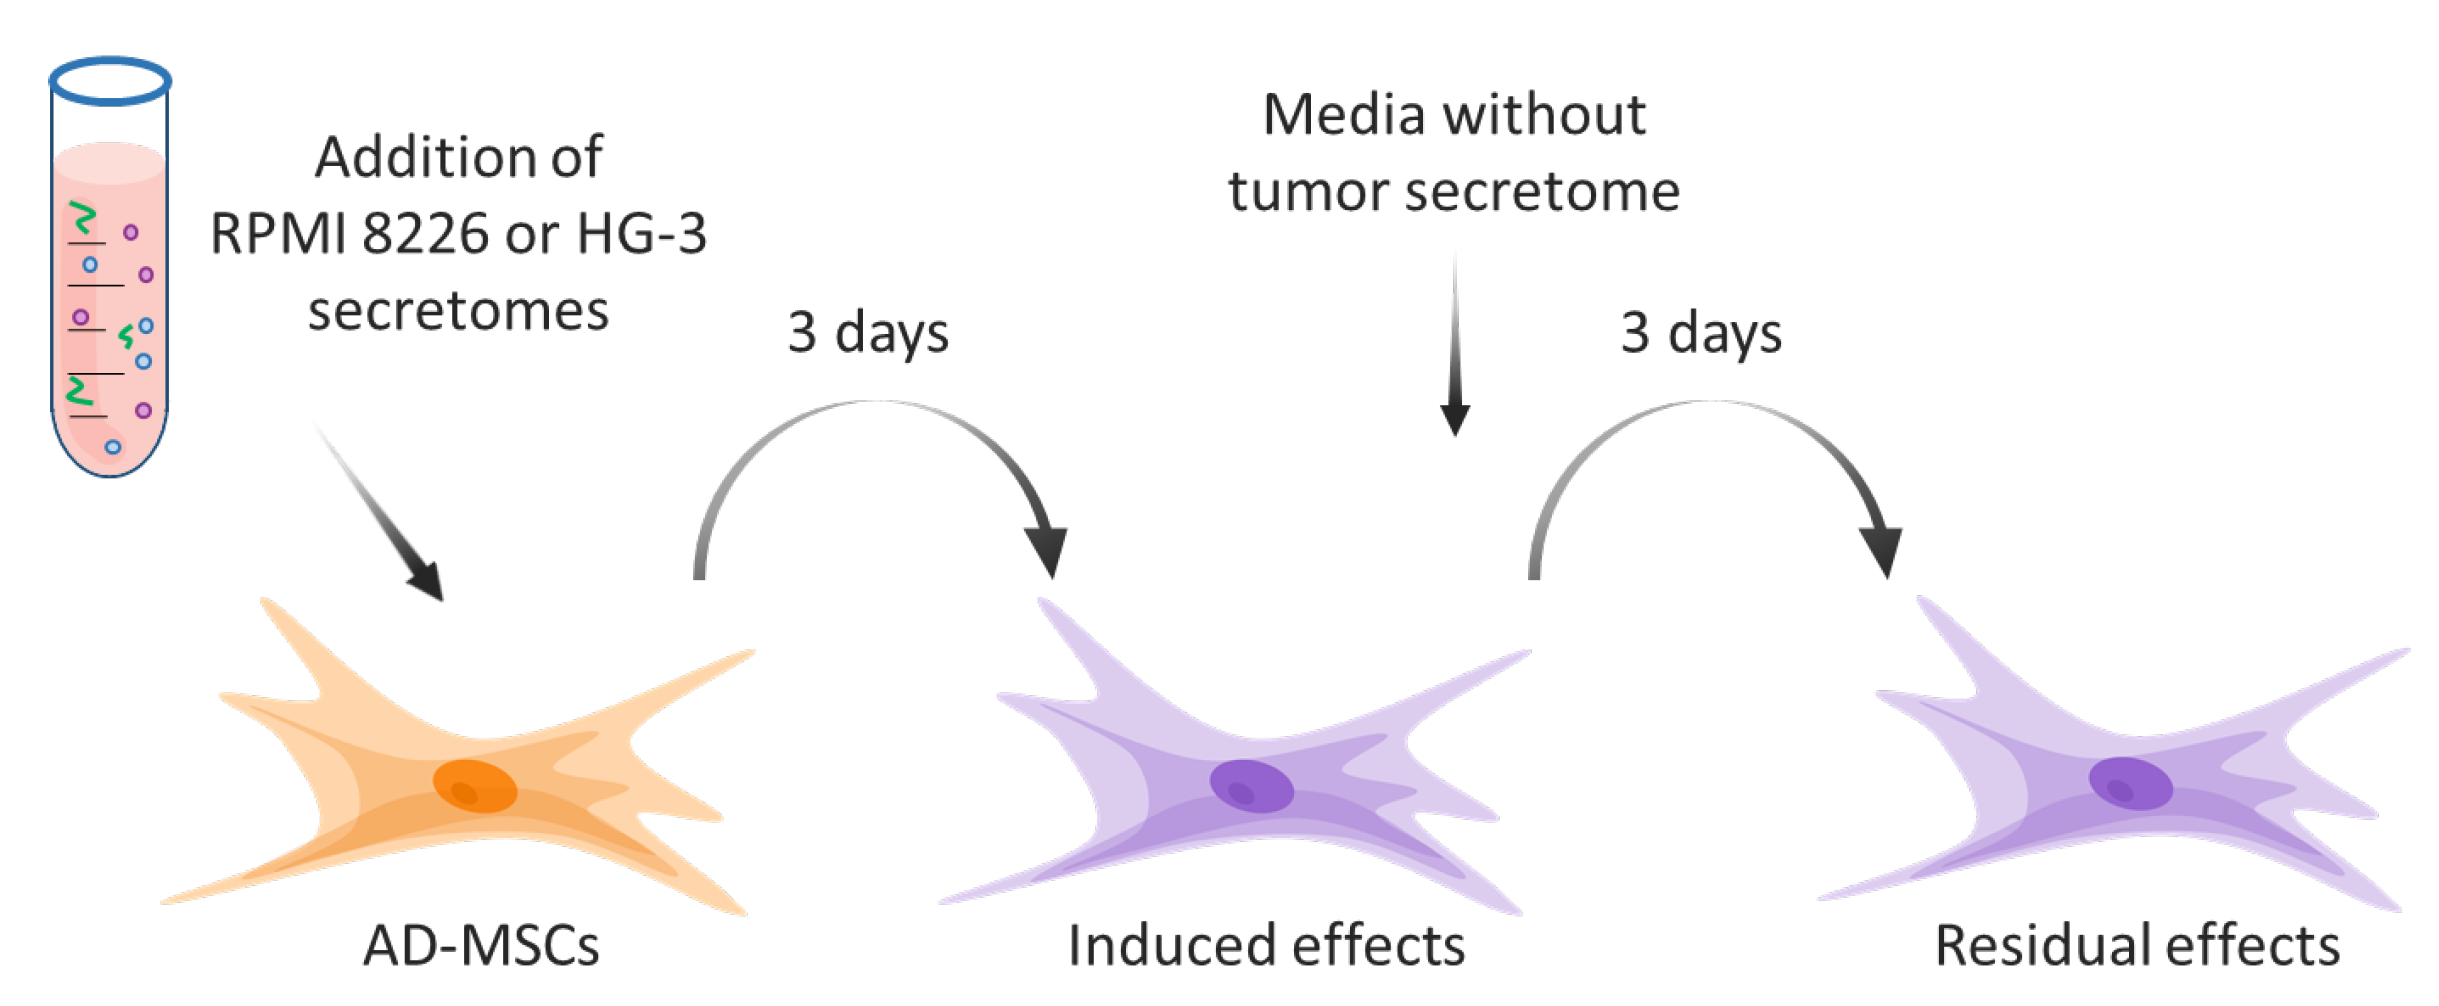
AD-MSCs were seeded in 6-well TC plates (Sensoplate, Greiner Bioone, Meckenheim, Germany) at density of 3.3 × 10⁴ cells/well in 2 mL DMEM/F12 with 1% antibiotic–antimycotic solution, 10% FBS (all from Sigma-Aldrich, as stated above) and RPMI 8226/HG-3 secretome added in final protein concentration of 0.05 mg/mL to restore the initial concentration in the cancer cell culture medium. For a control cells were treated with 10× diluted control media concentrate (as detailed in Section 2.2). The cells were cultured in standard conditions (37 °C, 5% CO2) for 3 days to assess the “induced” effects.
For the evaluation of the stability of these effects (e.g., the “residual” outcome) the cells were washed 2 times with PBS and further replaced with secretome-free media for an additional 3 days. The initial seeding density for these conditions was 1.7 × 10⁴ cells/well.
Figure 1.
Schematic representation of the AD-MSCs cancer cell-secretome treatment setup. The concentrated RPMI 8226 or HG-3 secretomes were added to the cultured AD-MSCs and incubated for 3 days to evaluate the “induced” effects. For the “residual” effects, the AD-MSCs were further incubate for another 3 days in secretome-free medium.
Figure 1.
Schematic representation of the AD-MSCs cancer cell-secretome treatment setup. The concentrated RPMI 8226 or HG-3 secretomes were added to the cultured AD-MSCs and incubated for 3 days to evaluate the “induced” effects. For the “residual” effects, the AD-MSCs were further incubate for another 3 days in secretome-free medium.
2.4. Live-Dead Analysis
AD-MSCs were seeded in 6-well tissue-culture plates (Sensoplate, Greiner Bio-One, Meckenheim, Germany) at a density of 3.3 × 10⁴ cells/well for the “induced” samples and 1.7 × 10⁴ cells/well for the “residual” samples. The lower seeding density for the residual group was used to compensate for the additional three days of cell growth prior to treatment. Cells were then exposed to secretome derived from RPMI 8226 or HG-3 cells at a final protein concentration of 0.05 mg/mL, or to control medium supplemented with 10% FBS and 1% antibiotic-antimycotic solution (all reagents from Sigma-Aldrich, USA). “Residual” samples were handled identically for first three days, but then switched to secretome-free medium for three more days.
Cell viability was assessed at 24 h and 72 h using the Cellstain Double Staining Kit (Sigma-Aldrich, Cat. No. 04511) following the manufacturer’s instructions. A freshly prepared staining solution containing Calcein-AM (labeling viable cells in green) and propidium iodide (PI) (labeling nuclei of non-viable cells in red) was added to each well at a ratio of 10 μl per 1 ml of medium. Samples were incubated for 15 min at 37 °C in the dark prior to imaging. Fluorescent images were acquired using a fluorescence microscope (Thunder Imager Live Cell, Leica Microsystems, Switzerland) with appropriate filter sets to count the percentage of live versus dead cells.
2.5. Overall Cell Morphology
To investigate the overall cell morphology after treatment (under “induced” and “residual” conditions) AD-MSCs were seeded in 24-well glass bottomed plates (Greiner Bio-One, Frickenhausen, Germany) pre-coated with collagen (see Section 2.7 and Section 2.8) at a density of 1 × 10⁴ cells/well and cultured for 2 h in serum-free medium before 10% FBS was added for the next 3 h. Then the samples were fixed with 4% paraformaldehyde (PFA) and permeabilized with 0.5% Triton X-100 for 5 min before being washed and treated with blocking solution (10% FBS dissolved in PBS) for 15 min. The actin cytoskeleton was visualized using Atto 633 phalloidin (Sigma-Aldrich, USA), and the nuclei were counterstained with Hoechst 33258 (Sigma-Aldrich, 1:2000 dilution). Fluorescent images were acquired using a fluorescent microscope (Thunder Imager as above) with 20× objective. To determine quantitatively the cell spreading area, the CellProfiler software version 4.2.8 [32] was used.
2.6. Cell Proliferation Assay
AD-MSCs were treated as described in Section 2.3. To evaluate cell proliferation, samples were analyzed after 24, 48 and 72 h of culture. At each time point, cells were fixed with 4% PFA and stained with Hoechst 33258 (1:2000 dilution) to visualize nuclei. Fluorescence images were acquired at 10× magnification using a Thunder fluorescent microscope as above. Quantification was performed with CellProfiler software, enabling objective counting of nuclei across nine fields per condition from three independent experiments. Cell doubling time was calculated using the following formula:
where Nb is the initial cell density, Ne is the final cell density and T is the time passed between the two measurements.
Doubling Time = [T × (ln2)]/[ln(Ne/Nb)]
2.7. FITC-Labeling of Collagen
Collagen type I was isolated from rat-tail tendon (RTC) by acetic-acid extraction followed by NaCl-induced salting-out, as described elsewer [33]. The collagen concentration in the resulting solutions was determined by measuring optical absorbance at 220–230 nm.
Labeling of RTC collagen with fluorescein isothiocyanate (FITC) was performed using a modified version of the protocol by Doyle [34]. Briefly, RTC (2 mg/mL) was dissolved in 0.05 M borate buffer (pH 8), after which 20 µg of FITC from a 1 mg/mL dimethyl sulfoxide (DMSO) stock solution was added. The mixture was incubated for 90 min at room temperature in the dark. The reaction was stopped with 0.05 M Tris buffer (pH 7.4), followed by extensive dialysis against 0.05 M acetic acid to remove unbound FITC. The molar FITC-to-protein ratio (F/P) was calculated from the UV-Vis spectrum of FITC-RTC using the adapted formula:
where Amax is the absorbance of the FITC-RTC solutions measured at 494 nm; D is a dilution factor; ε0 is the molar extinction coefficient of FITC, equal to 70,000 M−1 cm−1; CM is the molar collagen concentration.
F/P = F/C = (Amax × D)/ε0 × CM
2.8. Preparation of Collagen-Coated Surfaces
FITC-collagen was dissolved in 0.5 M acetic acid to a final concentration 100 µg/mL and centrifuged at 13,000× g for 15 min. and supernatant was collected. Then 24-well glass-bottom plates (Greiner Bio-One, Frickenhausen, Germany) were coated with 300 μL from the collagen solution and incubated at 37 °C for 1 h, followed by three rinses with phosphate-buffered saline (PBS).
2.9. Collagen Remodeling Assessment
2.9.1. Remodeling Upon Direct Contact with Cancer Cells
HG-3 and RPMI 8226 were seeded onto the fluorescent collagen substrate prepared as above (Section 2.7 and Section 2.8) in the 24-well glass-bottom plates at a density of 4 × 10⁴ cells/well and allowed to attach for 2 h in serum-free medium. After the incubation-the media were collected, centrifuged at 400× g for 5 min. to remove cell derbies for later analysis. The attached cells were fixed with 4% paraformaldehyde and stained with Hoechst 33258 (1:2000 dilution) and Atto 633 phalloidin to visualize nuclei and actin cytoskeleton, respectively. Imaging was performed using the inverted fluorescence microscope Leica DM 2900 at 20× magnification. Fluorescence of the supernatants were evaluated at 490/515 nm using the fluorometer Jasco FP-8050.
2.9.2. Cancer Cell Secretomes Induced Effect on AD-MSC Collagen Remodrling
AD-MSCs were seeded onto the fluorescent collagen substrate prepared as described in Section 2.7 and Section 2.8, at a density of 1 × 10⁴ cells/well in the 24-well glass-bottom plates and allowed to attach for 2 h in serum-free medium. Subsequently, 10% FBS was added, and the cells were further cultured up to 5 h. Following incubation, cells were fixed with 4% paraformaldehyde and stained with Hoechst 33258 (1:2000 dilution) and Atto 633 phalloidin (1:100 dilution) to simultaneously visualize nuclei and actin cytoskeleton, respectively. Imaging was done using the inverted fluorescence microscope Leica DM 2900 at 20× magnification. Image analysis was carried out using CellProfiler software version 4.2.8 [32] to quantify the dark regions corresponding to remodeled collagen within selected regions of interest (ROIs) surrounding the cells.
2.10. Artificial Wound-Healing (Scratch) Assay
AD-MSCs were seeded in 12-well plates (Sensoplate, Greiner Bio-One, Meckenheim, Germany) and cultured in 1 mL DMEM/F12 supplemented with 10% FBS and 1% antibiotic–antimycotic solution. For the “induced” protocol, cancer cell secretome was added at a final protein concentration of 0.05 mg/mL, and the cells were incubated for 72 h under standard culture conditions. After incubation, a linear scratch was made across the cell monolayer using a sterile 200 µL pipette tip. The cells were then washed with DMEM/F12 media once and maintained in DMEM/F12, containing 10% FBS and 1% antibiotic-antimycotic solution. Time-lapse imaging was performed for 24 h using the live-cell chamber of the inverted fluorescence microscope (Thunder Imager Live Cell, Leica Microsystems, Switzerland), acquiring images at 10× magnification.
For the “residual” protocol, after 72 h of secretome exposure, the secretome-containing medium was removed, and the cells were washed twice with PBS before being supplied with fresh, secretome-free medium and cultured for an additional 3 days. The scratch assay was then performed as described above.
Wound-closure dynamics were quantified using ImageJ software version 1.54p (Wayne Rasband, National Institute of Mental Health, NIH, Bethesda, MD, USA) with the high-throughput scratch-assay analysis plugin [35]. The percentage of wound closure was calculated as:
where A0 is the wound area at 0 h and At is the area at time t.
%Closure = [(A0 − At)/A0] × 100
2.11. Statistical analysis
Statistical analyses were performed using GraphPad Prism 8 (GraphPad Software, Boston, MA, USA). Data are presented as column bar graphs, line graphs and scatter plots with individual points representing independent replicates and are show either as mean ± standard deviation (SD) or median ± interquartile range (IQR). Normality was assessed using the Shapiro–Wilk test, which was followed by an evaluation of variance homogeneity with Bartlett’s test. Mauchly’s test was used to evaluate compliance with the sphericity assumption. The statistical tests applied, the corresponding significance levels, and the number of replicates is reported in the respective figures’ legends.
3. Results
Although the primary aim of this study is to determine the paracrine influence of cancer cell-derived secretomes MSCs behavior and their capacity to interact with and remodel the ECM, it was first necessary to establish the direct effect of the cancer cells themselves during their adhesive interaction with the ECM, specifically with its principal structural component—collagen. Defining this baseline allows us to distinguish and interpret effects that require direct physical contact with cancer cells from those mediated exclusively by their secreted paracrine factors.
3.1. Direct Interaction of Lymphoma and Myeloma Cells with Collagen
To this end, we examined the direct collagen-remodeling activity of RPMI-8226 myeloma cells and HG-3 B-cell leukemia cells using FITC-collagen-coated substrata as a model system. Although these cells are typically weakly adhesive and therefore easily maintained in suspension, as shown in Figure 2A, images (a) and (b), respectively, both types of cells readily formed limited adhesive contacts even with tissue-culture plastic, presumably using some adsorbed serum-derived proteins.
To model the specific interaction of cancer cells with a collagen matrix, we used FITC collagen–coated substrata. The FITC-labeled collagen used in these assays exhibits partial fluorescence quenching due to the high local density of fluorophores along the collagen fibrils. Such closely spaced FITC molecules undergo mutual short-range energy transfer, resulting in self-quenching consistent with established Förster (FRET-mediated) quenching mechanisms[36]. As shown in Figure 2B, once attached, the cancer cells induced pronounced enzymatic remodeling of the underlying collagen substrate, evidenced by marked local de-quenching and sharply increased green fluorescence beneath the cells (yellow arrow), with their positions confirmed in the merged actin/nucleus images (Figure 2B(e,f)). In addition to these bright remodeling zones, numerous fainter, cell-shaped patterns were visible, presumably corresponding to regions where cells had transiently adhered and were subsequently washed away, leaving behind areas of moderately de-quenched collagen (white arrows). This remodeling activity was more pronounced in the RPMI 8226 samples (Figure 2B(b,e)), although discrete de-quenching spots were also detectable beneath several HG-3 cells (Figure 2B(c,f)). In both cell types, diffuse darker “shadow-like” regions of FITC-collagen degradation marked with (*), not associated with any current cell body, were also observed. Consistent with these observations are the fluorescence measurements in the culture supernatant showing a significantly increased FITC fluorescence signal in the presence of cells compared with the spontaneous release from substrata alone (Figure 2B(d)) indicating a significantly increased release of fluorescent collagen fragments into the medium.
3.2. Cancer Cell Secretome-Induced Morphological Changes in Mesenchymal Stem Cells
Building on the above observations, we next investigated how cancer cell-derived secretomes can reprogram AD-MSCs in terms of their morphology, survival, proliferative behavior, and ECM-remodeling activity. To distinguish immediate from persistent effects, the experimental design incorporated two conditions: (i) MSCs cultured directly with cancer cell secretomes for 72 h (“induced”), allowing assessment of the direct paracrine influence of the secretome; and (ii) MSCs subsequently cultured for an additional 72 h in secretome-free medium (“residual”), enabling evaluation of lasting secretome-induced alterations. Because individual MSC populations exhibit substantial variability in morphology, growth kinetics, and functional output, we used CellProfiler-based quantitative analysis to obtain an objective assessment of these parameters. The resulting data are presented in the corresponding graphs, which illustrate the magnitude and statistical significance of the effects induced by both cancer cell secretomes.
3.2.1. Morphology of AD-MSCs upon Indirect Contact with Cancer Cell Secretome
As shown in Figure 3 upon adhesion to collagen both, RPMI 8226 and HG-3 cancer cell secretomes alter the overall morphology of stem cells, particularly their size (Figure 3B,C) compared to Plain control (Figure 3A) consistent with the significant reduction of cell spreading area (Figure 3G).
Conversely, when the same samples were cultured for an additional 3 days under secretome-free conditions (looking for persistent effects), the cells partially reverted (Figure 3E,F) toward a control-like morphology (Figure 3D). Notably, however, MSCs pre-exposed to RPMI 8226 secretome (Figure 3E) retained a significantly larger cell spreading area compared to both control and HG-3 samples (Figure 3D).
3.2.2. Cell Proliferation Assay and Senescence
Cell proliferation was evaluated morphologically via counting the cells per field at 24, 48 and 72 h under both “induced” and “residual” conditions as defined above.
The data in Figure 4 show that AD-MSCs more than double their proliferation rate (Figure 4 B) when directly exposed to secretomes from either RPMI 8226 or HG-3 cell lines (“induced”, as defined above). This accelerated growth results in a significant reduction in cell doubling time compared with untreated control cells (graph A).
However, when AD-MSCs exposed to secretomes are subsequently cultured in secretome-free medium (“residual” conditions), their behavior diverges depending on the source of the secretome. Cells pre-treated with RPMI 8226 secretome largely recover their proliferative capacity, returning to levels close to the control (Plain). In contrast, cells pre-treated with HG-3 secretome show a sustained reduction in proliferation at all measured time points (Figure 4D), leading to a significant increase in doubling time (Figure 4C). This pattern indicates a clear residual effect specifically associated with HG-3 secretome exposure.
Senescence analysis (Figure 4E) further supports this interpretation. Under residual conditions, both RPMI 8226 and HG-3-derived secretomes induce a marked increase in senescent cell numbers. Under direct (“induced”) treatment, senescence levels are still significantly elevated compared with controls, but remain relatively low. These findings suggest that the senescent phenotype is not the result of acute cytotoxicity from the secretomes. Instead, it appears linked to a longer-term functional reprogramming of AD-MSCs toward a cancer-associated phenotype.
3.2.3. Live/Dead Assay
To further rule out the possibility that cancer cell-derived secretomes exert direct cytotoxic effects, particularly imaginable under direct exposure (“induced” conditions), we performed a viability (live/dead) assay at 24 and 72 h. The assay was conducted under both “induced” and “residual” conditions.
As seen in Figure 5, across all treatments settings and time points, AD-MSC viability remained consistently high (99–100%), with most cells stained in green and only sparse appearance of red colored nuclei (Figure 5A,B right rows) and no significant differences compared to controls (Figure 5C,D). These findings confirm the absence of both immediate and residual cytotoxicity from the cancer cell secretomes.
3.2.4. Stem Cells Collagen Remodeling
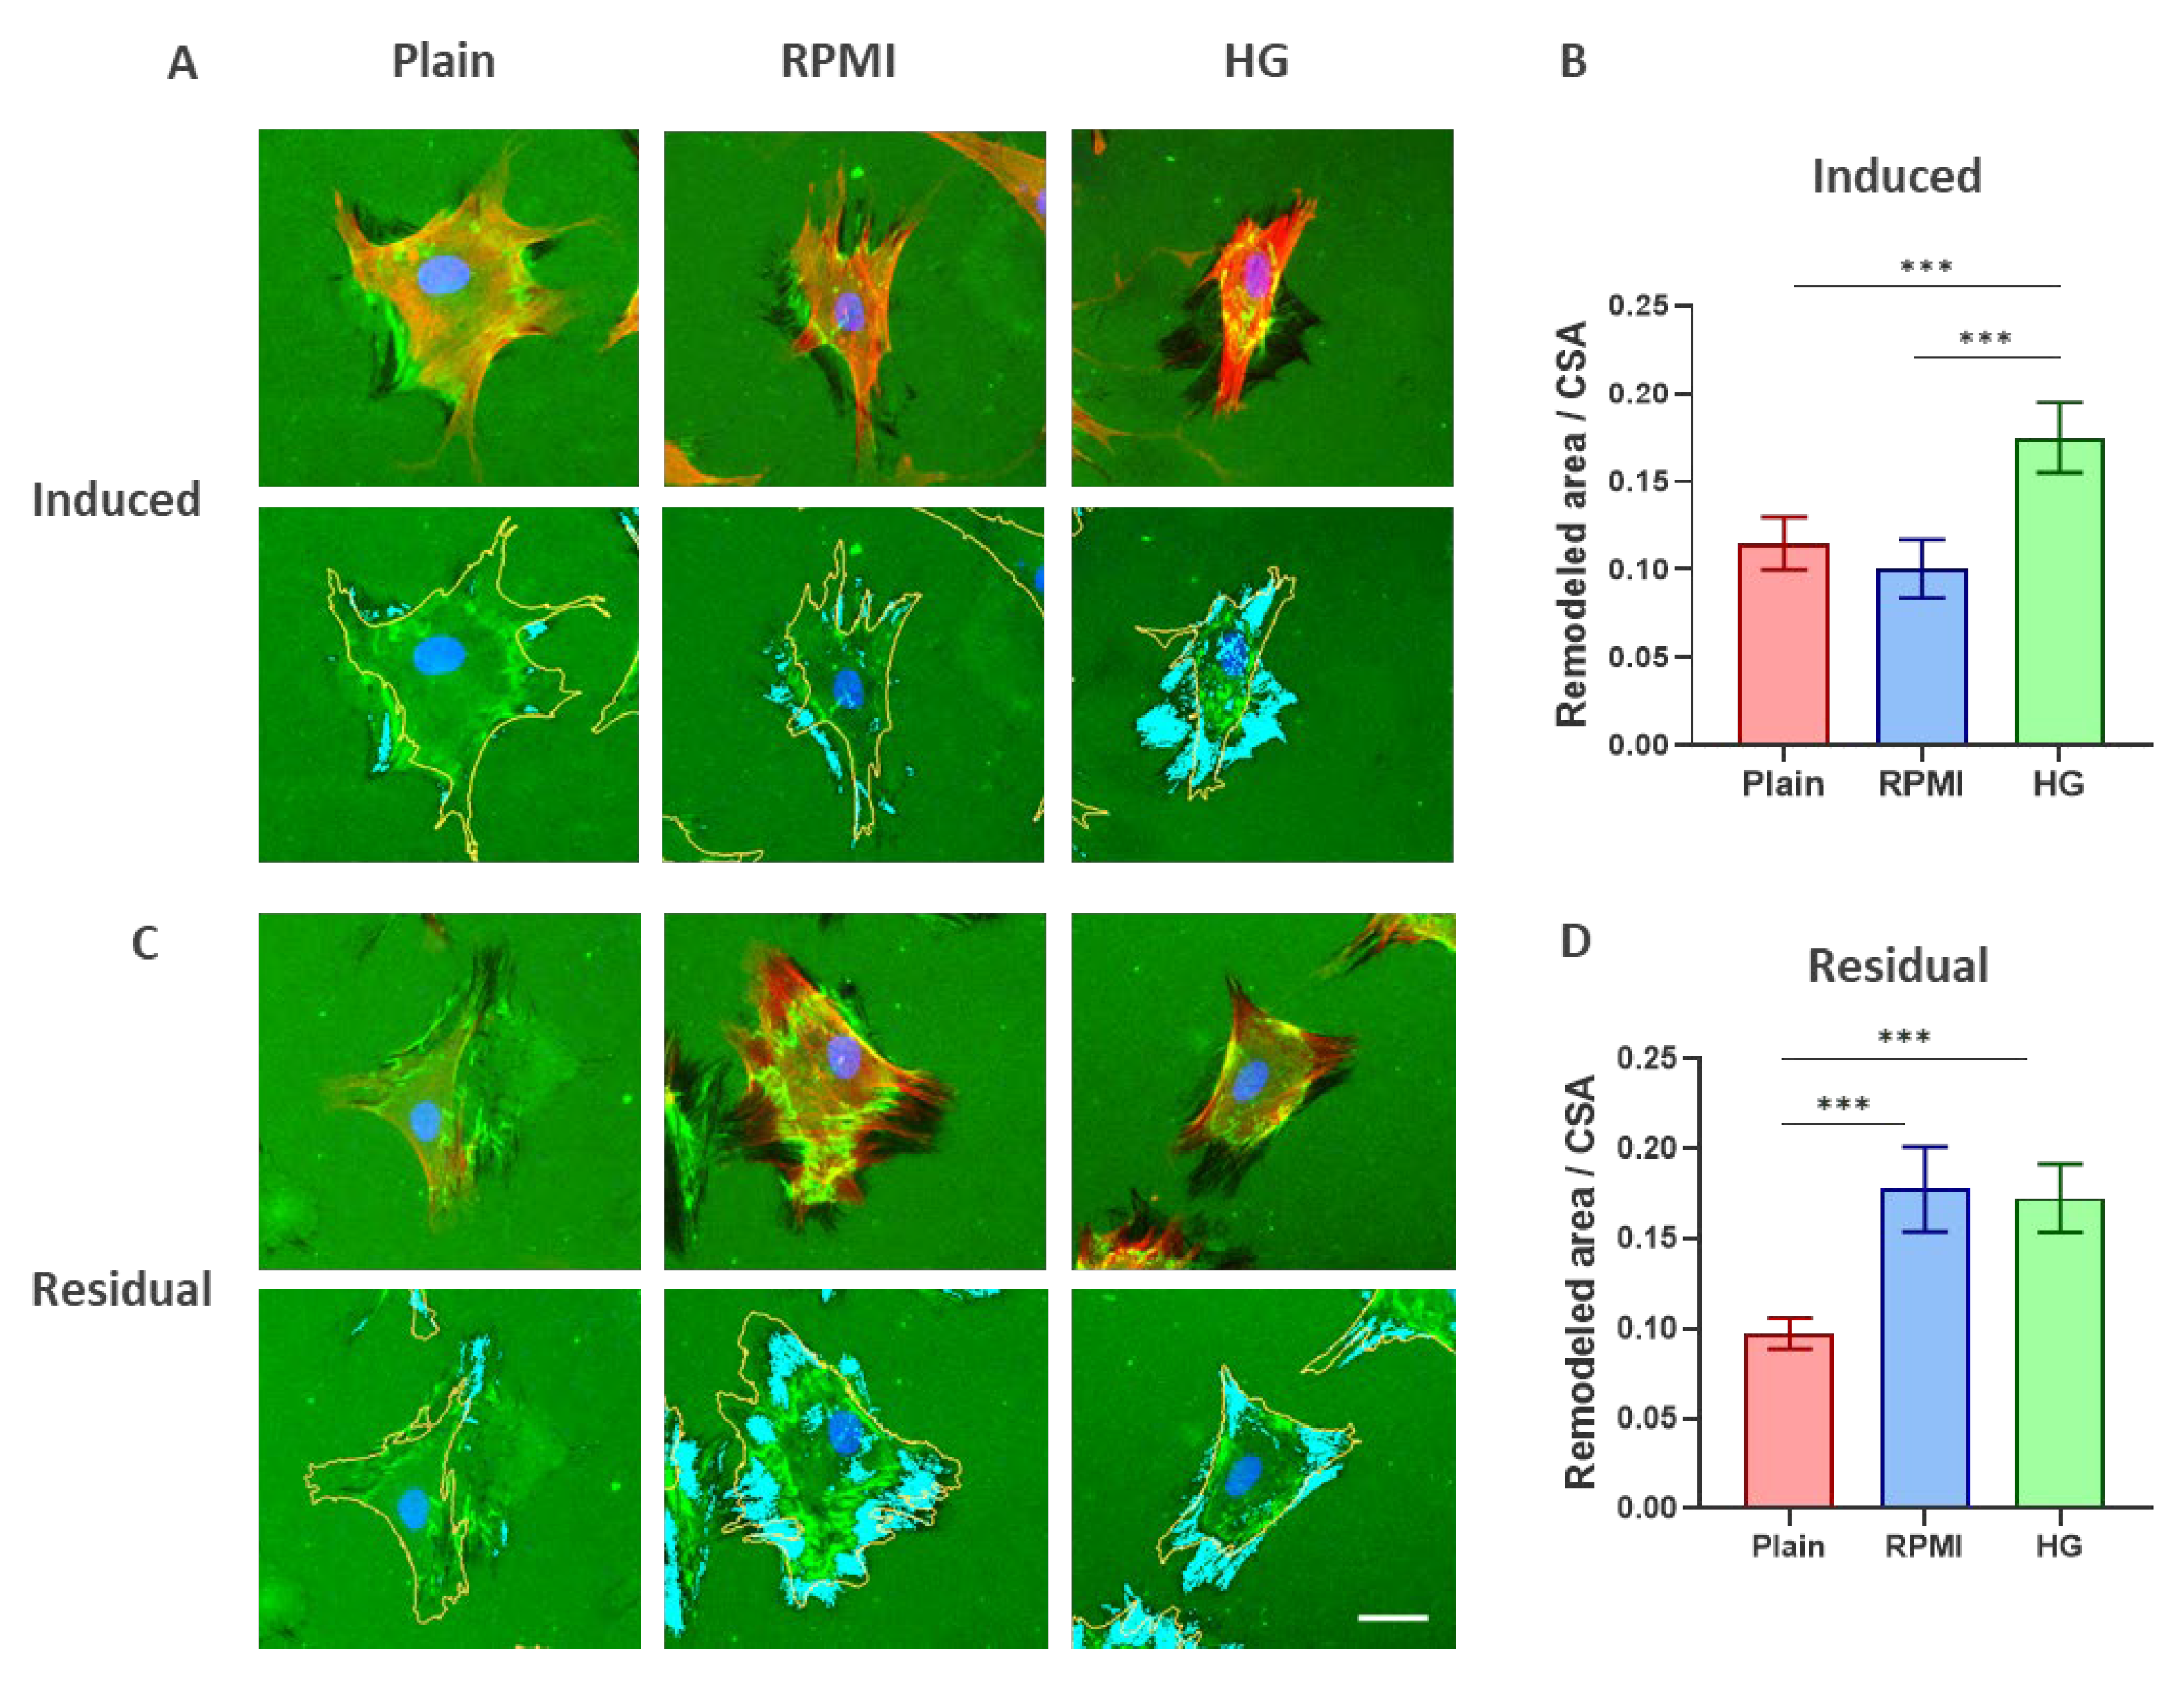
When AD-MSCs were cultured under “induced” conditions (Figure 4A), exposure to HG-3 secretome resulted in markedly greater collagen substrate remodeling compared with both the Plain control and RPMI 8226-treated cells. This enhanced matrix-remodeling activity was confirmed morphometrically, showing a statistically significant increase in remodeled area (Figure 6B).
3.2.5. Cell Mobility Testing
To follow the AD-MSCs motility response the classical scratch assay was employed. AD-MSCs were seeded on standard 6-well TC plates and cultured according to the diferent conditions described above. After the scratch was applied the cells were observed for up to 24 h in a humidified chamber of an inverted microscope using phase contrast.
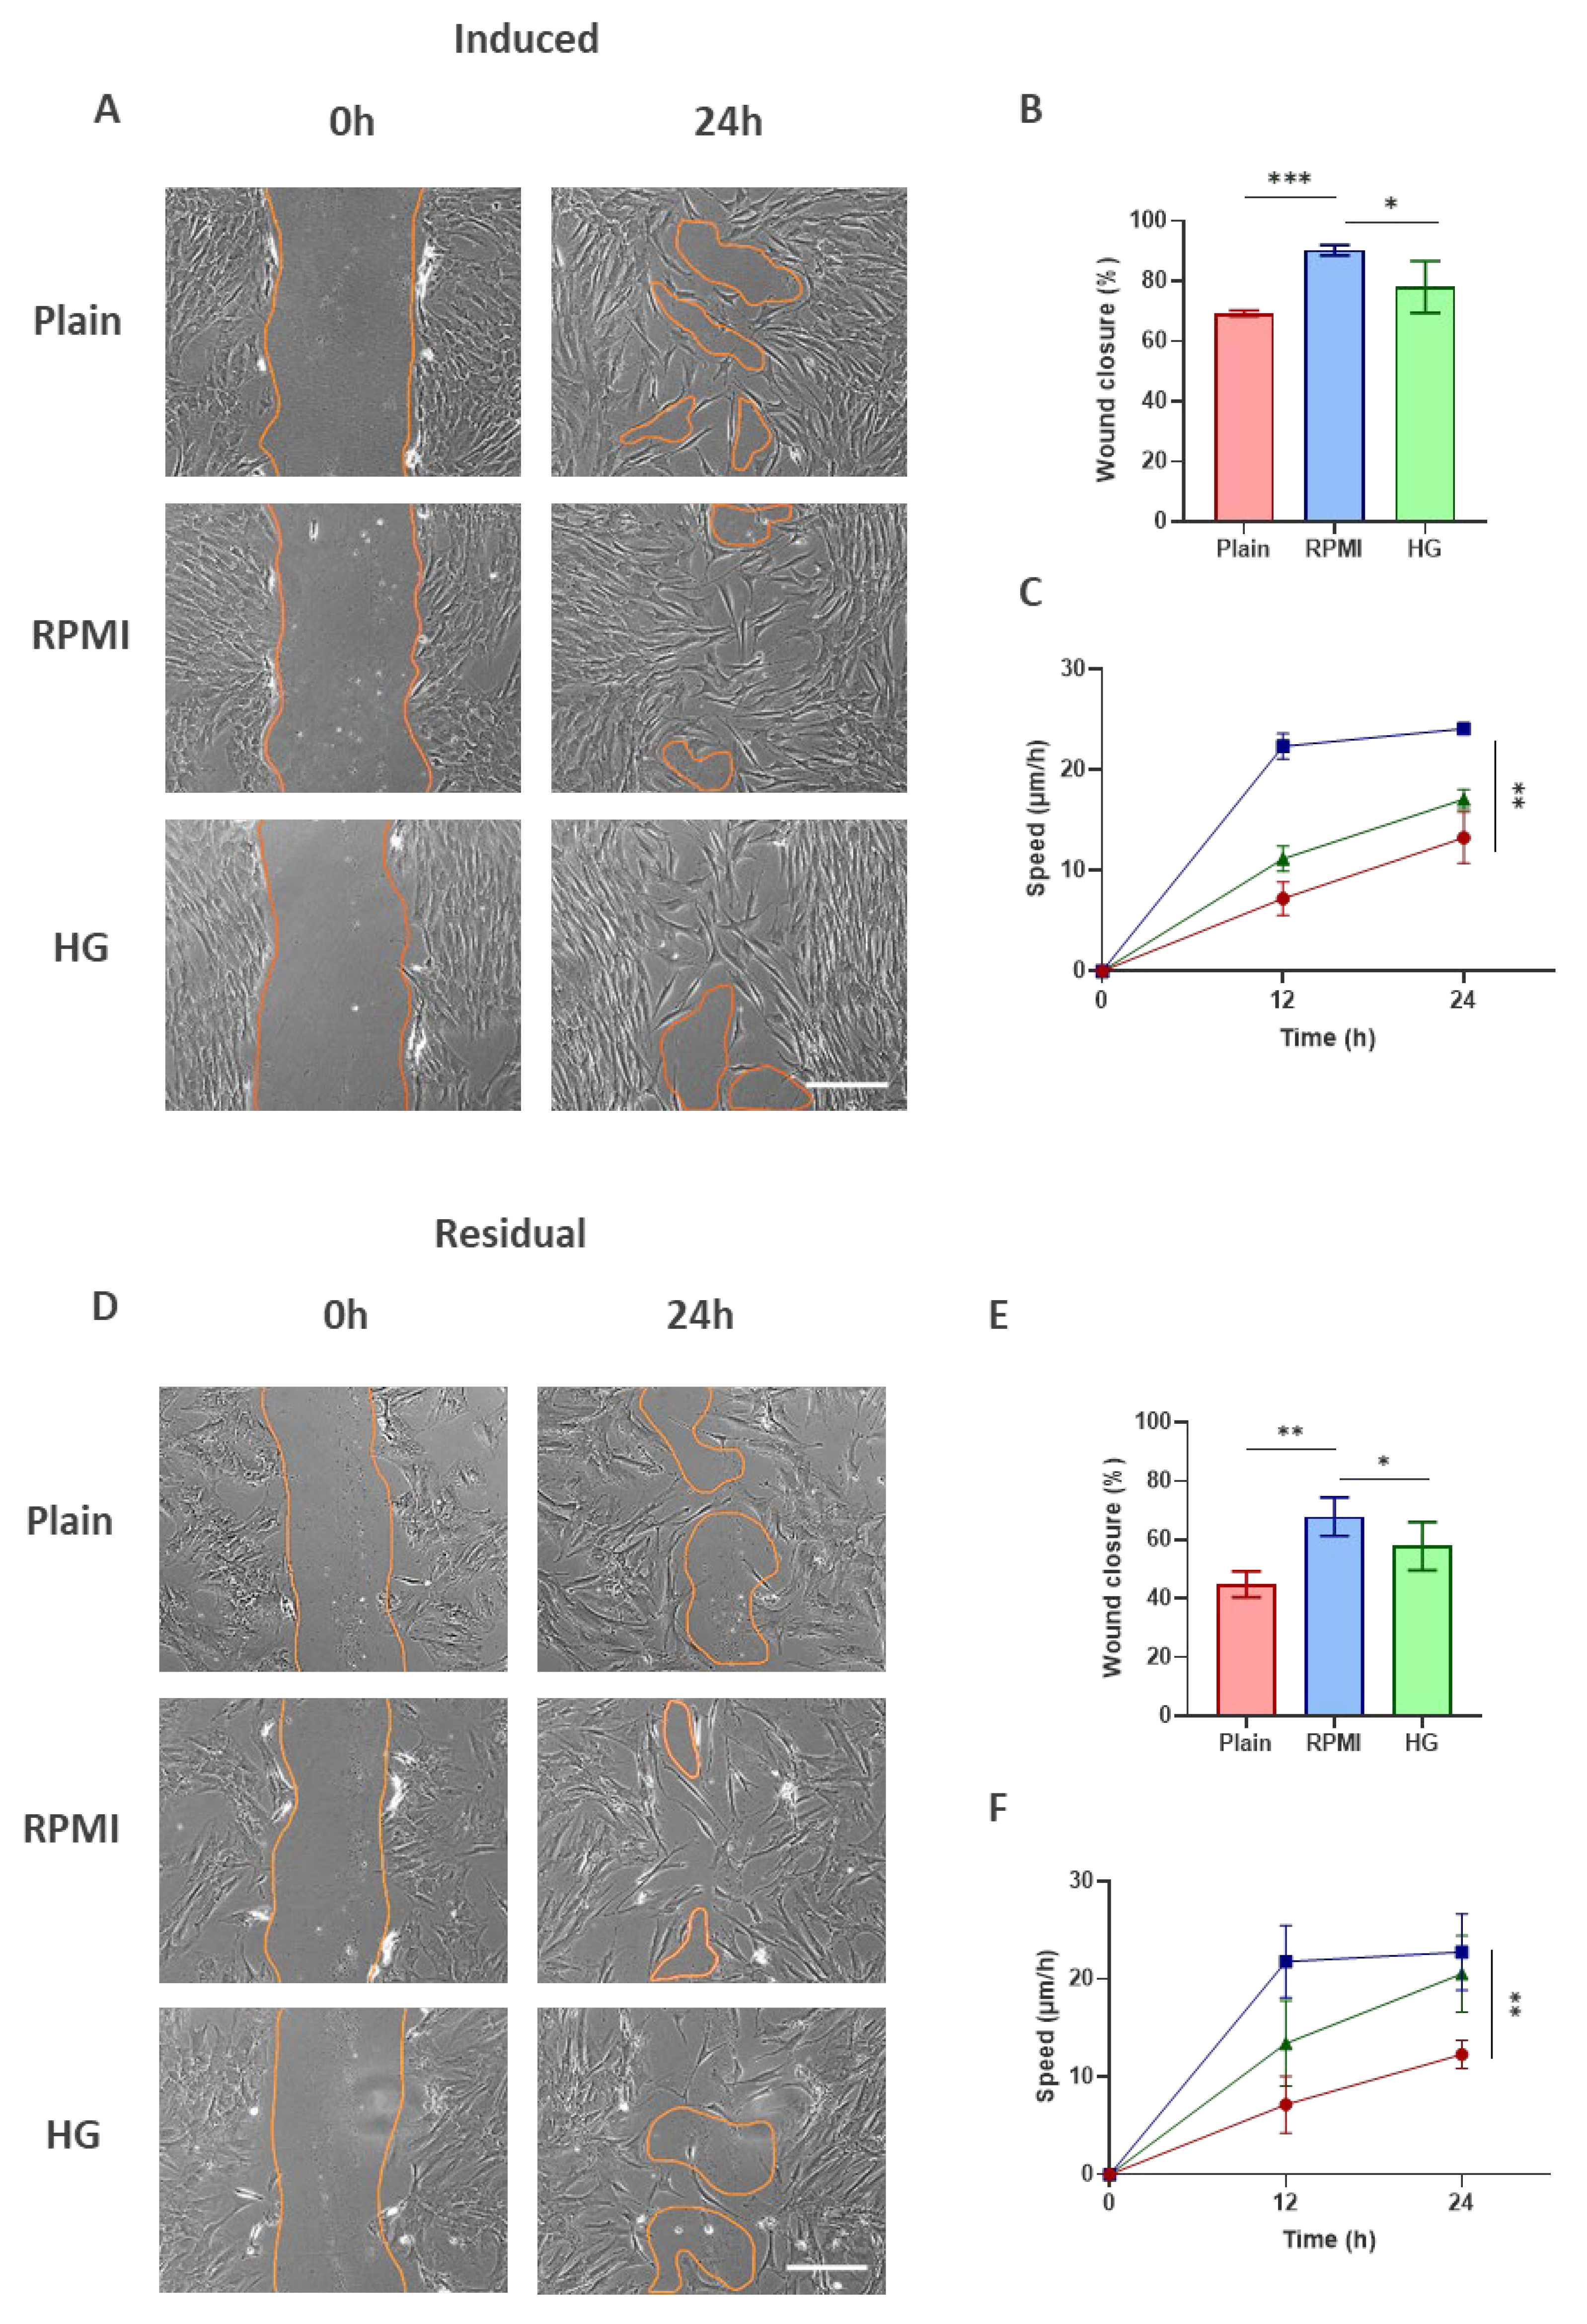
As shown in Figure 5, AD-MSCs significantly increase both their wound-closure speed and the extent of wound closure under both “induced” and “residual” conditions compared with control cells. Notably, RPMI secretome produces an even stronger pro-migratory effect—nearly twice as pronounced as the other treatments.
Figure 7.
AD-MSC migration accelerates after treatment with cancer cell secretomes from myeloma (RPMI 8226) and leukemia (HG-3) cell lines. Representative phase-contrast images from wound-healing assays performed under “induced” (A) and “residual” (D) conditions. An orange line marks the initial wound area as well as the closed region at the endpoint. “Plain” denotes untreated control cells, while “RPMI” and “HG” indicate treatment with the corresponding cancer cell-derived secretomes. Presented images were captured at 0 h and 24 h. Graphs (B,E) show the percentage of wound closure at the 24-hour time point. Graphs (C,F) depict changes in migration speed over time (0, 12, and 24 h), analyzed at the experimental endpoint. Data are presented as mean ± SD (n = 4). Statistical analysis was performed using one-way ANOVA followed by Tukey’s multiple comparisons test. Asterisks indicate statistical significance at p ≤ 0.05 (*) and p ≤ 0.01 (**), p ≤ 0.001 (***). Scale bar: 100 µm.
Figure 7.
AD-MSC migration accelerates after treatment with cancer cell secretomes from myeloma (RPMI 8226) and leukemia (HG-3) cell lines. Representative phase-contrast images from wound-healing assays performed under “induced” (A) and “residual” (D) conditions. An orange line marks the initial wound area as well as the closed region at the endpoint. “Plain” denotes untreated control cells, while “RPMI” and “HG” indicate treatment with the corresponding cancer cell-derived secretomes. Presented images were captured at 0 h and 24 h. Graphs (B,E) show the percentage of wound closure at the 24-hour time point. Graphs (C,F) depict changes in migration speed over time (0, 12, and 24 h), analyzed at the experimental endpoint. Data are presented as mean ± SD (n = 4). Statistical analysis was performed using one-way ANOVA followed by Tukey’s multiple comparisons test. Asterisks indicate statistical significance at p ≤ 0.05 (*) and p ≤ 0.01 (**), p ≤ 0.001 (***). Scale bar: 100 µm.
4. Discussion
The present study demonstrates that cancer cell-derived secretomes from two B-cell malignancies, RPMI-8226 (multiple myeloma-derived) and HG-3 (CLL-derived), profoundly reprogram AD-MSCs, altering their morphology, proliferative dynamics, senescence profile, motility, and collagen-remodeling capacity. These findings align with the broader concept that CA-MSCs undergo functional and phenotypic shifts driven by soluble factors released by malignant cells [6,37]. Importantly, our experimental design distinguished direct (“induced”) effects from persistent (“residual”) effects, revealing that some tumor-mediated alterations are reversible, whereas others remain imprinted even after removal of the secretome stimulus.
4.1. Cancer Cell Secretomes Induce Rapid Morphological Response of AD-MSCs
Both RPMI 8226 and HG-3 secretomes caused a marked reduction in cell spreading area and altered overall morphology, consistent with the abrupted cytoskeletal reorganization [17] and altered integrin signaling [38] typically observed in tumor-educated MSCs. The partial morphological recovery after secretome withdrawal suggests that some cytoskeletal changes are adaptive rather than permanently imprinted. However, the persistent enlargement of RPMI-preconditioned MSCs indicates a lineage-specific or tumor-type-specific imprinting effect, in line with reports that myeloma-derived factors induce long-lasting stromal reprogramming [39,40].
4.2. Divergent Proliferative Responses Reveal Cancer-Specific MSC Reprogramming
Direct exposure to both secretomes significantly accelerated AD-MSC proliferation, reducing doubling time. This is consistent with the known mitogenic effects of tumor-derived cytokines such as IL-6, IL-8, basic fibroblast growth factor (bFGF), which are abundant in B-cell malignancies [18,41,42,43,44,45]. However, the residual responses diverged: (i) RPMI 8226—preconditioned MSCs returned to near-baseline proliferation; while (ii) HG-3—preconditioned MSCs exhibited a sustained reduction in growth. This dichotomy suggests that CLL-derived factors may induce a more durable anti-proliferative or stress-associated phenotype, consistent with reports that CLL exosomes induce MSC inflammatory phenotype, known as pro-inflammatory and pro-remodeling secretory program (SASP) [30], reminiscent of cancer-associated fibroblasts (CAFs).
4.3. Absence of Cytotoxicity Confirms Functional, but not Lethal Reprogramming
Viability remained 99–100% across all conditions, indicating that the observed phenotypic changes are not attributable to cytotoxicity. This aligns with the general understanding that cancer cell secretomes rarely kill MSCs but instead rewire their signaling pathways toward tumor-supportive phenotypes [6,17,30,46].
4.4. Cancer Cell Secretomes Enhance MSC Senescence, Particularly Under Residual Conditions
Both secretomes increased senescence during direct exposure, consistent with previous findings that malignant B-cells induce a senescence-associated secretory phenotype (SASP) in MSCs [18,47,48]. Strikingly, senescence levels increased even further after secretome withdrawal, suggesting either: (i) a true long-lasting reprogramming event; or (ii) a secondary effect of accelerated proliferation during the induced phase, leading to replication-associated senescence.
4.5. Collagen Remodeling is Strongly Amplified, Especially after Secretome Withdrawal
One of the most striking findings is the enhanced collagen remodeling, particularly in the residual condition, where both secretomes induced greater ECM reorganization than during direct exposure. This suggests that tumor-educated MSCs acquire a delayed but amplified matrix-modifying phenotype, consistent with the behavior of CA-MSCs in vivo [8,50]. The stronger effect of HG-3 secretome during the induced phase, followed by a robust remodeling response from both secretomes in the residual phase, indicates that ECM-modifying programs may require time to consolidate and may persist independently of the initial stimulus.
The complementary initial experiment (Figure 1) assessing the direct interaction of lymphoma cells with FITC-labeled collagen further supports the interpretation that ECM remodeling is an intrinsic feature of malignant B-cells, rather than a phenomenon emerging solely through stromal reprogramming. Both RPMI 8226 and HG-3 cells, despite their predominantly suspension-growing phenotype, established transient adhesive contacts with collagen-coated substrata and induced marked local de-quenching of FITC collagen, consistent with enzymatic degradation and reorganization. The increased release of fluorescent collagen fragments into the medium corroborates this remodeling activity. These findings indicate that malignant B-cells possess inherent collagen-modifying capacity, providing a mechanistic rationale for the strong remodeling phenotype observed in tumor-educated MSCs. The ability of tumor cells to directly reorganize collagen suggests that paracrine factors may not only activate stromal remodeling programs but may also mirror matrix-modifying behaviors intrinsic to the tumor cells themselves, thereby reinforcing a cooperative ECM-remodeling axis within the tumor microenvironment.
4.6. Increased MSC Motility Supports a Cancer-Associated Stromal Phenotype
Both secretomes enhanced MSC migration in the scratch assay, with RPMI 8226 eliciting nearly twice the response observed with HG-3. Increased MSC motility is a characteristic feature of cancer-associated stromal activation and is commonly driven by chemokines such as bFGF and IL-8 [18,42,43,44,45]. The markedly stronger effect of the RPMI 8226 secretome suggests a more potent chemotactic profile of myeloma cells compared with B-cell leukemia cells. However, interpreting this difference remains challenging, as the interactions between malignant cells and their native stromal partners within the bone-marrow niche are still not fully understood [49]. This uncertainty is further amplified when considering MSCs originating from an entirely different tissue source, such as adipose tissue, whose intrinsic signaling properties, adhesion repertoire, and responsiveness to tumor-derived cues may differ substantially from those of bone-marrow MSCs. Nevertheless, the fact that adipose-derived MSCs still respond robustly to these secretomes underscores the strength of tumor-driven paracrine signaling and should be taken into account when interpreting their behavior outside their native niche.
5. Conclusions
Collectively, our findings show that cancer cell secretomes from B-cell malignancies induce a multifaceted reprogramming of AD-MSCs, affecting morphology, proliferation, senescence, motility, and ECM remodeling. Importantly, several alterations persist after secretome withdrawal, indicating stable phenotypic imprinting reminiscent of CA-MSC formation. The differential effects between RPMI 8226 and HG-3 highlight cancer-type-specific mechanisms of stromal education. These results support the emerging view that MSCs from non-marrow tissues, such as adipose tissue, can also be reprogrammed into tumor-supportive phenotypes, expanding the concept of CA-MSCs beyond the bone marrow niche.
Author Contributions
Conceptualization, G.A.; methodology G.A., cell culture, N.G.P., T.S. and L.T; writing, and software analysis, T.S. and L.T.; collagen investigation, data curation, T.S. and L.T.; writing-original draft preparation, G.A.; writing and editing, G.A.; supervision, G.A.; resources, G.A., J.L.G.R. and S.T.; funding acquisition, G.A. and S.T. All authors have read and agreed to the published version of the manuscript. All authors have read and agreed to the published version of the manuscript.
Funding
This research was funded by the European Union NextGeneration EU, through the National Recovery and Resilience Plan of the Republic of Bulgaria, project BG-RRP-2.004-0003 and further supported by Medical University-Pleven, Bulgaria (internal MU-project 13/2026). The financial support of the project BG16RFPR002-1.014-0002-С001 to the “Center of competence in personalized medicine, 3D and telemedicine, robotic assisted and minimally invasive surgery” funded by the PRIDST 2021–2027 and co-funded by the EU, is also acknowledged.
Institutional Review Board Statement
This study was conducted according to the guidelines of the Declaration of Helsinki and approved by the Institutional Ethics Committee of Medical University-Pleven (approval 745-KENID, approval date 5 June 2023).
Informed Consent Statement
Informed consent was obtained from all subjects involved in the study.
Data Availability Statement
The original contributions presented in this study are included in the article. Further inquiries can be directed to the corresponding author.
Acknowledgments
We acknowledge support through Leonardo da Vinci Center of Competence in Personalized Medicine, 3D and Telemedicine, Robotic and Minimally Invasive Surgery, Pleven, Bulgaria.
Conflicts of Interest
The authors declare no conflicts of interest.
Abbreviations
The following abbreviations are used in this manuscript:
| MSCs | Mesenchymal stromal/stem cells |
| ECM | Extracellular matrix |
| AD-MSCs | Human adipose-derived mesenchymal stem cells |
| CA-MSCs | Cancer-associated mesenchymal stem cells |
| TA-MSCs | Tumor-associated mesenchymal stem cells |
| TME | Tumor microenvironment |
| CAFs | Cancer-associated fibroblasts |
| TAFs | Tumor-associated fibroblasts |
| SASP | Senescence-associated secretory phenotype |
| SIPS | Stress-induced premature senescence |
| IL | Interleukin |
| TGF β, | Transforming growth factor beta |
| VEGF | Vascular endothelial growth factor |
| miRNAs | Micro ribonucleic acid |
| BM-MSCs | Bone marrow–derived mesenchymal stem cells |
| FBS | Fetal bovine serum |
| TC | Tissue culture |
| PBS | Phosphate buffered saline |
| PI | Propidium iodide |
| PFA | Paraformaldehyde |
| RTC | Rat tail tendon |
| FITC | Fluorescein isothiocyanate |
| DMSO | Dimethyl sulfoxide |
| SD | Standard deviation |
| IQR | Interquartile range |
| bFGF | Fibroblast growth factor |
| CCL | Chemokine (C–C motif) ligand |
References
- Caplan, A.I. Mesenchymal Stem Cells: Time to Change the Name! Stem Cells Transl. Med. 2017, 6, 1445–1451. [Google Scholar] [CrossRef]
- Pittenger, M.F.; Mackay, A.M.; Beck, S.C.; Jaiswal, R.K.; Douglas, R.; Mosca, J.D.; Moorman, M.A.; Simonetti, D.W.; Craig, S.; Marshak, D.R. Multilineage Potential of Adult Human Mesenchymal Stem Cells. Science 1999, 284, 143–147. [Google Scholar] [CrossRef] [PubMed]
- Studeny, M.; Marini, F.C.; Champlin, R.E.; Zompetta, C.; Fidler, I.J.; Andreeff, M. Bone Marrow-Derived Mesenchymal Stem Cells as Vehicles for Interferon-Beta Delivery into Tumors - PubMed.
- Jin, J.; Lin, J.; Xu, A.; Lou, J.; Qian, C.; Li, X.; Wang, Y.; Yu, W.; Tao, H. CCL2: An Important Mediator Between Tumor Cells and Host Cells in Tumor Microenvironment. Front. Oncol. 2021, 11. [Google Scholar] [CrossRef] [PubMed]
- Zhang, X.; Li, N.; Zhu, Y.; Wen, W. The Role of Mesenchymal Stem Cells in the Occurrence, Development, and Therapy of Hepatocellular Carcinoma. Cancer Med. 2022, 11, 931–943. [Google Scholar] [CrossRef]
- Spaeth, E.L.; Dembinski, J.L.; Sasser, A.K.; Watson, K.; Klopp, A.; Hall, B.; Andreeff, M.; Marini, F. Mesenchymal Stem Cell Transition to Tumor-Associated Fibroblasts Contributes to Fibrovascular Network Expansion and Tumor Progression. PLoS One 2009, 4. [Google Scholar] [CrossRef]
- Klopp, A.H.; Gupta, A.; Spaeth, E.; Andreeff, M.; Marini, F. Concise Review: Dissecting a Discrepancy in the Literature: Do Mesenchymal Stem Cells Support or Suppress Tumor Growth? Stem Cells 2010, 29, 11. [Google Scholar] [CrossRef]
- Kalluri, R. The Biology and Function of Fibroblasts in Cancer. Nat. Rev. Cancer 2016, 16, 582–598. [Google Scholar] [CrossRef]
- Fan, H.; Atiya, H.I.; Wang, Y.; Pisanic, T.R.; Wang, T.H.; Shih, I.M.; Foy, K.K.; Frisbie, L.; Buckanovich, R.J.; Chomiak, A.A.; et al. Epigenomic Reprogramming toward Mesenchymal-Epithelial Transition in Ovarian-Cancer-Associated Mesenchymal Stem Cells Drives Metastasis. Cell Rep. 2020, 33. [Google Scholar] [CrossRef]
- Zhao, Y.; Shen, M.; Wu, L.; Yang, H.; Yao, Y.; Yang, Q.; Du, J.; Liu, L.; Li, Y.; Bai, Y. Stromal Cells in the Tumor Microenvironment: Accomplices of Tumor Progression? Cell Death Dis. 2023 149 2023, 14, 587. [Google Scholar] [CrossRef] [PubMed]
- Yang, D.; Liu, J.; Qian, H.; Zhuang, Q. Cancer-Associated Fibroblasts: From Basic Science to Anticancer Therapy. Exp. Mol. Med. 2023 557 2023, 55, 1322–1332. [Google Scholar] [CrossRef] [PubMed]
- Coffman, L.G.; Choi, Y.-J.; McLean, K.; Allen, B.L.; di Magliano, M.P.; Buckanovich, R.J.; Coffman, L.G.; Choi, Y.-J.; McLean, K.; Allen, B.L.; et al. Human Carcinoma-Associated Mesenchymal Stem Cells Promote Ovarian Cancer Chemotherapy Resistance via a BMP4/HH Signaling Loop. Oncotarget 2016, 7, 6916–6932. [Google Scholar] [CrossRef]
- Coffman, L.G.; Pearson, A.T.; Frisbie, L.G.; Freeman, Z.; Christie, E.; Bowtell, D.D.; Buckanovich, R.J. Ovarian Carcinoma-Associated Mesenchymal Stem Cells Arise from Tissue-Specific Normal Stroma. Stem Cells 2019, 37, 257–269. [Google Scholar] [CrossRef]
- Sun, L.; Cao, X.; Zhou, B.; Mei, J.; Zhao, X.; Li, Y.; Yao, Y.; Wang, M. Tumor-Associated Mesenchymal Stem/Stromal Cells in Tumor Microenvironment and Carcinogenesis. Exp. Hematol. Oncol. 2025 141 2025, 14, 97. [Google Scholar] [CrossRef]
- Pavlou, M.P.; Diamandis, E.P. The Cancer Cell Secretome: A Good Source for Discovering Biomarkers? J. Proteomics 2010, 73, 1896–1906. [Google Scholar] [CrossRef]
- Spaeth, E.; Klopp, A.; Dembinski, J.; Andreeff, M.; Marini, F. Inflammation and Tumor Microenvironments: Defining the Migratory Itinerary of Mesenchymal Stem Cells. Gene Ther. 2008, 15, 730–738. [Google Scholar] [CrossRef]
- Ridge, S.M.; Sullivan, F.J.; Glynn, S.A. Mesenchymal Stem Cells: Key Players in Cancer Progression. Mol. Cancer 2017 161 2017, 16, 31. [Google Scholar] [CrossRef]
- Maiso, P.; Mogollón, P.; Ocio, E.M.; Garayoa, M. Bone Marrow Mesenchymal Stromal Cells in Multiple Myeloma: Their Role as Active Contributors to Myeloma Progression. Cancers 2021, Vol. 13(2021), 13. [Google Scholar] [CrossRef] [PubMed]
- Liu, Y.; Cao, X. Characteristics and Significance of the Pre-Metastatic Niche. Cancer Cell 2016, 30, 668–681. [Google Scholar] [CrossRef]
- Coppé, J.P.; Desprez, P.Y.; Krtolica, A.; Campisi, J. The Senescence-Associated Secretory Phenotype: The Dark Side of Tumor Suppression. Annu. Rev. Pathol. 2010, 5, 99–118. [Google Scholar] [CrossRef] [PubMed]
- Turinetto, V.; Vitale, E.; Giachino, C. Senescence in Human Mesenchymal Stem Cells: Functional Changes and Implications in Stem Cell-Based Therapy. Int. J. Mol. Sci. 2016, 17. [Google Scholar] [CrossRef]
- Plakhova, N.; Panagopoulos, V.; Vandyke, K.; Zannettino, A.C.W.; Mrozik, K.M. Mesenchymal Stromal Cell Senescence in Haematological Malignancies. Cancer Metastasis Rev. 2023 421 2023, 42, 277–296. [Google Scholar] [CrossRef]
- Hernandez-Segura, A.; Nehme, J.; Demaria, M. Hallmarks of Cellular Senescence. Trends Cell Biol. 2018, 28, 436–453. [Google Scholar] [CrossRef]
- Malard, F.; Neri, P.; Bahlis, N.J.; Terpos, E.; Moukalled, N.; Hungria, V.T.M.; Manier, S.; Mohty, M. Multiple Myeloma. Nat. Rev. Dis. Prim. 2024 101 2024, 10, 45. [Google Scholar] [CrossRef] [PubMed]
- Mikhael, J.; Ismaila, N.; Cheung, M.C.; Costello, C.; Dhodapkar, M. V.; Kumar, S.; Lacy, M.; Lipe, B.; Little, R.F.; Nikonova, A.; et al. Treatment of Multiple Myeloma: ASCO and CCO Joint Clinical Practice Guideline. J. Clin. Oncol. 2019, 37, 1228–1263. [Google Scholar] [CrossRef] [PubMed]
- Svanberg, R.; Janum, S.; Patten, P.E.M.; Ramsay, A.G.; Niemann, C.U. Targeting the Tumor Microenvironment in Chronic Lymphocytic Leukemia. Haematologica 2021, 106, 2312–2324. [Google Scholar] [CrossRef] [PubMed]
- Garcia-Gomez, A.; Sanchez-Guijo, F.; del Cañizo, M.C.; Miguel, J.F.S.; Garayoa, M. Multiple Myeloma Mesenchymal Stromal Cells: Contribution to Myeloma Bone Disease and Therapeutics. World J. Stem Cells 2014, 6, 322. [Google Scholar] [CrossRef]
- Roccaro, A.M.; Sacco, A.; Maiso, P.; Azab, A.K.; Tai, Y.T.; Reagan, M.; Azab, F.; Flores, L.M.; Campigotto, F.; Weller, E.; et al. BM Mesenchymal Stromal Cell-Derived Exosomes Facilitate Multiple Myeloma Progression. J. Clin. Invest. 2013, 123, 1542–1555. [Google Scholar] [CrossRef]
- Colmone, A.; Amorim, M.; Pontier, A.L.; Wang, S.; Jablonski, E.; Sipkins, D.A. Leukemic Cells Create Bone Marrow Niches That Disrupt the Behavior of Normal Hematopoietic Progenitor Cells. Science 2008, 322, 1861–1865. [Google Scholar] [CrossRef]
- Paggetti, J.; Haderk, F.; Seiffert, M.; Janji, B.; Distler, U.; Ammerlaan, W.; Kim, Y.J.; Adam, J.; Lichter, P.; Solary, E.; et al. Exosomes Released by Chronic Lymphocytic Leukemia Cells Induce the Transition of Stromal Cells into Cancer-Associated Fibroblasts. Blood 2015, 126, 1106–1117. [Google Scholar] [CrossRef]
- Dander, E.; Palmi, C.; D’amico, G.; Cazzaniga, G. The Bone Marrow Niche in B-Cell Acute Lymphoblastic Leukemia: The Role of Microenvironment from Pre-Leukemia to Overt Leukemia. Int. J. Mol. Sci. 2021, Vol. 22, 2021, 22. [Google Scholar] [CrossRef]
- Stirling, D.R.; Swain-Bowden, M.J.; Lucas, A.M.; Carpenter, A.E.; Cimini, B.A.; Goodman, A. CellProfiler 4: Improvements in Speed, Utility and Usability. BMC Bioinformatics 2021, 22, 433. [Google Scholar] [CrossRef] [PubMed]
- Mikulíková, K.; Eckhardt, A.; Pataridis, S.; Mikšík, I. Study of Posttranslational Non-Enzymatic Modifications of Collagen Using Capillary Electrophoresis/Mass Spectrometry and High Performance Liquid Chromatography/Mass Spectrometry. J. Chromatogr. A 2007, 1155, 125–133. [Google Scholar] [CrossRef]
- Doyle, A.D. Fluorescent Labeling of Rat-Tail Collagen for 3D Fluorescence Imaging. Bio-protocol 2018, 8. [Google Scholar] [CrossRef] [PubMed]
- Suarez-Arnedo, A.; Figueroa, F.T.; Clavijo, C.; Arbeláez, P.; Cruz, J.C.; Muñoz-Camargo, C. An Image J Plugin for the High Throughput Image Analysis of in Vitro Scratch Wound Healing Assays. PLoS One 2020, 15. [Google Scholar] [CrossRef] [PubMed]
- Wiederschain, G.Y. The Molecular Probes Handbook. A Guide to Fluorescent Probes and Labeling Technologies. Biochem. 2011, 76, 1276–1276. [Google Scholar] [CrossRef]
- Aoto, K.; Ito, K.; Aoki, S. Complex Formation between Platelet-Derived Growth Factor Receptor β and Transforming Growth Factor β Receptor Regulates the Differentiation of Mesenchymal Stem Cells into Cancer-Associated Fibroblasts. Oncotarget 2018, 9, 34090. [Google Scholar] [CrossRef]
- Cooper, J.; Giancotti, F.G. Integrin Signaling in Cancer: Mechanotransduction, Stemness, Epithelial Plasticity, and Therapeutic Resistance. Cancer Cell 2019, 35, 347–367. [Google Scholar] [CrossRef]
- Pevsner-Fischer, M.; Levin, S.; Hammer-Topaz, T.; Cohen, Y.; Mor, F.; Wagemaker, G.; Nagler, A.; Cohen, I.R.; Zipori, D. Stable Changes in Mesenchymal Stromal Cells from Multiple Myeloma Patients Revealed through Their Responses to Toll-Like Receptor Ligands and Epidermal Growth Factor. Stem Cell Rev. Reports 2012, 8, 343–354. [Google Scholar] [CrossRef]
- Schütt, J.; Nägler, T.; Schenk, T.; Brioli, A. Investigating the Interplay between Myeloma Cells and Bone Marrow Stromal Cells in the Development of Drug Resistance: Dissecting the Role of Epigenetic Modifications. Cancers 2021, Vol. 13(2021), 13. [Google Scholar] [CrossRef]
- Burger, J.A.; Ghia, P.; Rosenwald, A.; Caligaris-Cappio, F. The Microenvironment in Mature B-Cell Malignancies: A Target for New Treatment Strategies. Blood 2009, 114, 3367. [Google Scholar] [CrossRef] [PubMed]
- vom Stein, A.F.; Hallek, M.; Nguyen, P.H. Role of the Tumor Microenvironment in CLL Pathogenesis. Semin. Hematol. 2024, 61, 142–154. [Google Scholar] [CrossRef] [PubMed]
- Jalilivand, S.; Yazdanparast, S.; Bakhtiyaridovvombaygi, M.; Izadirad, M.; Mikanik, F.; Gharehbaghian, A. The Emerging Role of Cancer-Associated Fibroblasts in Hematological Malignancies: From Their Influence on Tumor Progression and Drug Resistance to Novel Therapeutic Opportunities. Clin. Exp. Med. 2025, 25. [Google Scholar] [CrossRef] [PubMed]
- García-Sánchez, D.; González-González, A.; Alfonso-Fernández, A.; Del Dujo-Gutiérrez, M.; Pérez-Campo, F.M.; García-Sánchez, D.; González-González, A.; Del Dujo-Gutiérrez, M.; Pérez-Campo, F.M. Communication between Bone Marrow Mesenchymal Stem Cells and Multiple Myeloma Cells: Impact on Disease Progression. World J. Stem Cells 2023, 15, 421–437. [Google Scholar] [CrossRef]
- Dubois, N.; Crompot, E.; Meuleman, N.; Bron, D.; Lagneaux, L.; Stamatopoulos, B. Importance of Crosstalk Between Chronic Lymphocytic Leukemia Cells and the Stromal Microenvironment: Direct Contact, Soluble Factors, and Extracellular Vesicles. Front. Oncol. 2020, 10. [Google Scholar] [CrossRef]
- Spelat, R.; Ferro, F.; Contessotto, P.; Warren, N.J.; Marsico, G.; Armes, S.P.; Pandit, A. A Worm Gel-Based 3D Model to Elucidate the Paracrine Interaction between Multiple Myeloma and Mesenchymal Stem Cells. Mater. Today Bio 2020, 5, 100040. [Google Scholar] [CrossRef]
- Bonilla, X.; Vanegas, N.D.P.; Vernot, J.P. Acute Leukemia Induces Senescence and Impaired Osteogenic Differentiation in Mesenchymal Stem Cells Endowing Leukemic Cells with Functional Advantages. Stem Cells Int. 2019, 2019, 3864948. [Google Scholar] [CrossRef]
- Ruiz-Aparicio, P.F.; Vernot, J.P. Bone Marrow Aging and the Leukaemia-Induced Senescence of Mesenchymal Stem/Stromal Cells: Exploring Similarities. J. Pers. Med. 2022, Vol. 12, 2022, 12. [Google Scholar] [CrossRef]
- Reagan, M.R.; Rosen, C.J. Navigating the Bone Marrow Niche: Translational Insights and Cancer-Driven Dysfunction. Nat. Rev. Rheumatol. 2016, 12, 154–168. [Google Scholar] [CrossRef]
- Sahai, E.; Astsaturov, I.; Cukierman, E.; DeNardo, D.G.; Egeblad, M.; Evans, R.M.; Fearon, D.; Greten, F.R.; Hingorani, S.R.; Hunter, T.; et al. A Framework for Advancing Our Understanding of Cancer-Associated Fibroblasts. Nat. Rev. Cancer 2020, 20, 174–186. [Google Scholar] [CrossRef]
Figure 2.
Direct interaction of lymphoma cells with collagen establishes a baseline for distinguishing contact-dependent from paracrine effects. (A) Representative phase-contrast images of RPMI-8226 (a) and HG-3 cells (b), illustrating their ability to form transient adhesive contacts with tissue-culture plastic despite being predominantly suspension-growing cell lines. Images were acquired directly from culture flasks at 20× magnification. (B) Cancer cells were allowed to attach for 2 h to FITC-collagen–coated substrate in serum-free medium. The associated collagen remodeling (green) is presented (a–c) and merged images with actin (red) and nuclei (blue) are also shown (e,d). Image (a) is the plain substrate, (b,e)—RPMI 8226, and (c,f)—HG-3 remodeling. Yellow arrows indicate cell attachment locations corresponding with higher substrate fluorescent intensity. White arrows indicate places where cells have transiently adhered and were subsequently washed away, leaving a visible remodeled region. Yellow asterisks denote diffuse darker “shadow-like” regions in the substrate. (d) Fluorescence measurements of the collected supernatants demonstrate increased release of FITC-collagen fragments in the presence of cancer cells compared with collagen-only (Plane) controls. Data are presented as mean ± SD (n = 4). Statistical significance was assessed using one-way ANOVA, followed by Tukey’s multiple comparisons test. Asterisks denotes statistical significance of p ≤ 0.01 (**), and p ≤ 0.001 (***). Scale bar: 50 µm (Panel (A)); 200 µm (Panel (B)).
Figure 2.
Direct interaction of lymphoma cells with collagen establishes a baseline for distinguishing contact-dependent from paracrine effects. (A) Representative phase-contrast images of RPMI-8226 (a) and HG-3 cells (b), illustrating their ability to form transient adhesive contacts with tissue-culture plastic despite being predominantly suspension-growing cell lines. Images were acquired directly from culture flasks at 20× magnification. (B) Cancer cells were allowed to attach for 2 h to FITC-collagen–coated substrate in serum-free medium. The associated collagen remodeling (green) is presented (a–c) and merged images with actin (red) and nuclei (blue) are also shown (e,d). Image (a) is the plain substrate, (b,e)—RPMI 8226, and (c,f)—HG-3 remodeling. Yellow arrows indicate cell attachment locations corresponding with higher substrate fluorescent intensity. White arrows indicate places where cells have transiently adhered and were subsequently washed away, leaving a visible remodeled region. Yellow asterisks denote diffuse darker “shadow-like” regions in the substrate. (d) Fluorescence measurements of the collected supernatants demonstrate increased release of FITC-collagen fragments in the presence of cancer cells compared with collagen-only (Plane) controls. Data are presented as mean ± SD (n = 4). Statistical significance was assessed using one-way ANOVA, followed by Tukey’s multiple comparisons test. Asterisks denotes statistical significance of p ≤ 0.01 (**), and p ≤ 0.001 (***). Scale bar: 50 µm (Panel (A)); 200 µm (Panel (B)).
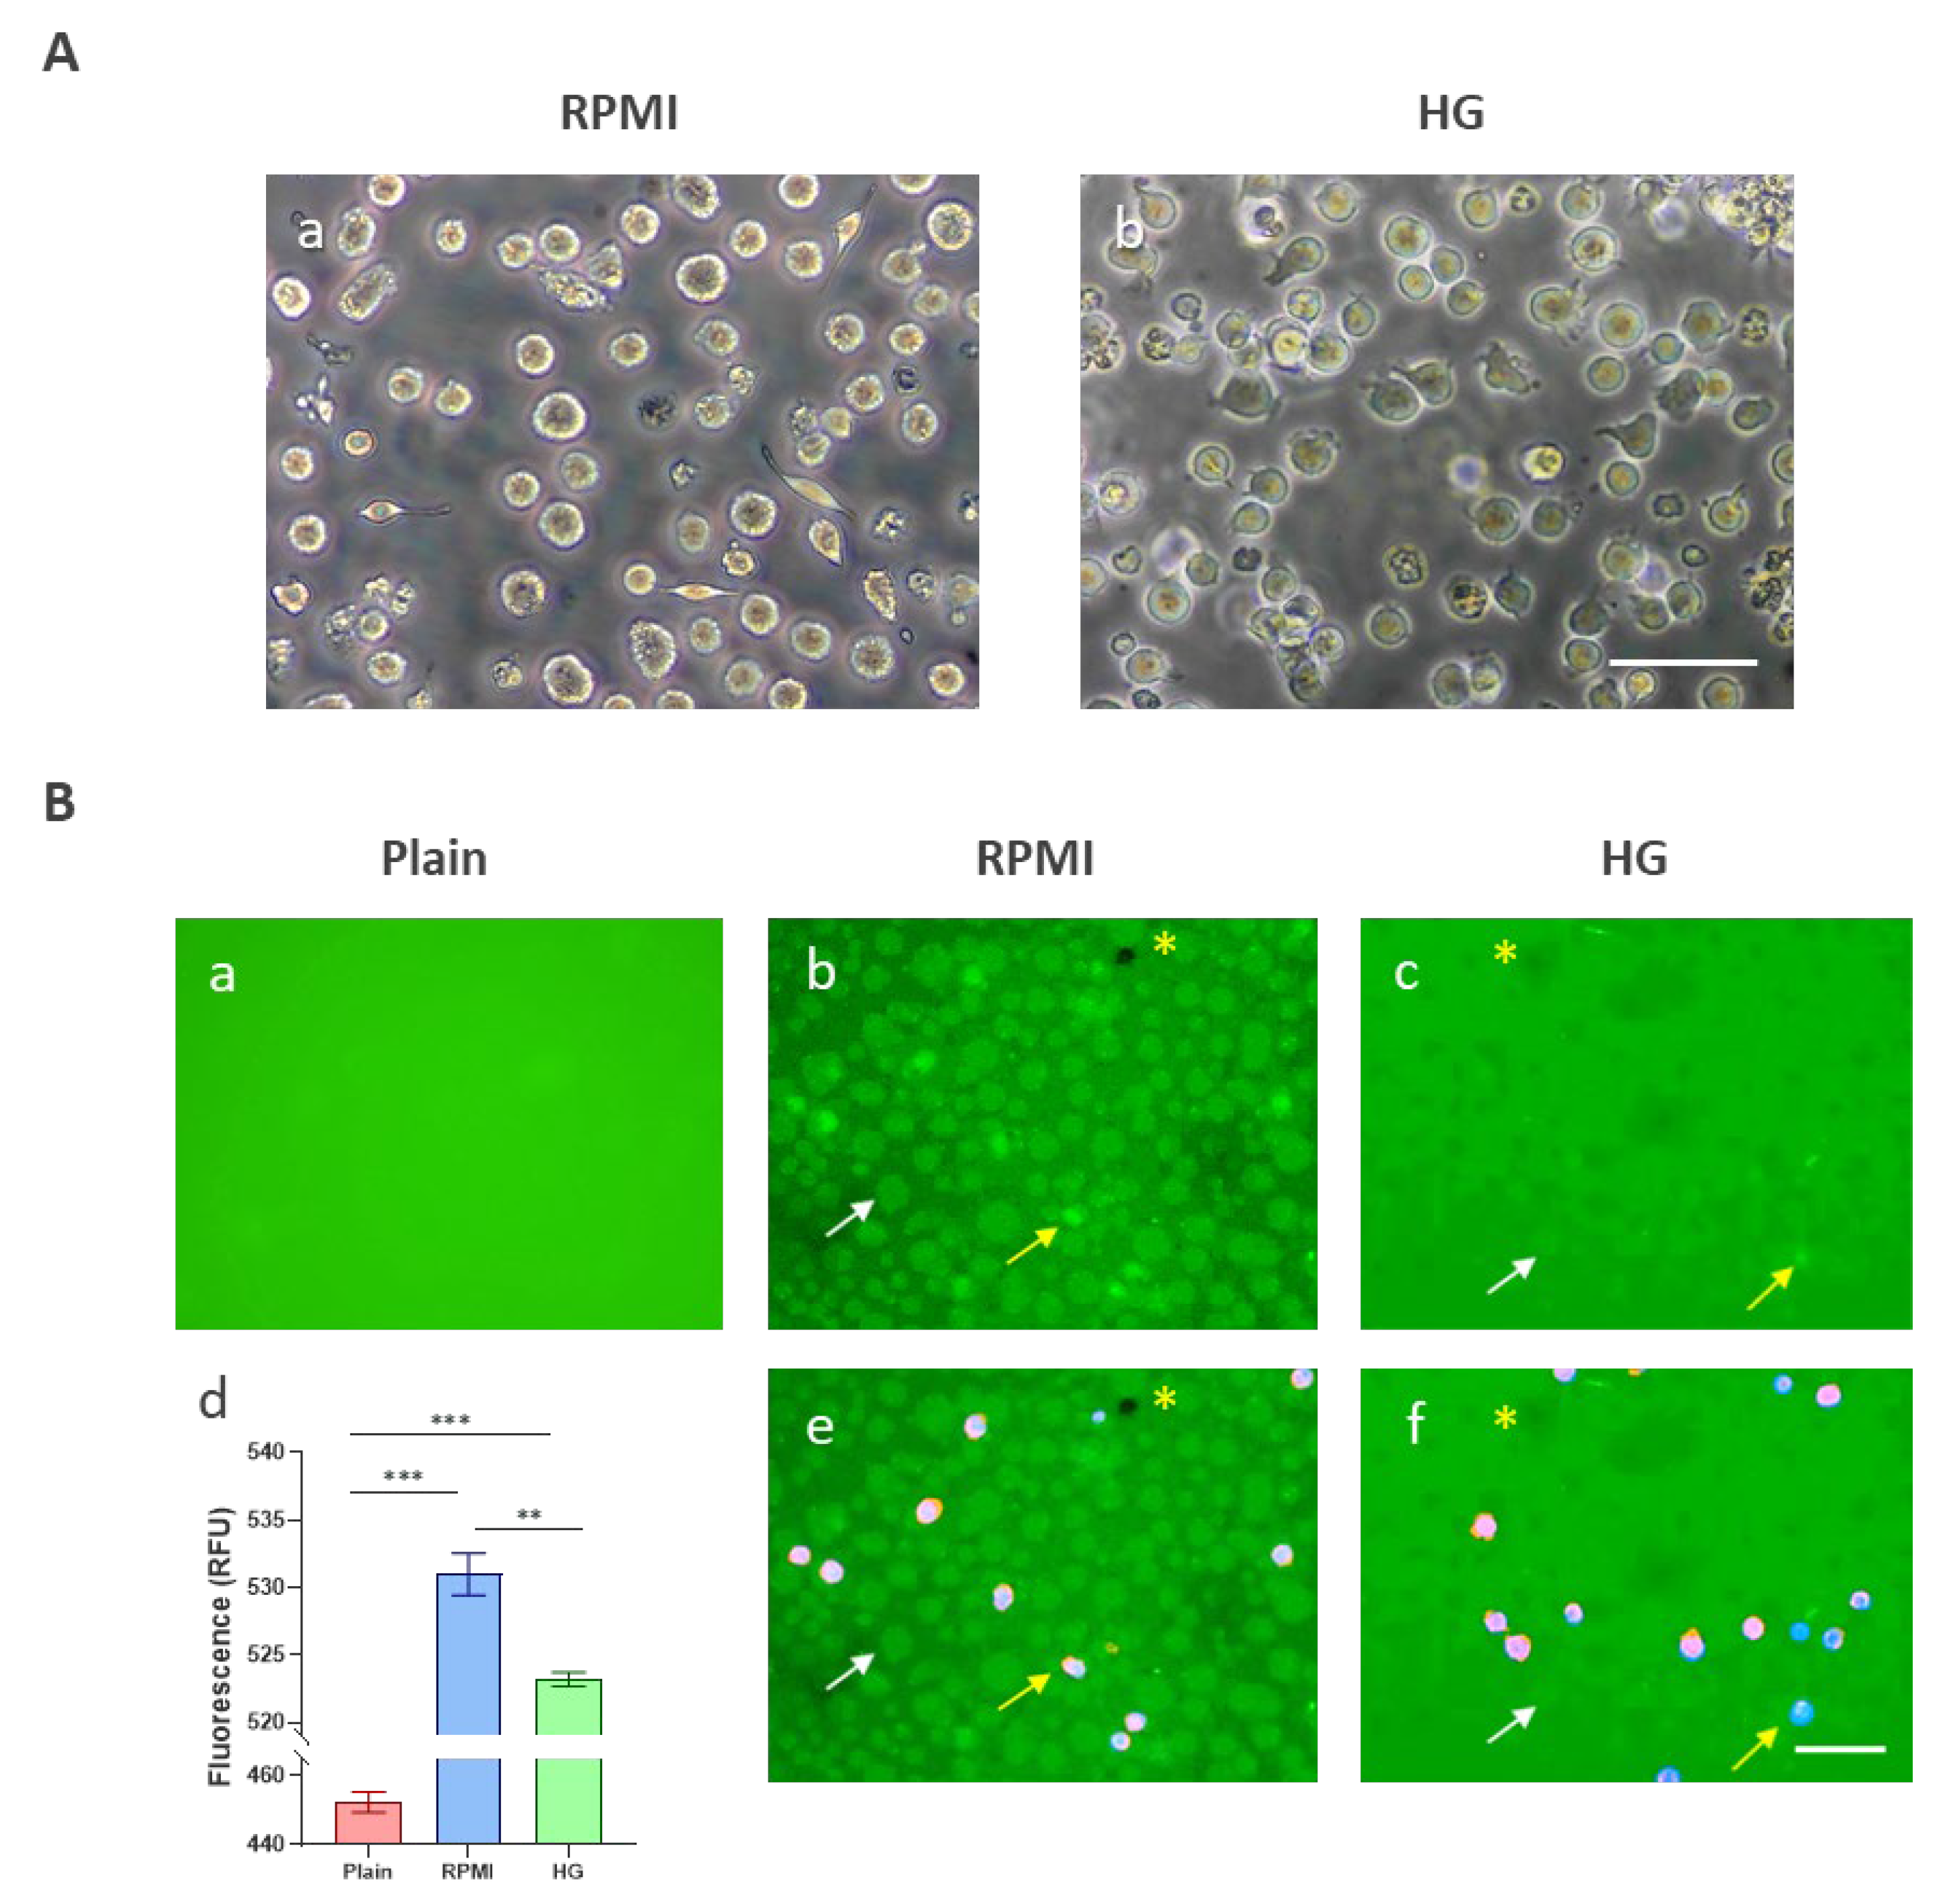
Figure 3.
Alterations in AD-MSCs morphology induced by myeloma (RPMI 8226) and leukemia (HG-3) secretomes after 5 h of incubation on collagen coated surfaces. Fluorescence images of AD-MSCs cultured for 3 days in control medium ((A), Plain) or in the presence of RPMI 8226 (RPMI; (B)) or HG-3 secretomes (HG; (C)) termed “induced”. Cells treated under the same conditions, followed by an additional 3-day culture in secretome-free medium (Residual—(D–F)) to assess the persistence of secretome-induced effects. Cells were stained for actin (red) and nuclei (blue). Diagrams show the corresponding distribution of cell spreading areas for “induced” (G) and “residual” (H) culture protocols. Data are presented as median ± IQR (n = 400). Statistical analysis was performed using Kruskal-Wallis followed by Dunn’s multiple comparisons test. Asterisks indicate statistical significance at p ≤ 0.001 (***). Scale bar: 20 µm.
Figure 3.
Alterations in AD-MSCs morphology induced by myeloma (RPMI 8226) and leukemia (HG-3) secretomes after 5 h of incubation on collagen coated surfaces. Fluorescence images of AD-MSCs cultured for 3 days in control medium ((A), Plain) or in the presence of RPMI 8226 (RPMI; (B)) or HG-3 secretomes (HG; (C)) termed “induced”. Cells treated under the same conditions, followed by an additional 3-day culture in secretome-free medium (Residual—(D–F)) to assess the persistence of secretome-induced effects. Cells were stained for actin (red) and nuclei (blue). Diagrams show the corresponding distribution of cell spreading areas for “induced” (G) and “residual” (H) culture protocols. Data are presented as median ± IQR (n = 400). Statistical analysis was performed using Kruskal-Wallis followed by Dunn’s multiple comparisons test. Asterisks indicate statistical significance at p ≤ 0.001 (***). Scale bar: 20 µm.
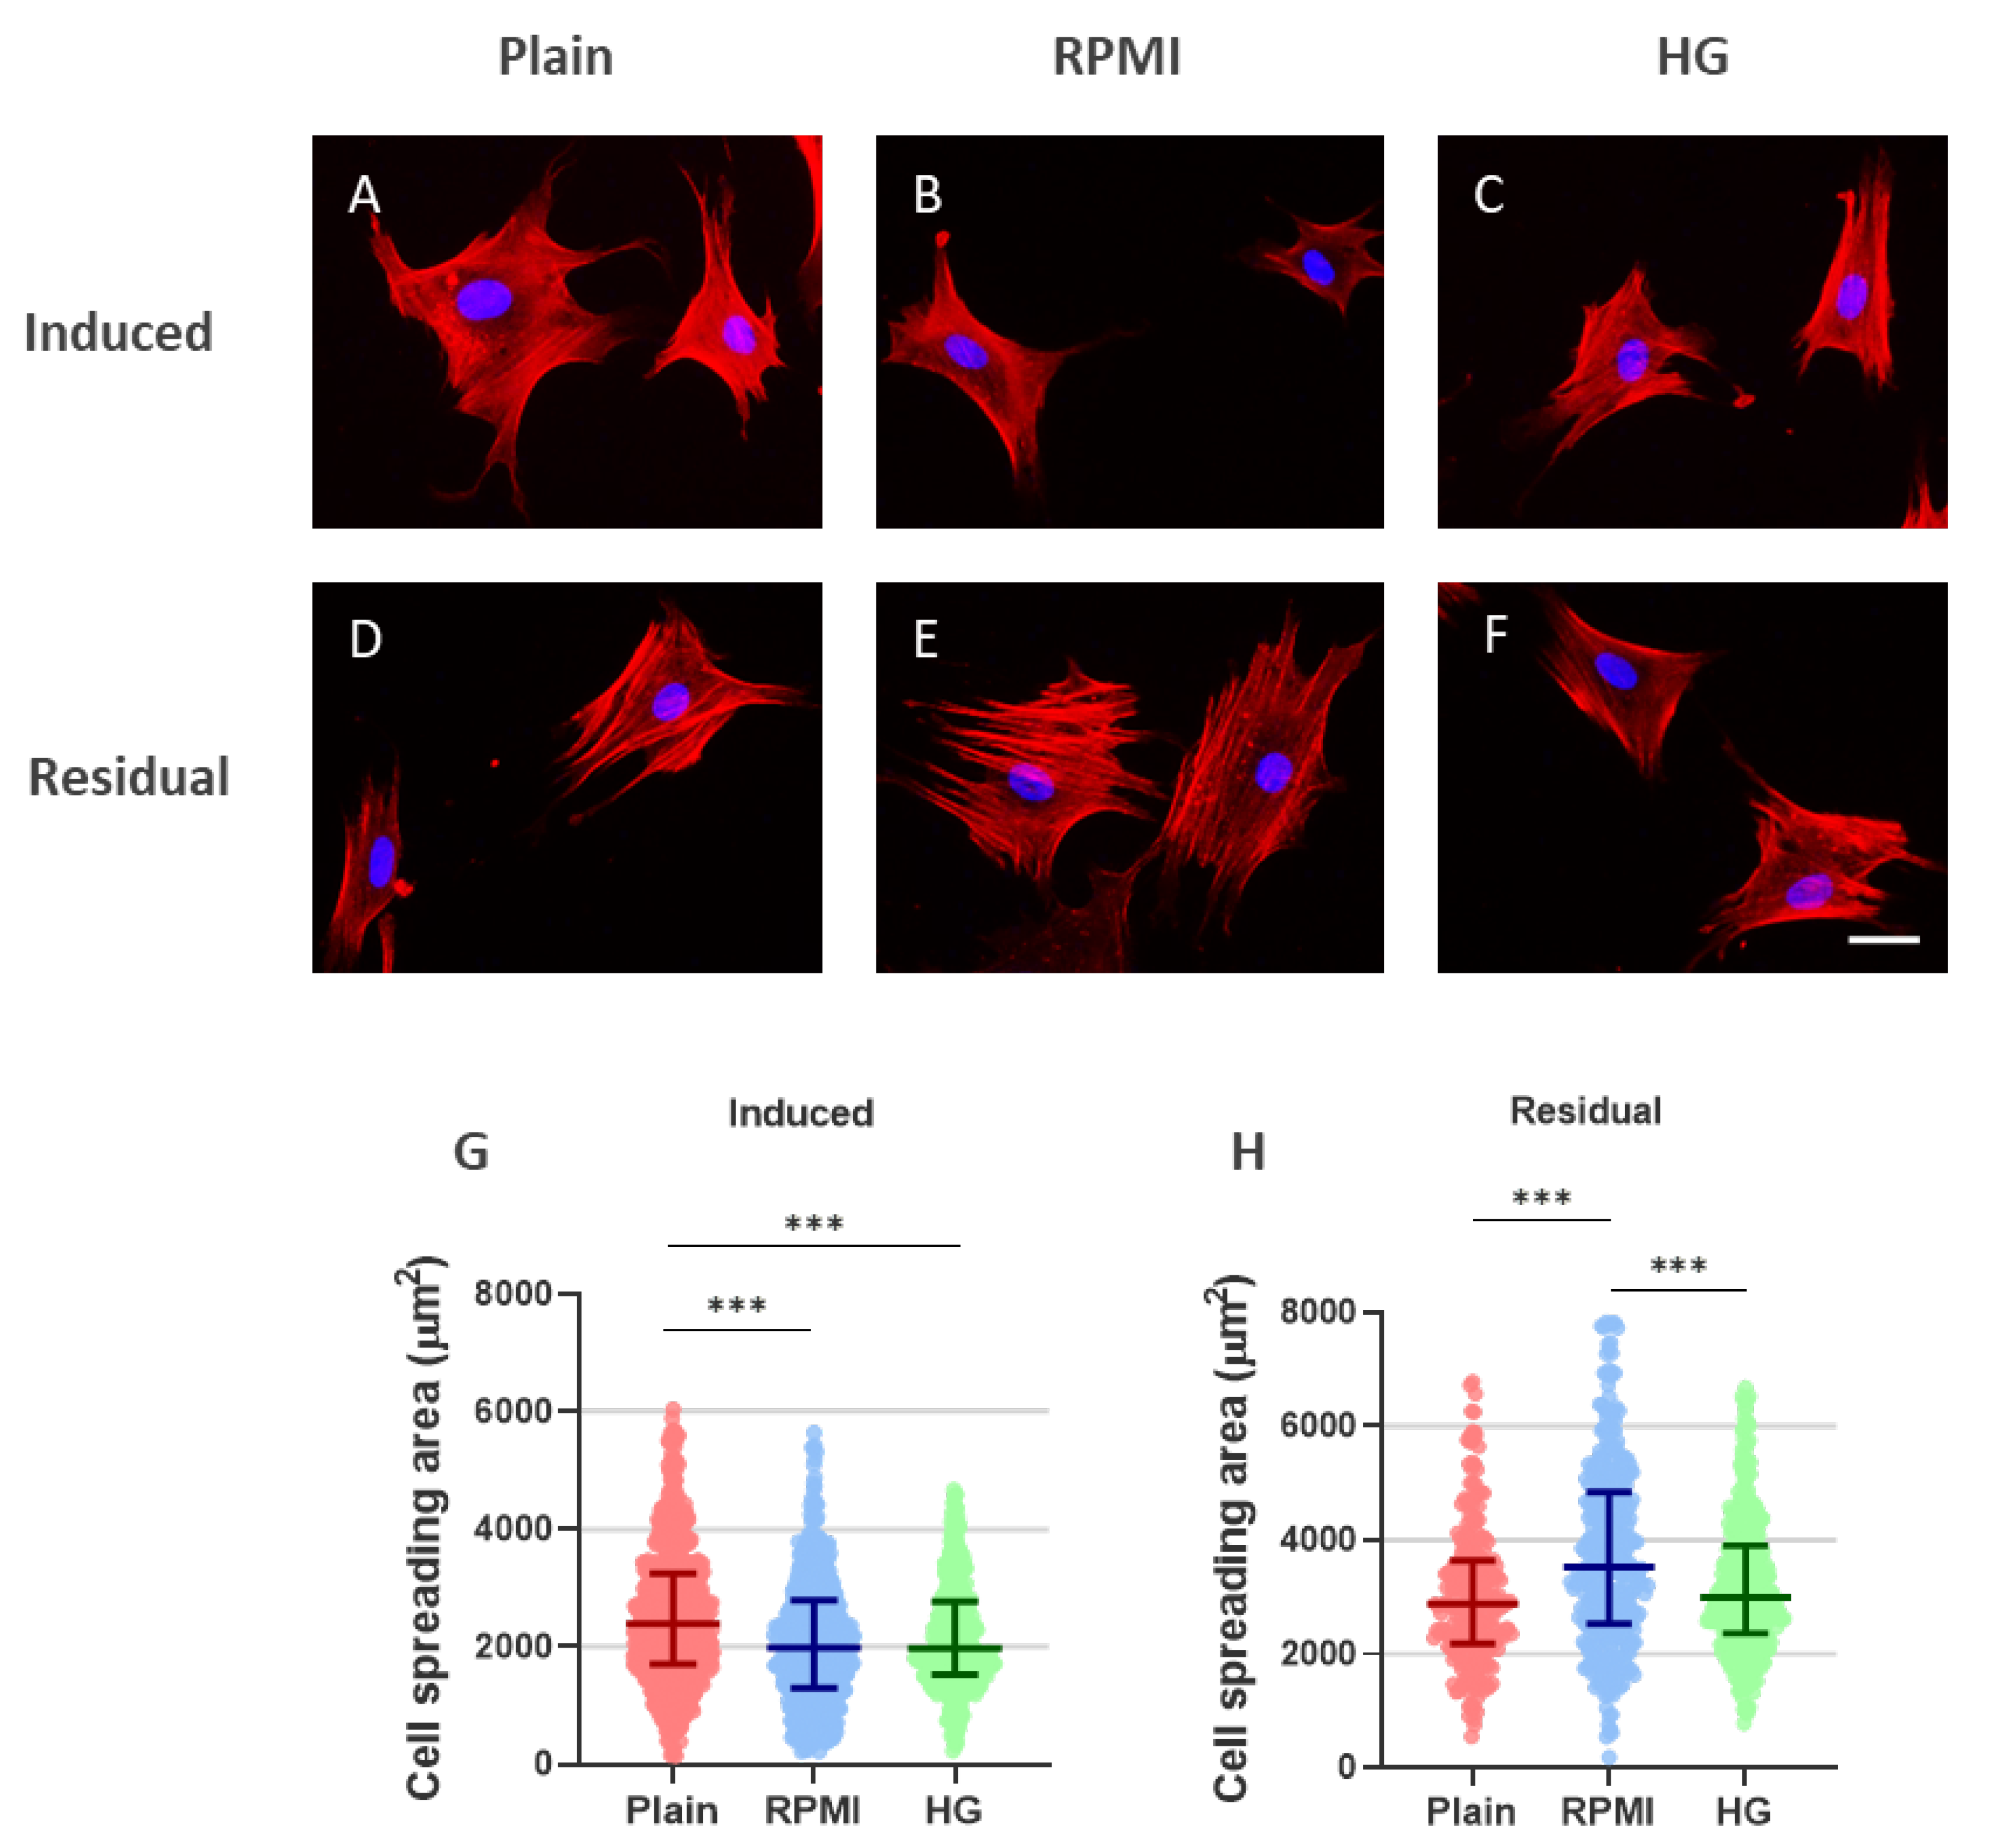
Figure 4.
Cancer cell secretomes from myeloma (RPMI 8226) and leukemia (HG-3) cell lines promote accelerated proliferation and premature aging in AD-MSCs. Cells were analyzed after 72 h of secretome exposure (“induced”; panels (A,B)) and after an additional 72 h of subculture in secretome-free medium (“residual”; panels (C,D)). Samples treated with RPMI 8226 secretome are shown in blue (RPMI), whereas those treated with HG-3 secretome are shown in green (HG). AD-MSCs maintained in control medium are depicted in red and labeled as “Plain.” Cell doubling time was calculated over the full 72-hour period (panels (A,C)), while the corresponding proliferation curves (B,D) present normalized cell density per image, with statistical comparisons performed at the 72-hour time point. Senescence levels (% β-galactosidase–positive cells at the 72-hour time point) are shown in panel E under both “induced” (Ind) and “residual” (Res) conditions. Data are presented as mean ± SD (n = 4). Statistical significance was determined using one-way ANOVA with Tukey’s multiple comparisons test. Asterisks indicate statistical significance: p ≤ 0.05 (*), p ≤ 0.01 (**), p ≤ 0.001 (***).
Figure 4.
Cancer cell secretomes from myeloma (RPMI 8226) and leukemia (HG-3) cell lines promote accelerated proliferation and premature aging in AD-MSCs. Cells were analyzed after 72 h of secretome exposure (“induced”; panels (A,B)) and after an additional 72 h of subculture in secretome-free medium (“residual”; panels (C,D)). Samples treated with RPMI 8226 secretome are shown in blue (RPMI), whereas those treated with HG-3 secretome are shown in green (HG). AD-MSCs maintained in control medium are depicted in red and labeled as “Plain.” Cell doubling time was calculated over the full 72-hour period (panels (A,C)), while the corresponding proliferation curves (B,D) present normalized cell density per image, with statistical comparisons performed at the 72-hour time point. Senescence levels (% β-galactosidase–positive cells at the 72-hour time point) are shown in panel E under both “induced” (Ind) and “residual” (Res) conditions. Data are presented as mean ± SD (n = 4). Statistical significance was determined using one-way ANOVA with Tukey’s multiple comparisons test. Asterisks indicate statistical significance: p ≤ 0.05 (*), p ≤ 0.01 (**), p ≤ 0.001 (***).
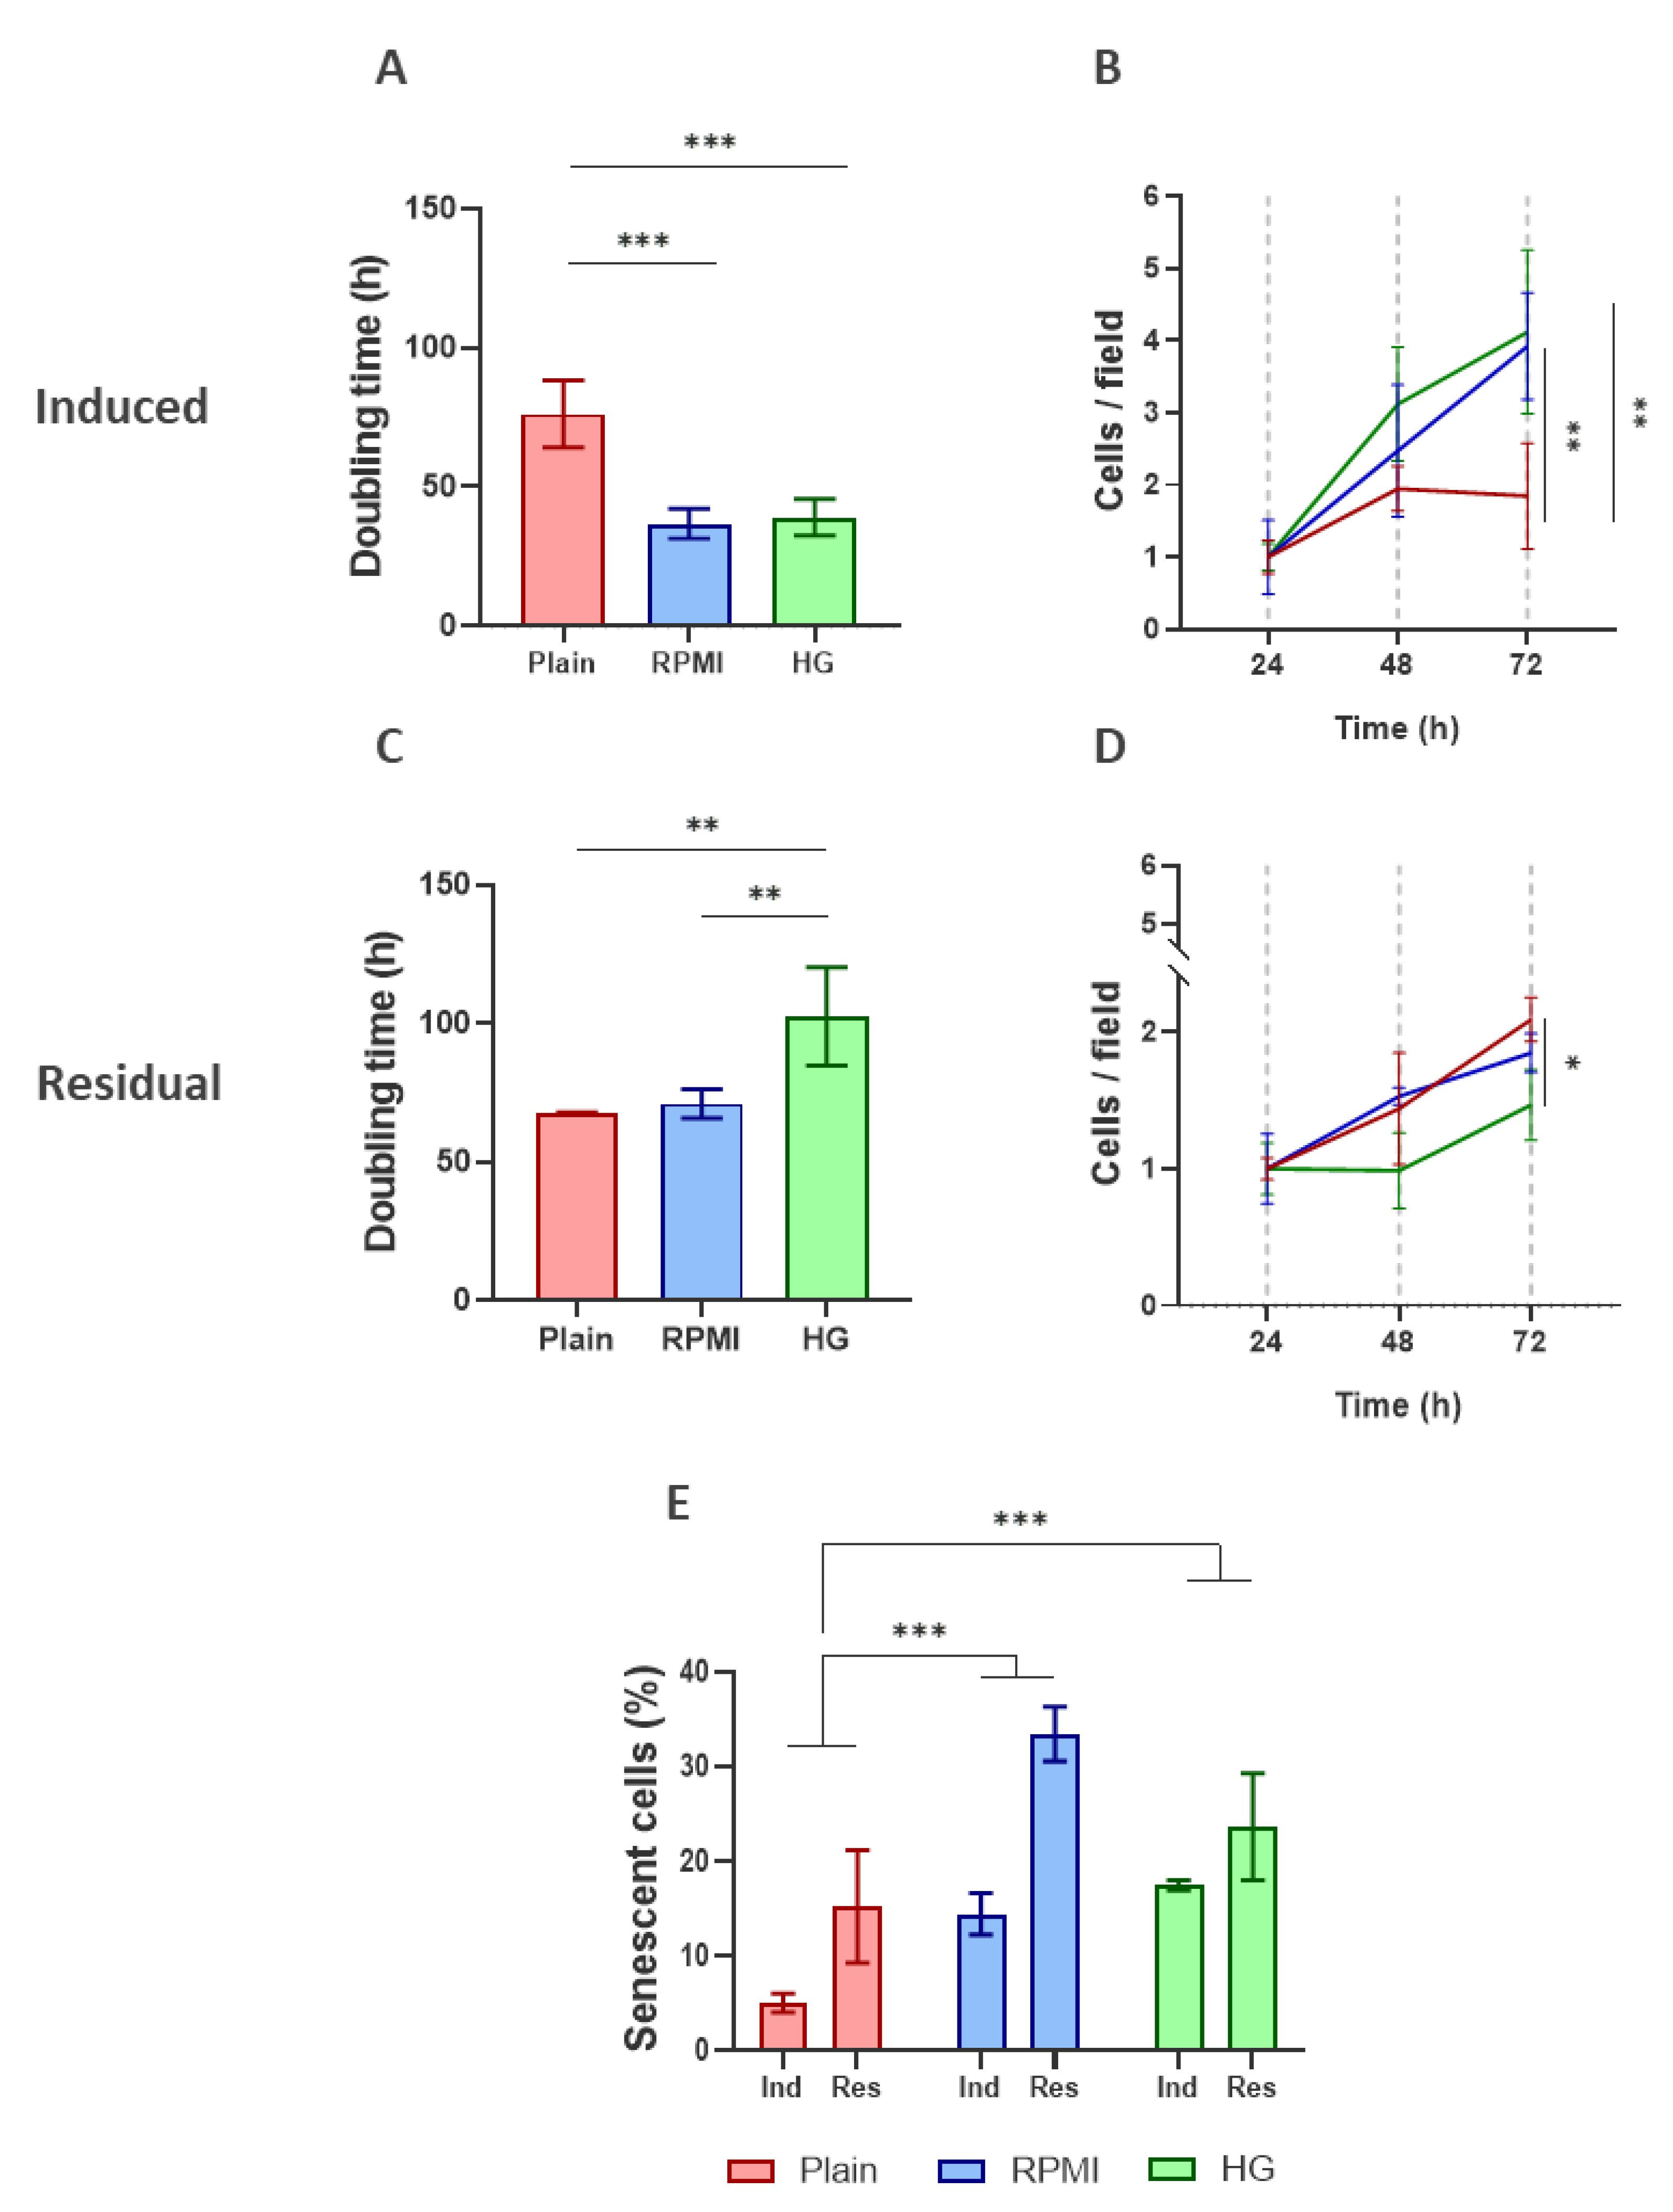
Figure 5.
AD-MSCs maintain high viability when exposed to cancer cell secretomes from myeloma (RPMI 8226) and leukemia (HG-3) cell lines. Fluorescent live/dead images are shown for all experimental conditions (Plain, RPMI 8226-treated, and HG-3–treated) under both “induced” (A) and “residual” (B) settings. Images were captured at 10× magnification at the 72-hour time point and display viable Calcein-AM–positive cells (green) and dead ethidium-bromide–positive cells (red). Quantitative analyses of AD-MSC viability is presented under “induced” (C) and “residual” (D) conditions at 24- and 72-hour time points, respectively. Data are shown as mean ± SD (n = 4). Error bars exceeding 100% were truncated at the upper limit of the scale. Statistical significance was assessed using one-way ANOVA followed by Tukey’s multiple comparisons test. Scale bar: 100 µm.
Figure 5.
AD-MSCs maintain high viability when exposed to cancer cell secretomes from myeloma (RPMI 8226) and leukemia (HG-3) cell lines. Fluorescent live/dead images are shown for all experimental conditions (Plain, RPMI 8226-treated, and HG-3–treated) under both “induced” (A) and “residual” (B) settings. Images were captured at 10× magnification at the 72-hour time point and display viable Calcein-AM–positive cells (green) and dead ethidium-bromide–positive cells (red). Quantitative analyses of AD-MSC viability is presented under “induced” (C) and “residual” (D) conditions at 24- and 72-hour time points, respectively. Data are shown as mean ± SD (n = 4). Error bars exceeding 100% were truncated at the upper limit of the scale. Statistical significance was assessed using one-way ANOVA followed by Tukey’s multiple comparisons test. Scale bar: 100 µm.
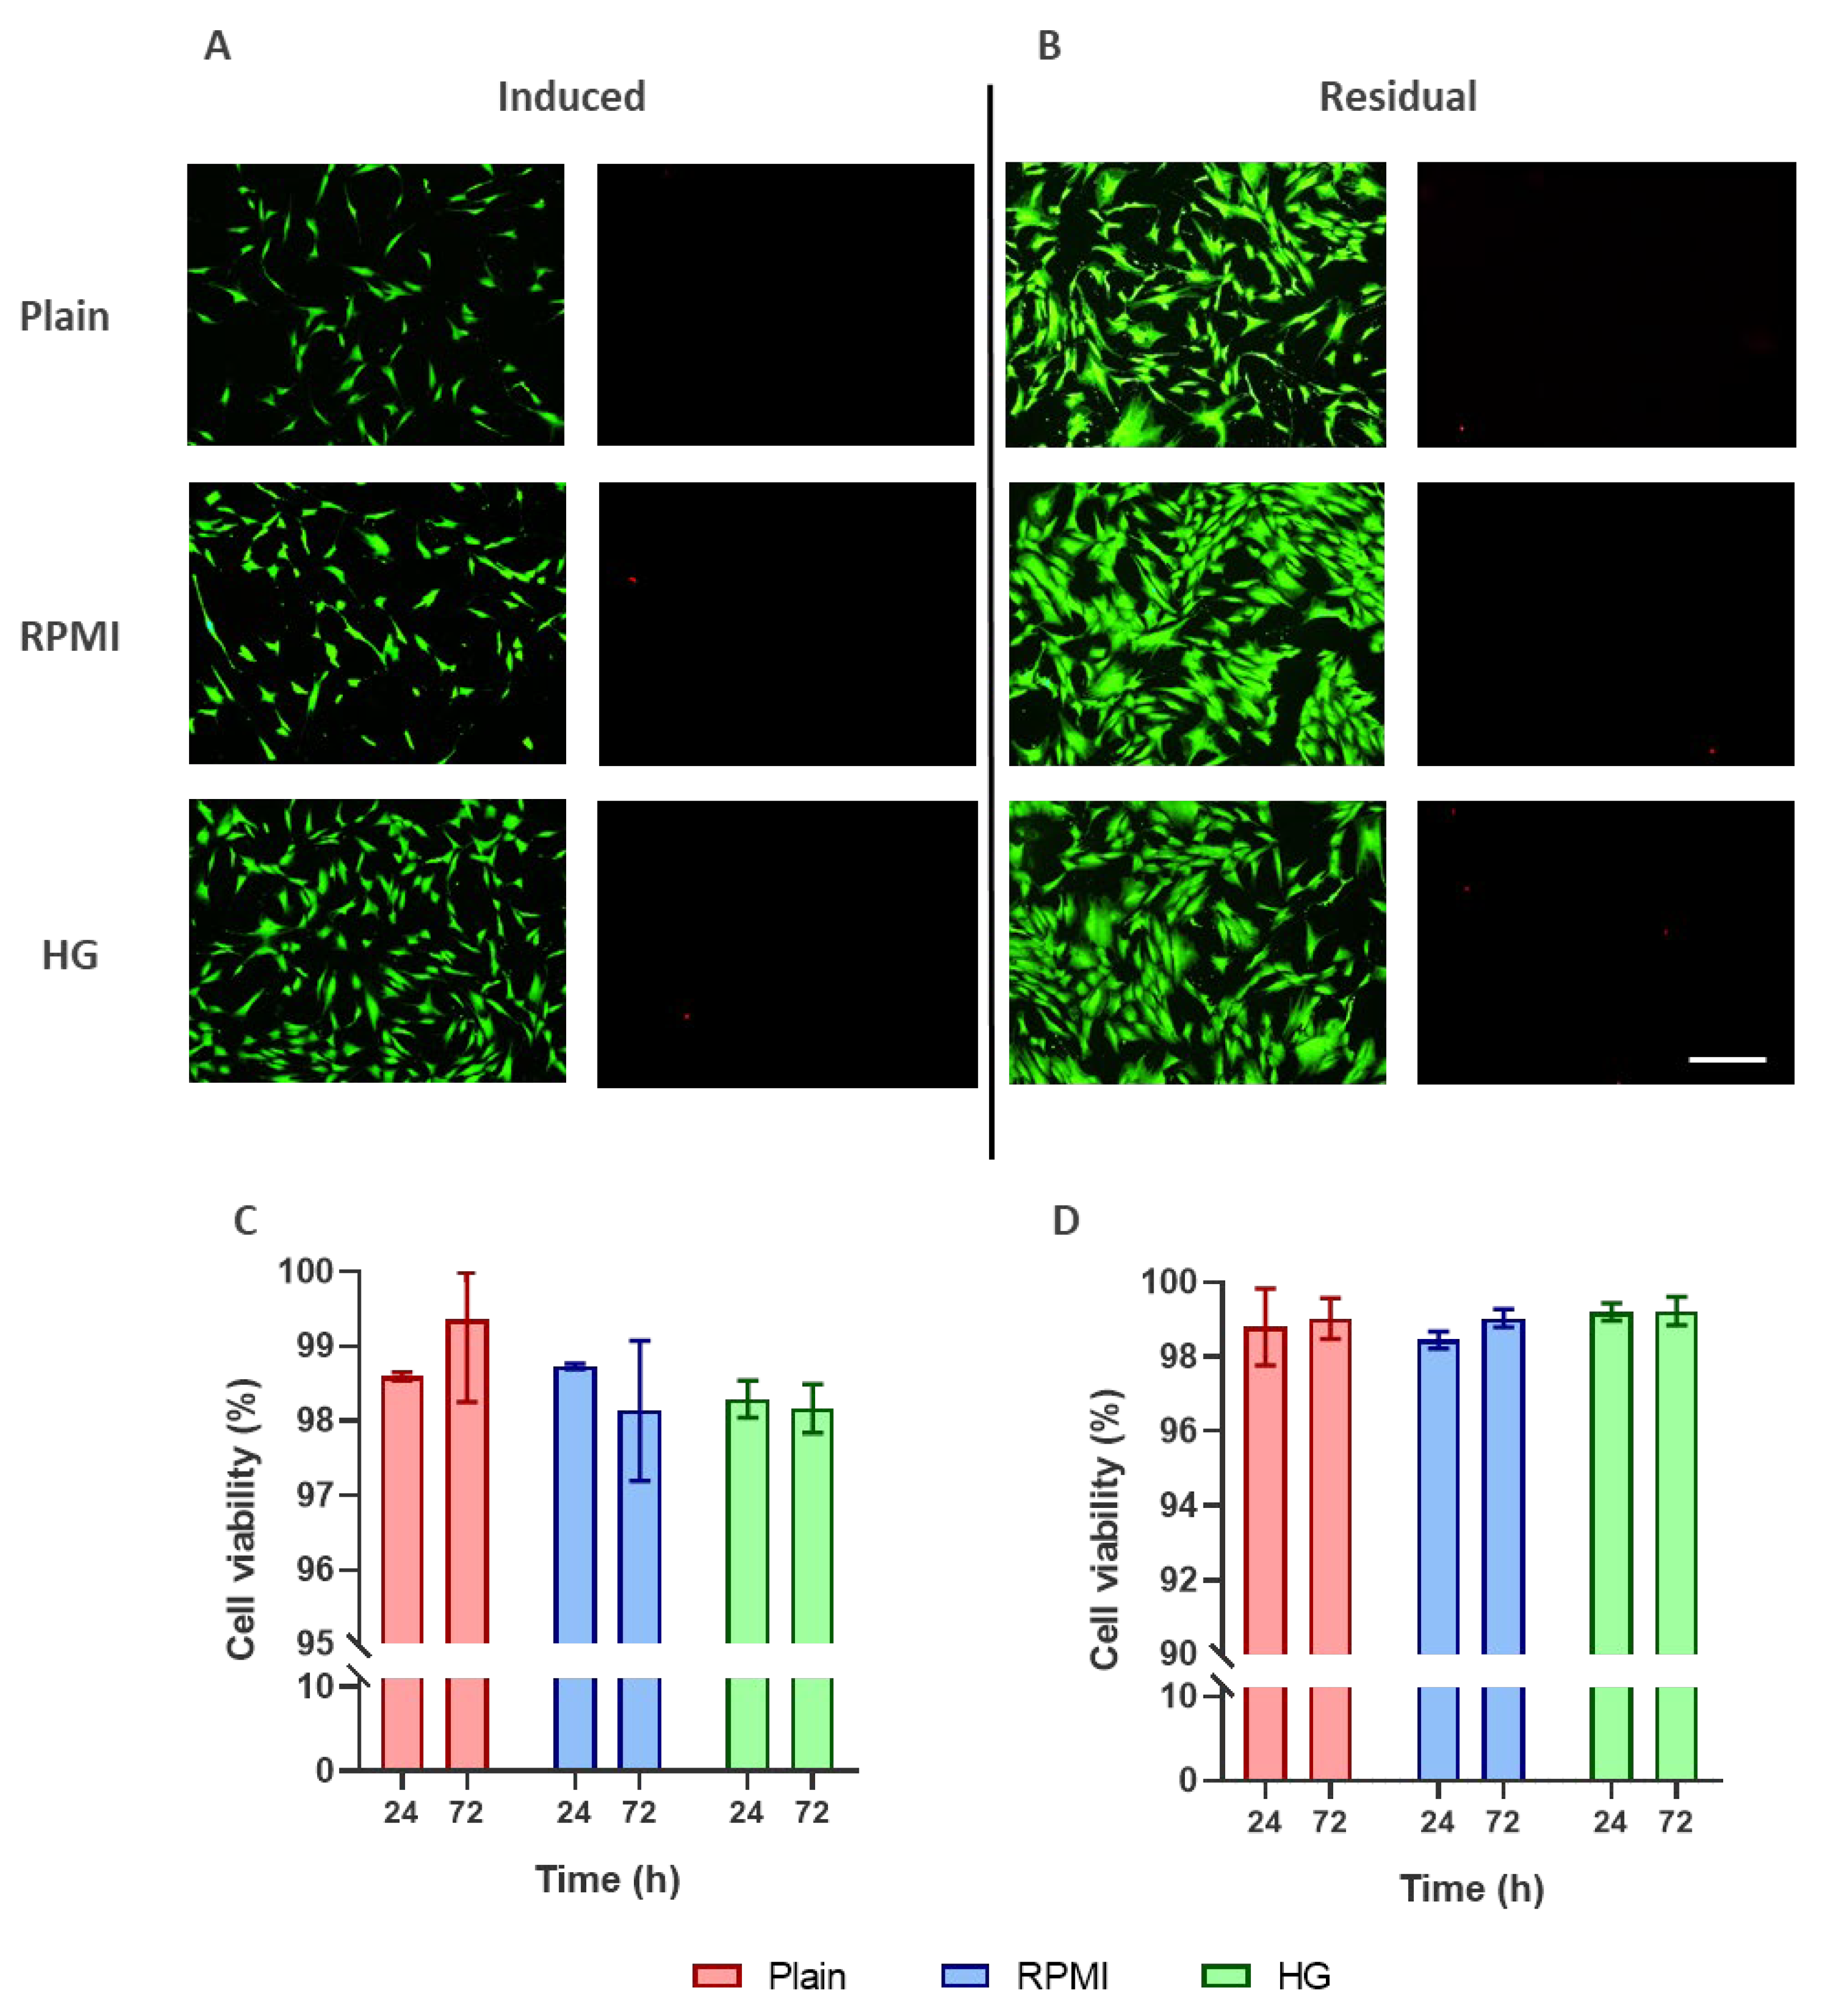
Figure 6.
FITC-collagen remodeling by AD-MSCs after exposure to cancer cell secretomes from myeloma (RPMI 8226) and leukemia (HG-3) cell lines. Representative fluorescence micrographs of AD-MSCs cultured for 5 h on FITC-collagen substrates under control conditions or after treatment with RPMI 8226- or HG-3-derived secretomes. Cells were analyzed under both “induced” (A) and “residual” (C) protocols. To visualize cell morphology, fixed samples were stained for actin (red) and nuclei (blue), overlaid on the fluorescent background of adsorbed FITC-collagen (green) (upper panels in (A,C)). CellProfiler software was used to identify remodeled collagen regions (light blue) and superimpose them onto cell boundaries (orange) to quantify the ratio of remodeled collagen area to cell spreading area (CSA). Quantification of collagen remodeling is shown for “induced” (B) and “residual” (D) conditions, with data presented as mean ± SD (n = 6). Statistical analysis was performed using one-way ANOVA followed by Tukey’s multiple comparisons test. Asterisks indicate statistical significance: p ≤ 0.001 (***). Scale bar for panels (A,C): 20 μm.
Figure 6.
FITC-collagen remodeling by AD-MSCs after exposure to cancer cell secretomes from myeloma (RPMI 8226) and leukemia (HG-3) cell lines. Representative fluorescence micrographs of AD-MSCs cultured for 5 h on FITC-collagen substrates under control conditions or after treatment with RPMI 8226- or HG-3-derived secretomes. Cells were analyzed under both “induced” (A) and “residual” (C) protocols. To visualize cell morphology, fixed samples were stained for actin (red) and nuclei (blue), overlaid on the fluorescent background of adsorbed FITC-collagen (green) (upper panels in (A,C)). CellProfiler software was used to identify remodeled collagen regions (light blue) and superimpose them onto cell boundaries (orange) to quantify the ratio of remodeled collagen area to cell spreading area (CSA). Quantification of collagen remodeling is shown for “induced” (B) and “residual” (D) conditions, with data presented as mean ± SD (n = 6). Statistical analysis was performed using one-way ANOVA followed by Tukey’s multiple comparisons test. Asterisks indicate statistical significance: p ≤ 0.001 (***). Scale bar for panels (A,C): 20 μm.
Disclaimer/Publisher’s Note: The statements, opinions and data contained in all publications are solely those of the individual author(s) and contributor(s) and not of MDPI and/or the editor(s). MDPI and/or the editor(s) disclaim responsibility for any injury to people or property resulting from any ideas, methods, instructions or products referred to in the content. |
© 2026 by the authors. Licensee MDPI, Basel, Switzerland. This article is an open access article distributed under the terms and conditions of the Creative Commons Attribution (CC BY) license (http://creativecommons.org/licenses/by/4.0/).
Copyright: This open access article is published under a Creative Commons CC BY 4.0 license, which permit the free download, distribution, and reuse, provided that the author and preprint are cited in any reuse.