
Submitted:
16 March 2026
Posted:
17 March 2026
You are already at the latest version
Abstract
Microplastics have been known to kill fish and other microorganisms that feed on them in water bodies. The microplastics are also harmful to human beings when consumed directly or indirectly. This paper focuses on extracting features that can be used to build a model for identifying microplastics in images taken from open sewers that lead to the Indian Ocean. One thousand (1000) pictures were taken from selected points in Kilifi, Mombasa and Kwale counties in Kenya using a still picture camera. The pictures were then subjected to auto-cropping using a code written in python programming language. TensorFlow tool with openCV was used to capture the shape of the microplastics and annotate them by drawing bounding boxes. This was followed by application of Scale-Invariant Feature Transform (SIFT) algorithm to extract features from the images. The output of the process was a dataset of features for model building to identify microplastics in images. Further research can be conducted to extract more features using different algorithms and build models for identifying microplastics in images.
Keywords:
microplastics
; deep learning
; TensorFlow
; bounding boxes
; SIFT
1. Introduction
Microplastics are tiny plastic particles that measure less than 5 millimeters in size, commonly found in marine environments, including oceans, lakes, and rivers [13]. They are usually the result of the breakdown of larger plastic materials or the direct disposal of microplastics into the environment. Microplastics can accumulate in water bodies and soil, and their consumption by marine life and other microorganisms can lead to death [14]. They pose a significant threat to aquatic organisms and have been known to cause harm to human beings when consumed directly or indirectly [13]. The impact of microplastics on the environment has been widely researched, and various approaches have been proposed to identify and mitigate their presence [14]. In this paper, we focus on extracting features that can be used to build a model for identifying microplastics in images taken from open sewers that lead to the Indian Ocean.
The paper presents the process of feature extraction from images of microplastics in open sewer systems using Scale-Invariant Feature Transform (SIFT) algorithm. The extracted features will be used to build a model for identifying the presence of microplastics in the environment and thus help in their control.
The first goal of this research was to discover the characteristics that influence the presence of microplastics in photographs taken from open sewer systems. Microplastics characteristics can be divided into two categories: physical and chemical where dimensions and colour are physical attributes, while structure and polymer composition are chemical attributes, [1,7]. The emphasis was to investigate the physical attribute of microplastics, specifically variations in size rather than colour, as the primary feature to be analyzed in the data. Foam is one of the physical characteristics that can be used to identify microplastics [15,16].
When organic materials such as leaves or twigs decompose in water, they release surfactants that disrupt the surface tension and facilitate the mixing of air and water, ultimately leading to the formation of natural foam. Although not all foam is naturally occurring, certain human-made products such as detergents can generate foam that is visually similar to natural foam but contains harmful chemicals that pose a threat to aquatic life, including fish [16]. Therefore, it is crucial to distinguish between natural and human-made foam in water bodies to prevent potential environmental harm.
2. Related Work
This review focused on feature extraction techniques for object detection in images. Tiny objects such as microplastics in images have been detected using various techniques. One such study explored IoT devices and instance segmentation for detecting suspicious objects in hyperspectral images and then classifying them using Neural Networks, to detect, classify, and quantify microplastics pollution in freshwater ecosystems [9]. The study by Sundar magnified the images to detect the objects, this approach did not require feature extraction [9]. Another study used YOLOv5, a Convolutional Neural Network (CNN), a deep learning model to detect and classify microplastics and microorganisms in the marine environment. They trained the model on a dataset of marine images marked using Label-Studio and achieved accurate detection and classification of microplastics [8].
A different approach employed electrical impedance spectroscopy (EIS) enhanced by support vector machines (SVMs) to detect microplastics in water. Stationary and dynamic measurements were taken on water samples contaminated with different plastic concentrations. The model achieved a high classification accuracy of above 90% for detecting microplastics using SVMs [4]. A similar approach used Electrical impedance spectroscopy (EIS) enhanced by a classifier based on support vector machines (SVM) to detect microplastics. This method successfully distinguished different plastic materials and particle sizes [1]. Another interesting approach that begins with Polarization-resolved digital holography was employed to discriminate synthetic microfibers for detection of the microplastics using machine-learning. A high accuracy of more than 85% in classifying microfibers was achieved [12].
A study using deep learning techniques was conducted on general small object detection [2]. A further study used an improved Single Short Detection (SSD) algorithm which incorporates DenseNet and feature fusion, being improved versions of Convolutional Neural Network (CNN). The study demonstrated advancements in object detection algorithms [6]. These advanced deep learning techniques can be applied to microplastics detection tasks. The current study employed one of the advanced deep learning techniques called Scale-Invariant Feature Transform (SIFT) algorithm [17] to extract features of microplastics in images taken from sewer systems.
3. Methodology
3.1. Data Selection
Previous studies of pollution along the Kenya coastline identified three counties; Kilifi, Mombasa, and Kwale, as major inlets into the ocean as a result of the increased tourism activity in these areas, [5]. As a result, the counties of Kilifi, Mombasa, and Kwale were chosen as data collection points for this study.
This study employed stratified sampling [10]. Sewer points were identified in the three counties where pictures were taken. The dataset was gathered from the various locations in Kilifi, Mombasa, and Kwale. All sewer points flowing into the Indian Ocean were represented by the selected points. The Nyali Bridge and Fort Jesus were selected in Mombasa [11]. In Kilifi, Kilifi Creek and Malindi Beaches were selected, while in Kwale County, Kwale river tributary was selected. Photographs were taken at these locations and analyzed.
3.2. Data Collection
Data was collected using photographic images. A high-resolution camera was used to capture images from the identified locations. The study used Canon EOS 2000D DSLR 24.1MP Camera with EF-S 18-55mm f/3.5-5.6 II USM Lens Camera Cover R-F-3, Camera strap, EW-400D Battery Pack, LP-E10 Scene Intelligent Auto 3.0LCD Screen. One thousand (1000) pictures were taken using the same camera. The pictures were then subjected to auto-cropping using an algorithm written in python to isolate the microplastics. Since the study did not capture images of persons there was no need for consent form for participants.
Raw sewage was clearly present, particularly along the beaches of Kilifi and Kwale, however, the precise locations where the sewer flowed into the ocean were not obvious. Regardless, the odour of sewage and the presence of non-dissolving foam were clear indicators of microplastics’ presence. In Mombasa the collection points, particularly those on the island, were noticeably more accessible. To avoid potential bias in the dataset, data on foam was collected, as a specific type of physical characteristic of microplastics data.
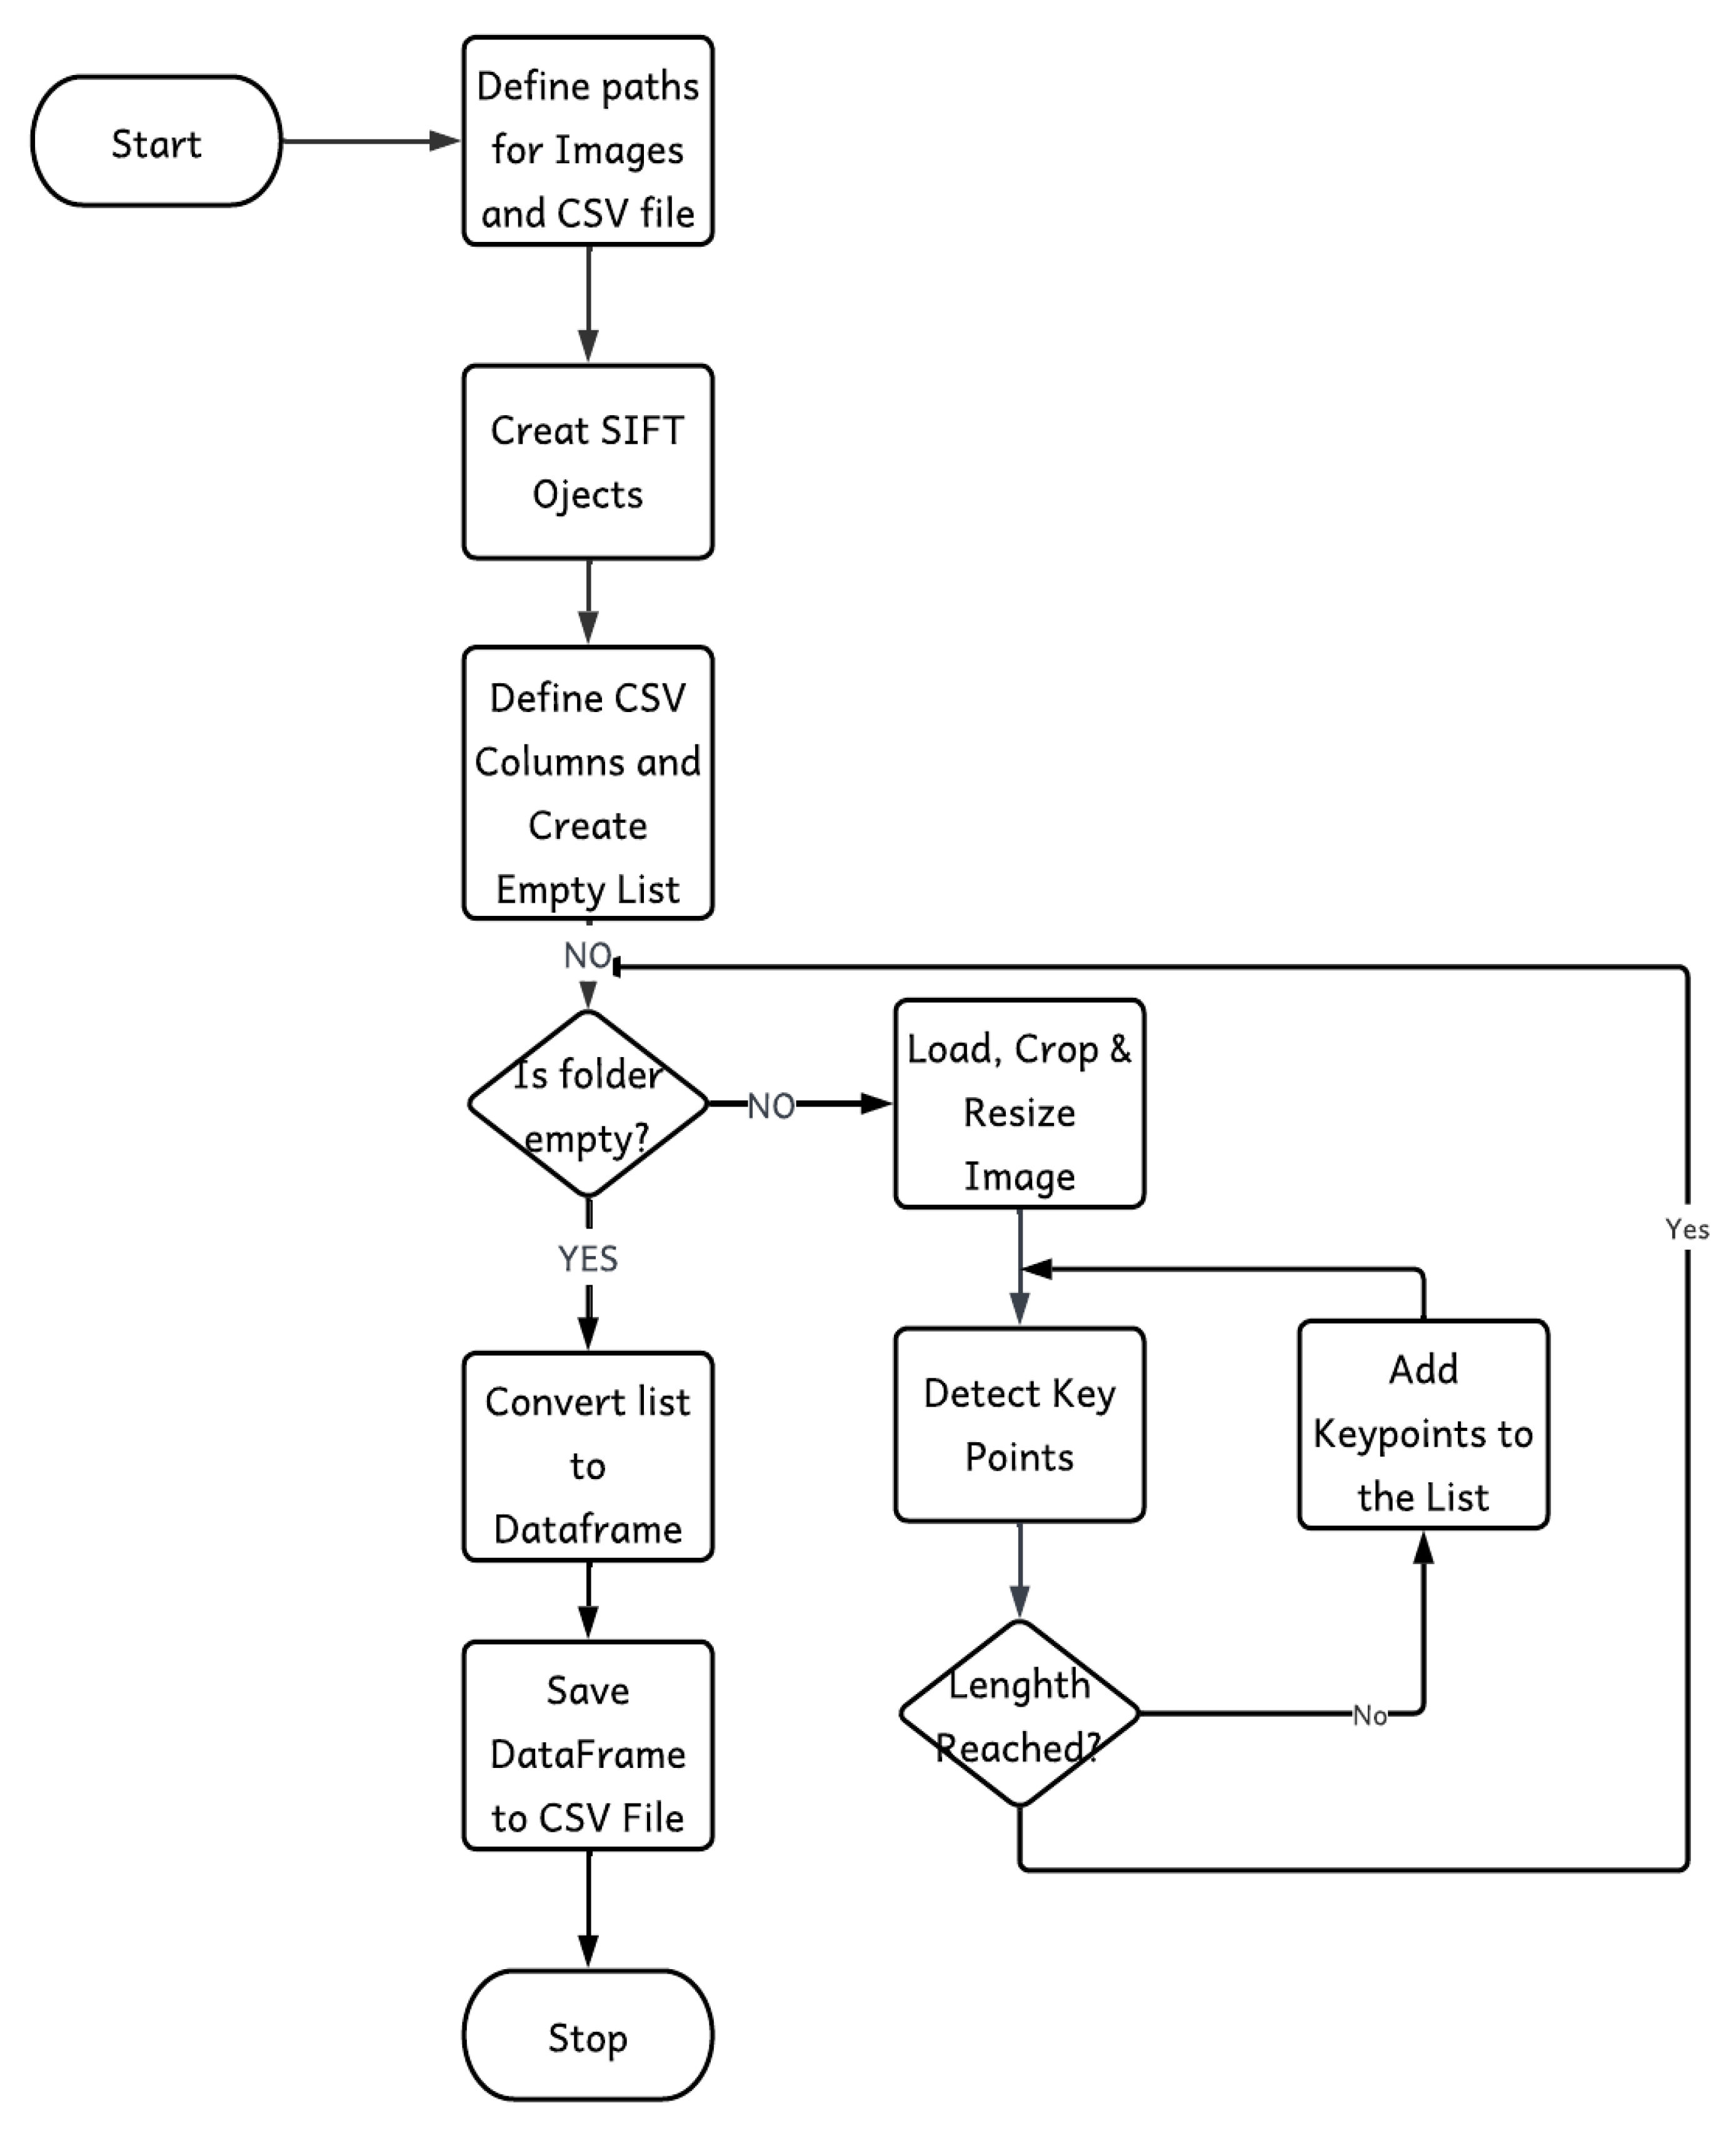
Figure 1.
Flow chart for image processing.
3.3. Data Preprocessing
Data preprocessing is critical because it serves as a foundation for the subsequent stages of the deep learning workflow. A thorough data processing stage ultimately leads to improved model accuracy and precision. Figure 2 shows image samples that provide a visual representation of the unprocessed data.
The following activities were undertaken to transform the dataset into a usable form: (i) Importing Relevant Python Deep Learning Libraries, (ii) Renaming of the image files, (iii) Resizing of images, (iv) Detecting key points and computing descriptors, (v) Looping over the key points and adding them to the list, (vi) Converting the list to a Pandas Dataframe, and (vii) Saving the Data Frame to a CSV file. The details of the steps are presented next.
- a)
- Importing Relevant Python Deep Learning Libraries: these libraries play a crucial role in facilitating the efficient manipulation and analysis of the data.
- b)
- Renaming of the image files: the image files were renamed to enhance ease of reference and to adhere to established naming conventions that align with the requirements of machine learning algorithms.
- c)
- Resizing of images: the images underwent a resizing procedure. The objective of this step was to standardize the dimensions of the images, aligning them with the specific input layer prerequisites of the neural network. By achieving uniformity in image size, the model's ability to accurately interpret intrinsic features within the dataset was heightened.
- d)
- Detecting key points and computing descriptors: this stage involves the detection of key points within the images and the subsequent computation of descriptors associated with these points. These descriptors encompassed crucial numerical characteristics detailing aspects such as orientation, scale, and spatial location. Through dedicated training, the model would acquire proficiency in identifying key points and calculating their corresponding descriptors.
- e)
- Converting the list to a Pandas Dataframe: the identified key points and their descriptors were consolidated within a well-structured list. This list served as a malleable foundation for further analysis and transformations. To facilitate streamlined data manipulation and exploration, the list was then transmuted into a Pandas Data Frame. This tabular structure endowed researchers with the capability to perform intuitive data manipulation operations.
- f)
- Saving the Data Frame to a CSV file: the prepared data was saved as a Comma Separated Value (CSV) file, a versatile data format that supports seamless integration into diverse software applications. This final step empowered subsequent phases of analysis and model training by providing a coherent and accessible dataset for further investigations.
The activities (shown in Figure 1) involved in transforming the dataset into a usable format highlight the significance of data preprocessing in deep learning. The steps taken aimed to standardize the data and extract relevant features, ultimately improving the model's accuracy and precision in object recognition and classification. The TensorFlow tool with openCV was used to capture the shape of microplastics, and bounding boxes were used to annotate the microplastics in the same images. Furthermore, the Scale-Invariant Feature Transform (SIFT) algorithm was used to extract relevant features from the images. Specific features were keypoints, size, angle and 128 descriptors, which gave insightful information about the object in the picture. The output of the process was a dataset of features for model building to identify microplastics in images. The dataset included features such as the size, shape, texture, and color of the microplastics.
4. Results
To achieve the goal of determining features that show the presence of microplastics in the images, one of the most important questions was:
“What characteristics are identified in photos taken from open sewer systems that indicate the presence of Microplastics?”
This study concentrated on the physical properties of microplastics. These properties are tangible when implementing Deep Learning algorithms for object detection in images because they can be easily depicted using visual imagery. It was revealed that microplastics (MPs) have the following physical properties: fibre, sphere, foam, sheet, fragment, bead, and film. The vast majority of fiber-shaped MPs are naturally derived. The clothing industry is the primary source of microfiber release, owing to washing procedures used at various stages of production. Foam-like MPs, on the other hand, can be produced by the degradation of certain plastic-based products, whereas plastic synthetic bags and packaging materials generate MPs with a film-like structure.
The foam was selected as a natural form of physical microplastics for inclusion in the study. This research used the foam characteristic and collected 1,000 photographs of foam at the selected locations.
4.1. Feature Extraction from Images
Because of their small size, deformities, and partial occlusion, identifying microplastics in images can be difficult. The Scale-Invariant Feature Transform (SIFT) algorithm was used to extract features from images to address this challenge. SIFT is a computer vision algorithm that can extract key features from images regardless of size or rotation. It accomplishes this by detecting key points that are invariant to scale and rotation and describing them with a set of noise and occlusion-resistant features. The resulting SIFT features can then be used to identify microplastics' distinct visual patterns and textures in images. These characteristics can then be used to train machine learning models, such as neural networks, to classify images that contain microplastics.
Following the extraction of features from the images, a dataset of key features was created in order to develop a model to detect microplastics. The features are: Keypoints, size, angle, and a set of 128 descriptors that capture the unique characteristics of the microplastics present in the images. The descriptors were generated by examining the local gradients of the pixels surrounding the key points and creating an orientation histogram to capture the dominant gradient direction. The descriptors were designed to be scale, rotation, and lighting condition insensitive, ensuring their robustness in identifying microplastics in images. Descriptors are groups of feature vectors that represent the key points in an image. These descriptors are calculated by analyzing the local gradients of the pixels surrounding the key point and creating an orientation histogram to capture the dominant gradient direction. The descriptor is then created by concatenating the histograms from multiple spatial bins around the key point. The resulting descriptor is a high-dimensional vector that captures the key visual characteristics of the local region surrounding the key point, such as texture, contrast, and shape. Figure 2 depicts the results of the microplastics detection process, with bounding circles indicating the location of the detected objects.
Figure 3.
Extracted features with bounding circles.
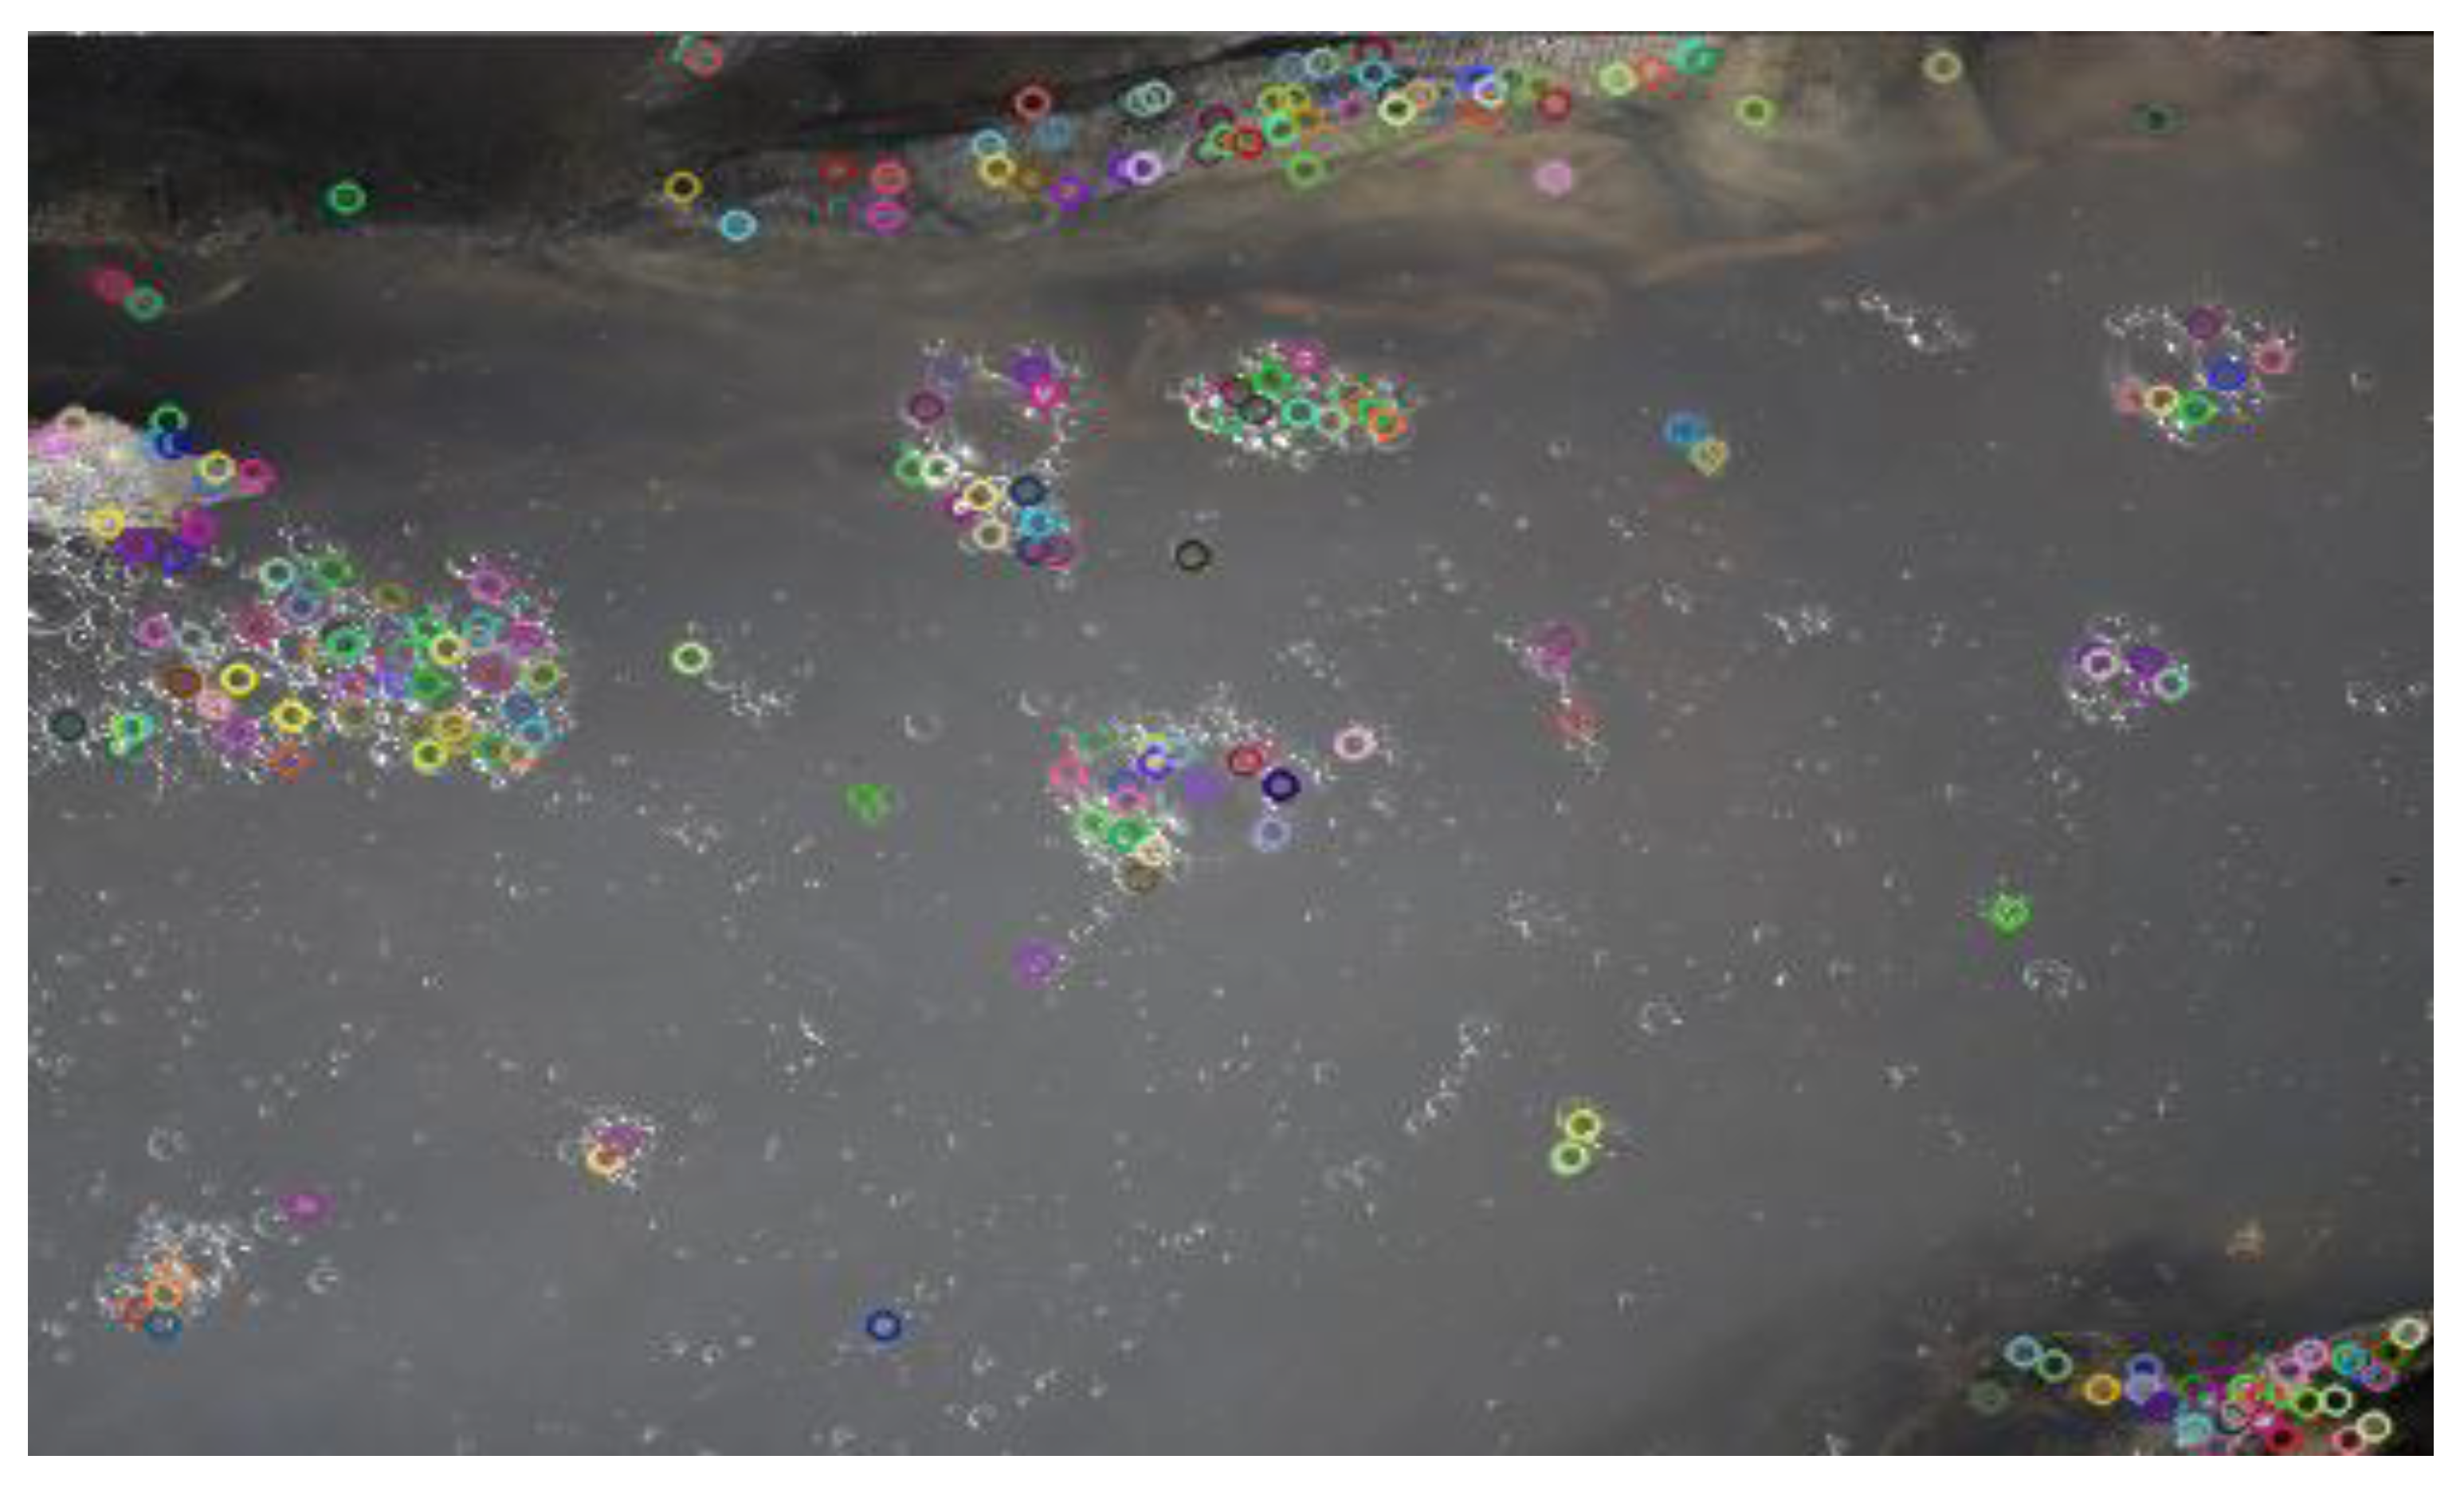
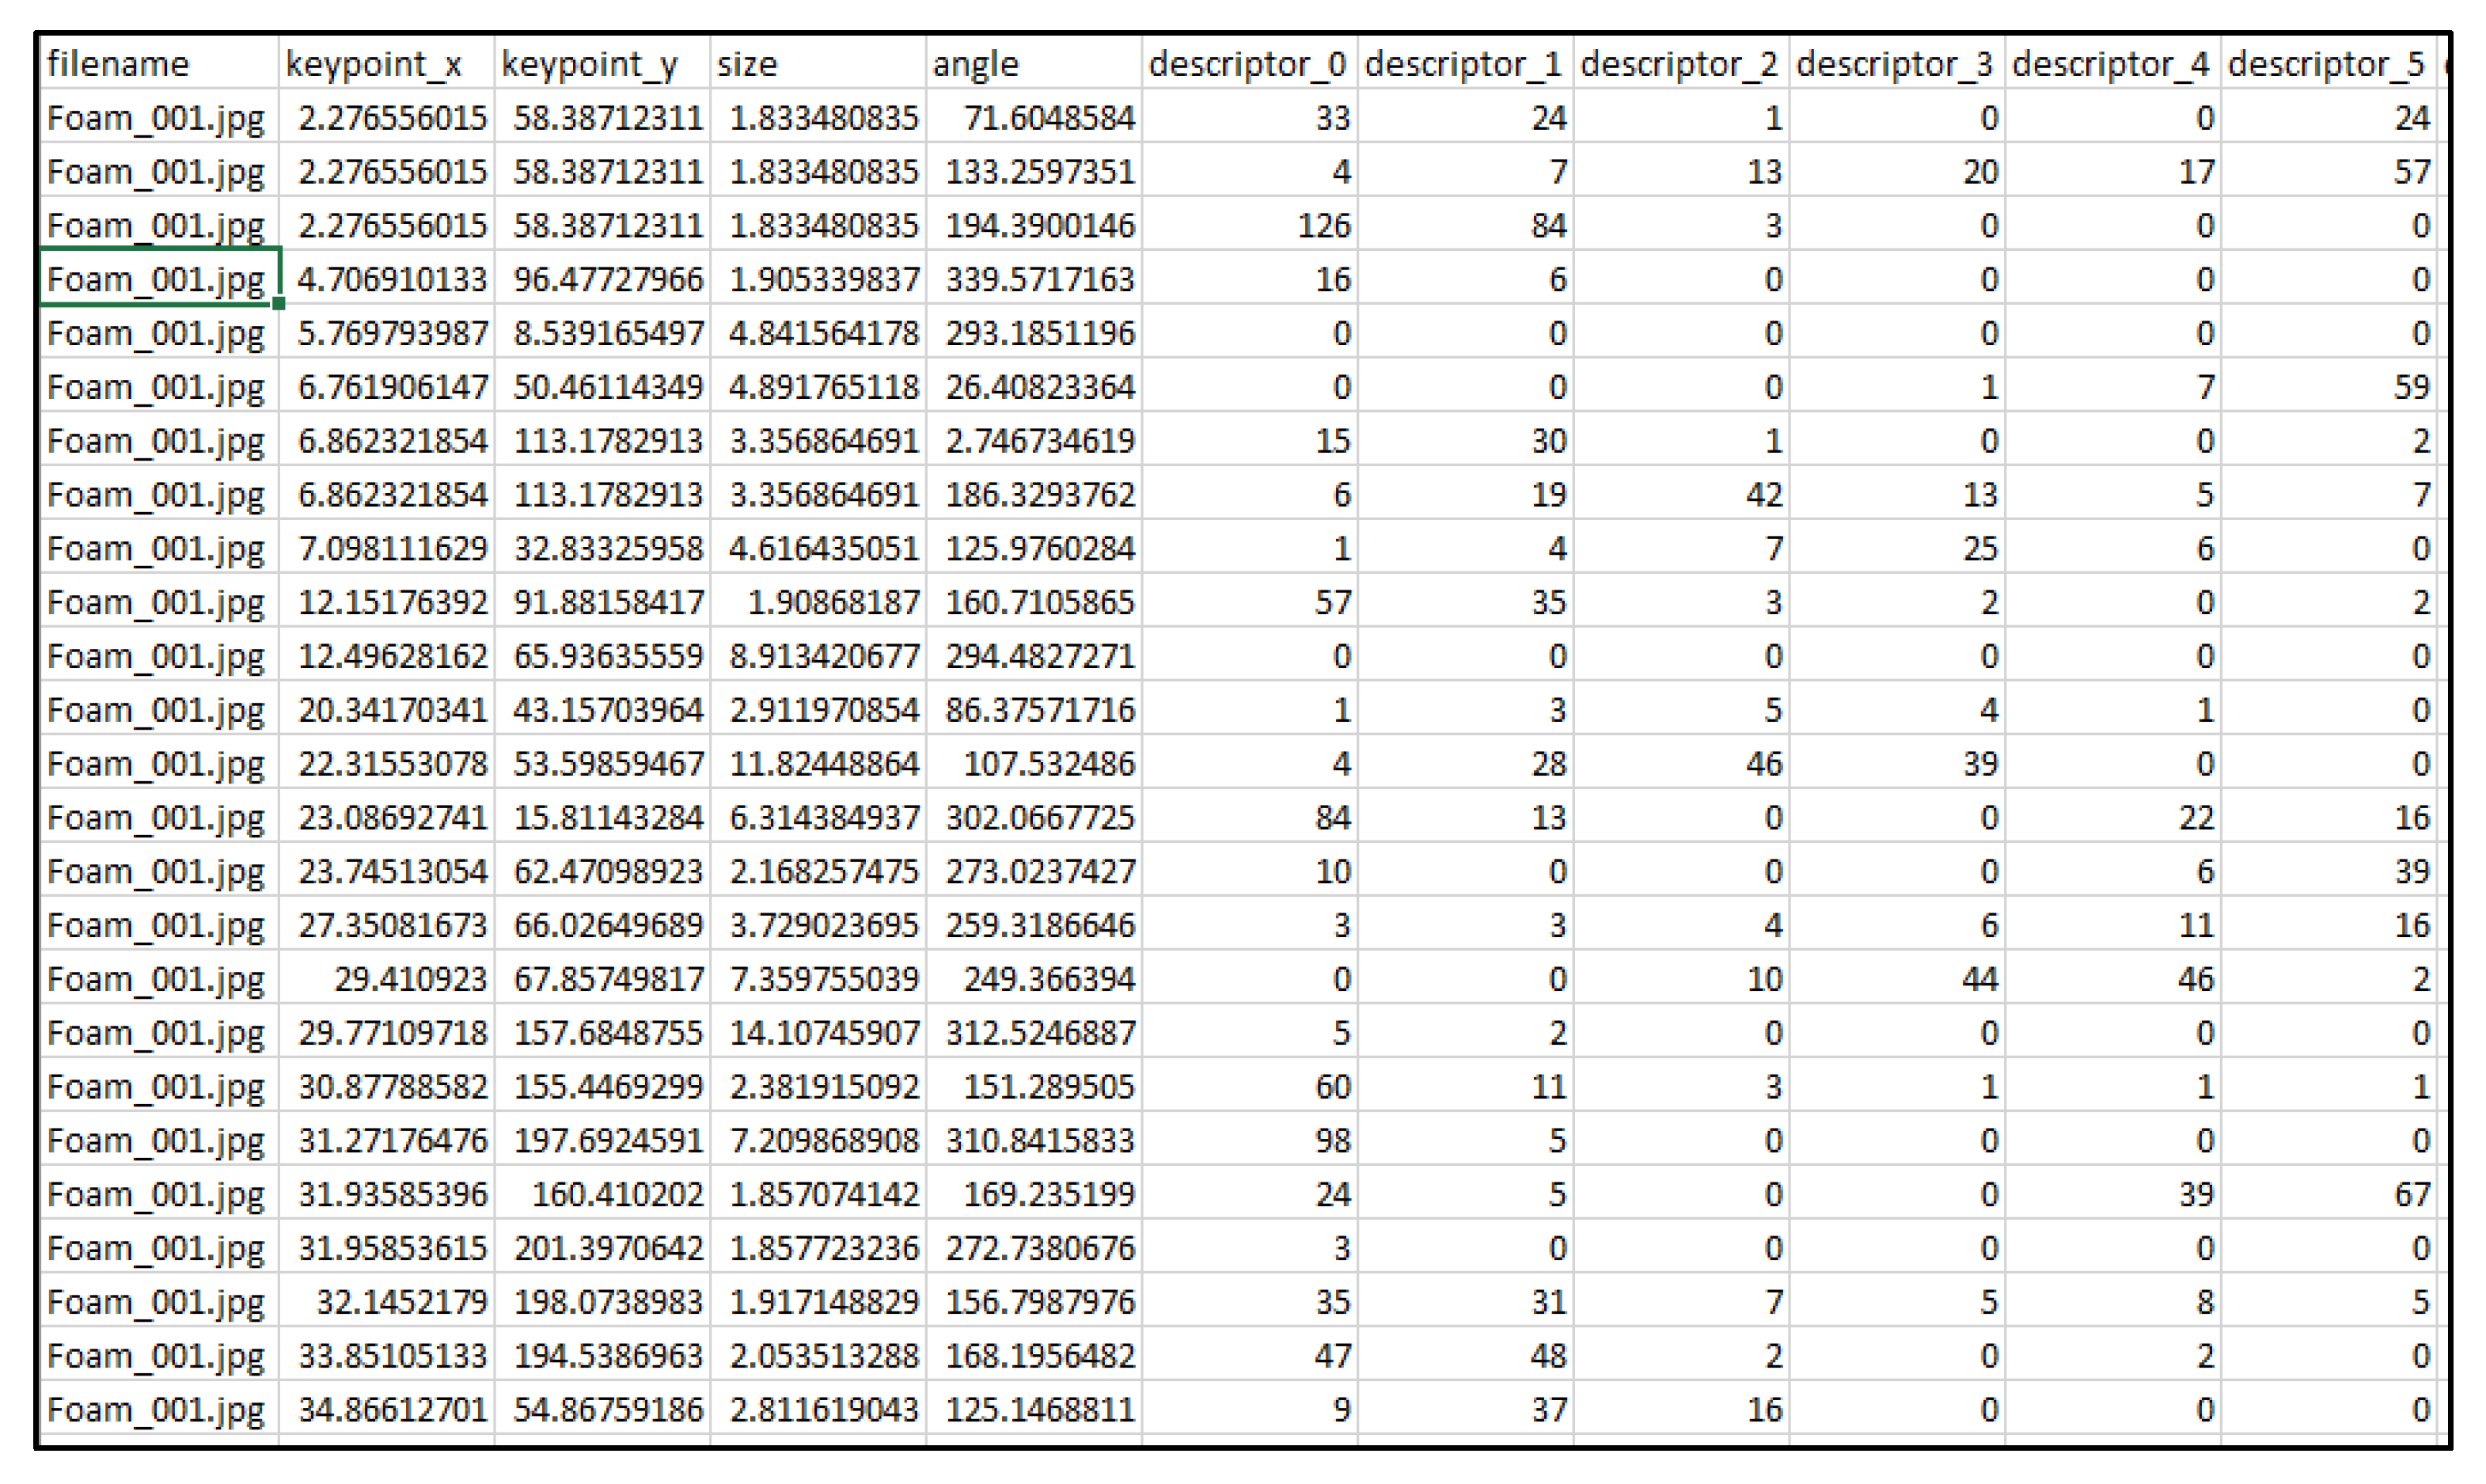
Figure 4 depicts a snapshot of the key features, such as keypoints x and y coordinates, size, angle, and 128 descriptors (descriptor 0 to descriptor 127). The feature dataset is stored in a CSV file for further analysis. The descriptors represent the images' unique visual patterns and textures, and they are critical for accurate identification and classification. The descriptors are built to be resistant to changes in scale, rotation, and lighting, ensuring their robustness in identifying microplastics in images.
The dataset was created by loading and preprocessing the input data for a machine learning model. The input images were read from a CSV file, resized to 224 x 224 pixels, and appended to a list of images. Each image's keypoints were extracted from the CSV file and added to a list of keypoints. After that, the images and keypoints were converted to NumPy arrays
5. Discussion
This study has shown that Deep learning techniques can be used to detect microplastics in images. SIFT algorithm has proved to have the capacity to extract features for detecting microplastics in open sewer images that can be used to create a dataset. The study identified the key characteristics of microplastics, such as size variation, colour, structure, and polymer composition, as well as their physical and chemical properties. Physical properties of microplastics was the main interest, which can be easily visualised in pictorial images and used to detect objects using Deep Learning techniques.
In this study, the Scale-Invariant Feature Transform (SIFT) algorithm was used to extract features from images for the purpose of identifying microplastics. The resulting SIFT features can be used to identify the unique visual patterns and textures of microplastics in images by detecting key points that are invariant to scale and rotation, and describing them with a set of noise and occlusion-resistant features. Descriptors are groups of feature vectors that represent key points in an image. The descriptors were created to be insensitive to scale, rotation, and lighting, ensuring the model's robustness in identifying microplastics in images. They are generated by analyzing the local gradients of the pixels surrounding the key point and creating an orientation histogram to capture the dominant gradient direction. A high-dimensional vector capturing the key visual characteristics of the local region surrounding the key point is created by concatenating the histograms from multiple spatial bins around the key point. Because of their resistance to changes in lighting, scale, and rotation, the descriptors are useful for image matching and object recognition tasks.
This method could be applied in environmental monitoring and pollution management, especially in cities with large populations, because it provides a reliable and automated method for identifying microplastics in aquatic environments. The SIFT algorithm for feature extraction combined with deep learning models has the potential to detect and monitor microplastics in the environment.
6. Conclusions and Recommendation
This paper presented a method for detecting microplastics in images taken from open sewers using deep learning techniques. The application of the SIFT algorithm for feature extraction was shown to be effective in capturing distinctive features of microplastics in the images.
Based on the findings of this study, the use of high-resolution cameras to capture photographic images of open sewers flowing into the ocean can be an effective method for detecting microplastics. This study emphasizes the significance of choosing appropriate sampling sites to ensure that the data collected is representative of the population of interest. To gain a more comprehensive understanding of the prevalence and distribution of microplastics in coastal areas, future research should consider a broader range of sampling locations.
The SIFT algorithm for feature extraction proved to be effective in capturing distinctive features of microplastics in the images. The proposed method can be used to extract features from images of microplastics in open sewer systems. The extracted features can be used to build a model for identifying microplastics in images. The model can be used to monitor the presence of microplastics in the environment and help in their control. Further research can be conducted to extract more features using different algorithms and build models for identifying microplastics in images.
References
- Bifano, L.; Meiler, V.; Peter, R.; Fischerauer, G. Detection of microplastics in water using electrical impedance spectroscopy and support vector machines. Sensors and Measuring Systems; 21th ITG/GMA-Symposium, 2022; pp. 1–4. [Google Scholar]
- Chen, G.; Wang, H.; Chen, K.; Li, Z.; Song, Z.; Liu, Y.; Chen, W.; Knoll, A. A Survey of the Four Pillars for Small Object Detection: Multiscale Representation, Contextual Information, Super-Resolution, and Region Proposal. IEEE Transactions on Systems, Man, and Cybernetics: Systems 2022, 52(2), 936–953. [Google Scholar] [CrossRef]
- Malterud K, S. V.; Guassora, AD. Sample Size in Qualitative Interview Studies: Guided by Information Power—Kirsti Malterud, Volkert Dirk Siersma, Ann Dorrit Guassora, 2016. Sample Size in Qualitative Interview Studies: Guided by Information Power; 2016; Available online: https://journals.sagepub.com/doi/full/10.1177/1049732315617444.
- Meiler, V.; Pfeiffer, J.; Bifano, L.; Kandlbinder-Paret, C.; Fischerauer, G. Approaches to Detect Microplastics in Water Using Electrical Impedance Measurements and Support Vector Machines. IEEE Sensors Journal 2023, 23(5), 4863–4872. [Google Scholar] [CrossRef]
- Mwatsahu, S. H.; Wanjau, R.; Tole, M.; Munga, D. Heavy metal contamination in water, sediments, and fauna of selected areas along the Kenyan coastline. Indo Pacific Journal of Ocean Life 2020, 4(1), Article 1. [Google Scholar] [CrossRef]
- Zhai, D. S.; Wang, S.; Dong, S. DF-SSD: An Improved SSD Object Detection Algorithm Based on DenseNet and Feature. DF-SSD: An Improved SSD Object Detection Algorithm Based on DenseNet and Feature Fusion. 2020. Available online: https://ieeexplore.ieee.org/abstract/document/8978787.
- Shim, W. J.; Hong, S. H.; Eo, S. E. Identification methods in microplastic analysis: A review. Analytical Methods 2017, 9(9), 1384–1391. [Google Scholar] [CrossRef]
- Shishkin, I. E.; Grekov, A. N. Implementation of YOLOv5 for Detection and Classification of Microplastics and Microorganisms in Marine Environment. In 2023 International Russian Smart Industry Conference (SmartIndustryCon); 2023; pp. 230–235. [Google Scholar] [CrossRef]
- Sundar, S. A Novel Low-Cost Approach For Detection, Classification, and Quantification of Microplastic Pollution in Freshwater Ecosystems using IoT devices and Instance Segmentation. In 2022 IEEE MIT Undergraduate Research Technology Conference (URTC); 2022; pp. 1–5. [Google Scholar] [CrossRef]
- Taherdoost, H. SSRN Scholarly Paper 3205035; Sampling Methods in Research Methodology; How to Choose a Sampling Technique for Research. 2016. [CrossRef]
- Tan, Y. The Management of Residential Solid Waste in Mombasa, Kenya. Independent Study Project (ISP) Collection. 2012. Available online: https://digitalcollections.sit.edu/isp_collection/1388.
- Valentino, M.; Béhal, J.; Bianco, V.; Itri, S.; Mossotti, R.; Fontana, G. D.; Stella, E.; Miccio, L.; Ferraro, P. Synthetic microfibers discriminated by AI-enabled polarization resolved Digital Holography. In 2022 IEEE International Workshop on Metrology for the Sea; Learning to Measure Sea Health Parameters (MetroSea); 2022; pp. 511–515. [Google Scholar] [CrossRef]
- Laskar, N.; Kumar, U. Plastics and microplastics: A threat to environment. Environmental Technology & Innovation 2019, 14, 100352. [Google Scholar] [CrossRef]
- Gola, D.; Kumar Tyagi, P.; Arya, A.; Chauhan, N.; Agarwal, M.; Singh, S. K.; Gola, S. The impact of microplastics on marine environment: A review. Environmental Nanotechnology, Monitoring & Management 2021, 16, 100552. [Google Scholar] [CrossRef]
- Trestrail, C.; Walpitagama, M.; Hedges, C.; Truskewycz, A.; Miranda, A.; Wlodkowic, D.; Shimeta, J.; Nugegoda, D. Foaming at the mouth: Ingestion of floral foam microplastics by aquatic animals. Science of The Total Environment, Volume 705 2020, 2020, 135826. [Google Scholar] [CrossRef] [PubMed]
- Zhou, Q.; Zhang, H.; Waniek, J.J.; Luo, Y. The Distribution and Characteristics of Microplastics in Coastal Beaches and Mangrove Wetlands. In Microplastics in Terrestrial Environments. The Handbook of Environmental Chemistry; He, D., Luo, Y., Eds.; Springer: Cham, 2020; vol 95. [Google Scholar] [CrossRef]
- Wang, X.; Xu, L.; Cui, X.; Zhu, H.; Zhang, M. Scale-invariant feature transform (sift) algorithm-based detection of cardiac insufficiency in sepsis patients with echocardiography. In Scientific Programming; 2022. [Google Scholar]
Figure 2.
Sample of Primary Data before processing in jpeg format.
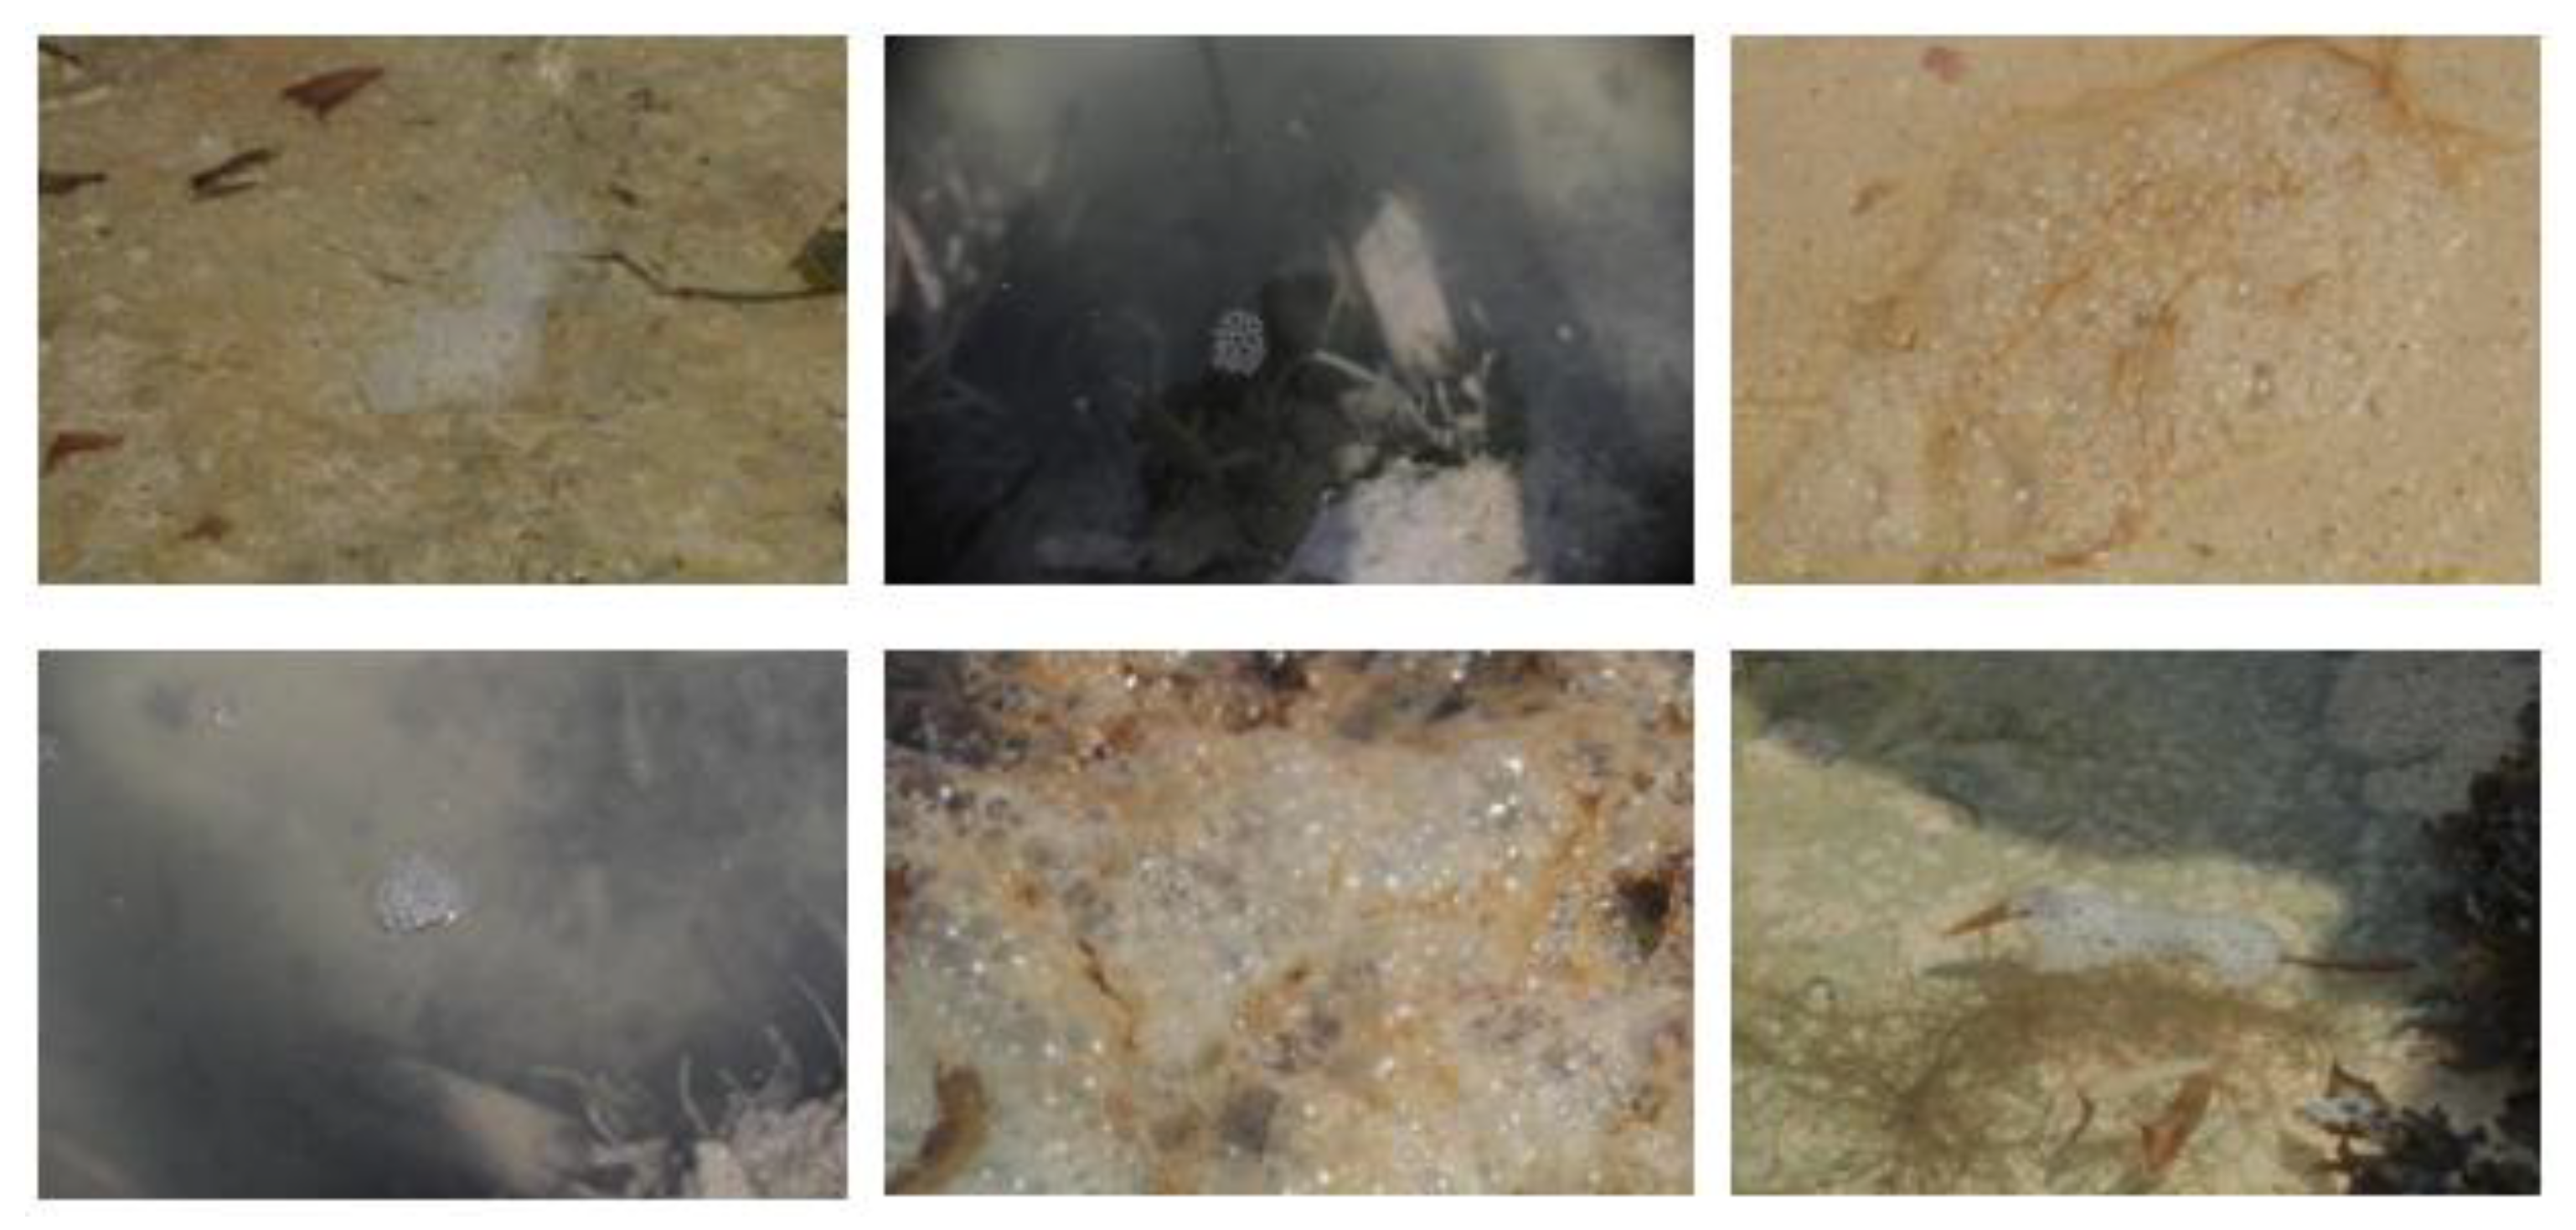
Figure 4.
Snapshot of extracted features in CSV format.
Disclaimer/Publisher’s Note: The statements, opinions and data contained in all publications are solely those of the individual author(s) and contributor(s) and not of MDPI and/or the editor(s). MDPI and/or the editor(s) disclaim responsibility for any injury to people or property resulting from any ideas, methods, instructions or products referred to in the content. |
© 2026 by the authors. Licensee MDPI, Basel, Switzerland. This article is an open access article distributed under the terms and conditions of the Creative Commons Attribution (CC BY) license (http://creativecommons.org/licenses/by/4.0/).
Copyright: This open access article is published under a Creative Commons CC BY 4.0 license, which permit the free download, distribution, and reuse, provided that the author and preprint are cited in any reuse.