
Submitted:
13 March 2026
Posted:
16 March 2026
You are already at the latest version
Abstract
Existing global indices of digital development – the Global Innovation Index (GII), the Network Readiness Index (NRI), and the ICT Development Index (IDI) – measure innovation potential, network readiness, and connectivity coverage, respectively, yet none captures the speed at which economies absorb and convert technologies into economic output. This paper introduces the Technology Metabolism Index (TMI), a parsimonious composite indicator comprising seven openly available sub-indicators from World Bank WDI and UN DESA, structured into three components: Readiness (R), Absorption (A), and Output (O). Grounded in cybernetic feedback-loop theory (Ashby, Beer, Forrester), TMI measures the velocity of technological signal propagation through the R→A→O cycle. A pilot calculation for 10 economies – spanning leaders (Korea, Singapore, Estonia), major economies (USA, EU-5, Japan, China), and developing economies (Uzbekistan, Brazil, Nigeria) – reveals three diagnostic metabolic patterns: "metabolic gap" (Uzbekistan: R >> A >> O ≈ 0), "balanced weakness" (Brazil: R ≈ A > O), and "systemic deficit" (Nigeria: R ≈ A ≈ O ≈ 0). Robustness analysis based on weight differentiation across three scenarios confirms rank stability for all 10 economies without exception. An open-source software implementation (TME_INDEX_CALCULATOR, registered certificate DGU 61047) and a four-sheet Excel model ensure full reproducibility. The TMI fills an unoccupied measurement niche in the global digital monitoring ecosystem and offers policymakers a diagnostic tool with arithmetically verifiable targets for accelerating technology metabolism.
Keywords:
technology metabolism
; composite indicator
; digital transformation
; cybernetics
; feedback loop
; readiness–absorption–output
; min-max normalization
; sensitivity analysis
; developing economies
; Uzbekistan
1. Introduction
The digital economy has fundamentally altered the logic of value creation. Classical economic assumptions – finite resources, diminishing returns, and equilibrium tendencies – are systematically violated by digital phenomena. Arthur emphasized the role of increasing returns to adoption, especially dynamic increasing returns that develop over time, which arise on the supply side of a market as a result of learning effects that lower the cost or improve the quality of a product as its cumulative production increases (Arthur, 1994). In the digital context, these mechanisms are dramatically amplified: data exhibit zero marginal cost of reproduction, platforms demonstrate increasing returns to scale, and network effects generate self-reinforcing cycles. Artificial intelligence accelerates this transformation by an order of magnitude: the EU AI Act was initially proposed in 2021, but the legislative process faced notable disruption when OpenAI's ChatGPT was launched on 30 November 2022, requiring changes to the draft text to create specific regulations for generative AI (Dushi, 2024) – a regulatory lag exceeding three years that illustrates a structural mismatch between the pace of technology and the pace of institutions (Gulyamov et al., 2026).
Measurement instruments have similarly struggled to keep pace. In the GII 2024, 133 economies had sufficient data to be included, while a total of 117 economies did not make it due to a lack of available data, with the minimum data coverage requirement of at least 35 indicators in the Innovation Input Sub-Index and 16 in the Output Sub-Index (WIPO, 2024). The Network Readiness Index 2024 is an in-depth analysis of 133 countries' performance across four dimensions of digital readiness – technology, people, governance, and impact – using 54 indicators (Dutta & Lanvin, 2024). The ICT Development Index 2024 covers 165 economies, with the global average score of 74.8 indicating progress towards universal connectivity, although many economies remain in early stages with scores as low as 21.3 (ITU, 2024). Each instrument captures a vital dimension of digital development; however, none measures the speed at which technologies propagate through the full cycle from infrastructure readiness, through absorption, to economic output.
The present paper addresses this gap by introducing the Technology Metabolism Index (TMI) – a parsimonious composite indicator comprising seven openly available sub-indicators from World Bank WDI and UN DESA. The concept of "technology metabolism" (authors' term) operates through a biological metaphor: competitiveness is determined not by the volume of available technologies, but by the speed of their absorption and conversion into economic output – just as the health of an organism depends not on the size of a meal, but on its metabolic processing rate.
The research objectives are: (1) to theoretically ground the three-component R→A→O structure through cybernetic theory; (2) to calculate TMI on a 10-country pilot sample; (3) to confirm robustness through weight-differentiation analysis; (4) to present an open-source software implementation and an Excel model ensuring full reproducibility.
The contributions include: (a) a novel measurement object – the speed of technology metabolism, unaddressed by GII, NRI, or IDI; (b) minimal statistical burden (7 versus 54–78 sub-indicators); (c) complete reproducibility; (d) a registered software product (TME_INDEX_CALCULATOR, certificate DGU 61047, Ministry of Justice of the Republic of Uzbekistan, 8 March 2026).
2. Theoretical Foundations
2.1. The Paradigmatic Shift: From Resource Economics to Digital Economics
Classical economic theory was built on premises of resource finitude, diminishing returns, and equilibrium. The digital economy systematically violates all three. Arthur's pioneering work brought together a comprehensive presentation of an economics that incorporates increasing returns – ideas that, after a decade of resistance from economists, are now being widely discussed and adopted (Arthur, 1994). In the digital context, data do not deplete with use and carry zero marginal copying cost; each additional platform user increases the value for all others; and algorithmic optimization creates a self-reinforcing loop – more data leads to a better algorithm, attracting more users, generating yet more data. The neoclassical apparatus, built on convergence to equilibrium, has no native framework for these dynamics.
The "new economies" that have emerged each represent a specific feedback-loop configuration with a specific pathology. In the attention economy, the information channel is distorted: content is optimized for advertising revenue rather than value, creating an amplification loop rewarding engagement over accuracy. In the care economy, labor exists but the remuneration loop is disconnected: essential work is performed without proportional economic feedback. In the gig economy, the loop is asymmetric: platforms accumulate data and profit while workers receive subsistence-level income. In the creative economy, value is created through immaterial labor poorly captured by traditional accounting. Zuboff's The Age of Surveillance Capitalism examines how powerful corporations predict and control human behavior, identifying four key features: the drive toward more data extraction, new contractual forms using computer monitoring, personalization of services, and continuous experiments on users (Zuboff, 2019). In cybernetic terms, surveillance capitalism represents the capture of the feedback loop itself by a single agent – the information channel is not merely distorted but systematically appropriated for extraction.
2.2. The Ad Hoc Trap: Why Paradigmatic Extensions Fail
Each of the four dominant economic paradigms attempts to explain digital phenomena through ad hoc extensions that undermine the theory's internal coherence. Neoclassical economics incorporates network effects but loses equilibrium – a convergence-based theory cannot accommodate self-reinforcing divergence. Institutionalism adds algorithms, but these operate faster than any institutional process can adapt. Behavioral economics describes individual-level biases but cannot explain platform-scale systemic effects arising from architectural design. Keynesian economics operates with aggregate demand, but algorithmic coordination bypasses the price mechanism entirely.
The problem is not the weakness of any individual theory – each functions within its own domain. The problem is the absence of a connecting language. Neoclassical theory sees prices; institutionalism sees rules; behavioral economics sees cognitive distortions; Keynesian theory sees aggregate demand. All are partially right but cannot communicate with each other. We term this condition a "paradigmatic vacuum" (authors' term) – not a Kuhnian crisis but a deficit of an integrating meta-language.
A historical retrospective reveals a striking pattern: each major economist implicitly described one type of feedback. Smith described negative feedback (price stabilizes the market). Hayek's article "The Use of Knowledge in Society," published in the September 1945 issue of The American Economic Review, is considered one of the most important in modern economics, arguing that a decentralized economy complements the dispersed nature of information that exists among individuals in society (Hayek, 1945). Hayek proposed that the price system serves as an information processor ensuring decentralized coordination, since no person ever has all the available knowledge when making an economic choice – knowledge is dispersed among all people (Hayek, 1945). Keynes described positive feedback (the multiplier accelerates). Kahneman and Tversky (Kahneman & Tversky, 1979) described systematic distortion of the information channel through cognitive biases. Zuboff characterized surveillance capitalism as a novel market form based on the commodification of reality and its transformation into behavioral data for analysis and sales (Zuboff, 2019) – describing the capture of the feedback loop by corporations. None of these thinkers saw the system as a whole. Cybernetics offers precisely this integrating language.
2.3. The Cybernetic Framework: Ashby's Law and Technology Metabolism
Ashby's Law of Requisite Variety states that the regulator's capacity as a regulator cannot exceed its capacity as a channel of communication – only variety can absorb variety (Ashby, 1956). The law posits that when the variety or complexity of the environment exceeds the capacity of a system, natural or artificial, the environment will dominate and ultimately destroy that system (Ashby, 1956). Formally:
where V(C) is the variety of the controller (regulator) and V(D) is the variety of disturbances. Applied to digital transformation, this law has a direct operational interpretation: technologies generate variety exponentially; institutions adapt linearly. The Ashby condition is therefore systematically violated – regulation always lags behind technology not due to any individual's failure, but as a mathematical regularity.
The Viable System Model was developed by operations research theorist and cybernetician Stafford Beer in his book Brain of the Firm (1972), which together with his earlier works effectively founded management cybernetics. A viable system is composed of five interacting subsystems mapped onto aspects of organizational structure (Beer, 1972). Beer's foundational texts Brain of the Firm (1972) and The Heart of Enterprise (1979) ensure that the model's five subsystems – operational elements, coordination, control, intelligence, and policy – replicate across organizational levels through recursive embedding, addressing complexity through requisite variety management at every scale (Beer, 1972). Forrester's system dynamics (1961, 1971) (Forrester, 1961) demonstrated that delays in feedback loops generate cyclical dynamics not explicable by equilibrium models – a finding directly applicable to the temporal mismatch between technological diffusion and institutional response.
The OECD/JRC Handbook on Constructing Composite Indicators (2008) is a guide for constructing and using composite indicators for policymakers, academics, the media and other interested parties, covering those which compare and rank country performance in areas such as industrial competitiveness, sustainable development, globalization and innovation (OECD/European Commission, 2008). The Handbook establishes that indicators should be normalised to render them comparable, with attention paid to extreme values, and that robustness and sensitivity analysis should be undertaken to assess the composite indicator in terms of the normalisation scheme, imputation of missing data, and choice of weights (OECD/European Commission, 2008). This standard provides the methodological foundation followed throughout the present paper.
The concept of "technology metabolism of the economy" (TME, authors' term) synthesizes the cybernetic approaches of Ashby, Beer, and Forrester: competitiveness is determined not by the volume of technologies or resources, but by the speed and structure of feedback loops in the economic circuit. The authors' five-node closed-loop model (Technology → Institution → Market → Society → Policy → Technology) serves as the theoretical source of the three-component index structure. Component R (Readiness) aggregates the state of infrastructural and institutional nodes; A (Absorption) captures the economy's capacity to "digest" technologies through R&D and broadband connectivity; O (Output) represents the conversion of absorbed technologies into observable economic output through export flows. The TMI formula is:
where the elevated weight of absorption (, while = 0.3 and = 0.3 in the baseline scenario S1) reflects the authors' hypothesis that the A-component is the cybernetic "bottleneck" determining the ultimate speed of metabolism. This hypothesis is grounded in the empirical observation that Korea has the highest share of tertiary graduates among OECD countries, many in STEM disciplines, which enables employers to integrate emerging technologies quickly, while financial inputs for innovation, as measured by gross domestic expenditure on R&D, rank second worldwide with 4.93% of GDP in 2021 (OECD, 2023). Korea's business-financed GERD reached 3.977% of GDP in 2022, a historical maximum, with data reported by the OECD (CEIC Data, 2023). It is precisely this absorption capacity, not mere infrastructure readiness, that differentiates global technology leaders.
2.4. Measuring Digital Transformation: Existing Indices and the Unoccupied Niche
A systematic comparison of TMI with the three leading global indices reveals that TMI does not compete with existing instruments but occupies an unoccupied measurement niche (Table 1).
The Global Innovation Index 2024 captures the innovation ecosystem performance of 133 economies and tracks the most recent global innovation trends (WIPO, 2024). It comprises 78 indicators across two sub-indices and seven pillars. A total of 117 economies were excluded due to insufficient data (WIPO, 2024).
The NRI 2024 maps the network readiness landscape of 133 economies across four pillars: Technology, People, Governance, and Impact, with each pillar comprised of three sub-pillars and 54 variables. The United States leads for the third consecutive year, with Singapore second and Finland third (Dutta & Lanvin, 2024).
The revised IDI methodology was approved by Member States in November 2023, is valid for four years, and covers 165 economies (ITU, 2024).
Table 1 establishes that TMI, with the smallest number of sub-indicators, occupies a unique position by theoretical specificity of its measurement object: the speed of technological signal propagation through a closed loop is not captured by GII, NRI, or IDI, which substantively justifies the additive value of the proposed instrument for the global digital monitoring ecosystem. Moreover, the minimal data requirement (7 sub-indicators available in World Bank WDI) eliminates the principal barrier that excludes developing economies from more data-demanding indices.
3. Methodology
3.1. Research Design
The study employs a combination of four methods. First, comparative analysis of existing global digital transformation indices (GII, NRI, IDI) was conducted to identify the measurement gap – the absence of an instrument measuring technology absorption speed. Second, inductive analysis of cybernetic feedback-loop theory (Ashby (Ashby, 1956), Beer (Beer, 1972), Forrester (Forrester, 1961)) was performed to formulate the theoretical framework for the three-component R→A→O structure, where R captures the system's capacity to receive a technological signal, A captures the speed of its internal processing, and O captures the observable economic output. Third, synthesis of empirical data from World Bank WDI and UN DESA was carried out to operationalize the index with openly available, annually updated sub-indicators. Fourth, robustness analysis based on weight differentiation across three scenarios was applied to confirm rank stability – following the OECD/JRC Handbook recommendation that indicators should be normalised to render them comparable, aggregated and weighted according to the underlying theoretical framework, with robustness and sensitivity analysis undertaken to assess the composite indicator in terms of the normalisation scheme, the choice of weights, and the aggregation method (OECD/European Commission, 2008).
3.2. Sub-Indicator Selection and Data Sources
Seven sub-indicators were selected based on three criteria: (i) theoretical correspondence to the R, A, or O component as derived from the cybernetic feedback-loop model; (ii) availability in open databases (World Bank WDI, UN DESA) for at least 130 economies, ensuring scalability beyond the pilot; (iii) annual update frequency, enabling longitudinal tracking of metabolic dynamics.

Table 2.
TMI sub-indicators: codes, sources, and component assignment
| Component | Sub-indicator | WDI Code / Source | Rationale |
| R – Readiness | E-Government Development Index | UN DESA EGDI 2024 | E-government readiness as institutional signal transmission capacity |
| R – Readiness | Internet users, % of population | IT.NET.USER.ZS | Digital coverage breadth across the population |
| R – Readiness | WGI Government Effectiveness | World Bank WGI | Institutional quality ensuring minimal signal loss during transmission |
| A – Absorption | R&D expenditure, % of GDP | GB.XPD.RSDV.GD.ZS | Investment intensity in technology digestion capacity |
| A – Absorption | Fixed broadband per 100 inhabitants | IT.NET.BBND.P2 | Infrastructural throughput bandwidth for technology absorption |
| O – Output | High-tech exports, % of manufactured exports | TX.VAL.TECH.MF.ZS | Technological output measured through export flows |
| O – Output | ICT goods exports, % of total goods exports | TX.VAL.ICTG.ZS.UN | ICT-specific export output as a direct signal of market-node performance |
The rationale for equal weighting within each component (1/3 for each R sub-indicator, 1/2 for each A and O sub-indicator) follows the OECD/JRC principle that equal weighting ensures each conceptual pillar is treated with equivalent importance, avoiding pre-imposed assumptions about which domain is more influential (OECD/European Commission, 2008) – particularly appropriate at the pilot stage when empirical calibration is not yet feasible.
3.3. Sample Formation
Ten countries were selected based on three criteria: (1) coverage of digital development models – from absorption-led (Korea) through transit-amplifier (Singapore) to catching-up (Uzbekistan), encompassing all four cybernetic configurations identified in the authors' monograph; (2) complete data across all 7 sub-indicators for the base year 2021–2022, with no imputation of missing values, following the GII's transparency principle; (3) range spanning from leaders to developing economies for meaningful cross-country comparison. Three groups were formed: leaders (Korea, Singapore, Estonia), major economies (USA, EU-5, Japan, China), and developing economies (Uzbekistan, Brazil, Nigeria). The EU-5 aggregate represents the average of Germany, France, Italy, Spain, and the Netherlands across all sub-indicators.
3.4. Normalization, Aggregation, and Robustness Procedures
Min-max normalization was applied to transform each sub-indicator to the [0; 1] range across the 10-country sample, with 0 assigned to the worst and 1 to the best performer. Sub-indicators were aggregated into components using arithmetic means, and TMI was calculated as a weighted sum under three weighting scenarios. The limitation of sample-based min-max normalization is acknowledged: upon expansion to 30+ countries, transition to fixed goalposts following the UNDP HDI methodology, where goalposts act as 'natural zeros' and 'aspirational goals' from which component indicators are standardized (UNDP, 2024), constitutes a first-priority step. Three weighting scenarios – Baseline (0.3/0.4/0.3), Equal (0.33/0.33/0.33), and Absorption-dominant (0.2/0.5/0.3) – were applied as the robustness test, with the baseline reflecting the theoretical hypothesis that absorption is the cybernetic bottleneck.
3.5. Implementation Tools
The software product TME_INDEX_CALCULATOR v1.0 is implemented in Python with a two-module architecture: a computational core (tme_index_calculator.py) performing all mathematical operations, and a graphical interface (tme_gui.py based on tkinter) offering six visualization types: 3-axis radar (R/A/O profiles), 7-axis radar (all sub-indicators), bar chart (TMI ranking), heatmap (component matrix), bubble chart (R vs A with O as bubble size), and line chart with three-scenario sensitivity comparison. The application supports interactive addition and editing of country data, CSV export, and instant recalculation upon parameter change. It is registered under certificate DGU 61047, Ministry of Justice of the Republic of Uzbekistan, 8 March 2026. Source code is provided as Supplementary Material.
A parallel implementation in Microsoft Excel follows a four-sheet architecture: Sheet 1 "Data" (raw values of 7 sub-indicators by N countries) → Sheet 2 "Normalization" (min-max formula in each cell) → Sheet 3 "Aggregation" (component means and TMI via SUMPRODUCT function, where weight cells are fixed with absolute references) → Sheet 4 "Sensitivity" (three columns with three weight sets, replicating the robustness analysis). This ensures a zero-entry barrier: any government analyst or researcher can reproduce the entire pilot calculation – or compute TMI for their own country – using only a standard spreadsheet application, without specialized statistical software (R, Stata, MATLAB). This principle of "zero-barrier reproducibility" is central to the instrument's design philosophy, as TMI is intended for use by developing economies where access to advanced statistical tools may be limited.
4. Results
4.1. Raw Data: 10-Country Matrix and Structural Gaps
Table 3 presents the raw (non-normalized) values of all 7 sub-indicators for 10 countries for the base year 2021–2022. Each value is accompanied by the primary source and observation year. The version 2 change log is embedded directly in the table: WGI Government Effectiveness for the USA was corrected from 1.47 to 1.30 based on direct verification in the World Bank DataBank API; the O-component indicator was substituted from ICT value added (NV.SRV.TETC.ZS) to ICT goods exports (TX.VAL.ICTG.ZS.UN), as the former captured all services within GDP rather than technology-specific export output.
Two structure-defining gaps emerge from the raw data. The R&D expenditure gap between Korea (4.91% of GDP) and Uzbekistan (0.13% of GDP) is 37-fold. Korea has the highest share of tertiary graduates among OECD countries, many in STEM disciplines, enabling employers to integrate emerging technologies quickly, while gross domestic expenditure on R&D ranks second worldwide at 4.93% of GDP (OECD, 2023). In contrast, Uzbekistan's R&D expenditure plummeted by 21% from 0.2% in 2022 to 0.1% in 2023 (Knoema, 2024) – indicating a structural, not situational, deficit of the absorption loop. The ICT goods export gap between Singapore (32.68%) and Nigeria (0.09%) is 363-fold. Singapore's high-technology exports were reported at 56.14% of manufactured exports in 2023 according to the World Bank collection of development indicators (Trading Economics, 2024), confirming the stability of its output leadership beyond the base year of the pilot calculation. These polar values define the normalization boundaries and determine the scale of inter-component gaps in the normalized space.
Intermediate observations reveal asymmetries invisible in aggregate rankings: Estonia leads on EGDI (0.9727) despite modest R&D (1.77%), indicating that e-government infrastructure does not automatically translate into absorption capacity. The USA demonstrates high R&D (3.49%) with moderate ICT goods exports (7.85%) – the bulk of technological output is consumed domestically rather than exported, which reduces the O-component in an export-oriented index. China's ICT goods exports (22.64%) position it third in the sample after Singapore and Korea, reflecting its role as a global ICT manufacturing hub – a positioning that would have been severely understated had the prior ICT value added indicator been retained.
4.2. Normalization Results: From Raw Data to Comparable Sub-Indicators
The normalization procedure transforms the raw data matrix into a comparable [0; 1] space. For each sub-indicator, the min-max formula is applied:
where is the raw value of sub-indicator k for country c, and minimum and maximum are computed across the full 10-country sample, assigning 0 to the worst and 1 to the best performer. Table 4 presents the resulting normalized values.
The normalization reveals structural asymmetries invisible in raw data – precisely the diagnostic function that distinguishes TMI from aggregate indices.
For the R-component (Readiness): Estonia leads on EGDI_n (1.000) – the highest e-government development in the sample – but yields to Korea on RD_n (0.343 vs 1.000), demonstrating that digital government readiness does not guarantee technology absorption capacity. Singapore achieves the maximum WGI_n (1.000), reflecting its WGI Government Effectiveness score of 2.23 – the highest among all 10 countries, indicating institutional quality that ensures minimal signal loss during technological signal transmission through the system. Uzbekistan occupies a surprisingly median position on Internet_n (0.777), above Brazil (0.720) and China (0.638), which sharply contrasts with its position near the bottom of the final TMI ranking. This contrast is itself diagnostic: it reveals that internet penetration – a readiness indicator – is a necessary but not sufficient condition for technology metabolism.
For the A-component (Absorption): Korea is the sole dual leader in the sample, achieving maximum values on both absorption sub-indicators simultaneously (RD_n = 1.000 and BB_n = 1.000). No other economy achieves this configuration. Korea's business-financed GERD reached a historical maximum of 3.977% of GDP in 2022, with data reported by the OECD (CEIC Data, 2023). Uzbekistan records RD_n = 0.000 – the absolute sample minimum, corresponding to 0.13% of GDP – alongside BB_n = 0.567, representing 25.8 fixed broadband subscriptions per 100 inhabitants. The juxtaposition is revealing: moderate broadband infrastructure (above Nigeria's 0.000 and close to Singapore's 0.606) cannot compensate for zero R&D investment. The A-component is determined by the weaker link, and the weaker link for Uzbekistan is unambiguously R&D. Nigeria occupies the opposite extreme: BB_n = 0.000, corresponding to 0.043 broadband subscriptions per 100 people – 600 times less than Uzbekistan's level, indicating that even the baseline infrastructure for digital absorption is absent.
For the O-component (Output): Singapore is the dual leader (Hitech_n = 1.000 and ICTgoods_n = 1.000), corresponding to 54.97% high-technology exports and 32.68% ICT goods exports – figures that dwarf the sample median. The global average for high-technology exports as a percentage of manufactured exports in 2022 was 11.24%, based on 152 countries (TheGlobalEconomy.com, 2024). Against this benchmark, Singapore's 54.97% represents nearly five times the world average, confirming its unique position as a "transit amplifier" in the global production network. Uzbekistan records Hitech_n = 0.000 and ICTgoods_n = 0.014 – virtually zero normalized output, meaning that the technological signal entering through the readiness and (partial) absorption nodes fails to exit the system as measurable economic output. The circuit is "open" at the A→O junction. Importantly, the USA – despite high R&D investment (RD_n = 0.703) – shows moderate normalized output (ICTgoods_n = 0.238), a pattern explained by the dominance of domestic consumption over export in the American economy. This finding illustrates an inherent limitation of export-based output indicators, which systematically understate the technological output of large economies with deep internal markets.
4.3. Component Aggregation: R, A, O Profiles and TMI Ranking
The normalized sub-indicators are aggregated into three components using arithmetic means:
The TMI is then calculated as the weighted sum:
Under the baseline scenario (, Table 5 presents the full component scores and TMI ranking.
Korea (TMI = 0.896, rank 1) – the "absorption champion." The component profile is exceptionally strong across all dimensions: A = 1.000 (the absolute sample maximum), R = 0.905, O = 0.750. The cybernetic interpretation is that Korea has constructed a self-reinforcing positive absorption loop.
Singapore (TMI = 0.803, rank 2) – the "transit amplifier." The defining feature is the maximum output O = 1.000 combined with moderate absorption A = 0.515 and near-maximum readiness R = 0.991. Singapore's R&D expenditure per capita was $2,620 in PPP terms in 2022 – higher than most OECD countries but below Korea (SSTI, 2024). The economy functions as a regional integration point in global production-technology chains: it accumulates the technological "output" of transnational networks without the need to generate it through intensive domestic R&D. The WGI Government Effectiveness of 2.23 – the highest in the entire 10-country sample – creates an institutional environment where the technological signal passes through with minimal friction. This "transit amplifier" configuration is fundamentally unavailable to large closed economies, as it requires a specific combination of institutional quality, geographic position, and trade openness that cannot be replicated by scale alone.
China (TMI = 0.650, rank 3) – the global ICT producer, correctly diagnosed only after the indicator correction. ICT goods exports of 22.64% provide O = 0.620 – the third result after Singapore and Korea. Had the original ICT value added indicator been retained, China's O-component would have been inflated by the inclusion of all services in GDP, masking the country's specific strength in hardware manufacturing and ICT goods production. The absorption component A = 0.696 reflects broadband infrastructure (BB_n = 0.910) complemented by substantial, though not world-leading, R&D investment (RD_n = 0.481, corresponding to 2.43% of GDP). China's share of global R&D spending grew from 4% to 26% between 2000 and 2023, making it the second-highest investor globally in absolute terms (Visual Capitalist, 2025).
USA (TMI = 0.646, rank 4) – high readiness R = 0.838 and strong absorption A = 0.764, but relatively low normalized output O = 0.298. The U.S. ratio of GERD to GDP sits at 3.45%, with the highest level of R&D expenditure in absolute terms in the world, amounting to $823.4 billion (SSTI, 2024). The moderate O-component reflects the fact that American technological output is primarily absorbed by the vast domestic market rather than exported – a structural characteristic, not a weakness. Japan (TMI = 0.636, rank 5) – a similar "high readiness" profile with R = 0.854, A = 0.735, and O = 0.286, reflecting a mature economy with deep domestic technological consumption. Estonia (TMI = 0.596, rank 6) – the "readiness leader" (R = 0.879, including the highest EGDI in the sample), demonstrating that a small economy can achieve world-class digital government infrastructure while maintaining moderate absorption and output. EU-5 (TMI = 0.579, rank 7) – the "balanced profile" without pronounced peaks or troughs, with R = 0.823, A = 0.679, O = 0.203 – the aggregate of five diverse economies averaging out individual extremes.
A distinct gap separates the first seven economies (TMI 0.55–0.90) from the bottom three (TMI < 0.35), corresponding to the boundary between the "developed" and "catching-up" metabolic clusters. This gap is not an artifact of the weighting scheme – as shown in the following subsection, it persists under all three scenarios.
4.4. Robustness Analysis Based on Weight Differentiation
The robustness analysis tests whether the TMI ranking is an artifact of the specific weighting choice or a reflection of genuine structural differences. Three scenarios are applied: Baseline (0.3/0.4/0.3), Equal (0.33/0.33/0.33), and Absorption-dominant (0.2/0.5/0.3).
Table 6.
Robustness analysis (three weighting scenarios).
| Country | Rank S1 | TMI S1 (0.3/0.4/0.3) | Rank S2 | TMI S2 (0.33×3) | Rank S3 | TMI S3 (0.2/0.5/0.3) | Stability |
| Korea | 1 | 0,896 | 1 | 0,884 | 1 | 0,906 | ✓Stable |
| Singapore | 2 | 0,803 | 2 | 0,834 | 2 | 0,756 | ✓Stable |
| China | 3 | 0,650 | 3 | 0,644 | 3 | 0,658 | ✓Stable |
| USA | 4 | 0,646 | 4 | 0,633 | 4 | 0,639 | ✓Stable |
| Japan | 5 | 0,636 | 5 | 0,624 | 5 | 0,624 | ✓Stable |
| Estonia | 6 | 0,596 | 6 | 0,594 | 6 | 0,569 | ✓Stable |
| EU-5 | 7 | 0,579 | 7 | 0,568 | 7 | 0,565 | ✓Stable |
| Brazil | 8 | 0,332 | 8 | 0,331 | 8 | 0,308 | ✓Stable |
| Uzbekistan | 9 | 0,279 | 9 | 0,278 | 9 | 0,253 | ✓Stable |
| Nigeria | 10 | 0,023 | 10 | 0,024 | 10 | 0,025 | ✓Stable |
The central result: all 10 economies maintain their rank positions across all three weighting scenarios without a single exception. This is a principal methodological finding – the extreme positions of the ranking (leaders and laggards) are fully invariant to weight selection, which constitutes a key indicator of measurement reliability. The OECD/JRC Handbook establishes that robustness and sensitivity analysis should be undertaken to assess the composite indicator, including the choice of weights and the normalisation scheme (OECD/European Commission, 2008). The TMI pilot fully satisfies this requirement.
The directional logic of weight changes is itself informative. The transition from the baseline (0.3/0.4/0.3) to the absorption-dominant (0.2/0.5/0.3) scenario produces two observable shifts. Korea's TMI rises from 0.896 to 0.906: as the economy with the maximum absorption component (A = 1.000), it benefits most from an increase in the A-weight. Conversely, Singapore's TMI decreases from 0.803 to 0.756: as the economy with maximum output (O = 1.000) but moderate absorption (A = 0.515), it loses when the A-weight is elevated at the expense of the R-weight. This pattern directly corresponds to the cybernetic logic of the model: elevating the absorption weight amplifies the diagnostic signal for the component that the theory identifies as the metabolic bottleneck.
The equal-weight scenario (0.33/0.33/0.33) functions as a "null hypothesis" against which the baseline is tested. The fact that the ranking is identical under equal weights and under the theoretically motivated baseline confirms that the ranking reflects genuine structural differences between economies, not an artifact of the weighting specification. This is particularly important for the policy-relevant finding that three metabolic clusters – leaders (Korea, Singapore, Estonia: TMI > 0.55), developed economies (USA, Japan, EU-5, China: TMI 0.55–0.65), and catching-up economies (Brazil, Uzbekistan, Nigeria: TMI < 0.35) – retain their composition under all three scenarios without cross-cluster migration. The implication is that regulators can rely on their country's cluster membership as a stable diagnostic result, independent of future weight refinement when sample size increases.
4.5. Metabolic Profiles: Three Diagnostic Patterns of Developing Economies
The comparison of three developing economies within the sample reveals three structurally distinct metabolic patterns, each with a different cybernetic nature. This original typology constitutes a taxonomic contribution of the study to the cybernetic diagnostics of digital transformation.
First pattern – "metabolic gap" (Uzbekistan: R = 0.546, A = 0.284, O = 0.007). The defining characteristic is a pronounced inter-component cascade: readiness substantially exceeds absorption, which in turn vastly exceeds output. The infrastructure and institutional potential is present (Internet_n = 0.777, EGDI_n = 0.648), but the near-zero R&D investment (RD_n = 0.000, corresponding to 0.13% of GDP) creates a structural blockage at the absorption stage, preventing the technological signal from reaching the output node. Uzbekistan's R&D expenditure dropped by 21% from 0.2% of GDP in 2022 to 0.1% in 2023 (Knoema, 2024), indicating that the absorption deficit is deepening rather than narrowing. Uzbekistan adopted the National Development Strategy 2030, aiming to become an upper-middle-income country by the end of the decade, while the World Bank's country portfolio consists of 23 projects with commitments totaling over $4.65 billion targeting infrastructure, education, and innovation systems (World Bank, 2025). The World Bank approved a $50 million loan for the Uzbekistan Digital Inclusion Project to support the digital economy, noting that IT-enabled services exports surged from $600,000 in 2017 to $140 million in 2022, though the ICT sector's contribution to GDP remained modest at 1.9% (World Bank, 2022). Uzbekistan's GDP grew by 7.2% in the first half of 2025, with exports expanding by 29.1% mainly in gold, uranium, fruits, and services (World Bank, 2025) – confirming that the export structure remains resource-based rather than technological. In cybernetic terms, the circuit is "open" at the A→O junction: the potential accumulated in the readiness node cannot be converted into measurable economic output because the absorption channel lacks sufficient throughput capacity.
Second pattern – "balanced weakness" (Brazil: R = 0.575, A = 0.337, O = 0.082). All three components are in the lower part of the sample, but the inter-component ratios are moderate – no single junction exhibits the dramatic gap observed in Uzbekistan. Brazil's R&D at 1.15% of GDP (RD_n = 0.213) is over eight times higher than Uzbekistan's level, explaining the comparatively higher absorption at similar readiness. The cybernetic interpretation: the circuit is closed and functions, but operates at low velocity across all nodes – a configuration requiring systemic acceleration rather than targeted intervention at a single bottleneck.
Third pattern – "systemic metabolic deficit" (Nigeria: R = 0.000, A = 0.016, O = 0.057). This is the extreme case where all three components approach zero. EGDI = 0.4815 is the absolute sample minimum; broadband subscriptions stand at 0.043 per 100 people – 600 times less than Uzbekistan's 25.8. The circuit does not function in any meaningful sense: the baseline infrastructure and institutional conditions required for even minimal technological signal transmission are absent. Paradoxically, the O-component (0.057) slightly exceeds A (0.016), driven by Nigeria's Hitech_n = 0.113 – reflecting a small enclave of high-technology exports (6.49% of manufactured exports) that exists independently of domestic absorption infrastructure, likely through foreign-owned production facilities.
Figure 1 presents a radar (spider) diagram comparing the R/A/O profiles of Uzbekistan, Korea, and EU-5. The three axes represent the normalized component values. Uzbekistan's triangle is sharply "skewed" toward the R-axis with virtually zero O, creating a highly asymmetric shape. Korea's profile approaches equiangular, reflecting balanced development across all three dimensions. EU-5 occupies an intermediate position.
The visualization powerfully communicates the central diagnostic finding: TMI = 0.279 for Uzbekistan does not indicate a "weak economy" overall, but an economy with a specific, diagnosable, and – critically – addressable bottleneck in the A-component.
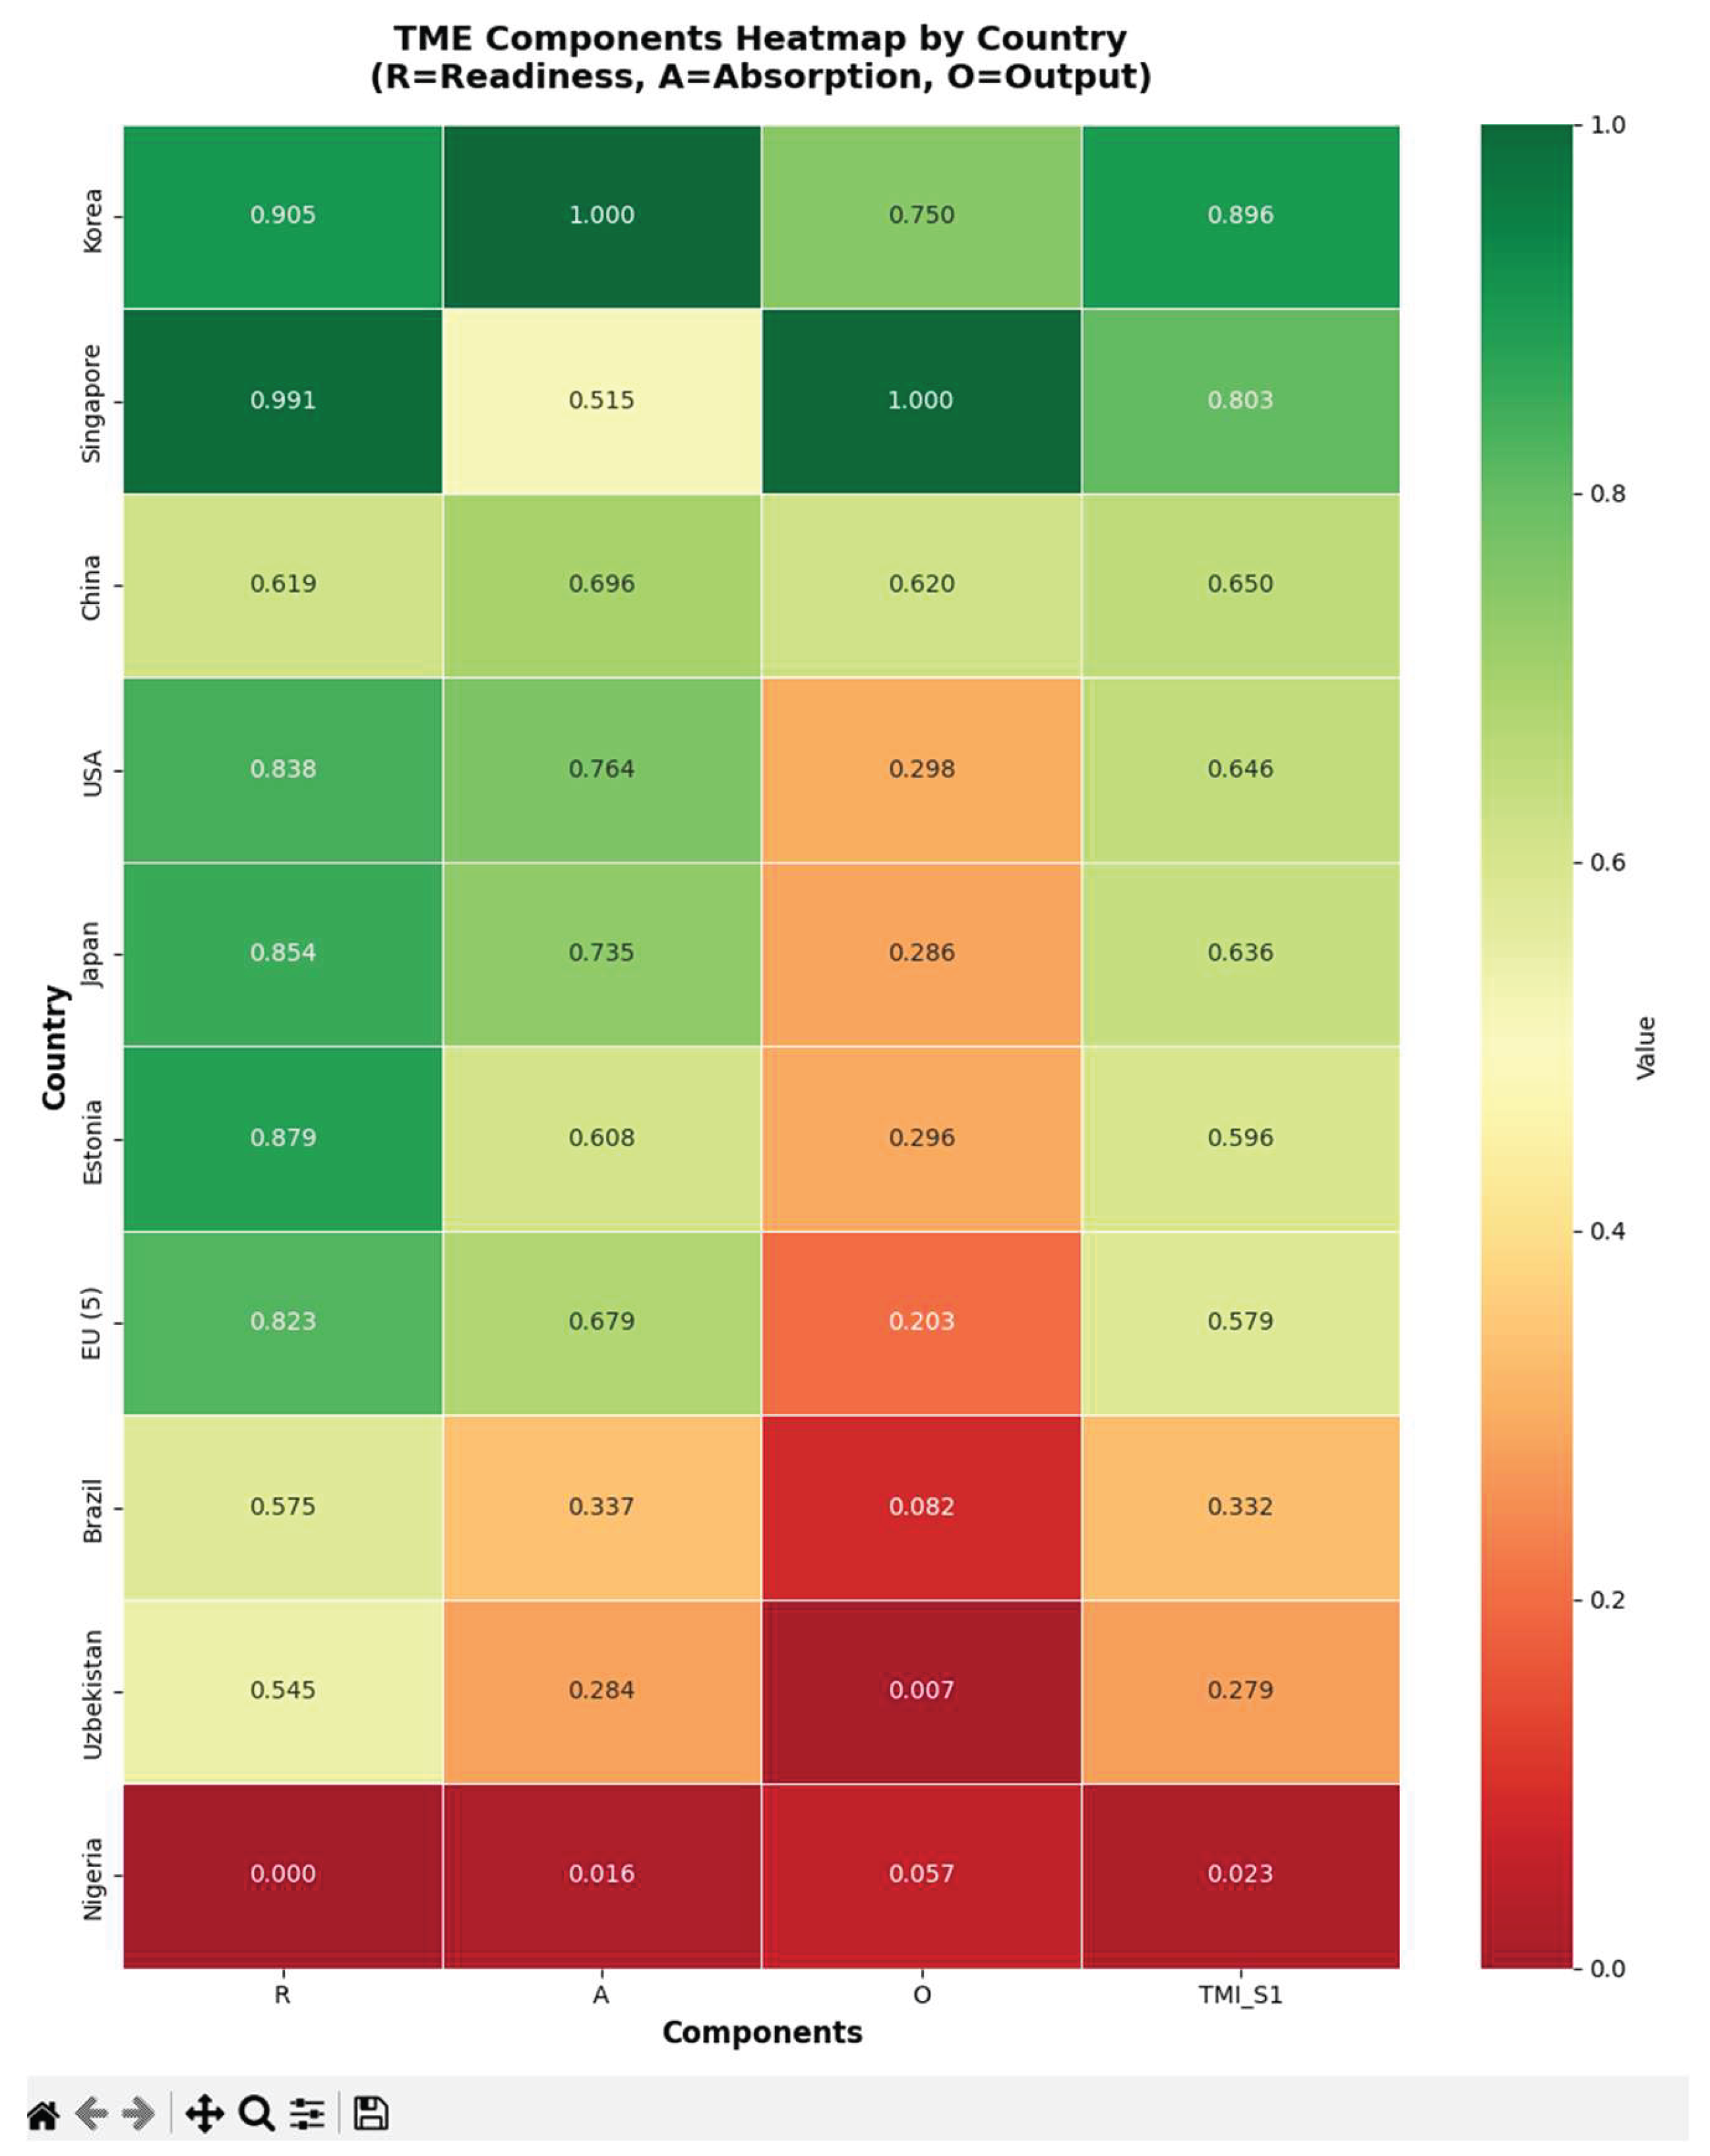
The diagnostic visualizations presented above are generated programmatically by the TME_INDEX_CALCULATOR software (certificate DGU 61047). Figure 2 presents the main interface of the application, illustrating the six available analytical modules: 3-axis radar (R/A/O profiles), 7-axis radar (all sub-indicators), bar chart (TMI ranking), heatmap (component matrix), bubble chart (R vs. A with O as bubble size), and sensitivity line chart. Selected visualization outputs generated by the application are presented in Appendix A (Figure A1, Figure A2, Figure A3).
The integrated environment enables analysts to add or modify country data interactively, switch between weighting scenarios, and export results to CSV — thereby operationalizing the principle of "zero-barrier reproducibility" central to the instrument's design philosophy (see Section 3.5).
4.6. Scenario Modeling: Arithmetic Verification for Uzbekistan
Beyond measurement, the TMI enables "what-if" modeling – demonstrating its practical value as a policy planning instrument. Using the TMI formula with Uzbekistan's current R = 0.546 and O = 0.007 held constant, we model the effect of absorption improvement under three scenarios.
Scenario 1: Raising A from 0.284 to 0.500. Applying the formula: TMI = 0.3 × 0.546 + 0.4 × 0.500 + 0.3 × 0.007 = 0.164 + 0.200 + 0.002 = 0.366. This value approaches Brazil's current TMI (0.332), representing an exit from the "metabolic gap" condition and the elimination of the first-order absorption bottleneck.
Scenario 2: Achieving A = 0.679 (the EU-5 level). TMI = 0.3 × 0.546 + 0.4 × 0.679 + 0.3 × 0.007 = 0.164 + 0.272 + 0.002 = 0.438, substantially exceeding Brazil and approaching the "developed" cluster boundary.
Scenario 3: Simultaneously raising A to 0.500 and O to 0.100. TMI = 0.3 × 0.546 + 0.4 × 0.500 + 0.3 × 0.100 = 0.164 + 0.200 + 0.030 = 0.394 – a transition from the "catching-up" to the "developed" range, achieved by closing the circuit at both the A and O junctions simultaneously.
These calculations demonstrate that TMI provides policymakers with an actionable tool, not an abstract ranking. The instrument delivers arithmetically verifiable targets: achieving R&D ≥ 0.5% of GDP by 2027 and fixed broadband ≥ 40 per 100 inhabitants by 2026 – specific, measurable policy parameters whose impact on TMI can be calculated in advance. This "what-if" functionality is enabled by the additive structure of the formula and is directly available in both the TME_INDEX_CALCULATOR software and the Excel model, where changing a single cell value instantly recalculates the index.
5. Discussion
5.1. Additive Value of TMI in the Global Index Ecosystem
The TMI, with only 7 sub-indicators sourced entirely from open World Bank WDI and UN DESA databases, provides a form of diagnostic specificity that is structurally unavailable in more complex indices. The GII 2024 requires a minimum of 35 input and 16 output indicators per economy, leading to the exclusion of 117 economies due to insufficient data (WIPO, 2024). By contrast, all 7 TMI sub-indicators are available for 130–150 economies in the World Bank DataBank, eliminating the principal data barrier that locks developing countries out of the global digital monitoring system.
The distinctive contribution of TMI lies not in the volume of data it processes but in its structural decomposition. The explicit separation of R, A, and O components – and the ability to identify precisely where the circuit is "open" – represents a diagnostic capability absent from aggregate indices. The GII produces an overall innovation score but does not distinguish between economies that have high readiness but low absorption (Uzbekistan) and those with low readiness but surprisingly high output through foreign-owned enclaves (elements of the Nigerian profile). The NRI measures readiness comprehensively but does not track whether that readiness translates into economic output. The IDI measures connectivity but says nothing about what happens after connection is achieved. TMI addresses precisely this "what happens next" question through the A and O components.
The study by Lastauskaite (2026) published in the journal Economies provides a valuable micro-level complement. The study examines how production digitalization investment affects firm financial performance across European regions, using a panel of 14,935 firm-year observations from 30 countries, and demonstrates that digital investment yields asymmetric returns with significantly stronger effects in the Baltic region, suggesting that digital capital delivers amplified value in economies with lower digital saturation but greater absorptive urgency (Lastauskaite, 2026). This finding at the firm level mirrors the macro-level pattern captured by TMI: the marginal return on absorption investment is highest precisely in economies exhibiting the "metabolic gap" profile – where readiness infrastructure exists but absorption capacity is deficient. The two instruments – TMI at the national level and Lastauskaite's capital-based proxy at the firm level – thus address different analytical scales of the same underlying phenomenon: the speed and completeness of technology absorption.
A further distinguishing feature of TMI is its parsimony. The OECD/JRC Handbook is concerned with composite indicators that compare and rank country performance in areas such as industrial competitiveness, sustainable development, globalization and innovation (OECD/European Commission, 2008). TMI achieves this with 7 sub-indicators – approximately one-tenth the data footprint of GII (78) and one-eighth that of NRI (54). This is not a limitation but a deliberate design choice: the minimal data requirement ensures that the instrument can be applied without exclusion to the very economies – developing, transitional, data-poor – where the diagnostic of "metabolic gap" is most policy-relevant.
5.2. Policy Implications: From Diagnosis to Action
The TMI provides policymakers not with an abstract position in a ranking but with a targeted, component-specific diagnosis: which node of the circuit constitutes the bottleneck, and what specific sub-indicator improvement would achieve a quantifiable shift in position. For Uzbekistan, the diagnosis is unambiguous: the A-component is the systemic bottleneck. R&D expenditure at 0.13% of GDP – 37 times below the Korean level and 23 times below the G20 median – represents a structural deficit that no amount of infrastructure investment (R-component) can compensate. The absorption channel is the weakest link, and in a sequential circuit, the weakest link determines throughput.
The Korean experience provides the empirical benchmark. Korea's gross domestic expenditure on R&D ranks second worldwide at 4.93% of GDP, with the young population particularly adept at using digital technologies, enabling employers to integrate emerging technologies quickly (OECD, 2023). Business-financed GERD reached 3.977% of GDP in 2022, a historical maximum (CEIC Data, 2023). The critical insight from the Korean model is that absorption leadership is driven primarily by corporate, not government, R&D – the private sector accounts for approximately 74% of total GERD. A policy strategy focused solely on public R&D spending would miss this structural feature. The TMI framework suggests that Uzbekistan's absorption acceleration requires not just increased government R&D allocation but, crucially, the creation of institutional conditions (tax credits, IP protection, technology parks) that incentivize private-sector R&D investment.
The medium-term challenge of transforming the O-component is more complex. The World Bank notes that IT-enabled services exports from Uzbekistan surged from $600,000 in 2017 to $140 million in 2022, though the ICT sector's contribution to GDP remained modest at 1.9% (World Bank, 2022). Uzbekistan's exports expanded by 29.1% in the first half of 2025, mainly in gold, uranium, fruits, and services (World Bank, 2025) – demonstrating that the export structure remains resource-based. Transforming the O-component requires the formation of a closed loop "absorption → market → output → reinvestment in R&D" – a self-sustaining cycle that Korea has achieved but that remains structurally absent in Uzbekistan. The IT Park special economic zone represents an institutional prototype for this circuit, but its scale remains insufficient to shift the national O-component meaningfully.
The scenario modeling in Section 4.6 provides specific, arithmetically verifiable targets: achieving R&D ≥ 0.5% of GDP by 2027 would significantly raise TMI. This is not a theoretical projection but a direct consequence of the formula structure – any policy analyst with access to the Excel model can verify the calculation and adapt it to alternative target parameters.
5.3. Scaling Roadmap: From Pilot to Global Instrument
Three scaling thresholds define the trajectory from the current pilot to a global instrument comparable in coverage to GII and NRI.
The first threshold (30+ countries) triggers the transition from sample-based min-max normalization to fixed goalposts. In the UNDP HDI methodology, minimum and maximum values (goalposts) are set to transform indicators into indices between 0 and 1, acting as 'natural zeros' and 'aspirational goals' from which component indicators are standardized (UNDP, 2024). Fixed goalposts ensure inter-temporal comparability of index values, unlike relative sample extremes that change annually (UNDP, 2024). For TMI, goalposts would be established based on theoretical reasoning and observed data ranges: for example, R&D/GDP might have a goalpost of 0% (natural zero) and 6% (aspirational target, approximately 120% of the current world maximum). This transition is critical because without it, the addition of a single high-performing economy would recalibrate the entire normalization, potentially shifting all existing country scores.
The second threshold (60+ countries) enables the verification of the causal chain R → A → O through structural equation modeling (SEM). At this sample size, sufficient statistical power emerges to test whether the hypothesized weights (0.3/0.4/0.3) are empirically supported – or whether the data suggest a different weighting structure. SEM would also enable testing of the assumed linear (additive) aggregation against geometric alternatives, and the identification of potential mediating or moderating variables not currently captured by the 7 sub-indicators.
The third threshold (100+ countries with annual updates) represents the target state: TMI as a global instrument comparable in coverage to GII and NRI, while retaining its fundamental advantage of minimal data requirements. Since all 7 sub-indicators are available in World Bank WDI for 130–150 economies, this expansion requires no methodological expansion of the indicator set – only the data collection and goalposts calibration work. Automated annual updates via the World Bank REST API would complete the transformation from a pilot academic exercise into a practical global monitoring tool.
5.4. Limitations
Several limitations must be explicitly acknowledged. First, the pilot sample of N = 10 is too small for broad statistical generalization; it serves as conceptual verification, not definitive ranking. The purpose of the pilot is to demonstrate operational viability and diagnostic utility, not to establish final country positions.
Second, min-max normalization by sample is inherently unstable: minimum and maximum values change with sample composition, meaning that adding or removing a single economy can shift all normalized scores. The transition to fixed goalposts at the 30-country threshold is the primary methodological response.
Third, the weighting coefficients (0.3/0.4/0.3) are theoretically grounded in the cybernetic hypothesis that absorption is the bottleneck, but not empirically calibrated. While the three-scenario robustness analysis confirms rank stability, SEM-based calibration at N ≥ 60 would provide a definitive empirical foundation for the weights.
Each of these limitations simultaneously constitutes a specific direction for future research upon scaling the instrument.
6. Conclusions
The Technology Metabolism Index (TMI) is the first composite indicator designed to measure the speed of technology metabolism of an economy through the three-component structure Readiness → Absorption → Output. Grounded in the cybernetic theory of closed feedback loops – Ashby's Law of Requisite Variety ( Beer's Viable System Model, and Forrester's system dynamics – TMI fills a measurement niche that remains unoccupied by the three leading global indices: GII measures innovation potential, NRI measures network readiness, IDI measures connectivity coverage, but none measures the velocity of technological signal propagation through the full R → A → O cycle.
The pilot calculation on 10 economies – spanning from Korea (TMI = 0.896) to Nigeria (TMI = 0.023) – confirmed three critical properties of the instrument. First, rank stability: all 10 economies maintain their positions across three weighting scenarios (Baseline, Equal, Absorption-dominant) without a single exception, satisfying the OECD/JRC robustness criterion. Second, cluster stability: the three metabolic clusters (leaders, developed, catching-up) retain their composition under all scenarios, enabling regulators to rely on cluster membership as a robust diagnostic. Third, diagnostic specificity: the original three-pattern typology – "metabolic gap" (Uzbekistan: R >> A >> O), "balanced weakness" (Brazil: R ≈ A > O), and "systemic deficit" (Nigeria: R ≈ A ≈ O ≈ 0) – provides actionable diagnostic categories unavailable in aggregate indices.
The Uzbekistan case demonstrates the policy utility of TMI: with R&D at 0.13% of GDP (37 times below Korea's level), the A-component is identified as the specific bottleneck. Scenario modeling demonstrates that a targeted improvement in the weakest component produces a measurable and immediately observable shift in the overall index value, confirming that the normalized R/A/O decomposition enables policymakers to identify precisely which component lags behind and, consequently, which domain of the national innovation system requires priority intervention. This level of diagnostic precision – linking a specific sub-indicator target to a quantifiable index shift – distinguishes TMI from more complex instruments that produce aggregate scores without component-level actionability.
The minimal statistical burden of 7 sub-indicators – all sourced from openly available World Bank WDI and UN DESA databases for 130–150 economies – ensures a realistic path to global coverage without methodological expansion. This is a fundamental advantage over GII, from which 117 economies were excluded in 2024 due to data requirements. The software implementation (TME_INDEX_CALCULATOR, certificate DGU 61047, with six visualization types and interactive country addition) and the four-sheet Excel model provide full reproducibility without specialized statistical software, embodying the principle of "zero-barrier entry" for analysts in developing economies.
Future research directions include: expansion to 30+ countries with transition to fixed goalposts following UNDP HDI practice; SEM-based weight calibration at N ≥ 60; testing the geometric mean as an alternative to additive aggregation; development of a cloud-based web platform with interactive scenario modeling; longitudinal analysis of metabolic dynamics with consistent goalposts; and integration with GII, NRI, and IDI data for comparative positioning of TMI within the global digital monitoring ecosystem.
7. Patents
The software product TME_INDEX_CALCULATOR v1.0 (Gulyamov, Said; Gulyamov, Saidakhror) is registered under certificate DGU 61047, Ministry of Justice of the Republic of Uzbekistan, 8 March 2026. The application implements the full TMI calculation pipeline — from raw data input through min-max normalization and weighted aggregation to six visualization types — and is provided as Supplementary Material to this article.
Supplementary Materials
The following supporting information can be downloaded at the website of this paper posted on Preprints.org: [https://drive.google.com/drive/folders/1VchrnnFVuU5vRKgr_AmDMN4BdKFDJl1s?usp=sharing]. File S1: TME_INDEX_CALCULATOR v1.0 — Python source code (tme_index_calculator.py, tme_gui.py) implementing the computational core and graphical interface with six visualization modules (3-axis radar, 7-axis radar, bar chart, heatmap, bubble chart, sensitivity line chart); File S2: TMI_Excel_Model.xlsx — four-sheet Excel workbook (Sheet 1 "Data": raw values of 7 sub-indicators for 10 countries; Sheet 2 "Normalization": min-max formulas; Sheet 3 "Aggregation": component means and TMI via SUMPRODUCT with fixed weight cells; Sheet 4 "Sensitivity": three weighting scenarios replicating the robustness analysis); File S3: TME_INDEX_CALCULATOR v1.0 — compiled application (.exe).
Author Contributions
Said Gulyamov is the corresponding author and principal investigator; he developed the theoretical and economic-legal foundations of the Technology Metabolism Index, formulated the research design, performed the pilot calculation, conducted the robustness analysis, and wrote the original manuscript. Saidakhror Gulyamov provided the cybernetic theoretical framework grounded in Ashby's, Beer's, and Forrester's theories, developed the five-node closed-loop model underlying the R→A→O structure, and supervised the overall research. Andrey Rodionov implemented the technical infrastructure, including the TME_INDEX_CALCULATOR software (Python/tkinter), the four-sheet Excel model, data curation, and all visualizations. All authors have read and agreed to the published version of the manuscript.
Funding
This research received no external funding.
Institutional Review Board Statement
Not applicable.
Informed Consent Statement
Not applicable.
Data Availability Statement
All data used in this study are publicly available from World Bank World Development Indicators (https://databank.worldbank.org), UN DESA E-Government Survey 2024 (https://publicadministration.un.org/egovkb), and World Bank Worldwide Governance Indicators (https://www.worldbank.org/en/publication/worldwide-governance-indicators). The complete dataset, calculation files, and software source code are provided as Supplementary Material.
Acknowledgments
The authors express their gratitude to the journal Economies (MDPI) for its open access policy, which enables broad dissemination of research findings to the global academic community; the work by Lastauskaite (2026) published in this journal provided a valuable micro-level complement to the present study. The authors also acknowledge the World Bank Group for its open data policy and the publicly available World Development Indicators and Worldwide Governance Indicators databases, which served as the primary data sources for the TMI pilot calculation, as well as UN DESA for the open availability of the E-Government Development Index. During the preparation of this manuscript, the authors used Claude Opus 4.6 Extended (Anthropic) for the purposes of improving the translation of the manuscript into academic English, converting mathematical formulas into the OMML format required by Microsoft Word, and refining the stylistic quality of the language. All data, formulas, calculations, theoretical constructs, textual content, source references, and the reference list were composed, compiled, and verified manually by the authors. The authors have reviewed and edited all AI-assisted output and take full responsibility for the content of this publication.
Conflicts of Interest
The authors declare no conflicts of interest.
Abbreviations
The following abbreviations are used in this manuscript:
| TMI | Technology Metabolism Index |
| TME | Technology Metabolism of the Economy |
| R / A / O | Readiness / Absorption / Output |
| GII | Global Innovation Index |
| NRI | Network Readiness Index |
| IDI | ICT Development Index |
| WDI | World Development Indicators |
| WGI | Worldwide Governance Indicators |
| EGDI | E-Government Development Index |
| GERD | Gross Domestic Expenditure on R&D |
| ICT | Information and Communication Technology |
| SEM | Structural Equation Modeling |
| HDI | Human Development Index |
| OECD | Organisation for Economic Co-operation and Development |
| JRC | Joint Research Centre (European Commission) |
| UN DESA | United Nations Department of Economic and Social Affairs |
| ITU | International Telecommunication Union |
| WIPO | World Intellectual Property Organization |
| UNDP | United Nations Development Programme |
| GDP | Gross Domestic Product |
| PPP | Purchasing Power Parity |
Appendix A
Figure A1.
TME components bubble chart: Readiness (x-axis) vs. Absorption (y-axis), with bubble size proportional to Output (O) and color gradient representing the TMI value (baseline scenario S1).
Figure A1.
TME components bubble chart: Readiness (x-axis) vs. Absorption (y-axis), with bubble size proportional to Output (O) and color gradient representing the TMI value (baseline scenario S1).
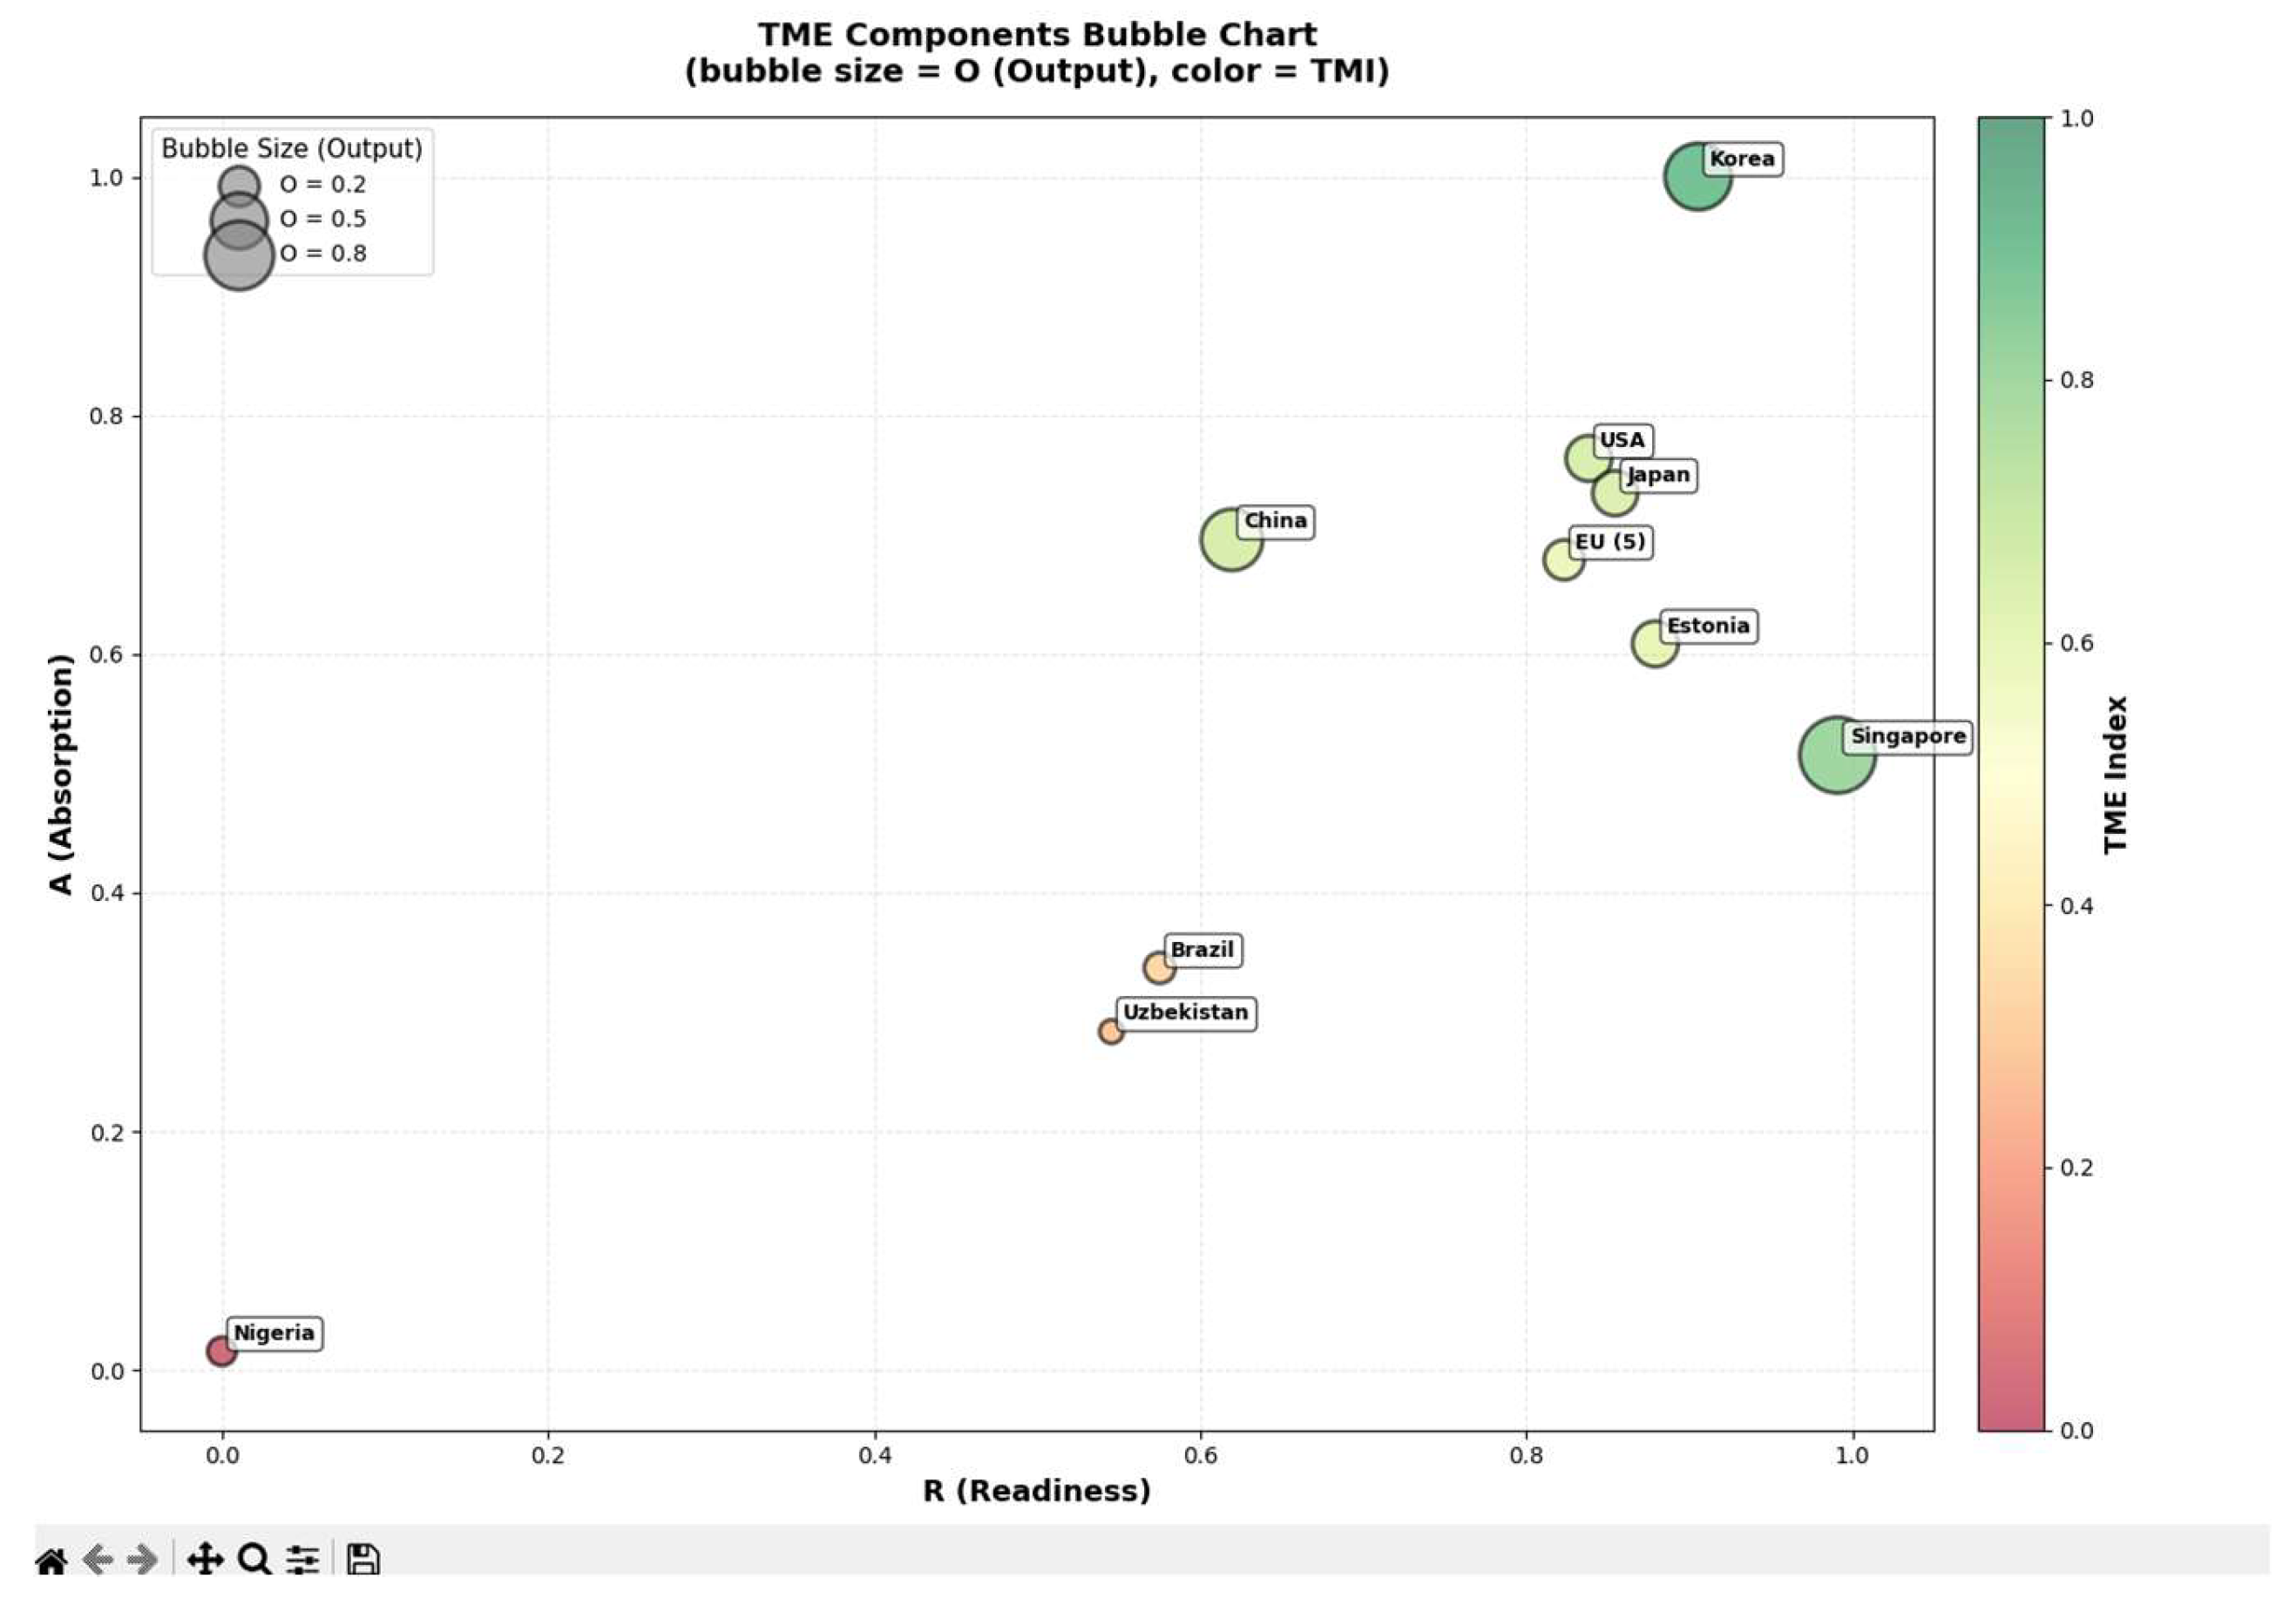
Figure A2.
TMI sensitivity analysis: (a) TMI comparison across three weighting scenarios (S1: 0.3/0.4/0.3; S2: 0.33/0.33/0.33; S3: 0.2/0.5/0.3); (b) R/A/O component decomposition by country (baseline scenario).
Figure A2.
TMI sensitivity analysis: (a) TMI comparison across three weighting scenarios (S1: 0.3/0.4/0.3; S2: 0.33/0.33/0.33; S3: 0.2/0.5/0.3); (b) R/A/O component decomposition by country (baseline scenario).
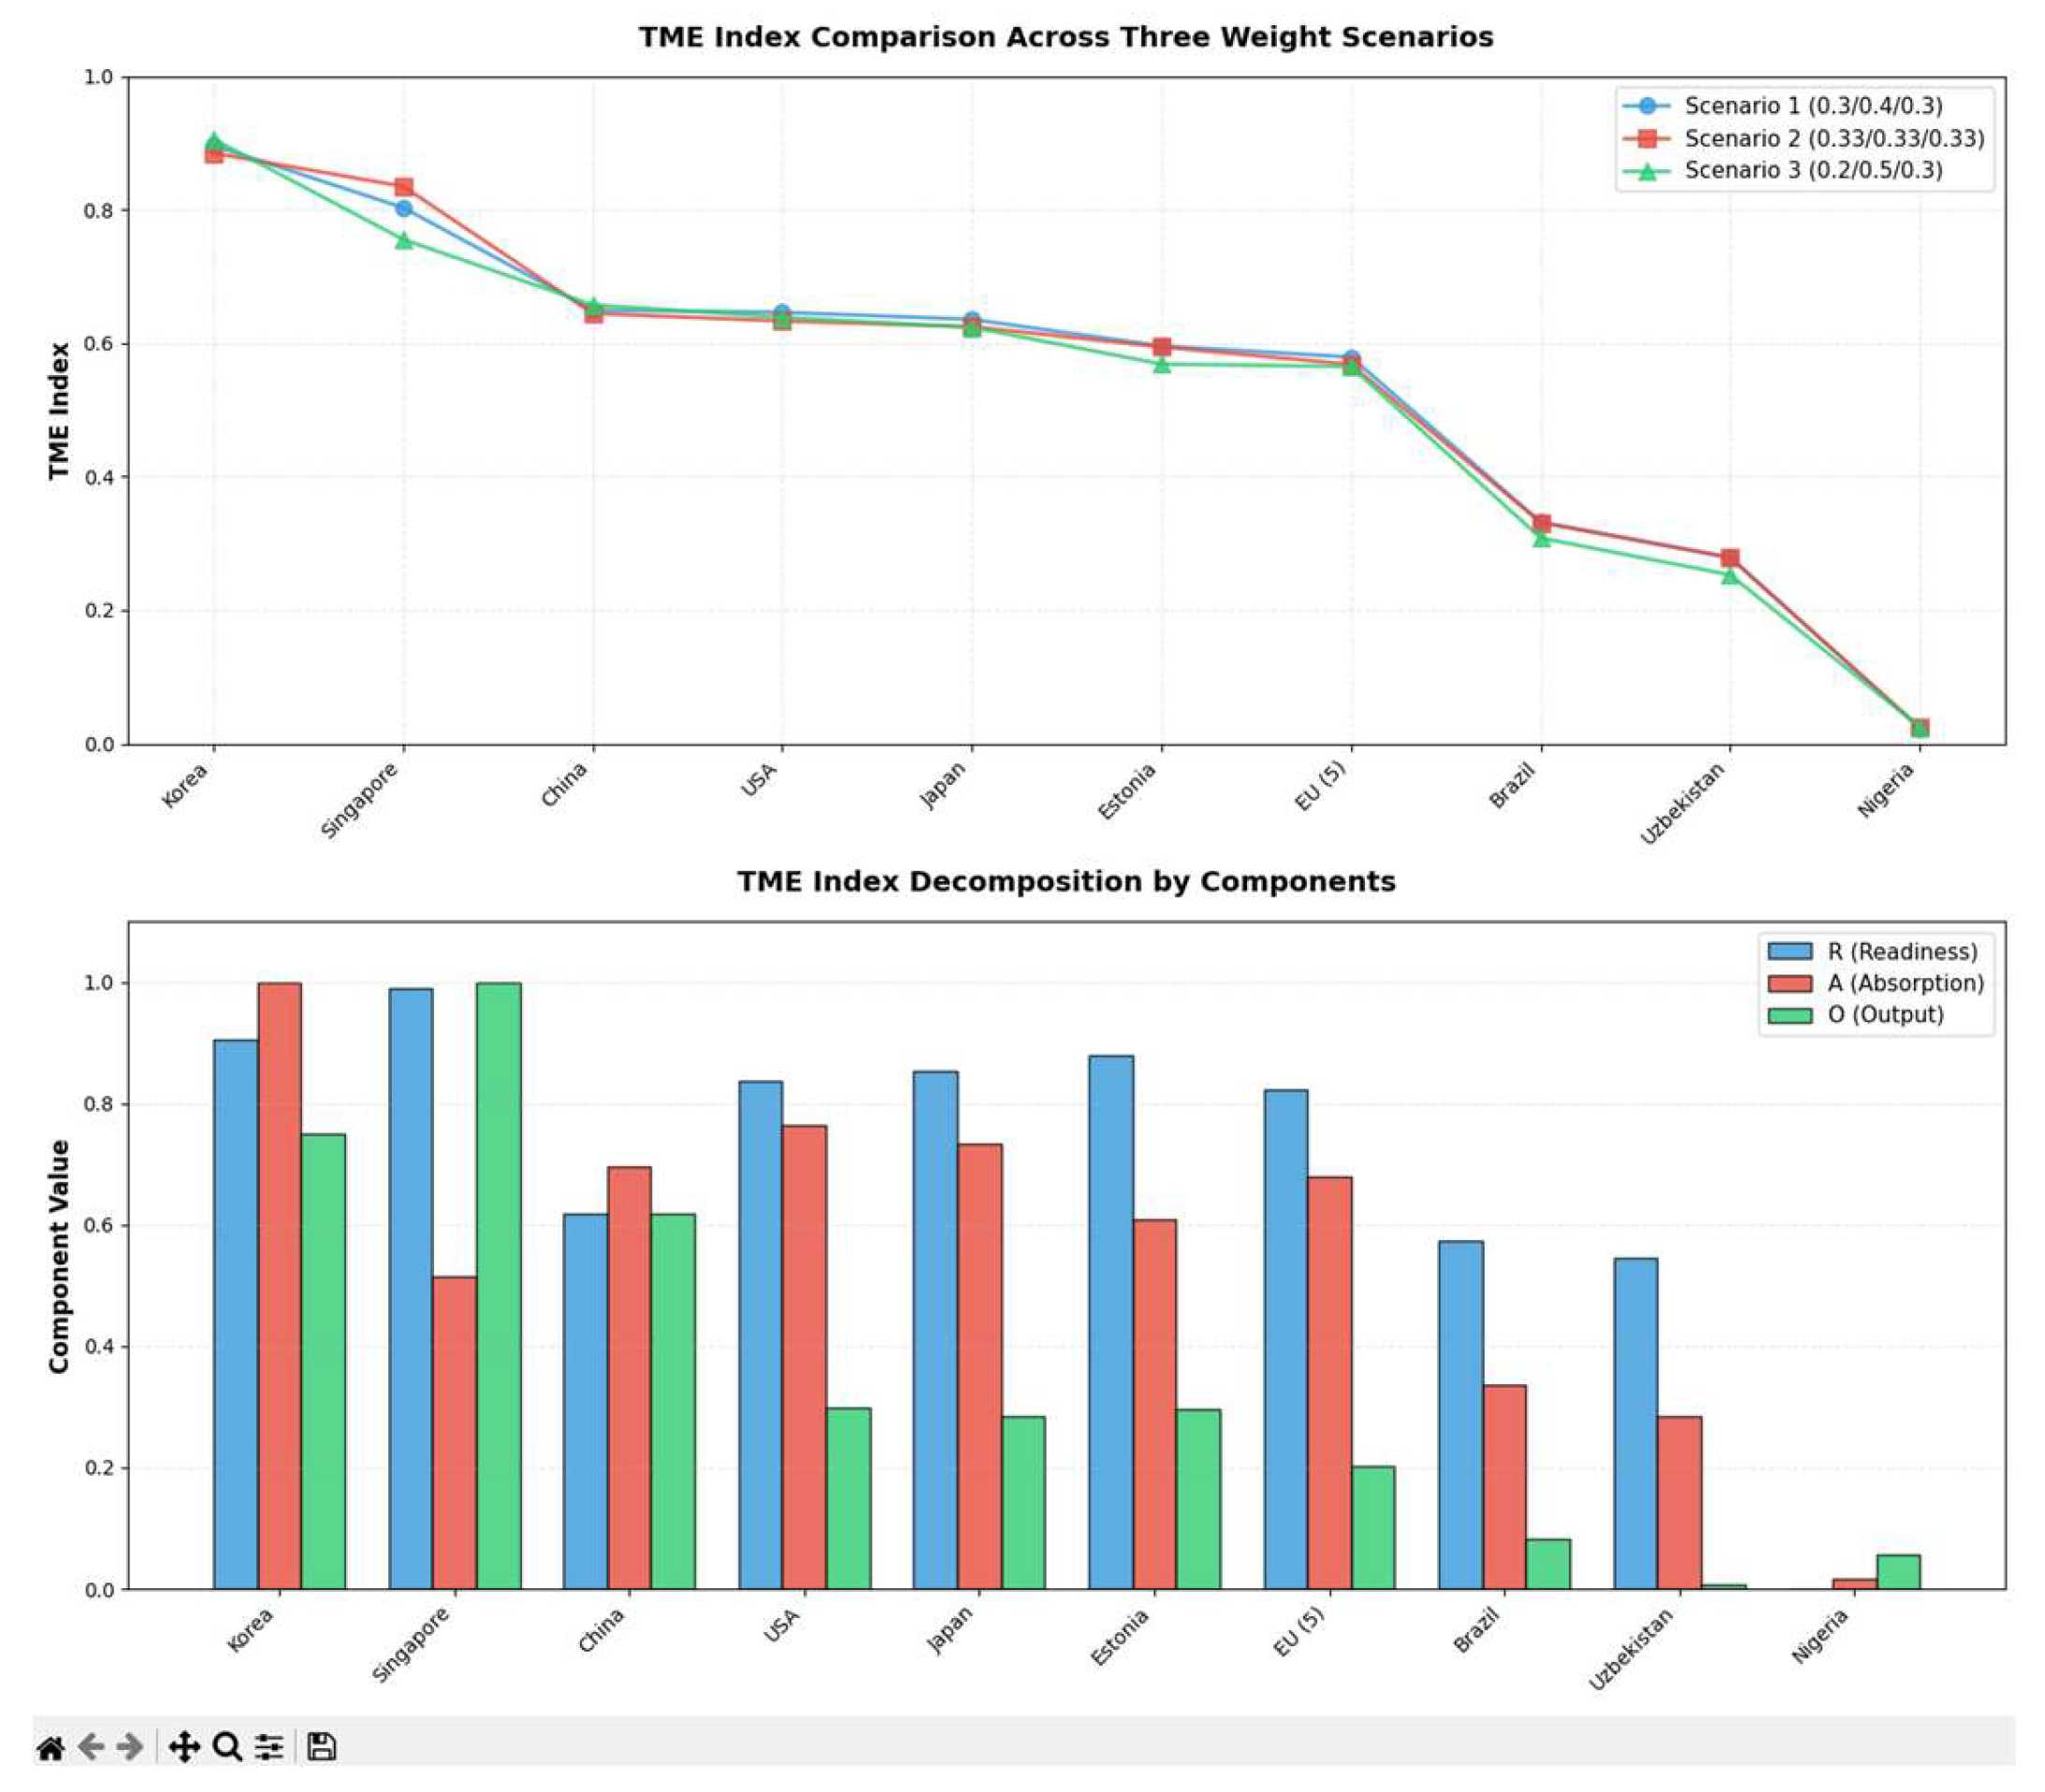
Figure A3.
TME components heatmap by country: Readiness (R), Absorption (A), Output (O), and TMI baseline score (TMI_S1), with color scale from 0.0 (red) to 1.0 (green) (baseline scenario).
Figure A3.
TME components heatmap by country: Readiness (R), Absorption (A), Output (O), and TMI baseline score (TMI_S1), with color scale from 0.0 (red) to 1.0 (green) (baseline scenario).
References
- Arthur, W.B. Increasing Returns and Path Dependence in the Economy; University of Michigan Press: Ann Arbor, 1994. [Google Scholar]
- Ashby, W.R. An Introduction to Cybernetics; Chapman & Hall, London, 1956. [Google Scholar]
- Beer, S. Brain of the Firm: The Managerial Cybernetics of Organization; Allen Lane / The Penguin Press: London, 1972. [Google Scholar]
- CEIC Data. South Korea Business-Financed GERD: % of GDP. 2023. Available online: https://www.ceicdata.com/en/.
- Dushi, D. How is ChatGPT Regulated by the EU AI Act: Reflections on Higher Education. Global Campus of Human Rights. 2024. Available online: https://www.gchumanrights.org/preparedness/how-is-chatgpt-regulated-by-the-eu-ai-act-reflections-on-higher-education/.
- Network Readiness Index 2024: Building a Digital Tomorrow: Public-Private Partnerships for Digital Readiness; Dutta, S., Lanvin, B., Eds.; Portulans Institute / Saïd Business School, University of Oxford, 2024; ISBN 979-8-89660-972-8. [Google Scholar]
- Forrester, J.W. Industrial Dynamics; MIT Press: Cambridge, MA, 1961. [Google Scholar]
- Gulyamov, S.; Gulyamov, S.; Rodionov, A.; Khursanov, R.; Mekhmonov, K.; Babaev, D.; Rakhimjonov, A. Prompt Injection Attacks in Large Language Models and AI Agent Systems: A Comprehensive Review of Vulnerabilities, Attack Vectors, and Defense Mechanisms. Information 2026, 17, 54. [Google Scholar] [CrossRef]
- Hayek, F.A. The Use of Knowledge in Society. The American Economic Review 1945, 35(4), 519–530. [Google Scholar]
- ITU. Measuring Digital Development: ICT Development Index 2024; International Telecommunication Union, Geneva, 2024; Available online: https://www.itu.int/itu-d/reports/statistics/idi2024/.
- Kahneman, D.; Tversky, A. Prospect Theory: An Analysis of Decision under Risk. Econometrica 1979, 47(2), 263–291. [Google Scholar] [CrossRef]
- Knoema. Uzbekistan — Research and Development Expenditure, % of GDP; 2024. [Google Scholar]
- Lastauskaite, A. Digital Production Investments and Financial Outcomes: A Baltic and Rest of Europe Comparison. Economies 2026, 14(1), 29. [Google Scholar] [CrossRef]
- OECD. OECD Reviews of Innovation Policy: Korea 2023; OECD Publishing: Paris, 2023. [Google Scholar] [CrossRef]
- OECD/European Commission. Handbook on Constructing Composite Indicators: Methodology and User Guide; OECD Publishing: Paris, 2008. [Google Scholar] [CrossRef]
- SSTI. Useful Stats: An International Comparison of R&D Expenditures. State Science & Technology Institute. 2024. Available online: https://ssti.org/blog/useful-stats-international-comparison-rd-expenditures (accessed on 2025).
- TheGlobalEconomy.com. High-Technology Exports, Percent of Manufactured Exports — Country Rankings. 2024. Available online: https://www.theglobaleconomy.com/rankings/High_tech_exports/ (accessed on 2025).
- Trading Economics. Singapore — High-Technology Exports (% of Manufactured Exports). World Bank Data. 2024. Available online: https://tradingeconomics.com/singapore/high-technology-exports-percent-of-manufactured-exports-wb-data.html (accessed on 2025).
- UNDP. Human Development Report 2023-2024: Breaking the Gridlock: Reimagining Cooperation in a Polarized World. Technical Notes. United Nations Development Programme, New York. 2024. Available online: https://hdr.undp.org.
- Visual Capitalist. Visualizing R&D Investment by Country. 2025. Available online: https://www.visualcapitalist.com/rd-investment-by-country/.
- WIPO. Global Innovation Index 2024: Unlocking the Promise of Social Entrepreneurship, 17th ed.; World Intellectual Property Organization: Geneva, 2024. [Google Scholar]
- World Bank. Uzbekistan Digital Inclusion Project. 2022. Available online: https://www.worldbank.org/.
- World Bank. Uzbekistan Overview. 2025. Available online: https://www.worldbank.org/en/country/uzbekistan/overview.
- Zuboff, S. The Age of Surveillance Capitalism: The Fight for a Human Future at the New Frontier of Power; PublicAffairs: New York, 2019. [Google Scholar]
Figure 1.
Technology metabolism profile (R/A/O): Uzbekistan vs. Korea and EU-5 (baseline scenario, 2021–2022). Source: authors' calculations based on World Bank WDI, UN DESA E-Government Survey 2024, World Bank WGI 2022.
Figure 1.
Technology metabolism profile (R/A/O): Uzbekistan vs. Korea and EU-5 (baseline scenario, 2021–2022). Source: authors' calculations based on World Bank WDI, UN DESA E-Government Survey 2024, World Bank WGI 2022.
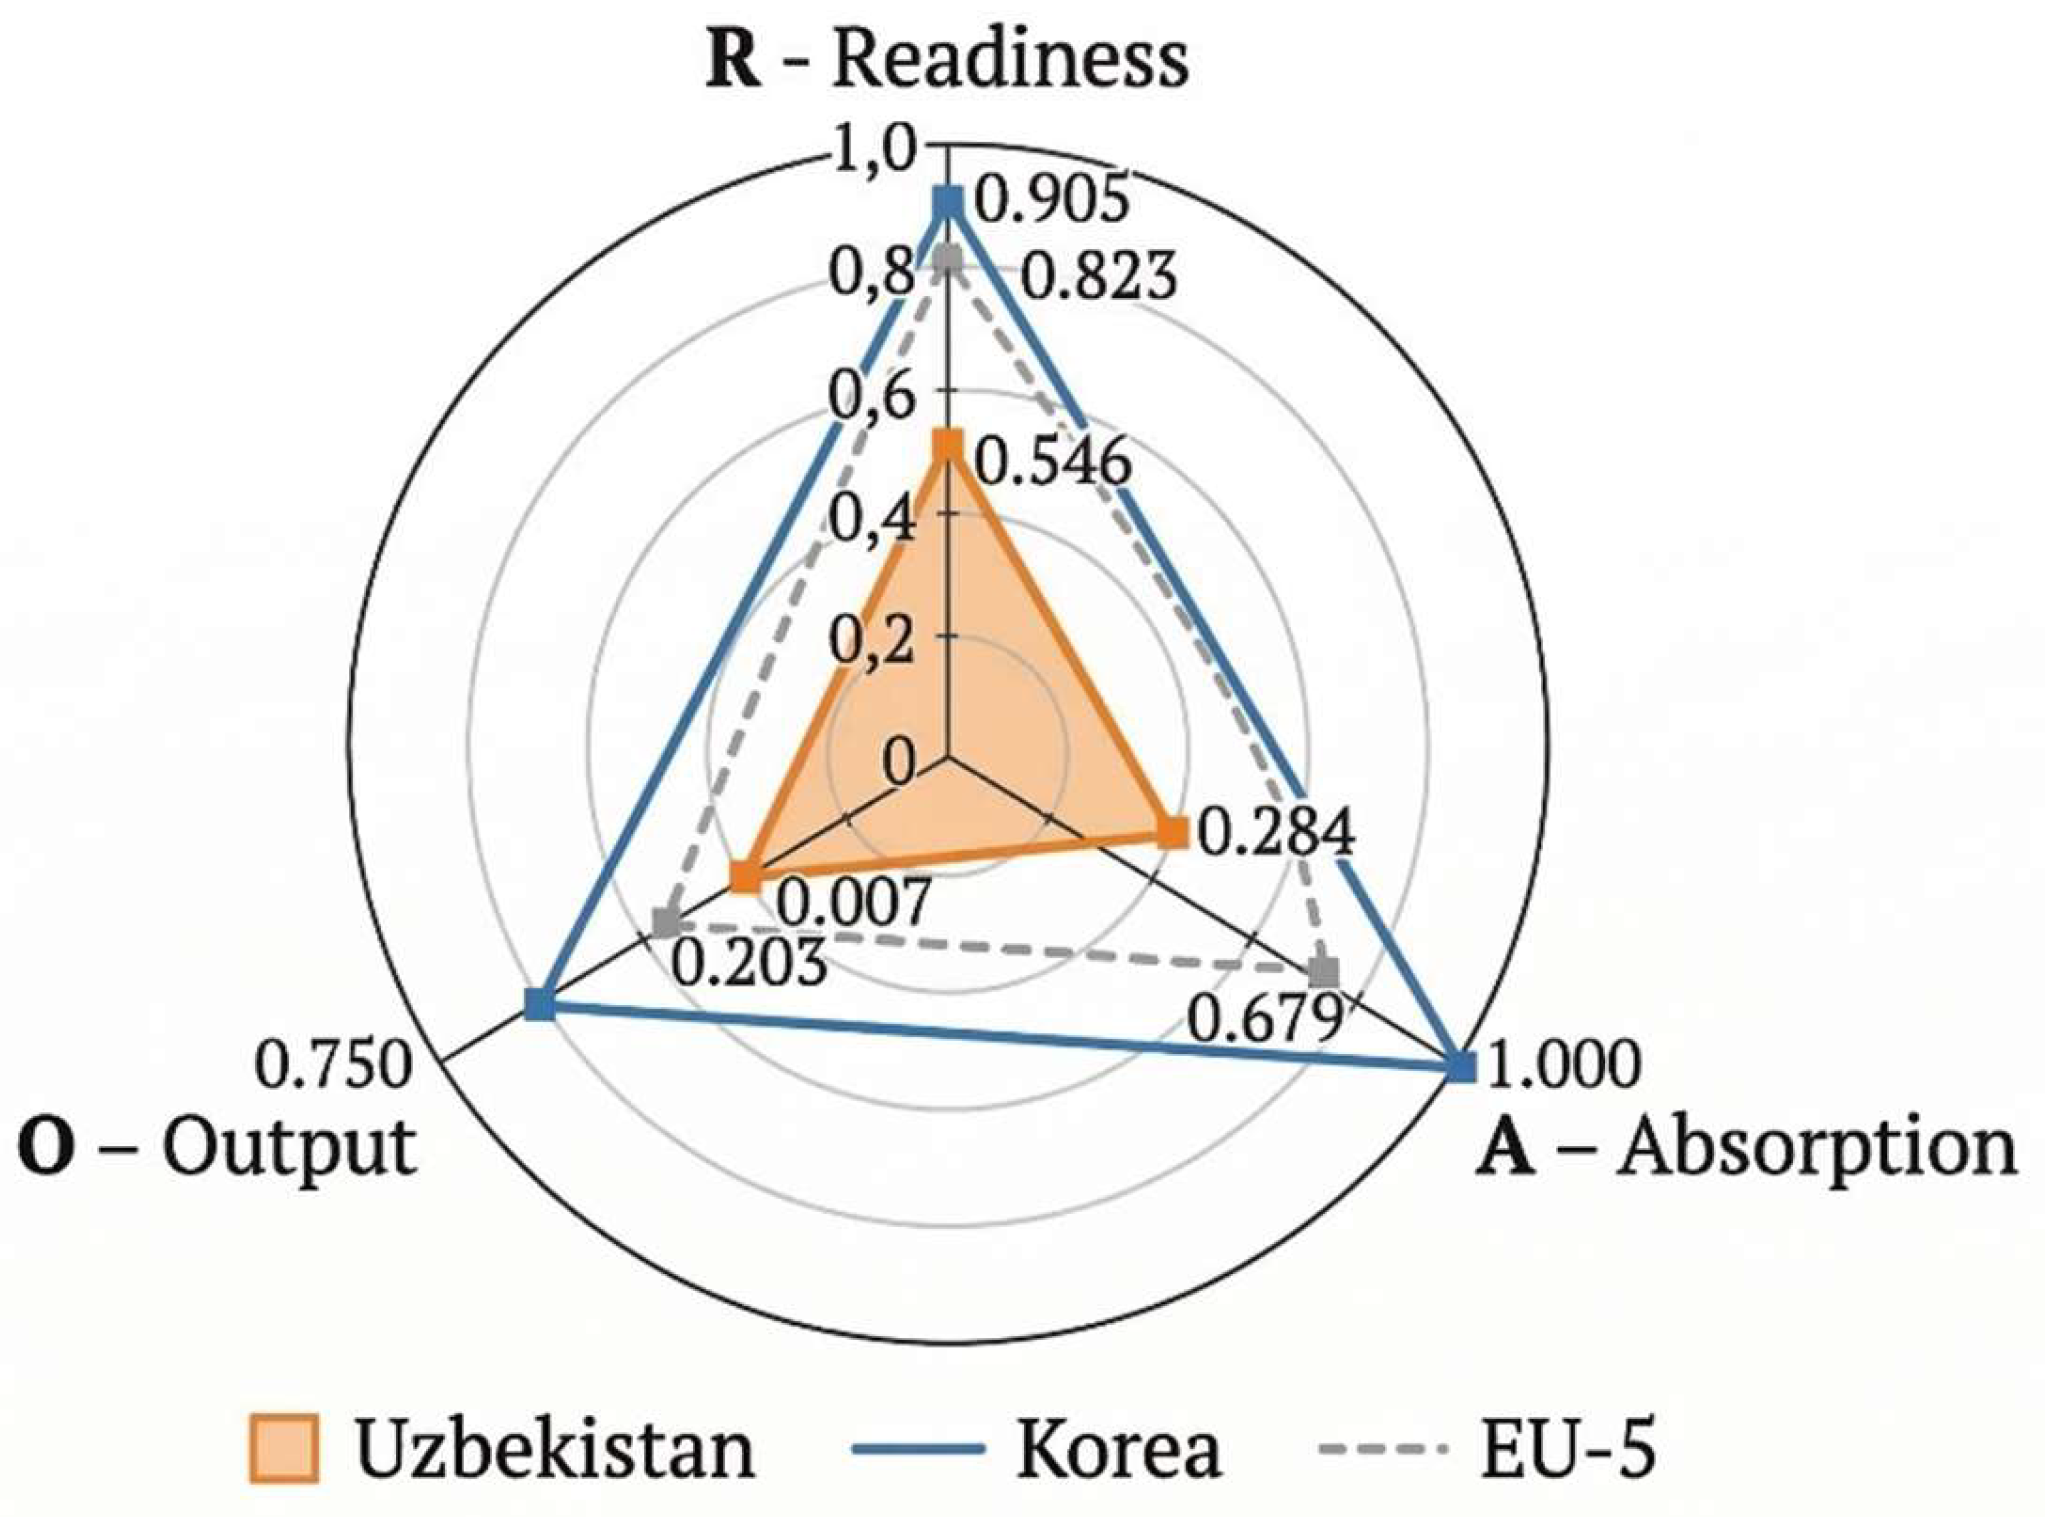
Figure 2.
Main interface of the TME_INDEX_CALCULATOR v1.0: analytical modules and visualization options. Source: authors' software implementation (Python 3.x / tkinter); certificate DGU 61047, Ministry of Justice of the Republic of Uzbekistan, 8 March 2026.
Figure 2.
Main interface of the TME_INDEX_CALCULATOR v1.0: analytical modules and visualization options. Source: authors' software implementation (Python 3.x / tkinter); certificate DGU 61047, Ministry of Justice of the Republic of Uzbekistan, 8 March 2026.
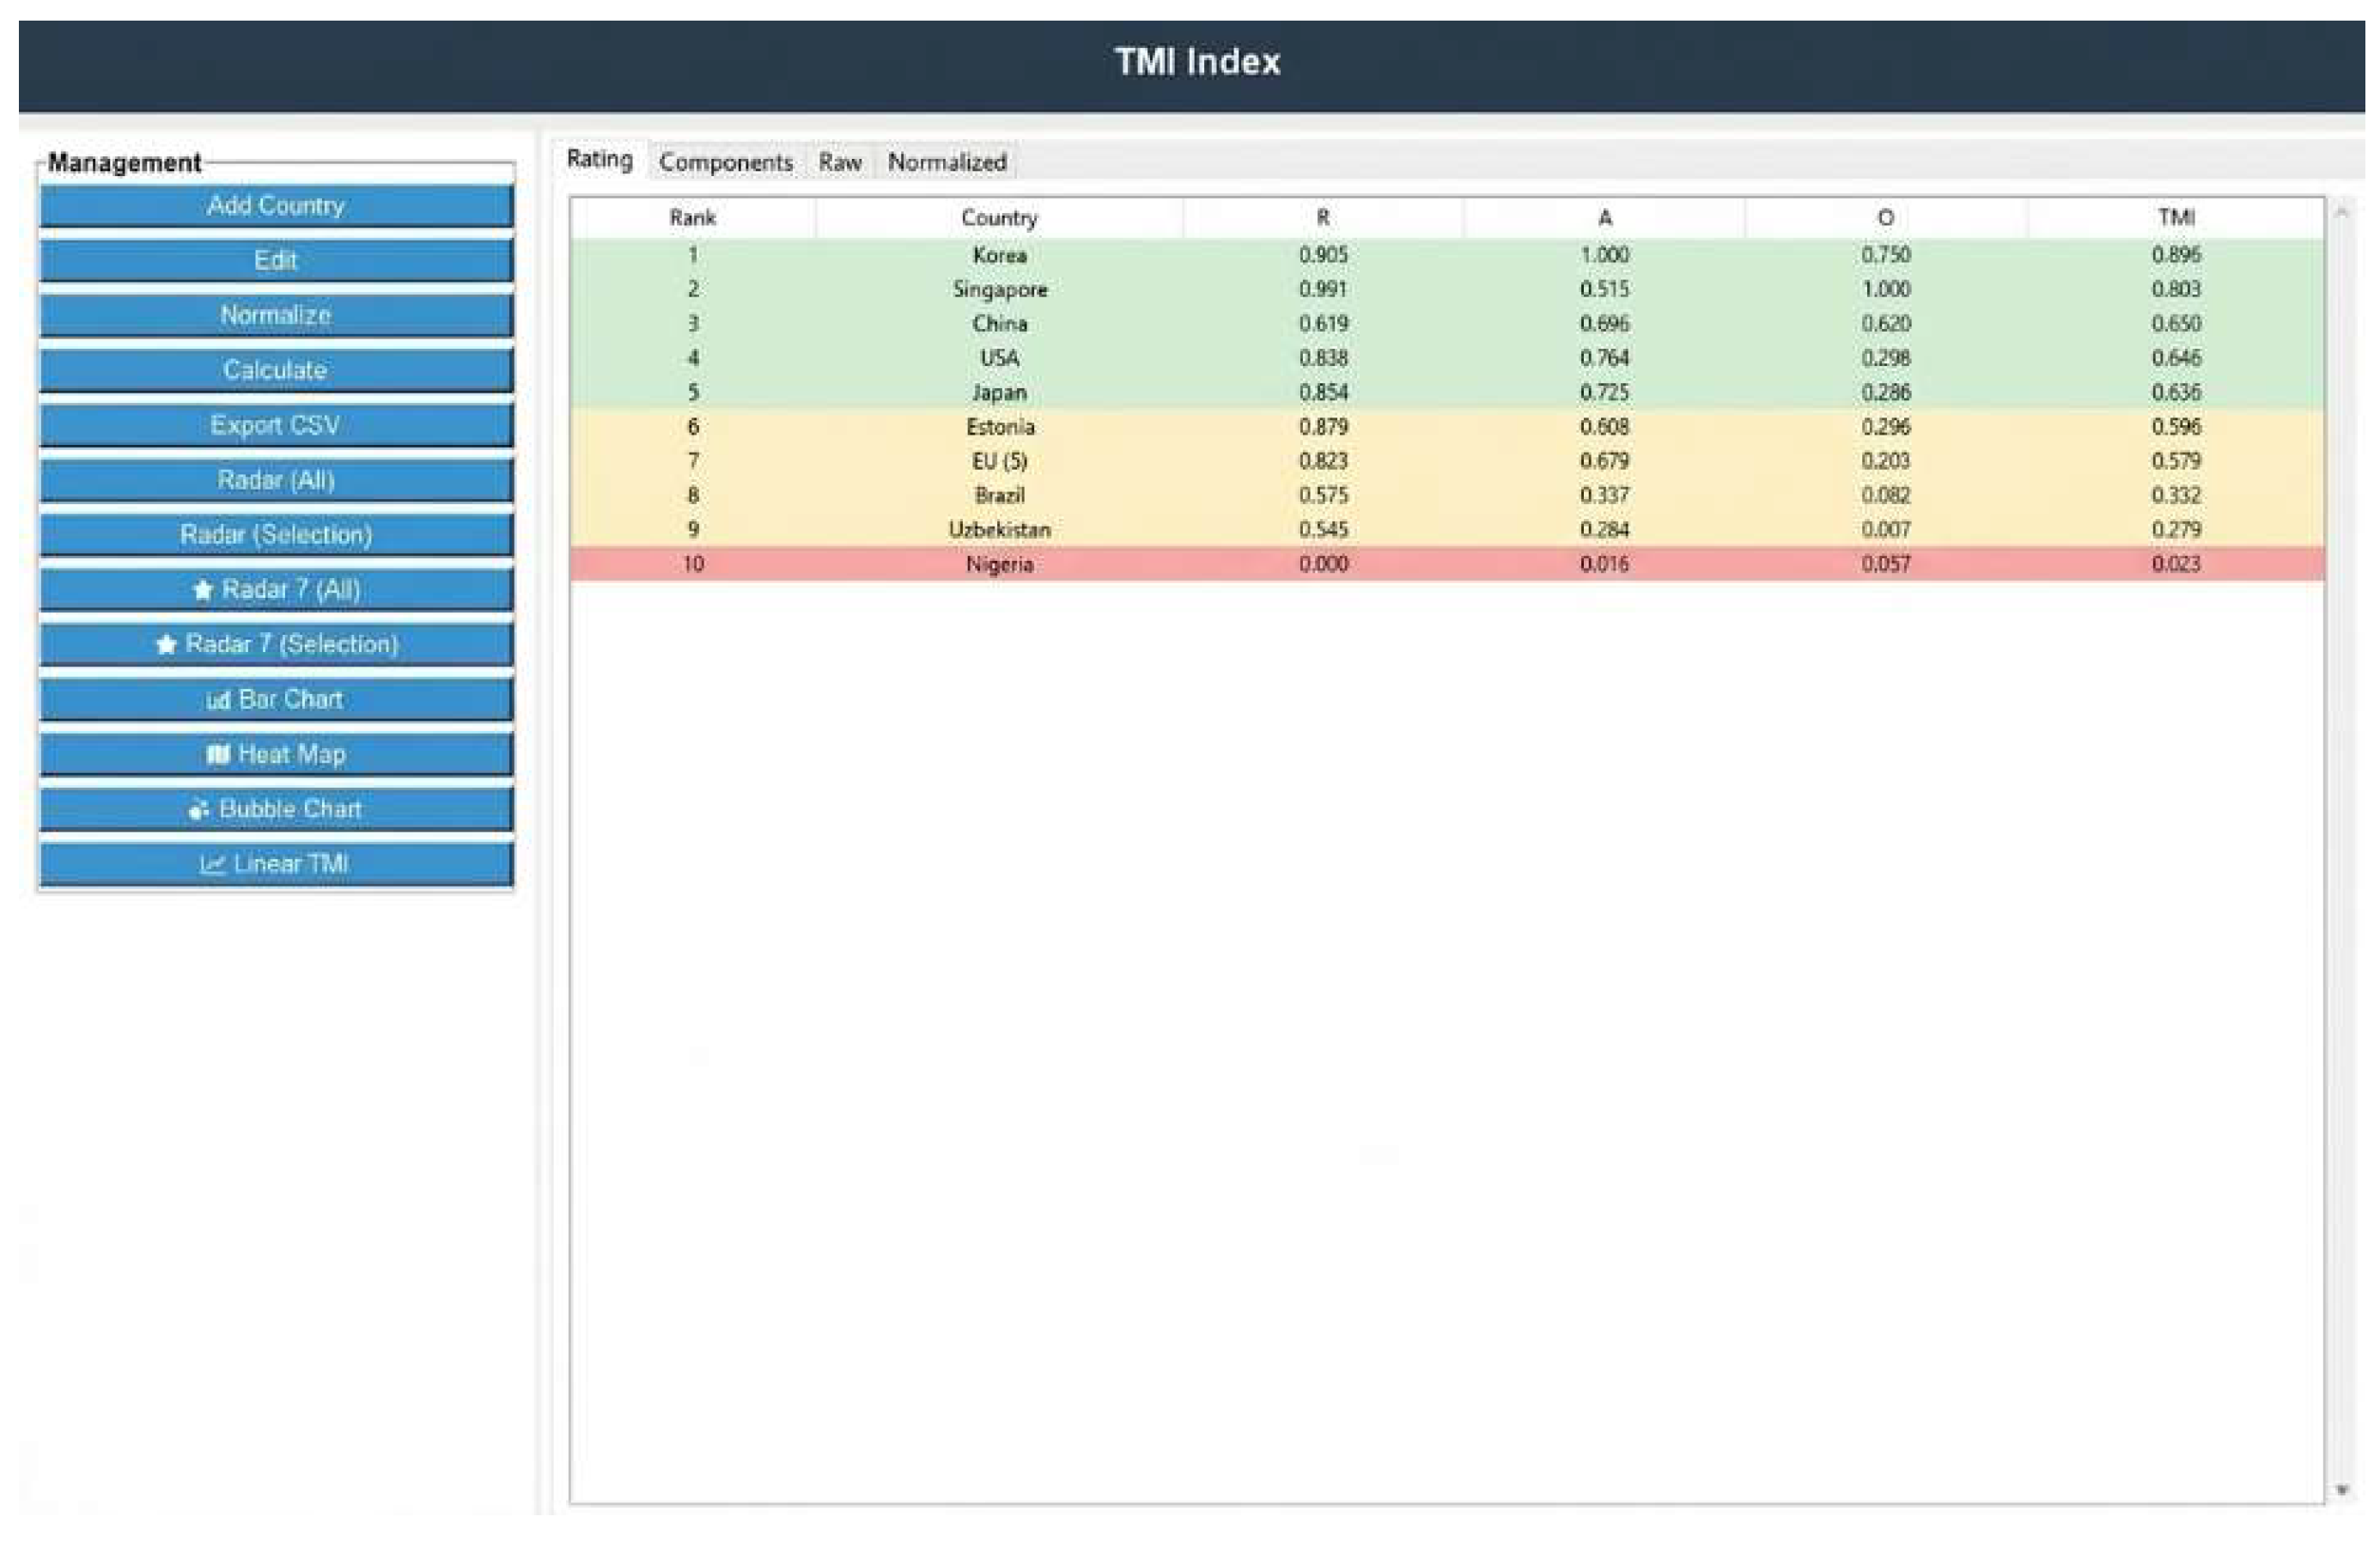
Table 1.
Positioning of TMI in the global digital index ecosystem.
| Parameter | GII (WIPO, 2024) | NRI (Portulans/Oxford, 2024) | IDI (ITU, 2024) | TMI (authors, pilot 2022) |
| Theoretical basis | Innovation ecosystems | Network readiness for ICT | Universal digital connectivity | Cybernetic speed of technology absorption (technology metabolism) |
| Structure | 78 indicators | 54 variables | 10 indicators | 3 components (R, A, O), 7 sub-indicators |
| Country coverage | 133 (117 excluded) | 133 | 165+ | 10 (pilot); 100+ (target horizon) |
| Central measurement object | Innovation potential and results | ICT readiness for economic and social impact | Universal and meaningful connectivity coverage | Speed of technological signal propagation through the closed loop R → A → O |
| Barrier for developing economies | 35+ input and 16+ output indicators required; 117 excluded | 54 variables required | 165 covered, but only "connectivity" | 7 sub-indicators from open sources – minimal statistical burden |
Sources: WIPO GII 2024; Portulans Institute NRI 2024; ITU IDI 2024; authors' TMI concept.
Table 3.
Raw data (10 countries, base year 2021–2022, version 2)
| Corrections: WGI USA 1.47→1.30 (verified via DataBank); ICT VA replaced with ICT goods exports % (WDI TX.VAL.ICTG.ZS.UN) | |||||||||
| R – READINESS | A – ABSORPTION | O – OUTPUT (corrected) | |||||||
| Country | EGDI 2024 | Internet % pop. 2022 | WGI GovEff 2022 ★ | R&D % GDP | Broadband per 100 inh. | Hi-tech exp. % manuf. exp. | ICT goods % goods exp. ★ | Base year | Note |
| USA | 0,9194 | 92,20 | 1,30 | 3,49 | 37,490 | 19,90 | 7,85 | 2021 | WGI corrected: 1.47→1.30 (DataBank) |
| China | 0,8718 | 75,61 | 0,41 | 2,43 | 41,370 | 30,22 | 22,64 | 2021 | |
| EU (5) | 0,9045 | 88,49 | 1,45 | 2,27 | 41,360 | 16,20 | 3,85 | 2021 | EU = avg DE+FR+IT+ES+NL |
| Japan | 0,9351 | 84,92 | 1,74 | 3,28 | 36,840 | 18,00 | 8,16 | 2021 | |
| Korea | 0,9679 | 97,17 | 1,36 | 4,91 | 45,450 | 36,01 | 27,66 | 2021 | |
| Singapore | 0,9691 | 95,95 | 2,23 | 2,16 | 27,550 | 54,97 | 32,68 | 2020 | Hi-tech sample leader |
| Estonia | 0,9727 | 91,52 | 1,38 | 1,77 | 39,720 | 20,63 | 7,28 | 2021 | |
| Uzbekistan | 0,7999 | 83,90 | -0,27 | 0,13 | 25,800 | 0,31 | 0,53 | 2021 | ★ Metabolic gap: high R, zero O |
| Nigeria | 0,4815 | 37,70 | -0,94 | 0,28 | 0,043 | 6,49 | 0,09 | 2019 | R&D 2019; BB ≈ 0 |
| Brazil | 0,8403 | 80,53 | -0,07 | 1,15 | 20,950 | 9,00 | 0,27 | 2020 | R&D 2020 |
Table 4.
Normalized values (min-max, 10 countries)
| Min-Max normalization · (x − min) / (max − min) · 0 = worst, 1 = best in sample | |||||||
| R – READINESS | A – ABSORPTION | O – OUTPUT | |||||
| Country | EGDI_n | Internet_n | WGI_n★ | RD_n | BB_n | Hitech_n | ICTgoods_n★ |
| USA | 0,8915 | 0,9164 | 0,7066 | 0,7029 | 0,8247 | 0,3584 | 0,2381 |
| China | 0,7946 | 0,6375 | 0,4259 | 0,4812 | 0,9101 | 0,5472 | 0,6919 |
| EU (5) | 0,8612 | 0,8540 | 0,7539 | 0,4477 | 0,9099 | 0,2907 | 0,1155 |
| Japan | 0,9235 | 0,7940 | 0,8454 | 0,6590 | 0,8104 | 0,3236 | 0,2476 |
| Korea | 0,9902 | 1,0000 | 0,7256 | 1,0000 | 1,0000 | 0,6531 | 0,8460 |
| Singapore | 0,9927 | 0,9795 | 1,0000 | 0,4247 | 0,6058 | 1,0000 | 1,0000 |
| Estonia | 1,0000 | 0,9050 | 0,7319 | 0,3431 | 0,8738 | 0,3718 | 0,2206 |
| Uzbekistan | 0,6482 | 0,7769 | 0,2114 | 0,0000 | 0,5672 | 0,0000 | 0,0135 |
| Nigeria | 0,0000 | 0,0000 | 0,0000 | 0,0314 | 0,0000 | 0,1131 | 0,0000 |
| Brazil | 0,7305 | 0,7202 | 0,2744 | 0,2134 | 0,4604 | 0,1590 | 0,0055 |
Table 5.
Component scores and TMI ranking (baseline scenario).
| COMPONENT SCORES AND TMI – THREE WEIGHTING SCENARIOS · VERSION 2 (WGI USA corrected; O = Hitech + ICT goods) | ||||||||||||||
| R – READINESS | A – ABSORPTION | O – OUTPUT | TMI – THREE SCENARIOS | |||||||||||
| Country | EGDI_n | Internet_n | WGI_n★ | → R | RD_n | BB_n | → A | Hitech_n | ICTgds_n★ | → O |
TMI 0.3/0.4/0.3 |
TMI 0.33/0.33/0.33 |
TMI 0.2/0.5/0.3 |
Rank |
| Korea | 0,9902 | 1,0000 | 0,7256 | 0,905 | 1,0000 | 1,0000 | 1,000 | 0,6531 | 0,8460 | 0,750 | 0,896 | 0,884 | 0,906 | 1 |
| Singapore | 0,9927 | 0,9795 | 1,0000 | 0,991 | 0,4247 | 0,6058 | 0,515 | 1,0000 | 1,0000 | 1,000 | 0,803 | 0,834 | 0,756 | 2 |
| China | 0,7946 | 0,6375 | 0,4259 | 0,619 | 0,4812 | 0,9101 | 0,696 | 0,5472 | 0,6919 | 0,620 | 0,650 | 0,644 | 0,658 | 3 |
| USA | 0,8915 | 0,9164 | 0,7066 | 0,838 | 0,7029 | 0,8247 | 0,764 | 0,3584 | 0,2381 | 0,298 | 0,646 | 0,633 | 0,639 | 4 |
| Japan | 0,9235 | 0,7940 | 0,8454 | 0,854 | 0,6590 | 0,8104 | 0,735 | 0,3236 | 0,2476 | 0,286 | 0,636 | 0,624 | 0,624 | 5 |
| Estonia | 1,0000 | 0,9050 | 0,7319 | 0,879 | 0,3431 | 0,8738 | 0,609 | 0,3718 | 0,2206 | 0,296 | 0,596 | 0,594 | 0,569 | 6 |
| EU (5) | 0,8612 | 0,8540 | 0,7539 | 0,823 | 0,4477 | 0,9099 | 0,679 | 0,2907 | 0,1155 | 0,203 | 0,579 | 0,568 | 0,565 | 7 |
| Brazil | 0,7305 | 0,7202 | 0,2744 | 0,575 | 0,2134 | 0,4604 | 0,337 | 0,1590 | 0,0055 | 0,082 | 0,332 | 0,331 | 0,308 | 8 |
| Uzbekistan | 0,6482 | 0,7769 | 0,2114 | 0,546 | 0,0000 | 0,5672 | 0,284 | 0,0000 | 0,0135 | 0,007 | 0,279 | 0,278 | 0,253 | 9 |
| Nigeria | 0,0000 | 0,0000 | 0,0000 | 0,000 | 0,0314 | 0,0000 | 0,016 | 0,1131 | 0,0000 | 0,057 | 0,023 | 0,024 | 0,025 | 10 |
Disclaimer/Publisher’s Note: The statements, opinions and data contained in all publications are solely those of the individual author(s) and contributor(s) and not of MDPI and/or the editor(s). MDPI and/or the editor(s) disclaim responsibility for any injury to people or property resulting from any ideas, methods, instructions or products referred to in the content. |
© 2026 by the authors. Licensee MDPI, Basel, Switzerland. This article is an open access article distributed under the terms and conditions of the Creative Commons Attribution (CC BY) license (http://creativecommons.org/licenses/by/4.0/).
Copyright: This open access article is published under a Creative Commons CC BY 4.0 license, which permit the free download, distribution, and reuse, provided that the author and preprint are cited in any reuse.