

Submitted:
13 March 2026
Posted:
16 March 2026
You are already at the latest version
Abstract
Muscle stem cells (MuSC) are the cellular source for generation and regeneration of skeletal muscle. To ensure correct muscle growth, MuSC self-renewal and differentiation need to be tightly regulated. Several signaling systems have been implicated in the control of MuSCs, among them Bone Morphogenetic Proteins (BMPs) and Notch, both of which promote MuSC proliferation and suppress differentiation. To better understand the mechanisms of function and the target genes regulated by BMP signaling in myogenesis, we investigated the transcriptional responses of adult mouse MuSCs to BMP6/4 using RNA-sequencing. BMP6/4-stimulation of freshly isolated MuSCs for one hour rapidly increased the expression of classical BMP target genes like Id1 and strongly induced expression of genes of the Notch pathway (Hes1, Hey1, Lfng, Snai1). In parallel, using Cleavage Under Targets and Tagmentation (CUT&Tag), we generated whole-genome binding profiles for the BMP pathway effectors pSMAD1/5/9 and SMAD4 and detected binding in promoters and potential regulatory elements of BMP targets and Notch pathway genes (Hes1, Hey1, Lfng, Snai1) indicating that BMP signaling directly influences Notch and that crosstalk between the two pathways regulates myogenesis.
Keywords:
bone morphogenetic protein
; Notch pathway
; adult muscle stem cell
; mouse
; RNA-sequencing
; transcription factor binding site
; pSMAD1/5/9
; SMAD4
; CUT&Tag
1. Introduction
Adult muscle stem cells (MuSCs), also known as satellite cells, play an important role in homeostasis and regeneration of the muscle. In healthy, uninjured skeletal muscle, quiescent MuSCs reside in their niche between the sarcolemma of the myofiber and the surrounding basal lamina. In this dormant state, they express the paired-box transcription factor Pax7 [1,2,3]. In response to physiological triggers such as physical exertion, muscle injury, or disease, MuSCs become activated and proliferate, starting to produce myogenic differentiation factors like MYOD and MYF5 in addition to PAX7. Some proliferating MuSCs self-renew and re-populate the stem cell pool, while others enter terminal differentiation. The latter is accompanied by the upregulation of the transcription factor myogenin (MYOG), the exit from the cell cycle, cell fusion, and formation of new muscle fibers [1,4,5].
MuSCs constantly respond to environmental triggers, e.g. a broad spectrum of signaling molecules such as hepatocyte growth factor (HGF), insulin-like growth factor (IGF-1), transforming growth factor-β (TGF-β), fibroblast growth factors (FGFs), bone morphogenetic proteins (BMPs), Wnts, and Notch ligands (reviewed in [6]). All of these initiate signaling cascades that have an impact on gene expression. In addition to cues provided by other cell types, MuSCs communicate with each other via cell-cell interactions [7,8] and autocrine signaling [9]. The molecular mechanisms and cues that integrate extrinsic and intrinsic information to regulate MuSC function are the subject of intense research.
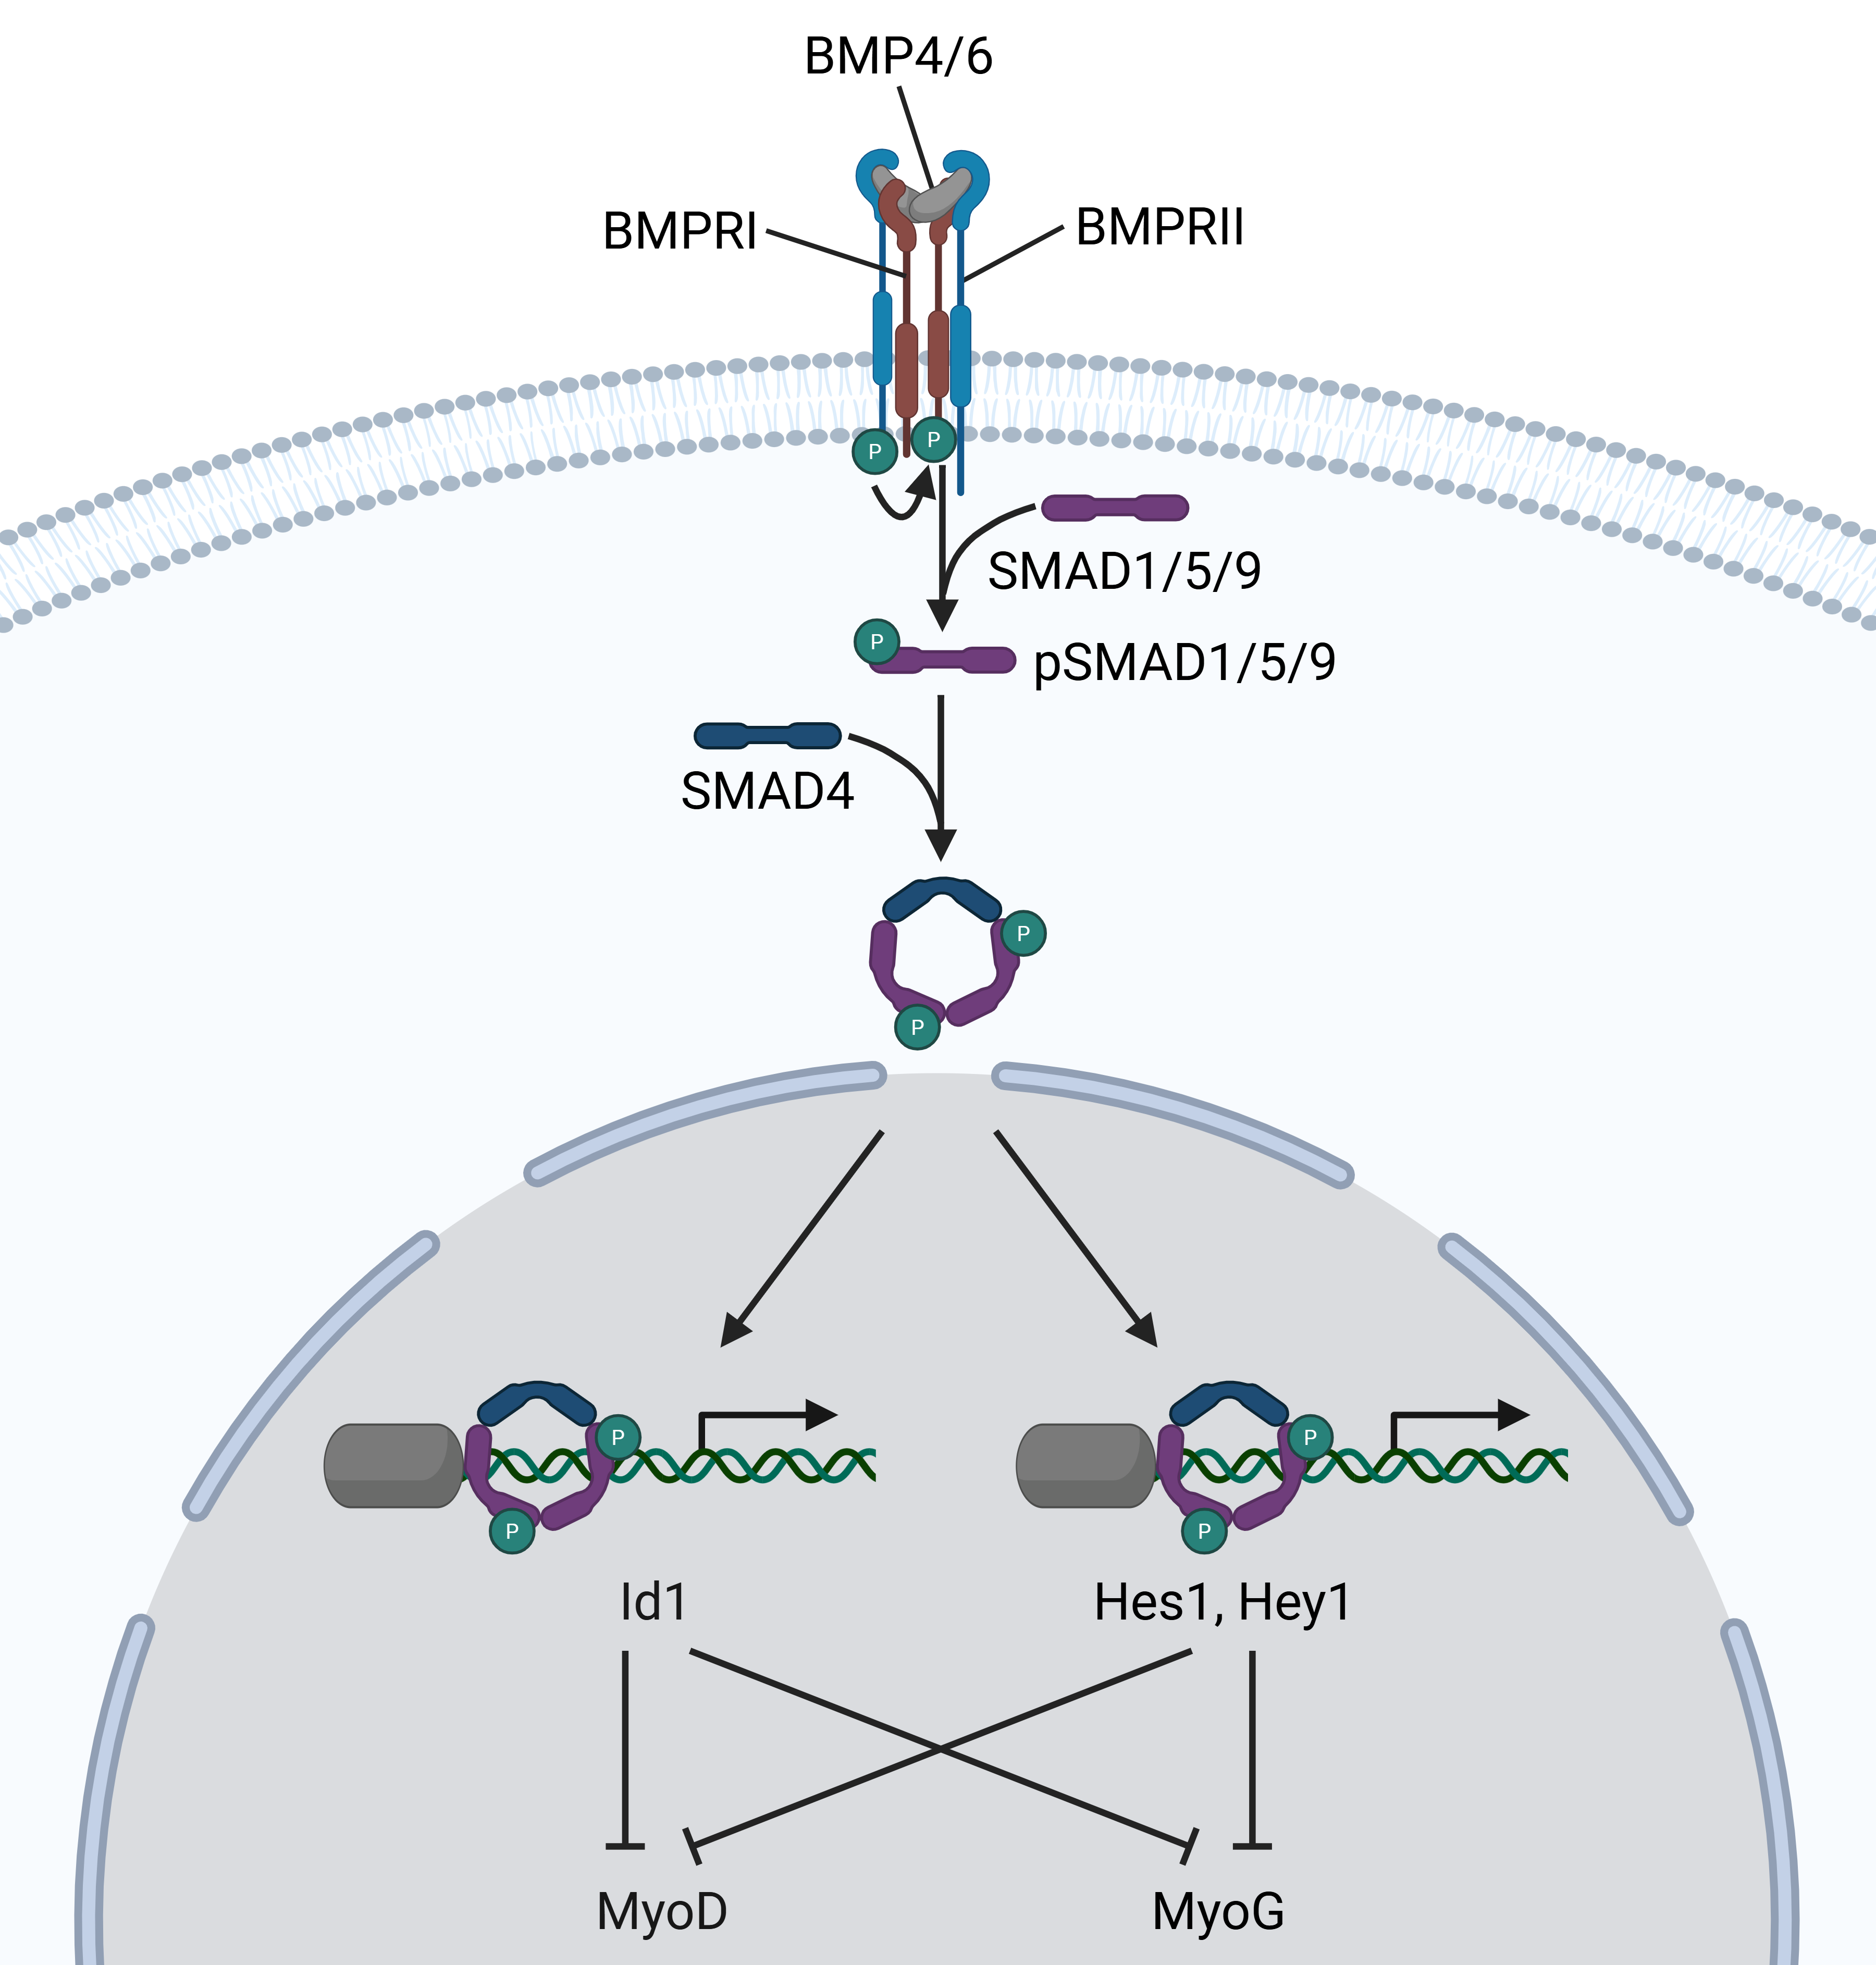
The BMP pathway is one of the signaling cascades regulating MuSCs [10,11]. BMPs belong to the TGF-β superfamily and bind to type I and II receptor serine/threonine kinases, which trans-phosphorylate the effector proteins SMAD1, SMAD5, and SMAD9 upon ligand binding [12]. Phospho-SMAD1/5/9 form complexes with SMAD4 and move into the nucleus to modulate transcription of BMP target genes such as members of the Inhibitor of DNA Binding (Id) gene family [13]. TGF-β, on the other hand, uses pSMAD2/3 and SMAD4 for signaling [12]. ID proteins are basic helix-loop-helix (bHLH) transcription factors and bind strongly to the E proteins E12 and E47, essential heteromeric partners of the myogenic factors MYF5, MYOD, and MYOG. As ID proteins tether away the E proteins, the myogenic factors lack their partners required for DNA binding [14].
Disruption of BMP signaling in postnatal myogenesis impairs the contribution of MuSCs to myofibers, resulting in hypotrophic myofibers and reduced overall muscle size [10]. BMP signaling regulates the balance between proliferation and differentiation of MuSCs, enhancing proliferation and decreasing differentiation [15,16]. Conversely, abrogation of BMP promotes differentiation [15,16]. BMPs increase the proportion of PAX7-positive MuSCs [15,16] and result in interference with MYOD1 function, possibly via ID1 [16]. BMP inhibition also exerts direct effects on the muscle fiber, resulting in muscle wasting [11,17].
The Notch pathway represents an evolutionarily conserved cell-to-cell communication system. Signal sending cells present membrane-bound ligands such as Delta-like (DLL1/3/4) or Jagged (JAG1/2) on their surface, while signal receiving cells express the Notch receptors (NOTCH1-4) [18]. Upon ligand binding, the Notch receptor is cleaved and the Notch intracellular domain (NICD) is released and translocates to the nucleus where it binds to RBPJ [19]. The NICD-RBPJ complex then activates the Notch target genes, among them the HES/HEY family of transcription factors [20]. Notch signaling is an important regulator of myogenesis, controlling the balance between self-renewal and differentiation of MuSCs in development and regeneration [21,22,23]. Notch signals inhibit differentiation via the HES/HEY factors that repress the expression of Myod and Myog [24,25,26]. DLL1 presented by neighboring myogenic cells provides the Notch activating signal in the developing and regenerating muscle [8,27,28]. Interestingly, Hes1, Myod, and Dll1 are expressed in an oscillating manner in activated MuSCs [26]. Mutations that interfere with the oscillatory expression shift the balance between MuSC proliferation and differentiation towards differentiation [8,26]. Notch signaling has an additional role in the adult muscle, which is to keep MuSCs in quiescence [29,30]. DLL4 presented by the muscle fibers is thought to provide the quiescence signal [31]. In summary, both the Notch and the BMP pathway work to keep muscle progenitor cells in a proliferative and undifferentiated state. Interestingly, a crosstalk between the BMP and the TGF-β pathway with the Notch pathway has been described previously in myogenic cells [32,33].
Here we use the RNA-sequencing (RNA-seq) and Cleavage under Targets and Tagmentation (CUT&Tag) technologies to characterize the effects of BMPs on MuSCs to better understand the tight regulation and fine tuning between proliferation and differentiation. Stimulation of MuSCs with BMP6 or BMP4 resulted in the upregulation of Notch pathway genes like Hes1, Hey1, Lfng, and Snai1. Additionally, our experiments revealed that transcription factors acting downstream of BMPs (i.e. pSMAD1/5/9 and SMAD4) bind to promoters and regulatory sequences of Notch pathway genes. These findings highlight the mechanism for a robust crosstalk between the BMP and the Notch pathway.
2. Results
2.1. Rapid Activation of the BMP Signaling Cascade in MuSCs upon BMP Stimulation
To investigate the effects of BMP stimulation on cultured MuSC from adult mice, we optimized the MuSC cultivation and stimulation (see also [10]). In addition to BMP4, which was used to activate the BMP pathway in MuSCs in previous studies [10,33,34], we stimulated the cells with BMP6 because we had previously observed BMP6 to be the most highly expressed BMP in MuSCs [10]. Since serum supplements contain undefined levels of BMPs, the cells were cultured in serum-free medium for several hours prior to BMP stimulation. Id1 transcript levels were reduced but not absent after starvation indicating that residual BMP activity was present (Figure 1A). To sequester remaining BMP, the serum-free medium was supplemented with different concentrations of soluble BMP receptor type 1A (sBMPR1A) which strongly reduced Id1 transcript levels (Figure 1A). In subsequent experiments, 200 ng/mL sBMPR1A was included during starvation.
Next, we examined the response of starved MuSCs to BMPs. For this purpose, we treated MuSCs with 100 ng/mL of BMP6 and BMP4 or control for 0.5 to 4.0 hours. Both BMP ligands induced Id1 transcripts that peaked after one hour of stimulation and decreased thereafter (Figure 1B, 1C). To exclude indirect effects, for instance those caused by ID activity, we stimulated the cells with BMP for one hour in all subsequent experiments.
We then tested phosphorylation of pSMAD1/5 in response to BMP4. Immunohistological analysis showed an increase in the intensity of anti-pSMAD1/5 staining in BMP4-treated versus control cells (Figure 1D, 1E). We also verified that the culture protocol did not result in a loss of PAX7 in a substantial proportion of cells (Figure 1D). Already after a short stimulation of 1 hour, BMP-treated cells displayed higher PAX7 levels than controls (Figure 1F), which is in agreement with previous observations [15,16].
2.2. Transcriptome Profiling Reveals Activation of Notch Genes in Response to BMP Stimulation
To systematically define the MuSC responses to BMP, we performed RNA-seq of BMP6- and BMP4-treated MuSCs as well as controls after 1 hour of stimulation. A total of 89 genes was differentially expressed by BMP6/4 treatment and the induced genes overlapped strongly (Figure 2A, 2B, Table S2; see Figure S2B for effects in individual samples). We identified 38 differentially expressed genes (DEGs) in response to BMP6 (37 upregulated and 1 downregulated) and 74 DEGs (69 upregulated and 5 downregulated) in response to BMP4 (Figure 2B; fold change (FC) of ≥2.0 or ≤0.5, false discovery rate derived by Benjamini-Hochberg correction (FDR(BH)) <0.1). The differentially regulated genes include 16 genes of the BMP and Notch signaling pathway as well as 2 additional genes controlling skeletal muscle development (Figure 2A, see Table S1 for full list). In summary, the vast majority of BMP-responsive genes was upregulated. Amongst the few downregulated genes was Myf5.
The gene ontology analysis [36,37] of the list of DEGs observed after BMP6/4 treatment demonstrated an enrichment of the terms TGF-β signaling, signaling regulating pluripotency, and Notch signaling (Figure 2C). Indeed, eight out of 89 genes regulated by BMP6/4 encode components of the Notch pathway. For instance, Hes1 and Hey1, two important Notch effector genes in MuSCs [38,39], were upregulated in the RNA-seq experiment. Additionally, Lfng, a gene encoding a glycosyltransferase that modifies the Notch receptors, and Snai1, a target of the Notch pathway known to modify MYOD function [40,41], were strongly upregulated by BMP6 and BMP4. The RNA-seq results were validated using mRNA expression arrays (Figures S1A, S2C, Table S3) and qPCR arrays (Figures S1B, S1C).
2.3. CUT&Tag Detects Direct Binding of BMP Pathway Effectors to Notch Genes
Next, we tested whether the upregulated Notch pathway genes were bound by SMADs, the transcriptional BMP effectors. For this, we performed CUT&Tag using antibodies against pSMAD1/5/9 and SMAD4, the oligomeric transcription factors that cooperatively bind to and activate BMP target genes. In addition, CUT&Tag using an antibody against H3K27ac, a histone modification that marks active promoters and enhancers [42], was performed. To directly correlate the CUT&Tag experiments and gene expression changes, the same cells were used in a parallel RNA-seq experiment (referred to as RNA-seq 2), which confirmed the results obtained in RNA-seq 1 (Figures S2A, S2C, Table S4).
We detected 7,339 pSMAD1/5/9 and 12,860 SMAD4 binding events in BMP6-stimulated cells in comparison to 949 and 8,577 peaks in control cells, respectively. The increases in SMAD peak numbers were larger than the 1.2-fold increase detected with the H3K27ac antibody, indicating that BMP6 treatment resulted in inducible SMAD binding. More specifically, differences in SMAD4 binding between BMP6-stimulated and control MuSCs were smaller than the differences in pSMAD1/5/9 binding. This could be due to the fact that pSMAD1/5/9 functions in a BMP-specific manner, whereas TGF-β and BMP signaling converge on SMAD4. Since TGF-β was not inhibited in our experiments, the different responses might point to residual TGF-β signaling. Heatmaps and average profiles of all pSMAD1/5/9 and SMAD4 peaks show that not only the number of binding sites but also the average peak heights were increased after stimulation with BMP6 (Figure 3A, S3A for pSMAD1/5/9, Figure 3B, S3B for SMAD4).
The majority of the pSMAD1/5/9 and SMAD4 peaks were detected in introns (~38%) or transcription start sites (TSSs; ~36%), followed by intergenic regions (~20%) and exons (7%). A similar distribution of peaks was identified for pSMAD1/5/9 and SMAD4 in BMP treatment and control (Figure 3C). In contrast, H3K27ac peaks were found at higher proportions in intronic regions (~53%) at the expense of TSSs (~19 %; Figure 3C). Almost all pSMAD1/5/9 and SMAD4 peaks were overlapping with H3K27ac peaks (range: 95.7 – 99.6%; data not shown).
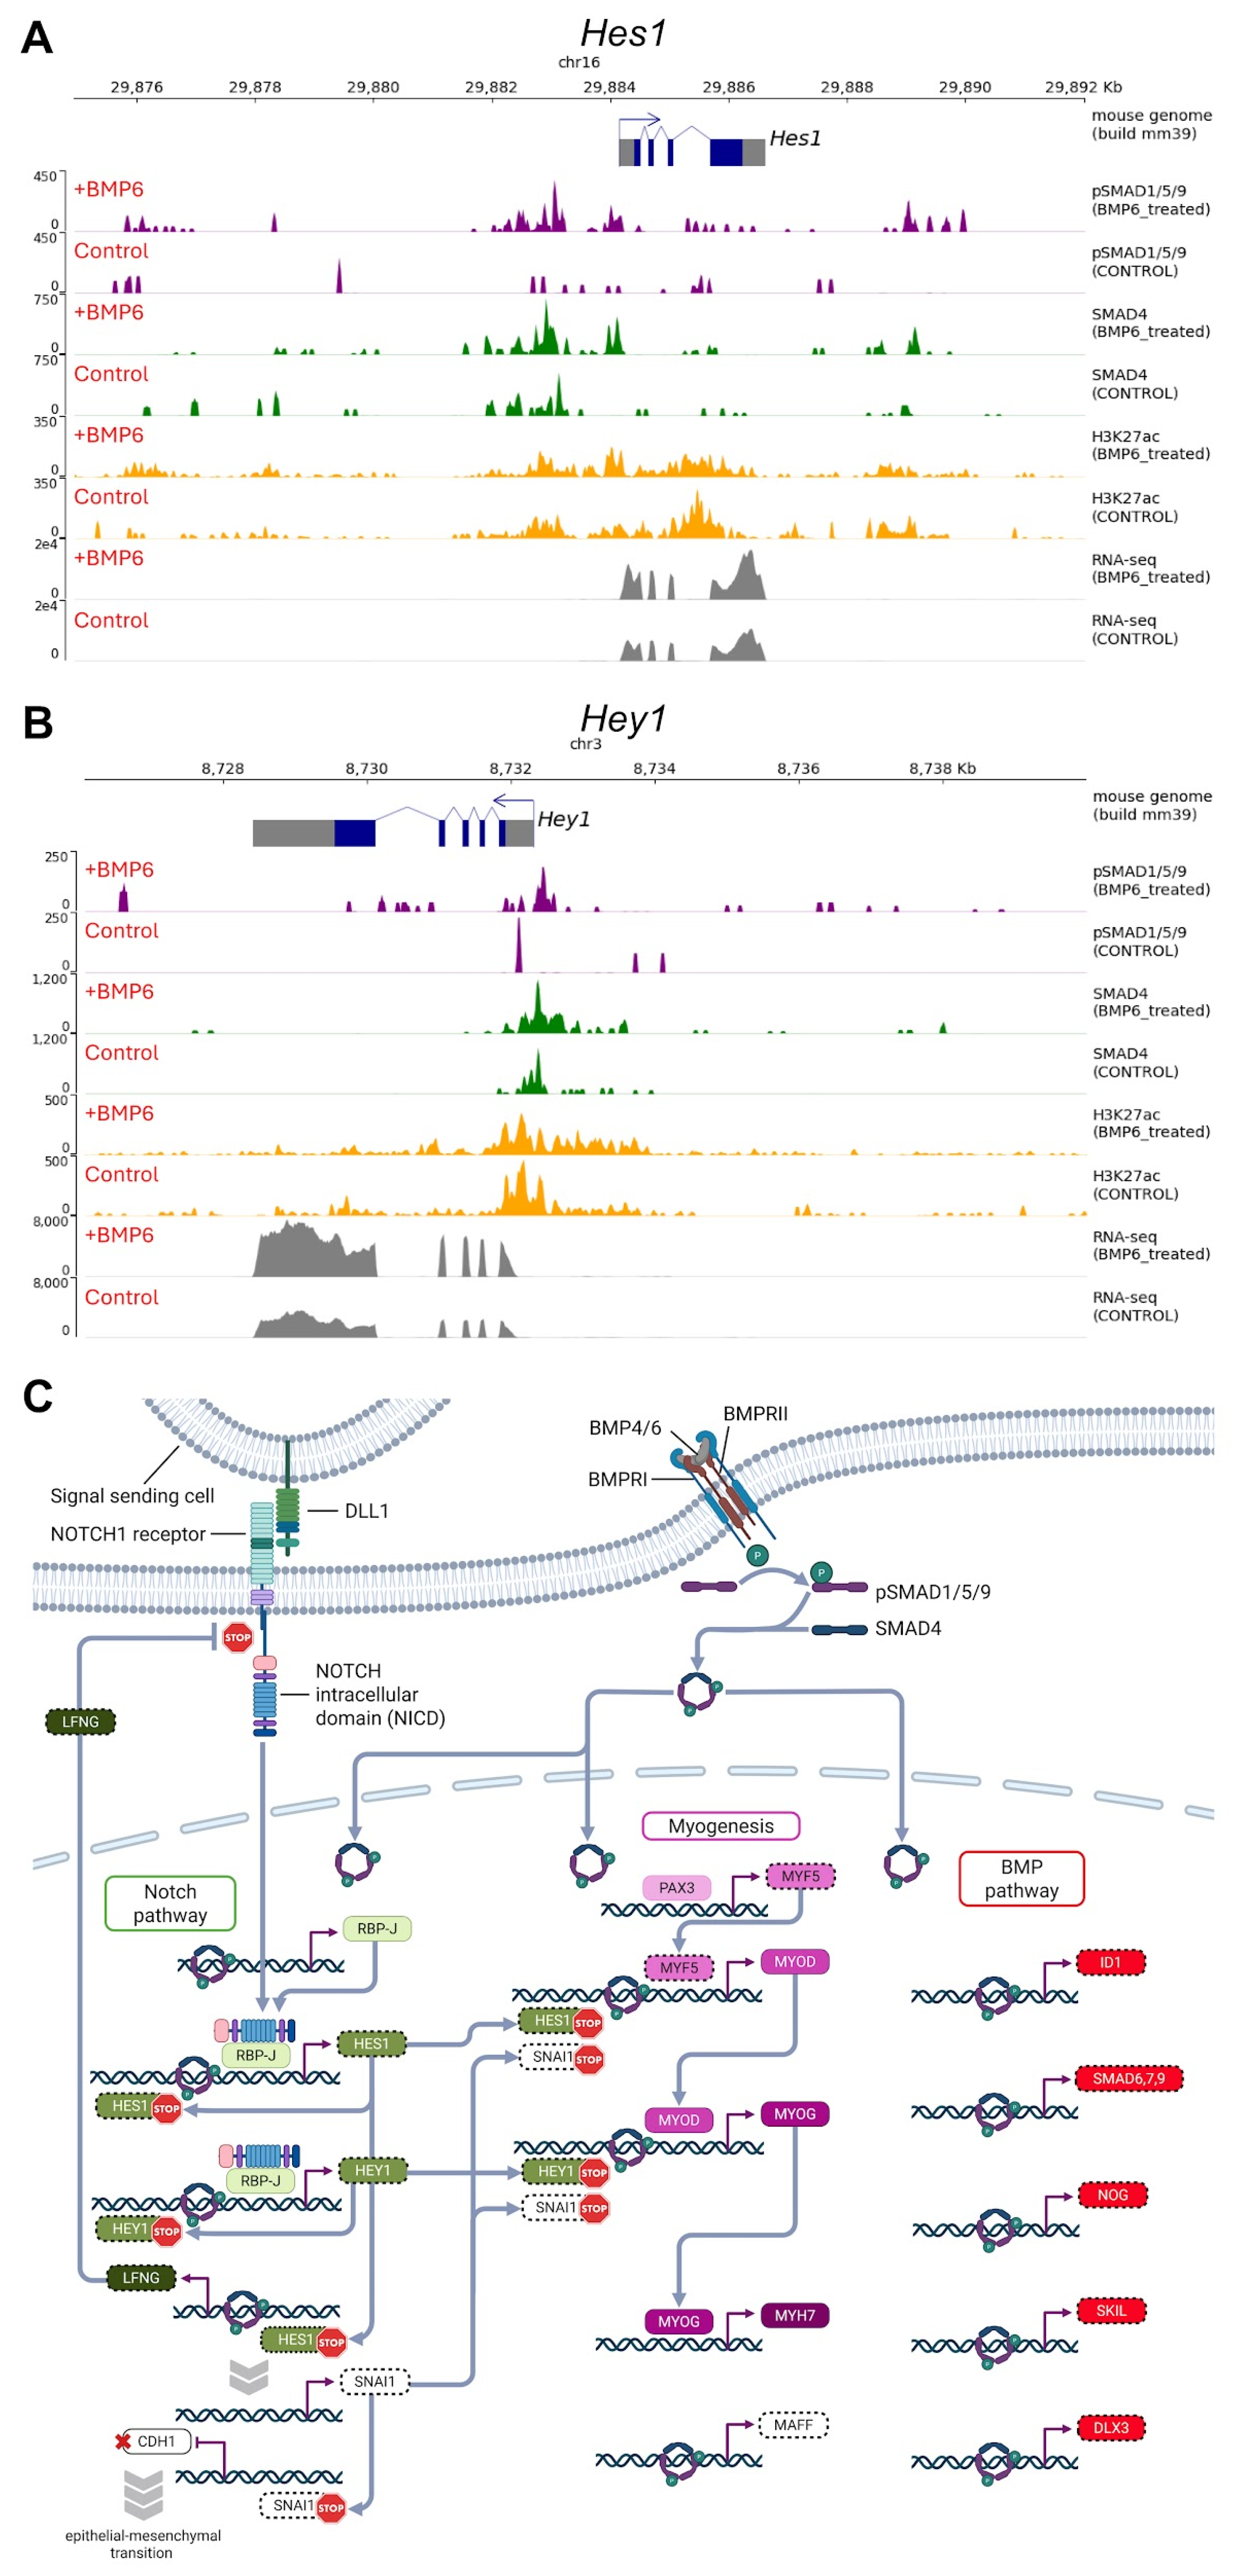
Analysis of the 89 DEGs from RNA-seq 1 demonstrated that the vast majority, 80 genes, were bound by pSMAD1/5/9 and/or SMAD4 in or 20 kb around the gene body in BMP-treated cells (Figure 3D). Of these DEGs, 39 genes were called as differentially bound in BMP-treated and control cells (Table S5). Among those were six BMP and Notch pathway genes, including BMP target gene Id1 (Figure S3C) and the Notch pathway genes Lfng (Figure S3D) and Snai1. Notch targets Hes1 (Figure 4A) and Hey1 (Figure 4B) also showed an increase in pSMAD1/5/9 and SMAD4 binding upon BMP6 treatment although the peaks were not called as differential.
No differential H3K27ac peaks were detected in and around DEGs, reflecting the short stimulation time combined with the stability of this histone mark. Thus, we assign the observed changes in gene expression to differences in transcription factor binding, e.g. binding of new sites, changes in binding strength, or binding of required co-factors, rather than changes of the chromatin state. The data generated in the CUT&Tag and RNA-seq 2 experiments can be freely explored in a custom UCSC browser session with the link: https://genome.ucsc.edu/s/mschue/mouse_Smad4_pSmad1. In summary, we found that Notch gene activation in response to BMP stimulation correlated with increased binding of pSMAD1/5/9 and SMAD4.
In conclusion, stimulation of adult mouse MuSCs with BMP6 or BMP4 leads to quick changes in the expression of BMP and Notch pathway genes. One hour after BMP6/4 stimulation, we detected a consensus set of genes that was differentially expressed in distinct experimental settings. Using CUT&Tag, we demonstrated that the BMP pathway effectors pSMAD1/5/9 and SMAD4 bound to the majority of DEGs in BMP-treated cells. Increases in binding strengths upon BMP-binding were observed for Notch pathway genes such as Hes1, Hey1, Lfng, and Snai1 underlying the fast upregulation of Notch genes in response to BMP stimulation.
3. Discussion
In this study, we investigated the transcriptional response of cultured MuSCs to a short-term BMP stimulation. This short treatment sufficed to enhance PAX7 protein levels. Using RNA-seq, microarray, and qPCR array analyses, we detected the fast differential regulation of genes in response to BMP exposure. CUT&Tag analyses using anti-pSMAD1/5/9 and anti-SMAD4 antibodies revealed binding to promoters and regulatory elements of DEGs. A substantial proportion of the DEGs bound by SMADs encode components of the Notch signaling pathway, an important negative regulator of MuSC differentiation. Consequently, our experiments provide mechanistic insight into the crosstalk between BMP and Notch signaling and indicate that BMPs directly regulate genes of the Notch pathway.
Our CUT&Tag analysis demonstrates that pSMAD1/5/9 binding responded strongly to BMP6. In contrast, SMAD4 binding responses to BMP6 were less pronounced. SMAD4 is known to be recruited to BMP and TGF-β target genes [43]. Therefore, residual TGF-β present in our experimental conditions might account for a background of SMAD4 binding and a blunted BMP6 response.
We show here that BMP6 stimulates the expression of a number of genes in the Notch pathway, among them the Notch target genes Hes1 and Hey1. Previous analyses had already noted that Hes1/Hey1 are induced by BMP [33,44] or TGF-β [32,45,46] in different cell types and relied on the use of Hes1/Hey1 reporter constructs and forced NICD expression to analyze this mechanistically. Some of these studies implicated an NICD-mediated recruitment of SMAD1 or SMAD3 in the regulation of Hes1/Hey1 [32,44]. Others suggest a biphasic response of Hey1 to TGF-β, with a first phase that depends on SMAD3/SMAD4 recruitment but not Notch signaling, and a second phase that is regulated via the BMP-dependent production of a Notch ligand [46]. The CUT&Tag data demonstrate that both, pSMAD1/5/9 and SMAD4, bind to the Hes1 and Hey1 promoters after short-term BMP stimulation. Moreover, binding of pSMAD1/5/9 at these sites was markedly increased in the presence of BMP. This finding supports the direct stimulation of Hes1/Hey1 through canonical BMP signaling, i.e. through the recruitment of pSMAD1/5/9-SMAD4 heteromers to Hes1/Hey1 promoters and regulatory elements. In support of this notion, none of the Notch ligands was regulated by BMP signaling. Finally, the early timepoint of induction of Notch signaling components by BMPs excludes indirect effects that would rely on newly synthesized proteins. Despite this, cooperative binding and indirect recruitment of transcription factors are frequent mechanisms [47] and might contribute to the BMP-dependent control of Hes1/Hey1.
The HES/HEY family of transcriptional repressors [48] are important effectors of the Notch pathway in MuSCs and suppress myogenic differentiation [25]. Interestingly, they are involved in tightly controlled HES1-dependent feedback loops that result in an oscillatory expression of Hes1 [8,26,39] and a repression of LFNG, a glycosyltransferase that modifies the Notch receptors [49] (Figure 4C). Despite the negative feedback loop, Hes1 was induced at high levels by short-term BMP treatment (7- to 10-fold). The high level of induction indicates that the feedback loop was not yet functional in our setting, probably due to delays in Hes1 autoinhibition caused by transcript splicing and translation [39]. Similarly, Id1 is strongly induced at this early timepoint but ID1-dependent inhibition of bHLH transcription factors like MYOD mediated by the tethering of E12 and E47 appear not to have set in, as classical MYOD targets like Des and Ckm are not differentially regulated. To summarize, the short-term stimulation protocol combined with state-of-the-art technologies such as RNA-seq and CUT&Tag allowed us to define direct BMP target genes.
In conclusion, BMP suppresses myogenic differentiation and enhances PAX7, a master regulator that keeps MuSCs in an undifferentiated state. Our data indicate that BMP treatment represses myogenesis by indirect mechanisms at later timepoints, namely by controlling Id1 and the Notch effectors Hes1/Hey1 that cooperate to suppress muscle differentiation.
4. Materials and Methods
4.1. Animals
RNA-seq 1, microarrays, pathway arrays, the immunofluorescence experiment, and the initial condition tests were performed on 4- to 8-week-old adult female wild-type C57BL/6J mice. RNA-seq 2 and the CUT&Tag experiments were performed on 9-week-old female B6.Cg-Tg(Pax7-EGFP)15Tajb/J mice (RRID:IMSR_JAX:036759) [50]. Mice were fed ad libitum and held in specific-pathogen-free conditions on a 12 h dark-light cycle. All animal experiments were registered, performed in accordance with institutional guidelines for the care and use of laboratory animals, and approved by the local authorities (LaGeSo Berlin, T0183/15, approved on 10 July 2017 and X9008/20, approved on 18 September 2020)
4.2. Magnetic Cell Separation (MACS®), Fluorescence Activated Cell Sorting (FACS) Isolation, and Culture of MuSCs
For RNA-seq 1, microarrays, pathway arrays, the immunofluorescence experiment, and the initial condition tests, MuSCs were isolated from mouse forelimb, hindlimb, and dorsal muscles using the Skeletal Muscle Dissociation Kit (Miltenyi Biotech, 130-098-305) followed by MACS® as described [10]. Briefly, after lysis of red blood cells (Red Blood Cell Lysis Solution, Miltenyi Biotech, 130-094-183), the MACS® procedure removed non-target cells with a cocktail of monoclonal antibodies (anti-CD45, CD11b, SCA1, CD31) conjugated to MACS® microbeads (Satellite Cell Isolation Kit, Miltenyi Biotech, 130-104-268). A positive selection of target cells was then performed using MACS® microbeads conjugated to anti-integrin α-7 (Miltenyi Biotech, 130-104-261). One mouse yielded between 170,000 and 210,000 MuSCs that were seeded into growth factor reduced Matrigel® (Corning, 356231)-coated 24 well plates at a density of 7,500 cells/cm2 in plating medium containing DMEM (Gibco, 41966029), 15% fetal bovine serum (FBS, Gibco), 2.5 ng/mL basic FGF (Sigma, F3133), 10 ng/mL leukemia inhibitory factor (BioChrom, W1655950010), and 1% Pen/Strep (Gibco). The cells were maintained in a humidified hypoxic atmosphere of 3% O2 and 5% CO2 at 37 °C. After 24 hours in culture, 1x B27 without vitamin A (Gibco, 12587010) was added to the plating medium and the MuSCs were cultured for another 24 hours for most experiments.
For the CUT&Tag experiments and RNA-seq 2, mononucleated cells were isolated from mouse forelimb, hindlimb, dorsal, and breast muscles by mincing the tissue for 10 minutes and digesting the pieces with a solution containing DMEM/F-12 (Gibco, 31331028), 1% Pen/Strep (Gibco), 0.5 U/mL collagenase (Roche, 10103586001), 3 U/mL dispase (Roche, 4942078001), and 0.2% BSA in a shaking water bath at 70 rpm and 37 °C for 1.5 hours. The slurry was then mixed with ice-cold DMEM. After a centrifugation at 50 x g for 5 minutes at 4 °C, the supernatant contained mononucleated cells and was collected. The isolated cells were passed through subsequent 100 µm, 70 µm, and 40 µm cell strainers, followed by a centrifugation step at 600 x g and 4 °C for 5 minutes. After resuspension, the cells were seeded in plating medium containing DMEM (Gibco, 41966029), 15% FBS (Gibco), 2.5 ng/mL basic FGF (Sigma, F3133), 10 ng/mL leukemia inhibitory factor (Sigma, ESG1106), and 1% Pen/Strep (Gibco) into growth factor-reduced Matrigel® (Corning, 356231)-coated 10 cm dishes and maintained in a humidified hypoxic atmosphere of 3% O2 and 5% CO2 at 37 °C. Approximately after 20 hours, the cells were washed, trypsinized, centrifuged, and resuspended in FACS buffer containing HBSS (Gibco, 14175053), 25 mM HEPES (PAN, P05-01100), 1% Pen/Strep, 2 mM EDTA pH 8.0 (Thermo Fisher, 15575-038), and 1% BSA. Cells were sorted at a flow rate of 2.0 and an event rate of 5,000 events per second using an BD FACSAria I flow cytometer (RRID:SCR_019595) with BD FACSDiva v9.4 (RRID:SCR_001456). To enrich for MuSCs, small (SSC-A vs. FSC-A), singlet (FSC-W vs. FSC-H and SSC-W vs. SSC-H), GFP-positive, Phycoerythrin (PE)-low (PE-A vs. GFP-A) cells were sorted, seeded in plating medium supplemented with 1x B27 without vitamin A (Gibco, 12587010) into growth factor reduced Matrigel® (Corning, 356231)-coated 6 well dishes at a density of 4,250 to 7,500 cells/cm2. They were maintained in a humidified hypoxic atmosphere of 3% O2 and 5% CO2 at 37 °C for 48 hours with daily medium changes.
4.3. Stimulation of MuSC with BMPs
After a total of 2 to 3 days in culture, the medium was replaced by serum-free medium for six hours. In addition, 0, 200, 500, or 1000 ng/mL of sBMPR1A (recombinant mouse BMPR1A-Fc chimera, R&D Systems, 437-MR) was added to the serum-free medium. After starvation, the cells were stimulated with 100 ng/mL BMP6 (R&D Systems, 507-BP) or BMP4 (R&D Systems, 314-BP) in serum-free medium for 0.5, 1.0, 2.0, 3.0, or 4.0 hours.
BMP6 stimulation was used for RNA-seq 1 and 2, microarrays, and the CUT&Tag experiments. BMP4 stimulation was performed for RNA-seq 1, pathway arrays, and the immunofluorescence experiment. The solution used to reconstitute the BMPs (4 mM HCl containing 0.1% BSA) served as a control in all experiments.
4.4. RNA Isolation for the Condition Tests, RNA-seq 1, Microarrays, and Pathway Arrays
Cultured MuSCs were lysed (RLT buffer, Qiagen) and homogenized (QIAshredder, Qiagen) and total RNA was extracted according to the instructions provided by the manufacturer of the RNeasy Micro Kit (Qiagen, 24004). Residual DNA was removed using the RNase-Free DNase Set (Qiagen, 79254). RNA quantity and quality were assessed using a NanoDrop® 2000c spectrophotometer (Thermo Fisher Scientific, RRID:SCR_020309).
4.5. Preparation of Cells for RNA-seq 2 and the CUT&Tag Experiments
Shortly before harvesting, we verified microscopically that the majority of MuSCs was still PAX7-positive. The cells were washed, trypsinized, centrifuged, and resuspended in serum-free growth medium. To confirm that the expression profile of the FACS-sorted cells was comparable to that generated by RNA-seq 1, 10% of the cell suspension was set aside and frozen at -80 °C for RNA isolation followed by an additional RNA-seq. The remaining 90% was fixed in 0.1% formaldehyde for 2 minutes followed by quenching with glycine at twice the molar concentration of formaldehyde for 5 minutes. After centrifugation at 4 °C for 4 minutes at 1,300 x g, the pellet was resuspended in CUT&Tag wash buffer (20 mM HEPES-NaOH pH 7.5, 150 mM NaCl (Sigma-Aldrich, 71386), 500 µM Spermidine (Sigma-Aldrich, S0266), 1x Complete protease inhibitor EDTA-free (Roche, 5056489001)). The cells were then counted and slowly frozen with 10% DMSO.
4.6. RNA Isolation for RNA-seq 2
Total RNA was extracted from cultured MuSCs using the NucleoSpin RNA XS kit (Macherey-Nagel, 740902) according to the manufacturer’s instructions. RNA quantity and quality were assessed using a NanoDrop® 2000c spectrophotometer (Thermo Fisher Scientific, RRID:SCR_020309).
4.7. Real-Time qPCR to Determine the Starvation and Stimulation Conditions
Total RNA from BMP6/4-treated and control cells was extracted and DNase-treated as described above. cDNA synthesis was performed with random hexamers using the SuperScript III Reverse Transcriptase Kit (Invitrogen, 18080093) according to the manufacturer's instructions. Quantitative real-time PCR (qPCR) was performed with the ABI PRISM 7000 Sequence Detection System (Applied Biosystems, RRID:SCR_021899) and the Power SYBR Green PCR Master Mix (Applied Biosystems, 10658255). Each PCR reaction was prepared in triplicate using the following oligonucleotide sets: Id1 forward: 5′-GGT GGT ACT TGG TCT GTC GG-3′, Id1 reverse: 5′-CCT TGC TCA CTT TGC GGT TC-3′ and Gapdh forward 5′-GCA TGG CCT TCC GTG TTC-3′, Gapdh reverse: 5′-GGG TGG TCC AGG GTT TCT TAC TC-3′. Ct values were given in relation to the endogenous housekeeping gene Gapdh, the expression of which was not affected by BMP6 and BMP4 treatment (see Figures S1B, S1C). Figure 1B is a new qPCR on the same cDNA as Figure S1D from ref. [10]. Fold change calculations were performed according to the PCR efficiency-corrected method described by Pfaffl [35].
4.8. RNA-seq 1
Two biological replicates for BMP6-treatment versus control and BMP4-treatment versus control were used for the RNA-seq 1 experiment. Total RNA from BMP6/4-treated and control cells was extracted and DNase-treated as described above. A high RNA integrity corresponding to an RNA integrity number (RIN) of >8 was confirmed using the BioAnalyzer 2100 (Agilent Technologies, RRID:SCR_019715) and the RNA 6000 Nano Kit (Agilent Technologies, 5067-1511). Stranded libraries were prepared with the SureSelect strand-specific RNA library prep for Illumina multiplexed sequencing kit (Illumina), quality checked, and sequenced in the single-end 50 bp mode to more than 40 million reads per sample with the Illumina HiSeq 4000 machine (Illumina, RRID:SCR_016386; performed by BGI Genomics, RRID:SCR_024848).
4.9. RNA-seq 2
Two biological replicates per treatment were used for the RNA-seq 2 experiment. Total RNA from BMP6-treated and control cells was extracted and DNase-treated as described above. A high RNA integrity corresponding to a RIN of >8 was confirmed using the Bioanalyzer 2100 (Agilent Technologies, RRID:SCR_019715) and the RNA 6000 Pico kit (Agilent Technologies, 5067-1513). Unstranded libraries were prepared by following the Smart-seq2 protocol until the PCR preamplification of the cDNA [51] and continued with the Nextera XT DNA library prep kit (Illumina, FC-131-1096) using the MGI universal and index primer for PCR amplification. The libraries were quality checked and sequenced in paired-end 100 bp mode to more than 60 million reads per sample with the DNBSEQ-G400 machine (RRID:SCR_017980; performed by BGI, Genomics, RRID:SCR_024848).
4.10. Bioinformatic Analysis of Transcript Abundance
Reads were aligned to the mouse reference assembly GENCODE M32 (GRCm39) using STAR v2.7.11a (RRID:SCR_004463) [52]. The resulting *.sam files was converted to *.bam files and then sorted and indexed using SAMtools v1.17 (RRID:SCR_002105) [53]. The sorted *.bam files were passed to StringTie v2.2.1 (RRID:SCR_016323) [54]. The resulting *.gtf files were merged using stringtie merge and normalized read counts (transcripts per million (TPM) and fragments per kilobase of transcript per million reads mapped (FPKM)) were generated using stringtie ballgown. For differential expression analysis, StringTie ballgown outputs were converted to raw counts using the prepDE python script [54]. The DESeq2 v3 R module (RRID:SCR_015687) [55] was then run with default parameters to determine fold changes and FDRs(BH). A fold-change of ≥2.0 or ≤0.5 between stimulated and control samples and an FDR(BH) of <0.1 was used as a cut-off to define DEGs. Genes encoding long-noncoding RNAs, miRNAs, antisense transcripts, and pseudogenes, i.e. genes starting with “Gm” or “Mir” or ending in “Rik”, “os” plus an optional number, or “-ps” plus an optional number were not used for subsequent analyses. Merged lists from StringTie without an assigned gene were also excluded. Heatmaps for regulated genes were calculated from the raw fragment counts (RNA-seq) or raw intensity scans (Microarrays) using the standard iDEP v2.4.4 pipeline with a paired (treated versus control) design and default settings [56]. Venn diagrams were created with eulerr.co (last accessed: 26 February 2026) [57]. Raw and processed RNA-seq files are available on the Gene Expression Omnibus (GEO, RRID:SCR_005012) database under the accession numbers GSE159594 (for RNA-seq 1) and GSE305746 (for RNA-seq 2).
4.11. Microarray Experiments and Their Bioinformatic Analysis
Three biological replicates per treatment were used for microarray experiments. Total RNA from BMP6-treated and control cells was extracted and DNase-treated as described above. A RIN of >9 was confirmed using the Bioanalyzer 2100 (Agilent Technologies, RRID:SCR_019715) and the RNA 6000 Nano Kit (Agilent Technologies, 5067-1511). cDNA was synthesized using the GeneChip Whole Transcript (WT) Expression Plus Kit (Applied Biosystem, 902280), followed by fragmentation and end-labeling using the GeneChip WT Terminal Labeling Kit (Applied Biosystems, 900670). The labeled cDNA was hybridized onto the Mouse Gene (MG) 1.0 ST Array (Applied Biosystems, 901169) at 45 °C for 16 hours. After hybridization, the arrays were washed on the Affymetrix GeneChip 450 Fluidics Station Microarray Processor (Applied Biosystems, 00-0079, RRID:SCR_018034) and scanned with the GeneChip 3000 7G Microarray Scanner (Applied Biosystems, 00-0210, RRID:SCR_019341). The Mouse Gene 1.0 ST Array contains 750,000 unique 25-mer oligonucleotide probes interrogating 28,853 murine genes with an average of 27 probes over the entire length of each gene.
Microarray data were analyzed with the R packages affy (RRID:SCR_012835) [58], oligo (RRID:SCR_015729) [59], and limma (RRID:SCR_010943) [60] of the Bioconductor suite (RRID:SCR_006442) [61]. Data quality control was carried out by creating pseudo images for each array using the oligo package and visually inspecting them for the presence of artifacts. The raw count *.CEL files were normalized using Robust Multichip Averaging (RMA) with quantile normalization, background correction, and annotation (using the MG 1.0 ST Chip Description File "mogene10stv1cdf" from Bioconductor). For downstream analyses, probes without gene annotations and lowly expressed genes (log2(normalized intensity) <5 in >50% of the samples) were removed. Different splice isoforms of the same gene were then summarized by keeping only the median of their intensities. Differential gene expression, fold changes, and FDRs(BH) were calculated using the limma package. Raw and processed microarray files are available in the GEO database (RRID:SCR_005012) under the accession number GSE127798.
4.12. Enrichment and Pathway Analysis
BMP signaling pathway (GO:0030509), Notch signaling pathway (GO:0007219), and skeletal muscle tissue development (GO:0007519) gene lists from AmiGO 2 (RRID:SCR_002143) v2.5.17 (from 13 October 2025) were displayed with “regulates”, filtered for mouse genes, and exported [36,37,62]. From the resulting gene lists, we removed complexes whose individual members were included in the same pathway list and corrected the spelling of human genes, often prefixed with “m”, to the consensus mouse gene names (see resulting lists in Table S1).
4.13. Pathway-Focused PCR Arrays
Six and five biological replicates per treatment were used for the BMP and the Notch pathway PCR array, respectively. Total RNA from BMP4-treated and control cells was extracted and DNase-treated as described above. cDNA was synthesized using the RT2 First Strand Kit (Qiagen, 330404) and mixed with RT² SYBR Green ROX™ qPCR Mastermix (Qiagen, 330523). Into each well of the RT² Profiler™ PCR Array Mouse TGF-β/BMP Signaling Pathway (Qiagen, PAMM-035ZA, 330231) and the RT² Profiler™ PCR Array Mouse Notch Signaling Pathway (Qiagen, PAMM-059ZA, 330231) 25 μL of this mixture was aliquoted. Real-time qPCR was run with the ABI PRISM 7000 Sequence Detection System (Applied Biosystems, RRID:SCR_021899). FC calculations between BMP-treated and control samples were performed using the 2-ΔΔCt method [65]. As part of the analysis, Ct values were calculated in relation to the arithmetic mean of the five housekeeping genes Actb, B2m, Gapdh, Gusb, and Hsp90ab1. The paired two-tailed t-test was used for statistical analysis of the resulting FCs. Calculated p-values were corrected for multiple comparison testing using an FDR online calculator (https://www.sdmproject.com/utilities/?show=FDR, last accessed 9 March 2026). The level of significance was set to FDR(BH) <0.1.
4.14. CUT&Tag Analysis of SMAD Binding
CUT&Tag was performed on 100,000 fixed, frozen cells per condition as described [66,67]. Two biological replicates were treated with BMP6 or control. Cells were bound to beads and incubated with primary antibodies against H3K27ac (Abcam, ab4729, RRID:AB_2118291), pSMAD1/5/9 (Cell Signalling, 13820, RRID:AB_2493181), and SMAD4 (Cell Signalling, 38454, RRID:AB_2728776) at 4 °C overnight. On the next day, guinea pig anti-rabbit secondary antibody (Antibodies online, ABIN101961, RRID:AB_10775589) was added for one hour at room temperature. Subsequently, the beads were washed and the cells were incubated with CUTANA pAG-Tn5 enzyme (EpiCypher, 15-1017) for one hour at room temperature. After washing, tagmentation buffer containing 10 mM MgCl2 was added and the samples were incubated at 37 °C for 1 hour. Cleaved fragments were released before the DNA was extracted, precipitated with pure ethanol at -80 °C for 15 minutes, and pelleted by centrifugation at 4 °C for 15 minutes at 16,000 x g. The ethanol was replaced followed by centrifugation for 1 minute. The tagmented DNA was amplified using 1x NEBNext® High-Fidelity 2X PCR Master Mix (New England Biolabs, M0541L) with 5 µM barcoded primers (from [68]) in the Biometra TRIO PCR system (Analytik Jena, RRID:SCR_027344). After the amplification, the libraries were cleaned up using Agencourt AMPure XP beads (Beckman Coulter, A63881). The quality of the libraries was tested on the Bioanalyzer 2100 (Agilent Technologies, RRID:SCR_019715) using the Agilent High Sensitivity DNA Kit (Agilent Technologies, 5067-4626). Subsequently, the libraries were pooled and sequenced in paired-end 50 bp mode to more than 10 million reads per sample on a 10B lane of the Illumina NovaSeq X Plus (Illumina, RRID:SCR_024568).
4.15. Processing and Analysis of the CUT&Tag Data
Paired-end sequencing reads were subsampled to an equal total depth per antibody. Reads were then aligned to the mouse reference genome (GRCm39) using Bowtie2 version 2.5.4 (RRID:SCR_016368) [69] with the following parameters: --very-sensitive --no-mixed --no-discordant. Aligned reads were subsequently filtered using SAMtools version 1.21 (RRID:SCR_002105) [53] with options -b -h -f 2 -F 256 -F 2048 -F 1024 -q 30 to retain only properly paired reads (mapping quality ≥30) aligned to autosomes and sex chromosomes, while excluding reads mapped to ENCODE blacklisted regions. The filtered BAM files were converted to BED format using BEDTools version 2.31.1 (RRID:SCR_006646) [70].
Peak calling was performed independently for each biological replicate using JAMM version 1.0.7.6 (RRID:SCR_017049) [71] with the -r window parameter. To establish consensus peak sets, per-replicate peaks were subjected to Irreproducible Discovery Rate (IDR) analysis using the IDR package version 2.0.3 (RRID:SCR_017237) [72] with the parameters --rank signal.value --idr-threshold 0.05. IDR was run on the “filtered peaks” output from JAMM for transcription factors and on the “all peaks” output for the H3K27ac modification. Only peaks meeting the IDR threshold of 0.05 were retained when generating the consensus peak lists for each experimental condition.
Differential binding analysis between BMP6 treatment and control was conducted using DiffBind version 3.18.0 (RRID:SCR_012918) [73] in conjunction with DESeq2 version 1.48.1 (RRID:SCR_015687) [55] using the default parameters. Significantly differentially bound peaks of 400 bp in length were identified using an FDR(BH) threshold of 0.05. To associate peaks with DEGs from RNA-seq 1, differential peaks were intersected with candidate proximal and distal regulatory regions. Proximal regions were defined as -1.5 kb and +0.5 kb from the TSS of the RefSeq select isoform according to annotation GCF_000001635.27 and intersected with differential peaks using bedtools intersect -wo -a [peak_file] -b [TSS_file]. Distal regions were defined as 20 kb upstream of the 5’ UTR to 20 kb downstream of the 3’ UTR of the RefSeq select isoform (annotation GCF_000001635.27).
Profile plots and heatmaps of pSMAD1/5/9 and SMAD4 peaks were generated as follows. Normalized bigWig files were produced using the bamCoverage tool from deepTools version 3.5.5 (RRID:SCR_016366) [74] with the parameters --normalizeUsing RPKM --binSize 50. Binding score matrices spanning 2 kb upstream and downstream of the summit of all IDRed peaks were then computed using the computeMatrix reference-point command in deepTools with default parameters. Profile plots and heatmaps were generated from these matrices using the matplotlib package version 3.10.1 in Python 3.
For peak annotations, IDRed peaks were first assessed for overlap with regions spanning 2 kb upstream and downstream of the TSS of any RefSeq select isoform (annotation GCF_000001635.27) and annotated accordingly. In the absence of a TSS overlap, peaks were subsequently assessed for overlap with exonic regions, followed by intronic regions. Peaks that did not overlap any of the above features were classified as intergenic.
To determine the number of genes bound by each transcription factor in the BMP6-treated samples, a gene was counted as bound if at least one IDRed pSMAD1/5/9 or SMAD4 peak overlapped the distal region as defined above. Venn diagrams were created with eulerr.co (last accessed: 26 February 2026) [57].
To display the read piles and peak calls in a custom UCSC genome browser session, the files were loaded as custom tracks. For this purpose all *.narrowPeak files were renamed to *.bed and the column headers were deleted if present. All BED files were further converted to bedGraph and then to BigWig files using the UCSC bedGraphToBigWig tool [75].
Raw and processed CUT&Tag-seq files are available on the GEO database (RRID:SCR_005012) under the accession number GSE305745.
4.16. Immunofluorescence Staining
Immunofluorescence labeling was performed on cultured cells that were treated with BMP4 or control for 1 hour using anti-PAX7 (DSHB, RRID:AB_528428) and anti-pSMAD1/5 (Cell Signaling, 9516, RRID:AB_491015) as primary antibodies, followed by fluorescently labeled secondary antibodies (goat anti-mouse IgG1 Alexa Fluor 568, Life Technologies, A-21124, RRID:AB_2535766 and goat anti-rabbit IgG Alexa Fluor 488, Life Technologies, A-11034, RRID:AB_2576217). Briefly, the cells were fixed with 4% paraformaldehyde, quenched with 0.1 M glycine, permeabilized with cold 100% methanol, incubated with the primary antibodies overnight, incubated with the secondary antibodies for one hour, and embedded in Vectashield, a DAPI-containing mounting medium (Vector Laboratories, H-1000-10). Fluorescence was examined under an automated inverted microscope (Leica, DMI4000 B, RRID:SCR_027345), using a HC PL FLUOTAR L 20x / 0.40 CORR PH1 (Leica, 506243) objective and images were acquired using a ROLERA-MGi PLUS CCD camera (QImaging) and the Image-Pro Plus software (v7.01, Media Cybernetics, RRID:SCR_007369). The results presented in Figure 1D and 1E are a quantification of an experiment presented in Figures S1B and S1C of ref. [10].
4.17. Quantification of Fluorescence Intensity
Fluorescence intensity was quantified using the ImageJ/Fiji software (RRID:SCR_003070) [76]. For background subtraction a background image was calculated from each frame with ImageJ (see the macro on GitHub). To derive the corrected fluorescence intensity, the background image was subtracted from the respective frame. Regions of interest (here the nuclei) were identified using the software’s “Nucleus Counter” software plug-in. For each nucleus, measurements of “integrated density” and “area” were made and the integrated density was divided by the area. The statistical analysis was done with the non-parametric Mann-Whitney U test.
4.18. Code Availability
The scripts used to analyze all datasets are available on GitHub (RRID:SCR_002630) at https://github.com/BirtheLange/Lange_et_al_2026_BMP_Notch (last accessed on 9 March 2026) and on Zenodo (RRID:SCR_004129) at 10.5281/zenodo.17897897 [access for reviewers: https://zenodo.org/records/17897897?preview=1&token=eyJhbGciOiJIUzUxMiJ9.eyJpZCI6ImM4OTY3YmY2LTg3NTctNGJjOS04NmM3LWRhYWYyMTJhOTNkNSIsImRhdGEiOnt9LCJyYW5kb20iOiI0NjE3ZDRiYTZkYWZhZjdjZmIyNjk3N2MxMTU1ZGMzZCJ9.9-XZvHyBS71XmiR6JW9LW26Y1DOE3L9vXZQBPqN1chRTXsRZsBnrLFIqZXRZpxhXXNLNWOlf4vWI3iRS9h_yUA].
Supplementary Materials
The following supporting information can be downloaded at: www.mdpi.com/xxx/s1, Figure S1: Validation of BMP-regulated genes using microarrays and pathway-focused PCR arrays; Figure S2: Summary of RNA-based experiments; Figure S3: Examples of pSMAD1/5/9 and SMAD4 CUT&Tag profiles; Table S1: List of the BMP signaling pathway (GO:0030509), Notch signaling pathway (GO:0007219), and skeletal muscle tissue development (GO:0007519) genes; Table S2: Changes in gene expression observed in the RNA-seq 1 experiment; Table S3: Changes in gene expression determined by microarray; Table S4: Changes in gene expression observed in the RNA-seq 2 experiment; Table S5: Differential peaks comparing SMAD binding by CUT&Tag in the presence/absence of BMP6.
Author Contributions
Conceptualization, B.K.A.L., I.P., and M.S.; methodology, B.K.A.L., I.P., B.B., and M.S.; software, V.H. and M.S.; validation, B.K.A.L., I.P., and M.S.; formal analysis, B.K.A.L., I.P., V.H., and M.S.; investigation, B.K.A.L., I.P., S.M.-G., and B.B.; resources, C.B., H.A., and M.S.; data curation, B.K.A.L., I.P., V.H., and M.S.; writing—original draft preparation, B.K.A.L., I.P., V.H., and M.S.; writing—review and editing, B.K.A.L. and M.S.; visualization, B.K.A.L. and M.S.; supervision, C.B., H.A., and M.S.; project administration, M.S.; funding acquisition, H.A. and M.S. All authors have read and agreed to the published version of the manuscript.
Funding
This research was funded by grants of the Deutsche Forschungsgemeinschaft (DFG) to M.S. in the frame of the GRK 1631: MyoGrad - International Research Training Group for Myology; NeuroCure EXC2049-390688087 Cluster of Excellence, and the DFG Research Unit FOR 2841 "Beyond the exome".
Institutional Review Board Statement
The animal study protocol was approved by the Institutional Review Board (LaGeSo Berlin, T0183/15, approved on 10 July 2017 and X9008/20, approved on 18 September 2020).
Data Availability Statement
The original data presented in the study are openly available in Gene Expression Omnibus (GEO) at GSE306430 (SuperSeries) composed of the SubSeries GSE159594 (RNA-seq 1 data), GSE127798 (microarray data), GSE305746 (RNA-seq 2 data), and GSE305745 (CUT&Tag data) as well as Zenodo at 10.5281/zenodo.17897897 [access for reviewers: https://zenodo.org/records/17897897?preview=1&token=eyJhbGciOiJIUzUxMiJ9.eyJpZCI6ImM4OTY3YmY2LTg3NTctNGJjOS04NmM3LWRhYWYyMTJhOTNkNSIsImRhdGEiOnt9LCJyYW5kb20iOiI0NjE3ZDRiYTZkYWZhZjdjZmIyNjk3N2MxMTU1ZGMzZCJ9.9-XZvHyBS71XmiR6JW9LW26Y1DOE3L9vXZQBPqN1chRTXsRZsBnrLFIqZXRZpxhXXNLNWOlf4vWI3iRS9h_yUA].
Acknowledgments
The authors would like to thank Amalia Stantzou for helpful discussions during the development of the MACS® isolation method. Jana-Marie Schwarz contributed to initial efforts of trying to find a molecular basis for the crosstalk between the BMP and the Notch pathway that were not included in the paper. Sequencing of the CUT&Tag samples was performed by the Genomics Technology Platform of the MDC and BIH. Sequencing of the RNA-seq samples was conducted by BGI Genomics (Shenzhen, China). The microarray experiments were done by the Labor für funktionelle Genomforschung at Charité. Computation for the CUT&Tag data analysis was performed on the HPC for Research/Clinic cluster of the Berlin Institute of Health. The graphical abstract and Figure 4C were created in BioRender: Schuelke, M. (2026). We acknowledge the use of ChatGPT [chatgpt.com] for assistance with developing the bash scripts for the CUT&Tag analysis and Claude [claude.ai] for editing and refining the text in the CUT&Tag analysis methods section.
Conflicts of Interest
The authors declare no conflicts of interest. The funders had no role in the design of the study; in the collection, analyses, or interpretation of data; in the writing of the manuscript; or in the decision to publish the results.
Abbreviations
The following abbreviations are used in this manuscript:
| BH | Benjamini-Hochberg |
| bHLH | Basic helix-loop-helix |
| BMP | Bone morphogenetic protein |
| CUT&Tag | Cleavage under targets and tagmentation |
| DEG | Differentially expressed gene |
| DLL | Delta-like |
| FACS | Fluorescence activated cell sorting |
| FBS | Fetal bovine serum |
| FC | Fold change |
| FDR | False discovery rate |
| FGF | Fibroblast growth factor |
| FPKM | Fragments per kilobase of transcript per million reads mapped |
| HGF | Hepatocyte growth factor |
| IDR | Irreproducible discovery rate |
| IGF-1 | Insulin-like growth factor I |
| JAG | Jagged |
| MACS® | Magnetic cell separation |
| MuSC | Muscle stem cell |
| MYOG | Myogenin |
| NICD | Notch intracellular domain |
| padj | Adjusted p-value |
| PE | Phycoerythrin |
| RIN | RNA integrity number |
| RNA-seq | RNA-sequencing |
| sBMPR1A | Soluble BMP receptor type 1A |
| TGF-β | Transforming growth factor-β |
| TPM | Transcripts per million |
| TSS | Transcription start site |
References
- Collins, C.A.; Partridge, T.A. Self-Renewal of the Adult Skeletal Muscle Satellite Cell. Cell Cycle 2005, 4, 1338–1341. [Google Scholar] [CrossRef] [PubMed]
- Buckingham, M.; Relaix, F. PAX3 and PAX7 as Upstream Regulators of Myogenesis. Semin. Cell Dev. Biol. 2015, 44, 115–125. [Google Scholar] [CrossRef] [PubMed]
- Rudnicki, M.A.; Le Grand, F.; McKinnell, I.; Kuang, S. The Molecular Regulation of Muscle Stem Cell Function. Cold Spring Harb. Symp. Quant. Biol. 2008, 73, 323–331. [Google Scholar] [CrossRef] [PubMed]
- Buckingham, M.; Rigby, P.W.J. Gene Regulatory Networks and Transcriptional Mechanisms That Control Myogenesis. Dev. Cell 2014, 28, 225–238. [Google Scholar] [CrossRef]
- Dhawan, J.; Rando, T.A. Stem Cells in Postnatal Myogenesis: Molecular Mechanisms of Satellite Cell Quiescence, Activation and Replenishment. Trends Cell Biol. 2005, 15, 666–673. [Google Scholar] [CrossRef]
- Dumont, N.A.; Bentzinger, C.F.; Sincennes, M.-C.; Rudnicki, M.A. Satellite Cells and Skeletal Muscle Regeneration. In Comprehensive Physiology; American Cancer Society, 2015; pp. 1027–1059. ISBN 978-0-470-65071-4. [Google Scholar]
- Conboy, I.M.; Rando, T.A. The Regulation of Notch Signaling Controls Satellite Cell Activation and Cell Fate Determination in Postnatal Myogenesis. Dev. Cell 2002, 3, 397–409. [Google Scholar] [CrossRef]
- Zhang, Y.; Lahmann, I.; Baum, K.; Shimojo, H.; Mourikis, P.; Wolf, J.; Kageyama, R.; Birchmeier, C. Oscillations of Delta-Like1 Regulate the Balance between Differentiation and Maintenance of Muscle Stem Cells. Nat. Commun. 2021, 12, 1318. [Google Scholar] [CrossRef]
- Sheehan, S.M.; Tatsumi, R.; Temm-Grove, C.J.; Allen, R.E. HGF Is an Autocrine Growth Factor for Skeletal Muscle Satellite Cells in Vitro. Muscle Nerve 2000, 23, 239–245. [Google Scholar] [CrossRef]
- Stantzou, A.; Schirwis, E.; Swist, S.; Alonso-Martin, S.; Polydorou, I.; Zarrouki, F.; Mouisel, E.; Beley, C.; Julien, A.; Grand, F.L.; et al. BMP Signaling Regulates Satellite Cell-Dependent Postnatal Muscle Growth. Development 2017, 144, 2737–2747. [Google Scholar] [CrossRef]
- Sartori, R.; Schirwis, E.; Blaauw, B.; Bortolanza, S.; Zhao, J.; Enzo, E.; Stantzou, A.; Mouisel, E.; Toniolo, L.; Ferry, A.; et al. BMP Signaling Controls Muscle Mass. Nat. Genet. 2013, 45, 1309–1318. [Google Scholar] [CrossRef]
- Massagué, J. TGFβ Signalling in Context. Nat. Rev. Mol. Cell Biol. 2012, 13, 616–630. [Google Scholar] [CrossRef]
- Miyazono, K.; Miyazawa, K. Id: A Target of BMP Signaling. Sci. STKE 2002, 2002, pe40–pe40. [Google Scholar] [CrossRef]
- Jen, Y.; Weintraub, H.; Benezra, R. Overexpression of Id Protein Inhibits the Muscle Differentiation Program: In Vivo Association of Id with E2A Proteins. Genes Dev. 1992, 6, 1466–1479. [Google Scholar] [CrossRef]
- Friedrichs, M.; Wirsdöerfer, F.; Flohé, S.B.; Schneider, S.; Wuelling, M.; Vortkamp, A. BMP Signaling Balances Proliferation and Differentiation of Muscle Satellite Cell Descendants. BMC Cell Biol. 2011, 12, 26. [Google Scholar] [CrossRef] [PubMed]
- Ono, Y.; Calhabeu, F.; Morgan, J.E.; Katagiri, T.; Amthor, H.; Zammit, P.S. BMP Signalling Permits Population Expansion by Preventing Premature Myogenic Differentiation in Muscle Satellite Cells. Cell Death Differ. 2011, 18, 222–234. [Google Scholar] [CrossRef] [PubMed]
- Winbanks, C.E.; Chen, J.L.; Qian, H.; Liu, Y.; Bernardo, B.C.; Beyer, C.; Watt, K.I.; Thomson, R.E.; Connor, T.; Turner, B.J.; et al. The Bone Morphogenetic Protein Axis Is a Positive Regulator of Skeletal Muscle Mass. J. Cell Biol. 2013, 203, 345–357. [Google Scholar] [CrossRef] [PubMed]
- Bray, S.J. Notch Signalling: A Simple Pathway Becomes Complex. Nat. Rev. Mol. Cell Biol. 2006, 7, 678–689. [Google Scholar] [CrossRef]
- Borggrefe, T.; Oswald, F. The Notch Signaling Pathway: Transcriptional Regulation at Notch Target Genes. Cell. Mol. Life Sci. 2009, 66, 1631–1646. [Google Scholar] [CrossRef]
- Kageyama, R.; Ohtsuka, T.; Tomita, K. The bHLH Gene Hes1 Regulates Differentiation of Multiple Cell Types. Mol. Cells 2000, 10, 1–7. [Google Scholar] [CrossRef]
- Gioftsidi, S.; Relaix, F.; Mourikis, P. The Notch Signaling Network in Muscle Stem Cells during Development, Homeostasis, and Disease. Skelet. Muscle 2022, 12, 9. [Google Scholar] [CrossRef]
- Vargas-Franco, D.; Kalra, R.; Draper, I.; Pacak, C.A.; Asakura, A.; Kang, P.B. The Notch Signaling Pathway in Skeletal Muscle Health and Disease. Muscle Nerve 2022, 66, 530–544. [Google Scholar] [CrossRef] [PubMed]
- Vasyutina, E.; Lenhard, D.C.; Birchmeier, C. Notch Function in Myogenesis. Cell Cycle 2007, 6, 1451–1454. [Google Scholar] [CrossRef] [PubMed]
- Bröhl, D.; Vasyutina, E.; Czajkowski, M.T.; Griger, J.; Rassek, C.; Rahn, H.-P.; Purfürst, B.; Wende, H.; Birchmeier, C. Colonization of the Satellite Cell Niche by Skeletal Muscle Progenitor Cells Depends on Notch Signals. Dev. Cell 2012, 23, 469–481. [Google Scholar] [CrossRef] [PubMed]
- Noguchi, Y.; Nakamura, M.; Hino, N.; Nogami, J.; Tsuji, S.; Sato, T.; Zhang, L.; Tsujikawa, K.; Tanaka, T.; Izawa, K.; et al. Cell-Autonomous and Redundant Roles of Hey1 and HeyL in Muscle Stem Cells: HeyL Requires Hes1 to Bind Diverse DNA Sites. Development 2019, 146. [Google Scholar] [CrossRef]
- Lahmann, I.; Zhang, Y.; Baum, K.; Wolf, J.; Birchmeier, C. An Oscillatory Network Controlling Self-Renewal of Skeletal Muscle Stem Cells. Exp. Cell Res. 2021, 409, 112933. [Google Scholar] [CrossRef]
- Yartseva, V.; Goldstein, L.D.; Rodman, J.; Kates, L.; Chen, M.Z.; Chen, Y.-J.J.; Foreman, O.; Siebel, C.W.; Modrusan, Z.; Peterson, A.S.; et al. Heterogeneity of Satellite Cells Implicates DELTA1/NOTCH2 Signaling in Self-Renewal. Cell Rep. 2020, 30, 1491–1503.e6. [Google Scholar] [CrossRef]
- Schuster-Gossler, K.; Cordes, R.; Gossler, A. Premature Myogenic Differentiation and Depletion of Progenitor Cells Cause Severe Muscle Hypotrophy in Delta1 Mutants. Proc. Natl. Acad. Sci. 2007, 104, 537–542. [Google Scholar] [CrossRef]
- Mourikis, P.; Sambasivan, R.; Castel, D.; Rocheteau, P.; Bizzarro, V.; Tajbakhsh, S. A Critical Requirement for Notch Signaling in Maintenance of the Quiescent Skeletal Muscle Stem Cell State. Stem Cells 2012, 30, 243–252. [Google Scholar] [CrossRef]
- Bjornson, C.R.R.; Cheung, T.H.; Liu, L.; Tripathi, P.V.; Steeper, K.M.; Rando, T.A. Notch Signaling Is Necessary to Maintain Quiescence in Adult Muscle Stem Cells. STEM CELLS 2012, 30, 232–242. [Google Scholar] [CrossRef]
- Eliazer, S.; Sun, X.; Barruet, E.; Brack, A.S. Heterogeneous Levels of Delta-like 4 within a Multinucleated Niche Cell Maintains Muscle Stem Cell Diversity. eLife 2022, 11, e68180. [Google Scholar] [CrossRef]
- Blokzijl, A.; Dahlqvist, C.; Reissmann, E.; Falk, A.; Moliner, A.; Lendahl, U.; Ibáñez, C.F. Cross-Talk between the Notch and TGF-β Signaling Pathways Mediated by Interaction of the Notch Intracellular Domain with Smad3. J. Cell Biol. 2003, 163, 723–728. [Google Scholar] [CrossRef] [PubMed]
- Dahlqvist, C.; Blokzijl, A.; Chapman, G.; Falk, A.; Dannaeus, K.; Ibâñez, C.F.; Lendahl, U. Functional Notch Signaling Is Required for BMP4-Induced Inhibition of Myogenic Differentiation. Dev. Camb. Engl. 2003, 130, 6089–6099. [Google Scholar] [CrossRef] [PubMed]
- Frank, N.Y.; Kho, A.T.; Schatton, T.; Murphy, G.F.; Molloy, M.J.; Zhan, Q.; Ramoni, M.F.; Frank, M.H.; Kohane, I.S.; Gussoni, E. Regulation of Myogenic Progenitor Proliferation in Human Fetal Skeletal Muscle by BMP4 and Its Antagonist Gremlin. J. Cell Biol. 2006, 175, 99–110. [Google Scholar] [CrossRef] [PubMed]
- Pfaffl, M.W. A New Mathematical Model for Relative Quantification in Real-Time RT–PCR. Nucleic Acids Res. 2001, 29, e45–e45. [Google Scholar] [CrossRef]
- Ashburner, M.; Ball, C.A.; Blake, J.A.; Botstein, D.; Butler, H.; Cherry, J.M.; Davis, A.P.; Dolinski, K.; Dwight, S.S.; Eppig, J.T.; et al. Gene Ontology: Tool for the Unification of Biology. Nat. Genet. 2000, 25, 25–29. [Google Scholar] [CrossRef]
- Aleksander, S.A.; Balhoff, J.; Carbon, S.; Cherry, J.M.; Drabkin, H.J.; Ebert, D.; Feuermann, M.; Gaudet, P.; Harris, N.L.; et al.; The Gene Ontology Consortium The Gene Ontology Knowledgebase in 2023. Genetics 2023, 224, iyad031. [Google Scholar] [CrossRef]
- Fukada, S.; Uezumi, A.; Ikemoto, M.; Masuda, S.; Segawa, M.; Tanimura, N.; Yamamoto, H.; Miyagoe-Suzuki, Y.; Takeda, S. Molecular Signature of Quiescent Satellite Cells in Adult Skeletal Muscle. Stem Cells 2007, 25, 2448–2459. [Google Scholar] [CrossRef]
- Lahmann, I.; Bröhl, D.; Zyrianova, T.; Isomura, A.; Czajkowski, M.T.; Kapoor, V.; Griger, J.; Ruffault, P.-L.; Mademtzoglou, D.; Zammit, P.S.; et al. Oscillations of MyoD and Hes1 Proteins Regulate the Maintenance of Activated Muscle Stem Cells. Genes Dev. 2019, 33, 524–535. [Google Scholar] [CrossRef]
- Soleimani, V.D.; Yin, H.; Jahani-Asl, A.; Ming, H.; Kockx, C.E.M.; van Ijcken, W.F.J.; Grosveld, F.; Rudnicki, M.A. Snail Regulates MyoD Binding-Site Occupancy to Direct Enhancer Switching and Differentiation-Specific Transcription in Myogenesis. Mol. Cell 2012, 47, 457–468. [Google Scholar] [CrossRef]
- Takeuchi, H.; Haltiwanger, R.S. Role of Glycosylation of Notch in Development. Semin. Cell Dev. Biol. 2010, 21, 638–645. [Google Scholar] [CrossRef]
- Creyghton, M.P.; Cheng, A.W.; Welstead, G.G.; Kooistra, T.; Carey, B.W.; Steine, E.J.; Hanna, J.; Lodato, M.A.; Frampton, G.M.; Sharp, P.A.; et al. Histone H3K27ac Separates Active from Poised Enhancers and Predicts Developmental State. Proc. Natl. Acad. Sci. 2010, 107, 21931–21936. [Google Scholar] [CrossRef] [PubMed]
- Gamart, J.; Barozzi, I.; Laurent, F.; Reinhardt, R.; Martins, L.R.; Oberholzer, T.; Visel, A.; Zeller, R.; Zuniga, A. SMAD4 Target Genes Are Part of a Transcriptional Network That Integrates the Response to BMP and SHH Signaling during Early Limb Bud Patterning. Development 2021, 148, dev200182. [Google Scholar] [CrossRef] [PubMed]
- Itoh, F.; Itoh, S.; Goumans, M.-J.; Valdimarsdottir, G.; Iso, T.; Dotto, G.P.; Hamamori, Y.; Kedes, L.; Kato, M.; Dijke, P. ten Synergy and Antagonism between Notch and BMP Receptor Signaling Pathways in Endothelial Cells. EMBO J. 2004, 23, 541–551. [Google Scholar] [CrossRef] [PubMed]
- Zavadil, J.; Cermak, L.; Soto-Nieves, N.; Böttinger, E.P. Integration of TGF-β/Smad and Jagged1/Notch Signalling in Epithelial-to-Mesenchymal Transition. EMBO J. 2004, 23, 1155–1165. [Google Scholar] [CrossRef]
- Zavadil, J.; Bitzer, M.; Liang, D.; Yang, Y.-C.; Massimi, A.; Kneitz, S.; Piek, E.; Böttinger, E.P. Genetic Programs of Epithelial Cell Plasticity Directed by Transforming Growth Factor-β. Proc. Natl. Acad. Sci. 2001, 98, 6686–6691. [Google Scholar] [CrossRef]
- Gordân, R.; Hartemink, A.J.; Bulyk, M.L. Distinguishing Direct versus Indirect Transcription Factor–DNA Interactions. Genome Res. 2009, 19, 2090–2100. [Google Scholar] [CrossRef]
- Kageyama, R.; Ohtsuka, T.; Kobayashi, T. The Hes Gene Family: Repressors and Oscillators That Orchestrate Embryogenesis. Development 2007, 134, 1243–1251. [Google Scholar] [CrossRef]
- Dequéant, M.-L.; Glynn, E.; Gaudenz, K.; Wahl, M.; Chen, J.; Mushegian, A.; Pourquié, O. A Complex Oscillating Network of Signaling Genes Underlies the Mouse Segmentation Clock. Science 2006, 314, 1595–1598. [Google Scholar] [CrossRef]
- Sambasivan, R.; Gayraud-Morel, B.; Dumas, G.; Cimper, C.; Paisant, S.; Kelly, R.G.; Tajbakhsh, S. Distinct Regulatory Cascades Govern Extraocular and Pharyngeal Arch Muscle Progenitor Cell Fates. Dev. Cell 2009, 16, 810–821. [Google Scholar] [CrossRef]
- Picelli, S.; Björklund, Å.K.; Faridani, O.R.; Sagasser, S.; Winberg, G.; Sandberg, R. Smart-Seq2 for Sensitive Full-Length Transcriptome Profiling in Single Cells. Nat. Methods 2013, 10, 1096–1098. [Google Scholar] [CrossRef]
- Dobin, A.; Davis, C.A.; Schlesinger, F.; Drenkow, J.; Zaleski, C.; Jha, S.; Batut, P.; Chaisson, M.; Gingeras, T.R. STAR: Ultrafast Universal RNA-Seq Aligner. Bioinformatics 2013, 29, 15–21. [Google Scholar] [CrossRef]
- Li, H.; Handsaker, B.; Wysoker, A.; Fennell, T.; Ruan, J.; Homer, N.; Marth, G.; Abecasis, G.; Durbin, R. 1000 Genome Project Data Processing Subgroup The Sequence Alignment/Map Format and SAMtools. Bioinformatics 2009, 25, 2078–2079. [Google Scholar] [CrossRef] [PubMed]
- Pertea, M.; Pertea, G.M.; Antonescu, C.M.; Chang, T.-C.; Mendell, J.T.; Salzberg, S.L. StringTie Enables Improved Reconstruction of a Transcriptome from RNA-Seq Reads. Nat. Biotechnol. 2015, 33, 290–295. [Google Scholar] [CrossRef] [PubMed]
- Love, M.I.; Huber, W.; Anders, S. Moderated Estimation of Fold Change and Dispersion for RNA-Seq Data with DESeq2. Genome Biol. 2014, 15, 550. [Google Scholar] [CrossRef] [PubMed]
- Ge, S.X.; Son, E.W.; Yao, R. iDEP: An Integrated Web Application for Differential Expression and Pathway Analysis of RNA-Seq Data. BMC Bioinformatics 2018, 19, 534. [Google Scholar] [CrossRef]
- Larsson, J.; Gustafsson, P. A Case Study in Fitting Area-Proportional Euler Diagrams with Ellipses Using Eulerr. Proc. Int. Workshop Set Vis. Reason. 2116; pp. 84–91.
- Gautier, L.; Cope, L.; Bolstad, B.M.; Irizarry, R.A. Affy—Analysis of Affymetrix GeneChip Data at the Probe Level. Bioinformatics 2004, 20, 307–315. [Google Scholar] [CrossRef]
- Carvalho, B.S.; Irizarry, R.A. A Framework for Oligonucleotide Microarray Preprocessing. Bioinformatics 2010, 26, 2363–2367. [Google Scholar] [CrossRef]
- Ritchie, M.E.; Phipson, B.; Wu, D.; Hu, Y.; Law, C.W.; Shi, W.; Smyth, G.K. Limma Powers Differential Expression Analyses for RNA-Sequencing and Microarray Studies. Nucleic Acids Res. 2015, 43, e47. [Google Scholar] [CrossRef]
- Huber, W.; Carey, V.J.; Gentleman, R.; Anders, S.; Carlson, M.; Carvalho, B.S.; Bravo, H.C.; Davis, S.; Gatto, L.; Girke, T.; et al. Orchestrating High-Throughput Genomic Analysis with Bioconductor. Nat. Methods 2015, 12, 115–121. [Google Scholar] [CrossRef]
- Carbon, S.; Ireland, A.; Mungall, C.J.; Shu, S.; Marshall, B.; Lewis, S. the AmiGO Hub; the Web Presence Working Group AmiGO: Online Access to Ontology and Annotation Data. Bioinformatics 2009, 25, 288–289. [Google Scholar] [CrossRef]
- Kanehisa, M.; Goto, S. KEGG: Kyoto Encyclopedia of Genes and Genomes. Nucleic Acids Res. 2000, 28, 27–30. [Google Scholar] [CrossRef]
- Ge, S.X.; Jung, D.; Yao, R. ShinyGO: A Graphical Gene-Set Enrichment Tool for Animals and Plants. Bioinformatics 2020, 36, 2628–2629. [Google Scholar] [CrossRef] [PubMed]
- Schmittgen, T.D.; Livak, K.J. Analyzing Real-Time PCR Data by the Comparative C(T) Method. Nat. Protoc. 2008, 3, 1101–1108. [Google Scholar] [CrossRef] [PubMed]
- Kaya-Okur, H.S.; Wu, S.J.; Codomo, C.A.; Pledger, E.S.; Bryson, T.D.; Henikoff, J.G.; Ahmad, K.; Henikoff, S. CUT&Tag for Efficient Epigenomic Profiling of Small Samples and Single Cells. Nat. Commun. 2019, 10, 1930. [Google Scholar] [CrossRef] [PubMed]
- Kaya-Okur, H.S.; Janssens, D.H.; Henikoff, J.G.; Ahmad, K.; Henikoff, S. Efficient Low-Cost Chromatin Profiling with CUT&Tag. Nat. Protoc. 2020, 15, 3264–3283. [Google Scholar] [CrossRef]
- Buenrostro, J.D.; Wu, B.; Litzenburger, U.M.; Ruff, D.; Gonzales, M.L.; Snyder, M.P.; Chang, H.Y.; Greenleaf, W.J. Single-Cell Chromatin Accessibility Reveals Principles of Regulatory Variation. Nature 2015, 523, 486–490. [Google Scholar] [CrossRef]
- Langmead, B.; Trapnell, C.; Pop, M.; Salzberg, S.L. Ultrafast and Memory-Efficient Alignment of Short DNA Sequences to the Human Genome. Genome Biol. 2009, 10, R25. [Google Scholar] [CrossRef]
- Quinlan, A.R.; Hall, I.M. BEDTools: A Flexible Suite of Utilities for Comparing Genomic Features. Bioinformatics 2010, 26, 841–842. [Google Scholar] [CrossRef]
- Ibrahim, M.M.; Lacadie, S.A.; Ohler, U. JAMM: A Peak Finder for Joint Analysis of NGS Replicates. Bioinforma. Oxf. Engl. 2015, 31, 48–55. [Google Scholar] [CrossRef]
- Li, Q.; Brown, J.B.; Huang, H.; Bickel, P.J. Measuring Reproducibility of High-Throughput Experiments. Ann. Appl. Stat. 2011, 5, 1752–1779. [Google Scholar] [CrossRef]
- Ross-Innes, C.S.; Stark, R.; Teschendorff, A.E.; Holmes, K.A.; Ali, H.R.; Dunning, M.J.; Brown, G.D.; Gojis, O.; Ellis, I.O.; Green, A.R.; et al. Differential Oestrogen Receptor Binding Is Associated with Clinical Outcome in Breast Cancer. Nature 2012, 481, 389–393. [Google Scholar] [CrossRef]
- Ramírez, F.; Ryan, D.P.; Grüning, B.; Bhardwaj, V.; Kilpert, F.; Richter, A.S.; Heyne, S.; Dündar, F.; Manke, T. deepTools2: A next Generation Web Server for Deep-Sequencing Data Analysis. Nucleic Acids Res. 2016, 44, W160–W165. [Google Scholar] [CrossRef]
- Kent, W.J.; Zweig, A.S.; Barber, G.; Hinrichs, A.S.; Karolchik, D. BigWig and BigBed: Enabling Browsing of Large Distributed Datasets. Bioinformatics 2010, 26, 2204–2207. [Google Scholar] [CrossRef]
- Schindelin, J.; Arganda-Carreras, I.; Frise, E.; Kaynig, V.; Longair, M.; Pietzsch, T.; Preibisch, S.; Rueden, C.; Saalfeld, S.; Schmid, B.; et al. Fiji: An Open-Source Platform for Biological-Image Analysis. Nat. Methods 2012, 9, 676–682. [Google Scholar] [CrossRef]
Figure 1.
Stimulation of muscle stem cells (MuSCs) with bone morphogenetic protein (BMP) induces fast transcriptional response and enhances PAX7 protein levels. (A) Id1 transcript levels in MuSCs grown in serum-containing medium, in serum-free medium, or in serum-free medium containing different concentrations of soluble BMP receptor type 1A (sBMPR1A) for 7 hours. In subsequent experiments, we used 200 ng/mL sBMPR1A (indicated by the black frame). (B, C) Time course of Id1 transcript levels after stimulation with BMP6 (B) or BMP4 (C). All samples underwent a 6-hour serum starvation in the presence of 200 ng/mL sBMPR1A prior to medium exchange and stimulation by BMP6 or BMP4. In subsequent experiments, we stimulated for 1 hour (indicated by the black frame). Values are shown as mean ± SD of n = 3 technical replicates of n = 1 biological replicate. Transcript levels were calculated using the efficiency-corrected 2-ΔΔCt method [35]. (D) Immunofluorescence stainings of MuSCs treated with BMP4 for 1 h using anti-pSMAD1/5 and anti-PAX7 antibodies. DAPI was used as a nuclear counterstain. Scale bar = 50 μm. (E, F) Quantification of fluorescence intensities of pSMAD1/5 (E) and PAX7 (F) in DAPI-stained nuclei. Every dot represents one cell. At least 200 cells were analyzed per condition (BMP4-treated versus control MuSCs). Significance levels were determined using the non-parametric Mann-Whitney U test.
Figure 1.
Stimulation of muscle stem cells (MuSCs) with bone morphogenetic protein (BMP) induces fast transcriptional response and enhances PAX7 protein levels. (A) Id1 transcript levels in MuSCs grown in serum-containing medium, in serum-free medium, or in serum-free medium containing different concentrations of soluble BMP receptor type 1A (sBMPR1A) for 7 hours. In subsequent experiments, we used 200 ng/mL sBMPR1A (indicated by the black frame). (B, C) Time course of Id1 transcript levels after stimulation with BMP6 (B) or BMP4 (C). All samples underwent a 6-hour serum starvation in the presence of 200 ng/mL sBMPR1A prior to medium exchange and stimulation by BMP6 or BMP4. In subsequent experiments, we stimulated for 1 hour (indicated by the black frame). Values are shown as mean ± SD of n = 3 technical replicates of n = 1 biological replicate. Transcript levels were calculated using the efficiency-corrected 2-ΔΔCt method [35]. (D) Immunofluorescence stainings of MuSCs treated with BMP4 for 1 h using anti-pSMAD1/5 and anti-PAX7 antibodies. DAPI was used as a nuclear counterstain. Scale bar = 50 μm. (E, F) Quantification of fluorescence intensities of pSMAD1/5 (E) and PAX7 (F) in DAPI-stained nuclei. Every dot represents one cell. At least 200 cells were analyzed per condition (BMP4-treated versus control MuSCs). Significance levels were determined using the non-parametric Mann-Whitney U test.
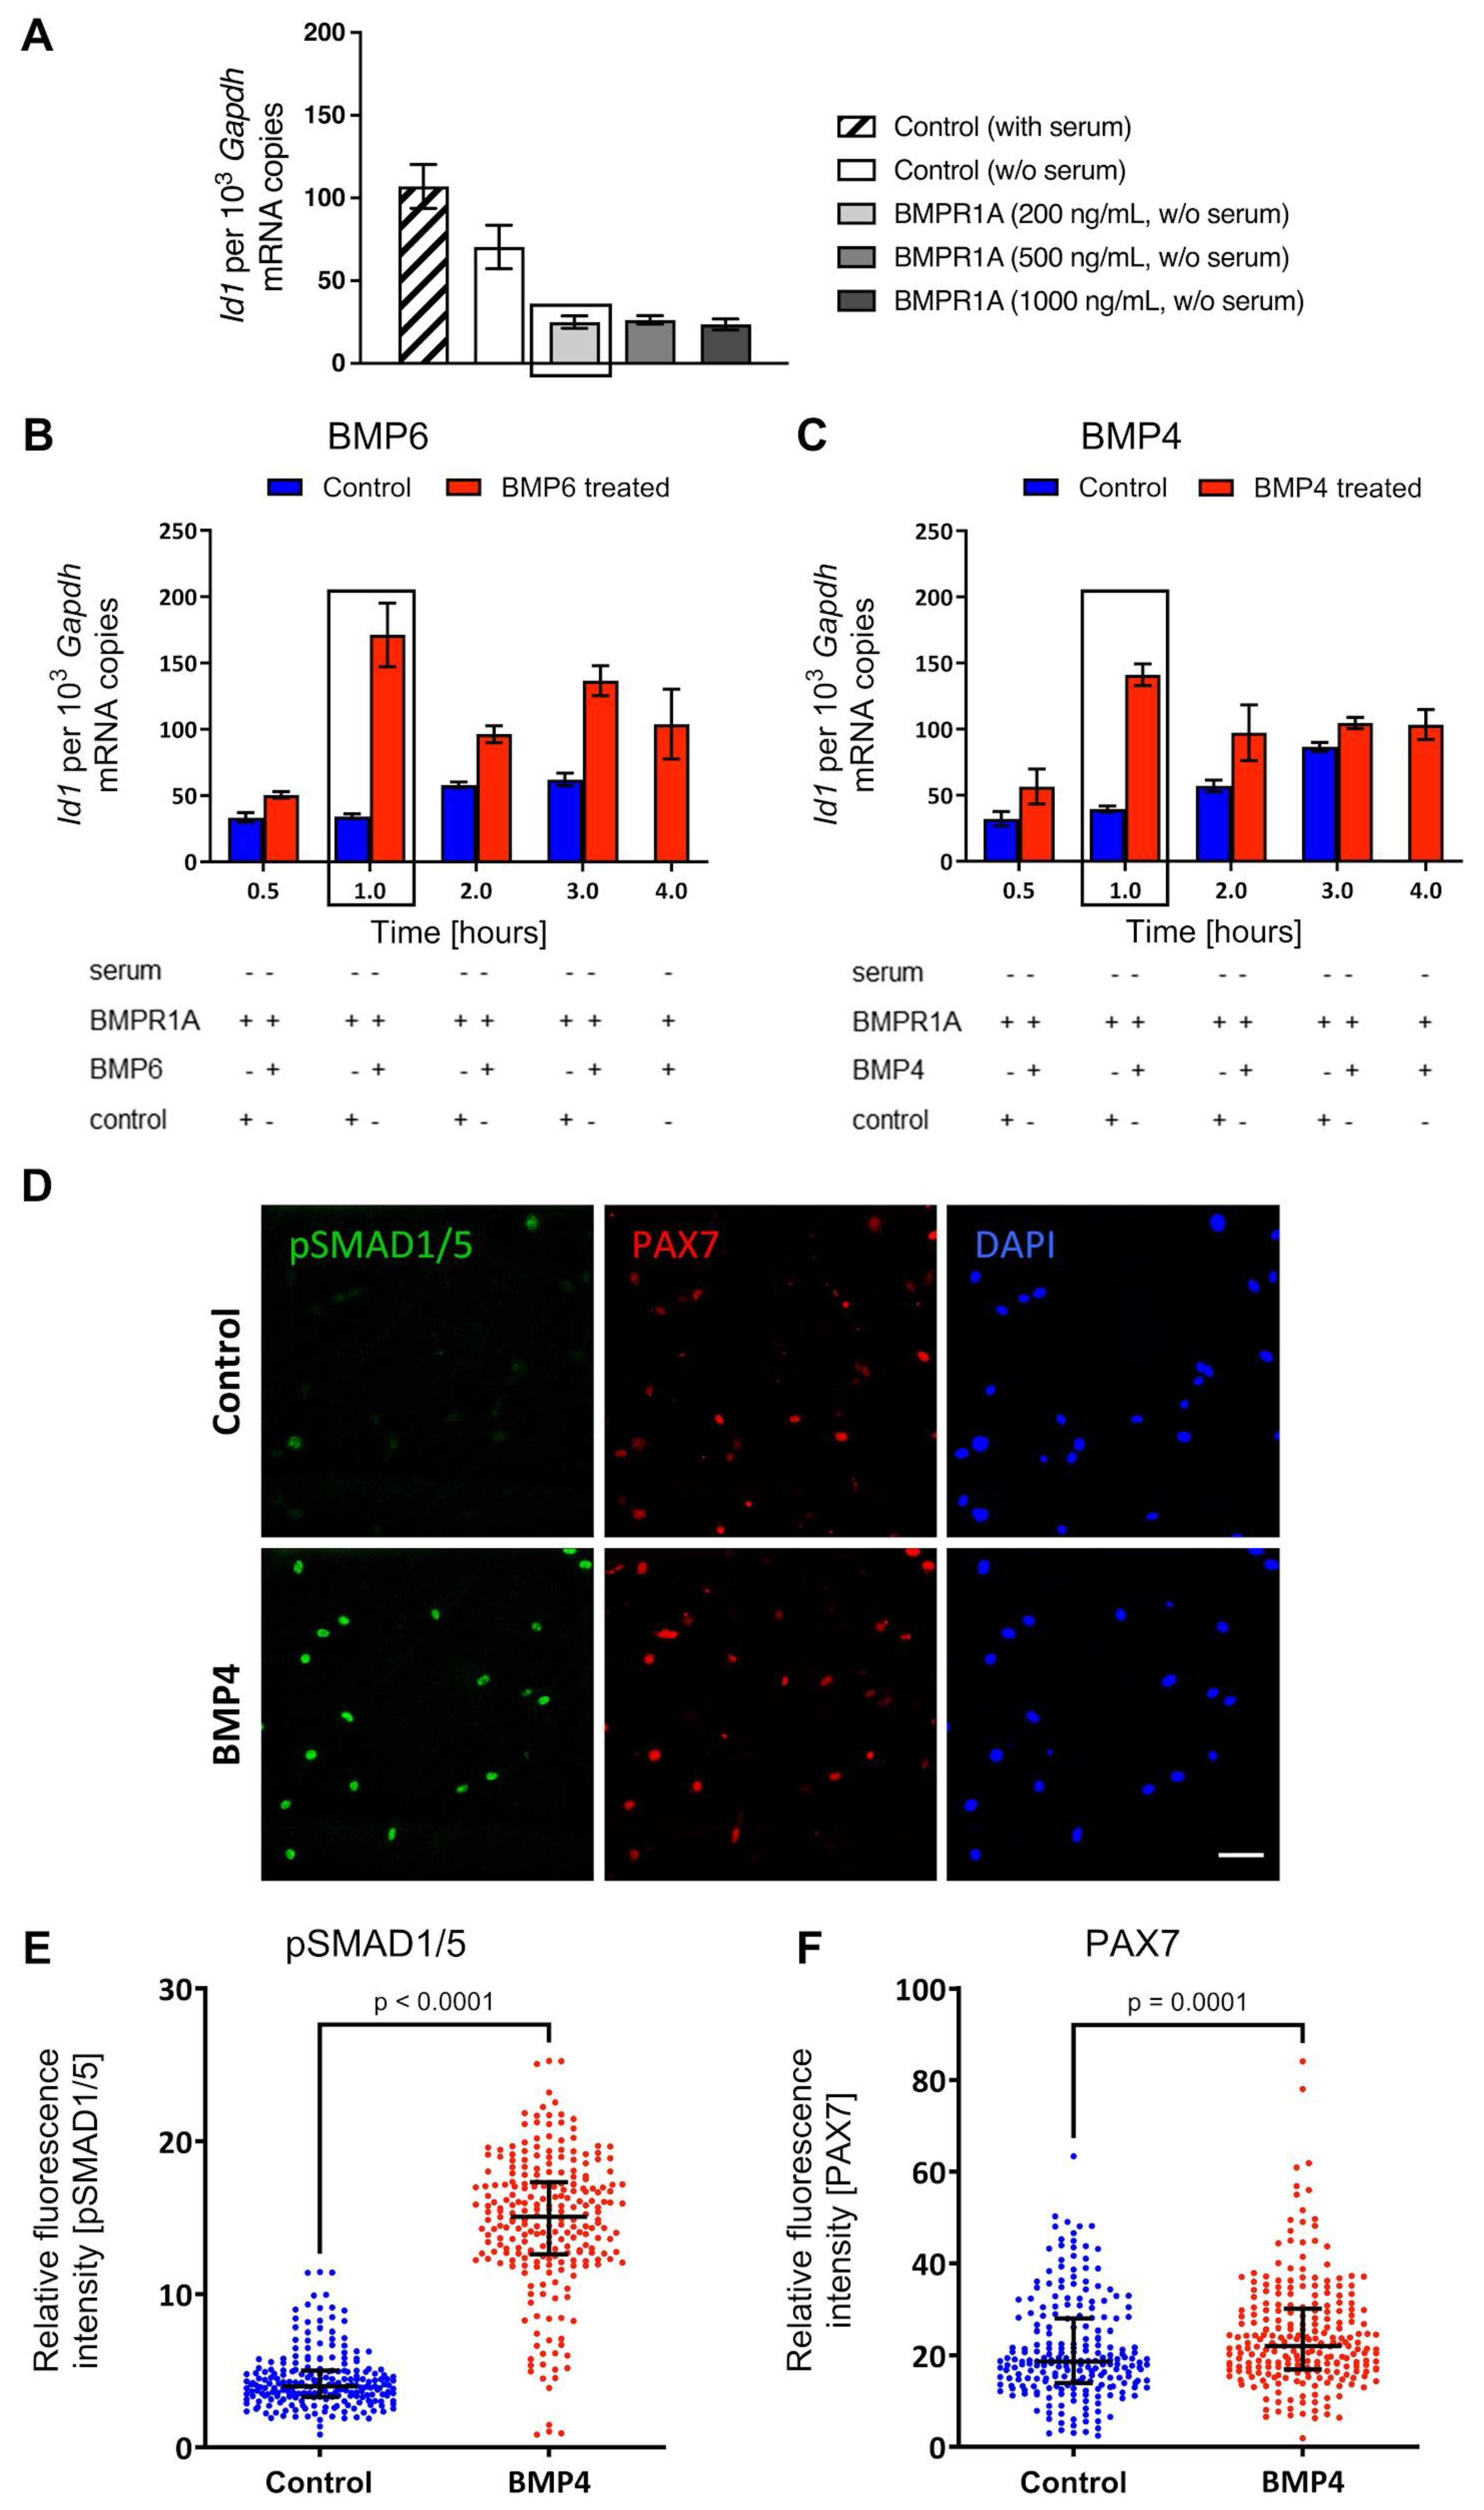
Figure 2.
Regulation of multiple BMP and Notch pathway genes in BMP-stimulated, cultured mouse MuSCs. (A) BMP4 (x-axis) versus BMP6 (y-axis) regulated genes revealed by RNA-sequencing (RNA-seq). All genes that exhibited a fold change (FC) ≥2.0 or ≤0.5 and a false discovery rate derived by Benjamini-Hochberg correction (FDR(BH)) <0.1 after stimulation with BMP6 and/or BMP4 are represented by a grey dot. Genes of the BMP pathway and the Notch pathway are highlighted in color. Genes on a white background control skeletal muscle development. (B) Differentially expressed genes in response to BMP6 and/or BMP4 treatment. (C) Dot plot showing significantly enriched signaling pathways (FDR <0.05). The size of the dot reflects the number of pathway genes upregulated in response to BMP stimulation and the color denotes the -log10FDR(BH). N = 2 biological replicates per condition.
Figure 2.
Regulation of multiple BMP and Notch pathway genes in BMP-stimulated, cultured mouse MuSCs. (A) BMP4 (x-axis) versus BMP6 (y-axis) regulated genes revealed by RNA-sequencing (RNA-seq). All genes that exhibited a fold change (FC) ≥2.0 or ≤0.5 and a false discovery rate derived by Benjamini-Hochberg correction (FDR(BH)) <0.1 after stimulation with BMP6 and/or BMP4 are represented by a grey dot. Genes of the BMP pathway and the Notch pathway are highlighted in color. Genes on a white background control skeletal muscle development. (B) Differentially expressed genes in response to BMP6 and/or BMP4 treatment. (C) Dot plot showing significantly enriched signaling pathways (FDR <0.05). The size of the dot reflects the number of pathway genes upregulated in response to BMP stimulation and the color denotes the -log10FDR(BH). N = 2 biological replicates per condition.
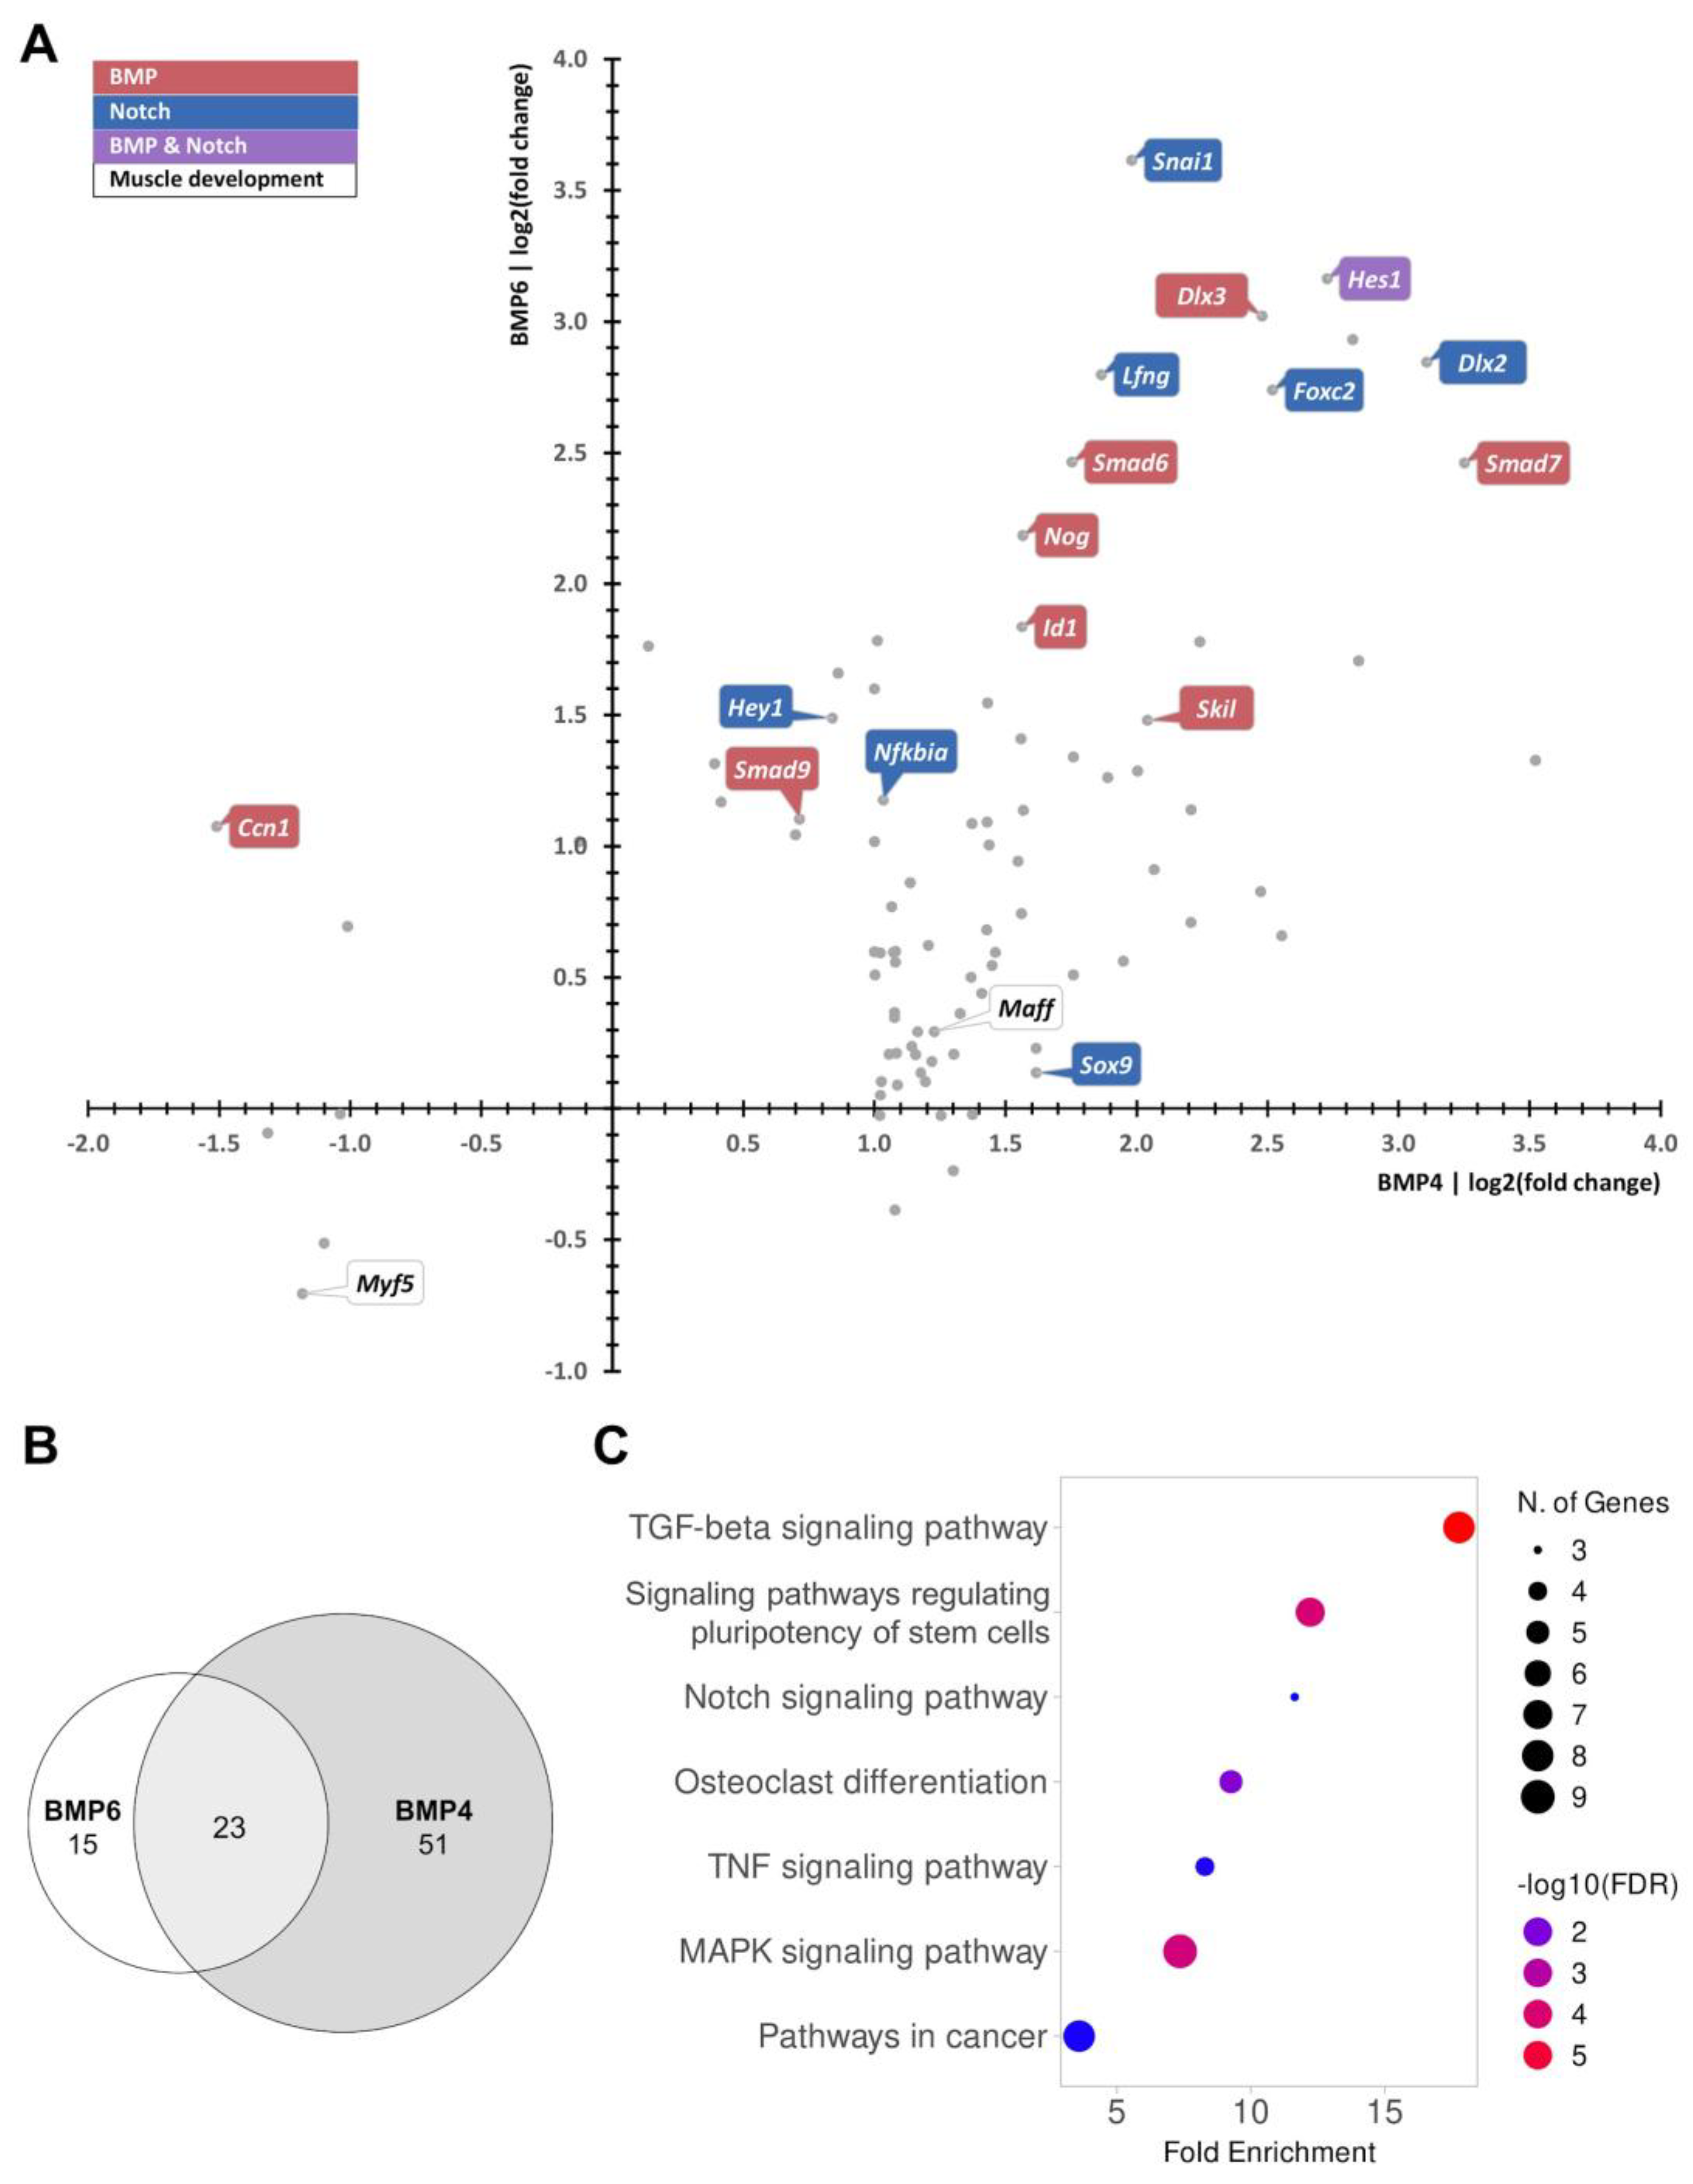
Figure 3.
pSMAD1/5/9 and SMAD4 peaks determined by Cleavage Under Targets and Tagmentation (CUT&Tag) are enriched in transcription start sites (TSSs) and differentially expressed genes (DEGs). (A, B) Average profiles and heatmaps of pSMAD1/5/9 (A) and SMAD4 (B) peaks from BMP6-treated versus control cells centered around the peak summit. One out of n = 2 biological replicates is shown. (C) Locations of SMAD and H3K27ac peaks in relation to the closest gene in BMP6-treated versus control cells. (D) Genes bound by pSMAD1/5/9 and/or SMAD4 in the gene body ±20 kb in BMP6-treated cells compared with DEGs detected in RNA-seq 1.
Figure 3.
pSMAD1/5/9 and SMAD4 peaks determined by Cleavage Under Targets and Tagmentation (CUT&Tag) are enriched in transcription start sites (TSSs) and differentially expressed genes (DEGs). (A, B) Average profiles and heatmaps of pSMAD1/5/9 (A) and SMAD4 (B) peaks from BMP6-treated versus control cells centered around the peak summit. One out of n = 2 biological replicates is shown. (C) Locations of SMAD and H3K27ac peaks in relation to the closest gene in BMP6-treated versus control cells. (D) Genes bound by pSMAD1/5/9 and/or SMAD4 in the gene body ±20 kb in BMP6-treated cells compared with DEGs detected in RNA-seq 1.
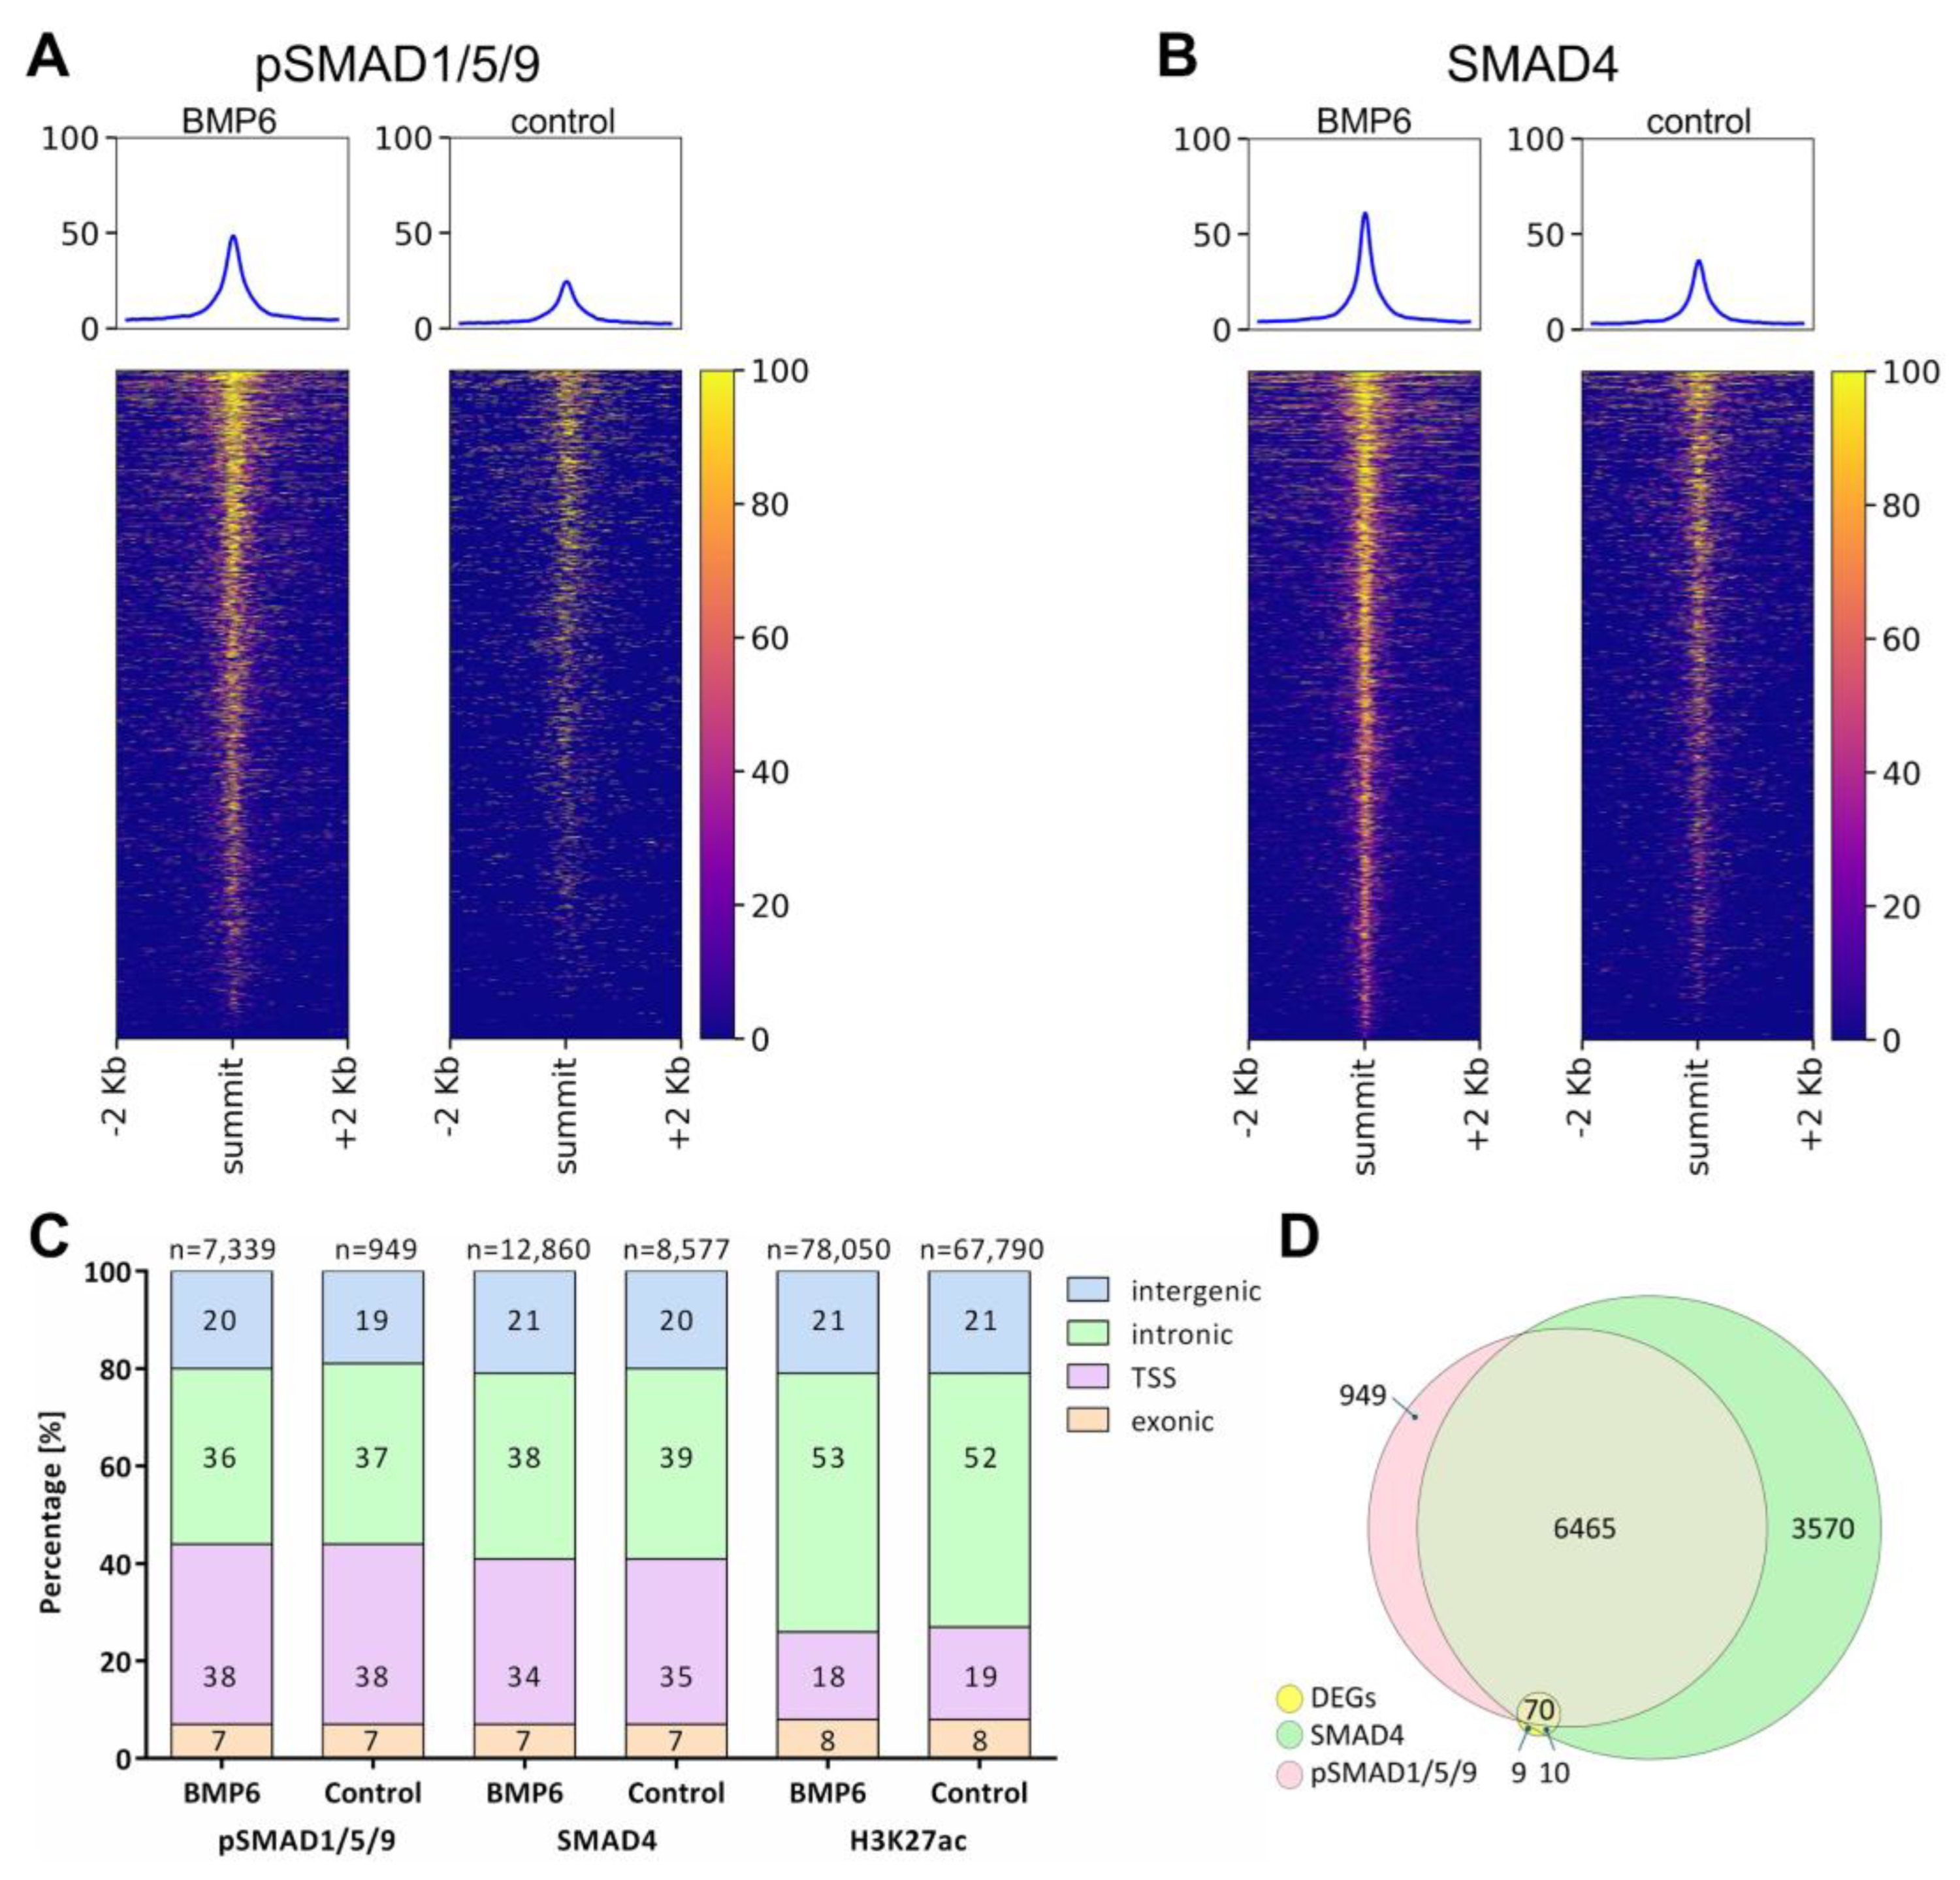
Figure 4.
Binding of SMADs to BMP-regulated genes. (A, B) Binding of pSMAD1/5/9 and SMAD4 to the promoters of Hes1 (A) and Hey1 (B), two central effector proteins of the Notch pathway. Shown are the CUT&Tag traces of pSMAD1/5/9 (BMP6 versus control) in purple, SMAD4 traces (BMP6 versus control) in green, as well as analysis of H3K27ac (BMP6 versus control) in orange. RNA-seq traces (BMP6 versus control) are depicted in grey at the bottom. One out of n = 2 biological replicates is shown. See Figure S3 for additional loci. (C) Scheme of the crosstalk between the BMP and the Notch pathway via binding of pSMAD1/5/9 and SMAD4. Genes marked by dashed borders were regulated by BMP4/6 on the mRNA level in this study. Transcription factors that are depicted below the DNA strand have inhibitory action. Thick gray arrows indicate that multiple intermittent signaling steps lead to the respective cellular fate.
Figure 4.
Binding of SMADs to BMP-regulated genes. (A, B) Binding of pSMAD1/5/9 and SMAD4 to the promoters of Hes1 (A) and Hey1 (B), two central effector proteins of the Notch pathway. Shown are the CUT&Tag traces of pSMAD1/5/9 (BMP6 versus control) in purple, SMAD4 traces (BMP6 versus control) in green, as well as analysis of H3K27ac (BMP6 versus control) in orange. RNA-seq traces (BMP6 versus control) are depicted in grey at the bottom. One out of n = 2 biological replicates is shown. See Figure S3 for additional loci. (C) Scheme of the crosstalk between the BMP and the Notch pathway via binding of pSMAD1/5/9 and SMAD4. Genes marked by dashed borders were regulated by BMP4/6 on the mRNA level in this study. Transcription factors that are depicted below the DNA strand have inhibitory action. Thick gray arrows indicate that multiple intermittent signaling steps lead to the respective cellular fate.
Disclaimer/Publisher’s Note: The statements, opinions and data contained in all publications are solely those of the individual author(s) and contributor(s) and not of MDPI and/or the editor(s). MDPI and/or the editor(s) disclaim responsibility for any injury to people or property resulting from any ideas, methods, instructions or products referred to in the content. |
© 2026 by the authors. Licensee MDPI, Basel, Switzerland. This article is an open access article distributed under the terms and conditions of the Creative Commons Attribution (CC BY) license (http://creativecommons.org/licenses/by/4.0/).
Copyright: This open access article is published under a Creative Commons CC BY 4.0 license, which permit the free download, distribution, and reuse, provided that the author and preprint are cited in any reuse.


