Submitted:
12 March 2026
Posted:
13 March 2026
You are already at the latest version
Abstract
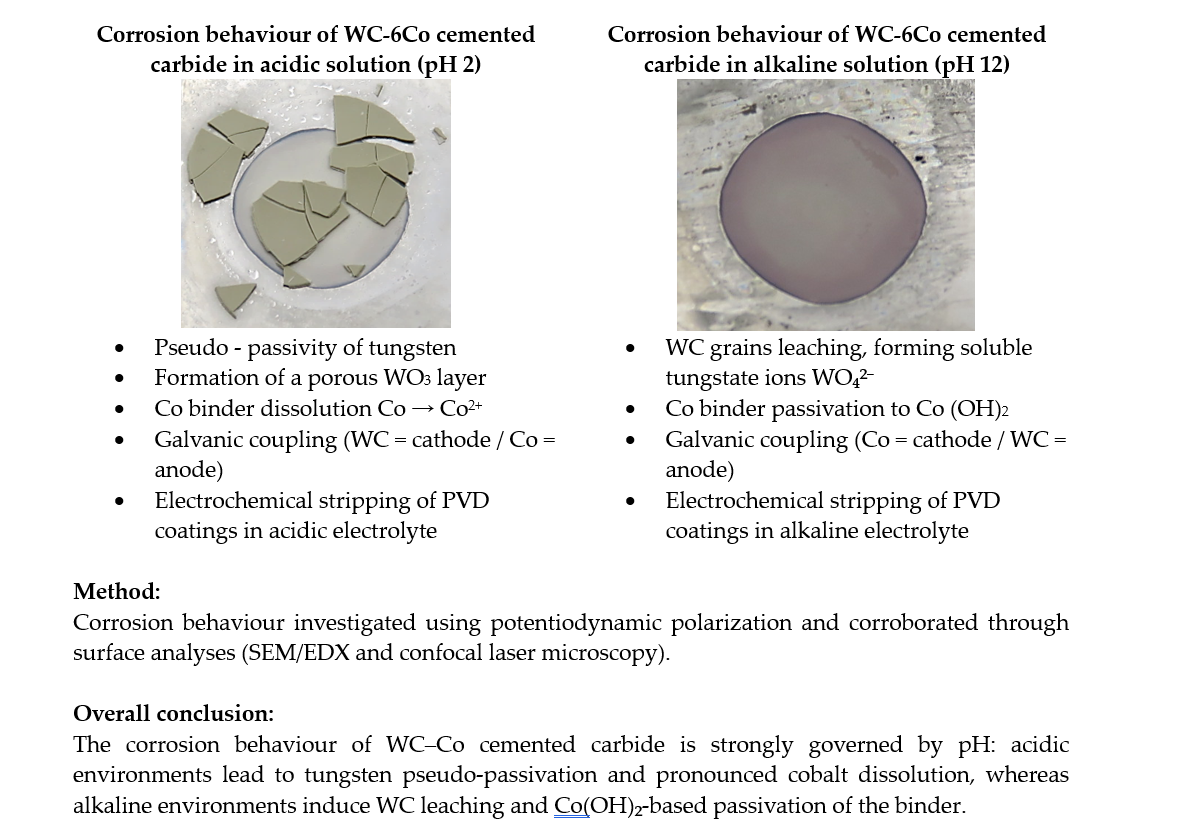
This study investigates the corrosion behavior of a WC-6Co cemented carbide (94 wt% WC, 6 wt% Co) in acidic (pH 2) and alkaline (pH 13) aqueous environments, with em-phasis on implications for reconditioning processes. Both electrolytes, characterized by their high electrical conductivity, are used in industrial electrochemical stripping of PVD coatings. While acidic electrolytes are already established for stripping coatings from hard metal substrates, the influence of the alkaline electrolytes on substrate integrity remains insufficiently explored, especially considering the implication of reconditioning. Elec-trochemical characterization was performed using potentiodynamic polarization method, followed by surface analysis via SEM, EDX, and laser confocal microscopy. Two distinct corrosion mechanisms were identified, corresponding to the respective pH conditions and consistent with predictions from Pourbaix diagrams. In acidic media, cobalt dissolution occurred alongside strong passivation of tungsten through the formation of WO₃. In contrast, under alkaline conditions, tungsten formed soluble tungstate ions (WO₄²⁻), leading to progressive leaching of WC grains, while cobalt exhibited passivation via a Co(OH)₂ layer, mitigating binder degradation. Within the scope of this work, electrolytes used for electrochemical stripping were examined. The investigation focused on their corrosive impact on uncoated hard-metal substrates under electrochemical stripping conditions, as these become exposed to both the electrolyte and applied potential once the coating is removed. Coating removal itself was not addressed. A key finding is that oxide or hydroxide passivation on cemented carbides does not inherently guarantee protection. Its effectiveness depends strongly on the nature of the formed layer. In the acidic elec-trolyte, pseudo-passivation by formation of WO₃ layer initially inhibits corrosion but leads to significant material loss upon its breakdown. These findings provide valuable guidance for the application of cemented carbides in electrochemical stripping processes used for PVD coating removal.
Keywords:
Tungsten-carbide
; electrochemical corrosion behaviour
; potentiodynamic polarization
; electrochemical stripping
; reconditioning
1. Introduction
Cemented carbides are composite materials consisting of hard carbide particles embedded in a metallic binder matrix. The most widely used system combines tungsten carbide (WC) with cobalt (Co) as the binder phase, providing an exceptional balance of hardness, toughness, and wear resistance [1], which makes them indispensable for cutting tools and wear-resistant applications [2]. Their microstructure typically comprises WC grains ranging from 0.2–6 µm dispersed within the cobalt matrix, where higher cobalt content improves toughness at the expense of hardness [3].
Due to their biphasic structure, cemented carbides are susceptible to galvanic corrosion, in which either the Co binder or WC grains dissolve depending on the pH of the medium [4,5]. Thermodynamic stability regions of Co and W in aqueous systems can be interpreted using Pourbaix diagrams: cobalt dissolves under acidic conditions but passivates in alkaline media through Co(OH)₂ formation. In contrast, tungsten tends to passivate in acidic environments via WO₃ formation but becomes unstable under alkaline conditions, where soluble tungstate ions (WO₄²⁻) are formed [6].
In acidic solutions, WC forms a passive WO₃ film, while cobalt readily dissolves, leading to degradation of the matrix and eventual loss of mechanical integrity [5,7]. This galvanic interaction is consistent with the polarization measurements reported by Sutthiruangwong et al. [5], which show lower corrosion potential and higher current density for cobalt compared to tungsten carbide.
For tungsten carbide the simplified passivation reaction in acidic media is given as [7]:
Tungsten carbide forms a WO3 layer on the surface of it grains. Galvanic coupling reactions between WC and Co result in cathodic protection of WC grains, while Co binder matrix acts as the anode and undergoes dissolution, as shown in the equation below [3,6]:
Under alkaline conditions, tungsten is thermodynamically unstable and forms soluble tungstate ions WO42-, while Co passivates through the formation of a Co(OH)2 layer [6,7]:
The aim of this study is to investigate the electrochemical behaviour of WC-6Co cemented carbide in acidic (pH 2) and alkaline (pH 13) environments using potentiodynamic polarization, SEM/EDX, and confocal laser microscopy. Particular attention is given to identifying the corrosion mechanisms and evaluating the protective effectiveness of passivation layers under different pH conditions. The electrolytes used in this study, characterized by their high electrical conductivity are proprietary solutions developed for the electrochemical removal of PVD coatings. Thus, the objective is to assess their influence on the underlying cemented carbide substrate during de-coating processes.
2. Theory – Reconditioning in Surface Coating Technology
Physical Vapor Deposition (PVD) is a widely used technique for applying extremely hard and ultra-thin coatings, typically only a few micrometres thick. This technology enables the deposition of layers that significantly enhance the performance and lifespan of cutting tools, forming tools and precision components. Coating properties such as hardness, toughness and durability can be precisely tailored by selecting the appropriate metallic targets and reactive processing gases [9].
To fully exploit these benefits throughout the tool’s service life, it is essential that coatings not only perform reliably but also can be removed without damaging the underlaying substrate. This makes reconditioning a critical step, as it enables selective stripping of worn or defective layers followed by recoating. Reconditioning offers both economic and ecological benefits by extending tool lifetime, reducing material consumption, and minimizing waste generation [10].
In industrial practice, stripping hard ceramic coatings without damaging the substrate is critical. Typical situations requiring controlled stripping:
Coating removal (stripping) can be achieved through physical, chemical, electrochemical, or plasma-based methods. Physical techniques such as sandblasting risk altering substrate geometry, whereas chemical and electrochemical approaches offer greater control and substrate preservation. Electrochemical stripping allows process optimization via electrolyte composition, temperature, current density, and pH, with additives such as Akolidines [11] enhancing selectivity and surface protection. A major challenge arises when coating and substrate share similar chemical compositions, requiring precise control to avoid substrate damage and maintain dimensional integrity [10].
Electrochemical Stripping Processes
In electrochemical processes, the mechanism involves the oxidation of the coating elements, given by the application of electrical power. The workpieces are connected as the anode and immersed in an electrolyte that serves as the medium for ionic transfer. To minimize ohmic loss, the electrolyte must exhibit high electrical conductivity [14]. The cathode surrounds the anode and its geometry is adapted to the shape and size of the part being stripped. Cathodes are typically made of a highly durable materials, most commonly stainless steel. An appropriate cathode-to-anode surface area ratio is essential to avoid current-density limitations that would otherwise reduce the stripping rate [14]. Furthermore, electrolyte agitation or controlled movement of the workpiece is required to remove anodically dissolved ions from the surface, thereby preventing local concentration gradients and improving stripping uniformity [13,14]. The process can be controlled either potentiostatic, where the applied voltage is regulated and the resulting current is monitored, or galvanostatic, where the current is kept constant and the voltage varies accordingly.
For a potentiostatic controlled process, once the coating is fully removed, a pronounced change or drop in current is observed, serving as an indicator to stop the process to prevent unnecessary material corrosion. A notable advantage of the electrochemical stripping process is the long lifetime of the electrolyte. Unlike in wet chemical etching, the electrolyte serves as an ion transfer medium and is not consumed during stripping, making it more cost-effective and sustainable. Additionally, the decoating process can be monitored in real time by observing the current response. Furthermore, the stripping time is considerably shorter than in wet chemical processes.
3. Experimental
3.1. Materials
The specimens used in this study are cemented carbide samples composed of 94 wt% tungsten carbide (WC) and 6 wt% cobalt (Co), commonly referred to as WC-6Co (see Figure 1). A representative sample was used as an internal standard for analytical investigations. This sample is a polished, indexable cutting insert with dimensions of 12 × 12 mm and a surface roughness of Ra 0.025 µm. This material closely reflects the composition and microstructure of cemented carbide tools widely used in industrial applications. Its standardized nature ensures reproducibility and comparability in surface and corrosion studies.
3.2. Electrochemical Testing
Electrochemical measurements were performed with a three-electrode system in a flat corrosion cell with an electrolyte volume of 100 ml. The cemented carbide sample served as the working electrode (WE), an Ag/AgCl (3 M KCl) electrode was used as the reference electrode (RE), and a stainless-steel electrode as the counter electrode (CE). All potentials are reported with respect to the Ag/AgCl (3 M KCl) reference electrode, which is + 211 mV versus the standard hydrogen electrode (SHE) at 20 °C.
For all measurements, a consistent electrolyte volume of 100 ml was used. The exposed surface area of the sample was 0.63 cm². In the flat cell, the sample is positioned horizontally at the bottom of the cell. This orientation allows gas bubbles to detach directly from the surface and disperse into the solution. Due to this position of the sample, stirring could not be applied. To closely replicate the conditions of a real industrial stripping process, the electrolyte was not purged with nitrogen. N2 purging is common for reducing oxygen-induced corrosion but does not reflect typical production environments.
As the carbide samples were already highly polished, no further surface polishing was performed prior to the measurements. To remove any potential residues, the surfaces were first rinsed with ethanol, followed by deionized water (conductivity < 0.5 µS/cm), ensuring a clean surface condition for accurate electrochemical analysis.
3.2.1. Potentiodynamic Polarisation
Potentiodynamic polarization was used to evaluate the electrochemical behaviour of WC–6Co in both acidic (pH 2) and alkaline (pH 13) environments. In contrast to linear polarization, which is typically restricted to a narrow potential interval around the corrosion potential to assess uniform corrosion, potentiodynamic polarization involves sweeping the potential over a wide range to study anodic and cathodic reactions in detail [17].
For the WC–6Co measurements, the working electrode was polarized from OCP − 0.2 V up to +3 V at a scan rate of 1 mV·s⁻¹. This potential range was selected based on the stability-window analysis obtained from the Pt electrode to avoid excessive hydrogen evolution in the acidic electrolyte at highly negative potentials and to focus on anodic phenomena such as passivation, transpassive dissolution, and metal degradation. The scan rate of 1 mV·s⁻¹ was chosen to ensure quasi-equilibrium conditions while minimizing capacitive distortions. The resulting polarization curves were analysed using Tafel-slope evaluation based on the Butler–Volmer equation to extract electrochemical parameters such as the corrosion potential (Ecorr), corrosion current density (jcorr) and polarisation resistance (Rpol). While these parameters describe the reaction kinetics in the near-OCP region, they do not capture the strongly potential-driven kinetics that dominate at the higher anodic potentials relevant to electrochemical stripping.
Potentiodynamic polarisation measurements were performed using a Metrohm Autolab PGSTAT302N potentiostat operated via Metrohm NOVA 2.1.6 software.
3.3. Surface Characterization
Surface characterization was carried out both before and after potentiodynamic polarization testing to evaluate morphological changes and corrosion-induced alterations on the WC–6Co samples. Laser profilometry, scanning electron microscopy (SEM), and energy-dispersive X-ray spectroscopy (EDX) were employed to assess material loss, surface topography, and elemental composition.
Surface topography and profile measurements were conducted using a Keyence VK-X160K laser scanning microscope at 500× magnification (NA = 0.8, working distance = 0.54 mm). Measurements focused on profiling the interface between untreated substrate and electrochemically treated surface to identify features such as passive film formation or surface abrasion due to uniform corrosion. These measurements also allowed the detection of localized corrosion features, such as pitting. Data analysis was performed using Keyence MultiFileAnalyser software.
High-resolution imaging and elemental analysis were performed with a Zeiss Sigma 300 SEM equipped with a Schottky field emission gun and a Smart EDX (EDAX) detector. SEM measurements were conducted at 15 kV acceleration voltage and working distance of 10 mm, using magnifications of 100× and 5000×. EDX measurements were conducted at 1000× and elemental data were reported in weight percent (wt%) using standardless quantification.
Cross-sectional analysis presented in this work was conducted on an actual industrial tool after real electrochemical stripping in the acidic electrolyte (pH 2) investigated in this study. This measurement was performed using a ThermoFisher Scios 2 HiVac Dual-Beam FIB-SEM, which combines a focused ion beam with high-resolution field-emission SEM imaging. Imaging was conducted at 20,000× magnification and at an accelerating voltage of 5 kV.
4. Results
4.1. Electrochemical Investigation of Alkaline and Acidic Electrolytes Using a Pt Working Electrode
To determine the electrochemical stability windows of both electrolytes and to identify potential ranges that should be avoided during polarization measurements on WC–6Co, potentiodynamic polarization was first performed on an inert platinum working electrode (Pt). Potentiodynamic polarization measurements were conducted from −1 V to +3 V at a scan rate of 1 mV·s⁻¹ under stirred conditions in a 1 L corrosion cell. Figure 2 shows the resulting polarization curves recorded in the alkaline (pH 13) and acidic (pH 2) electrolytes.
In the cathodic region (E < Ecorr), the acidic electrolyte exhibits significantly higher current densities than the alkaline electrolyte. This behaviour is characteristic of intensified hydrogen evolution, which is strongly favoured at low pH. The high cathodic currents therefore indicate accelerated proton reduction (2H⁺ + 2e⁻ → H₂). Platinum is an excellent hydrogen evolution catalyst, which further amplifies cathodic activity in acidic media. In contrast, the alkaline electrolyte shows much lower cathodic currents, consistent with the slower hydrogen evolution kinetics associated with water reduction (2H₂O + 2e⁻ → H₂ + 2OH⁻), a well-established effect reflecting the two-orders-of-magnitude decrease in HER rates on Pt in alkaline compared to acidic conditions [18].
In the anodic region, the acidic electrolyte displays a relatively broad passive-like plateau between approximately 0.3 and 1.2 V with current densities around 0.02 mA/cm². Beyond ~2.3 V, a steep rise in current density occurs, corresponding to oxygen evolution and the onset of electrolyte decomposition. The alkaline electrolyte exhibits a narrower passive region between ~0.05 and 0.6 V at approximately 0.01 mA/cm². At higher potentials, a gradual increase in anodic current is observed, but the overall current remains lower than in the acidic medium. This enhanced stability may be attributed to the presence of surfactants and phosphate-based inhibitors, which adsorb onto the platinum surface, suppressing charge transfer and mitigating oxygen evolution.
Based on the stability-window analysis obtained from the Pt electrode, the potential range for the WC–6Co measurements was adjusted to start at OCP − 0.2 V to avoid excessive hydrogen evolution in the acidic electrolyte and prevent unintended surface alterations.
The upper limit was set to +3 V, as the focus of these measurements was to examine anodic processes relevant to electrochemical stripping such as passivation and transpassive dissolution. In this context, precise corrosion-rate determination was of secondary importance, since electrochemical stripping involves the application of an external potential rather than free-corrosion conditions.
4.2. Corrosion Behaviour of WC-6Co in Alkaline and Acidic Electrolytes
The corrosion behavior of WC-6Co cemented carbide in the alkaline (pH 13) and acidic (pH 2) electrolytes used for electrochemical stripping was investigated using potentiodynamic polarization. The potential was scanned from OCP – 0.2 V to +3 V at 1 mV·s⁻¹, a range selected based on the stability-window analysis obtained from the Pt electrode. All measurements were performed in a flat corrosion cell containing 100 mL of electrolyte, under unstirred conditions at 20 °C. Following the electrochemical tests, surface analyses were carried out to compare corrosion mechanisms in two electrolytes with different pH values. The resulting polarisation curves are shown in Figure 3 in (a) logarithmic and (b) linear form to facilitate comparison of cathodic and anodic reaction regions.
To complement the qualitative evaluation of the polarization curves, Tafel parameters derived from the near-OCP region are summarized in Table 1. Although these values provide a useful indication of the relative corrosion tendency close to corrosion potential, they are less relevant for interpreting the corrosion mechanisms that occur at the higher anodic potentials typical of electrochemical stripping, where metal dissolution, pseudo-passivation and oxide-film breakdown govern material removal.
The corrosion current density (jcorr) is higher in the acidic electrolyte than in the alkaline solution, which indicates a greater tendency for dissolution near the corrosion potential. This trend is consistent with the significantly higher anodic current densities observed in the active dissolution region of the acidic electrolyte. Although the corrosion rate is temporarily attenuated at intermediate potentials (at ~0.65 to 0.85 V) due to the formation of a WO₃-based pseudo-passive layer, the porous and mechanically unstable nature of this oxide limits its protective effect. It should also be noted that the electrolytes used for electrochemical stripping do not contain oxidizing agents and primarily serve as highly conductive transport media at the respective pH values. Consequently, the corrosion behaviour relevant to electrochemical stripping is dominated by the mechanisms occurring at higher anodic potentials - such as leaching, passivation, oxide growth and subsequent oxide – film breakdown or partial film flaking - so the Tafel parameters serve only as supportive indicators rather than primary descriptors.
In the acidic electrolyte (pH 2), WC-6Co exhibits a pseudo-passive plateau between approximately 0.65 to 0.85 V vs Ag/AgCl, within gas evolution ceases. Although the current density appears to stabilize within this potential range, the measured values (~0.6–0.7 mA cm⁻²) remain far higher than typical passive current densities (~10 µA cm⁻² [15]). indicating that the material does not achieve true passivation. This behaviour is therefore classified as pseudo-passivity and is associated with the onset of a porous WO₃ layer formation, on the tungsten rich surface. The growth of the passive film follows the mechanism described by Sato [11], involving place-exchange and/or field-assisted ionic migration. Oxygen ions migrate toward the metal/oxide interface to form the inner oxide layer, while metal ions move toward the oxide/electrolyte interface resulting in the formation of an outer oxide layer that may incorporate electrolyte species.
As the anodic potential increases beyond approx. 0.85 V, the current density rises again, marking the onset of transpassive behaviour. In this regime, continued tungsten oxidation thickens the WO₃ layer, which becomes increasingly porous and permeable to ionic transport. Consequently, the anodic current density increases further as shown in Figure 3b. At potentials around 1.9 V, a temporary decrease in the current density is observed, which can be attributed to short-term densification or local stabilization of thick WO3 layer. At approx. 2.8 V, the oxide undergoes breakdown, accompanied by fracturing and detachment of the thick and porous pseudo-passive layer. This is reflected in a sharp current spike from ~25 mA·cm⁻² to ~95 mA·cm⁻², indicating the exposure of fresh substrate material. The subsequent decrease in current density corresponds to the formation of a new oxide layer, after which the cycle of oxide growth and breakdown may repeat. This sequence of porous oxide formation, transient stabilisation, and mechanical failure is characteristic of transpassive behaviour and highlights the limited protective capability of the WO₃ layer under acidic conditions.
In contrast, the alkaline electrolyte does not exhibit a pronounced pseudo-passive region. Tungsten is thermodynamically unstable under alkaline conditions and dissolves as soluble tungstate ions (WO₄²⁻), while cobalt forms a thin Co(OH)₂ surface layer that provides partial passivation [6]. This behaviour is reflected in the anodic branch, where the current density increases steadily from the onset of anodic dissolution (~0.3 V) into the transpassive region, indicating predominantly active metal dissolution without the establishment of a stable protective surface film. Transpassivation, as described by Song [13], is characterised by a sustained increase in anodic current density and is generally considered a form of corrosion damage. Compared to the acidic system, in the alkaline electrolyte WC-6Co material exhibits transpassive behaviour at comparatively lower anodic potentials, but with much smaller current densities due to slower WO42- formation kinetics.
A clear distinction between both electrolytes is reflected in the anodic current densities relative to the commonly referenced 5 mA·cm⁻² threshold defined in ASTM G61 [19] as an indicator of significant anodic activity: the acidic electrolyte exceeds this value already within the active dissolution region, whereas the alkaline electrolyte remains far below it, highlighting the fundamentally faster WO₃-film growth kinetics in acidic media compared to the slower WO₄²⁻-formation kinetics in alkaline solution.
These differences arise from the microstructural composition of the WC–6Co substrate. Due to the high WC content (94 wt%) and the relatively low cobalt fraction (6 wt%), the electrochemical response is governed predominantly by the WC phase. In the acidic electrolyte, the oxidation of WC produces a WO₃-based pseudo-passive layer, whereas in alkaline media tungsten dissolves directly as WO₄²⁻. Although cobalt can form a passive hydroxide film in alkaline conditions, its low surface fraction is insufficient to stabilize the overall surface. As a result, the acidic electrolyte exhibits pseudo-passivity followed by transpassive breakdown, while the alkaline electrolyte shows a direct transition from active dissolution to transpassive behaviour without the formation of a protective film.
4.3. Surface Characterization of WC-6Co After Potentiodynamic Polarisation in Acidic Electrolyte
Figure 4 shows the WC-6Co sample after potentiodynamic polarization testing in the acidic electrolyte (pH 2), revealing a separated oxide-layer exposed on the surface. A thick yellowish - grey primary oxide layer is loosely attached to the surface, while a second intact oxide layer is visible beneath it. SEM micrograph at 100x magnification (Figure 5c) reveal the intact underlaying oxide layer after removal of the fractured layer, showing a porous surface morphology resembling dried, cracked soil. The corresponding EDX spectrum (Figure 5d) indicates an elevated oxygen and tungsten content, whereas cobalt is not detected. For comparison, SEM and EDX analyses of the untreated surface prior to testing are shown in Figure 5a and Figure 5b.
Surface profile measurements obtained using laser microscope reveal a highly rough surface with an average profile depth of approximately 3.4 µm. Upon higher magnification, individual depressions of up to 6 µm in depth were observed. These depressions confirm the highly porous and non-uniform nature of the WO₃ layer, consistent with the cracked and irregular oxide morphology seen in the SEM micrograph in Figure 5c. To estimate the possible thickness of the WO₃ oxide layer, an additional surface profile measurement was carried out on a WC-6Co sample polarized at a higher scan rate of 5 mV·s⁻¹. In contrast to the polarization curve recorded at 1 mV·s⁻¹, the curve obtained at 5 mV·s⁻¹ did not exhibit a pronounced anodic current peak, indicating that the initially formed oxide layer had not yet detached (data not shown). This behavior can be attributed to the significantly shorter exposure time at higher scan rates, resulting in reduced oxidation–thinning cycles and delayed film fracture. The corresponding surface profile indicates a WO₃ film thickness of approximately 44 µm, demonstrating substantial anodic oxidation of tungsten under these conditions.
The SEM micrograph presented in Figure 6 further confirms the brittle and porous nature of the oxide layer, revealing extensive cracking and locally detached fragments. These features are consistent with the electrochemical response shown in Figure 3, where high anodic currents persist despite continuous oxide growth, indicating that the increasingly porous and ion-permeable WO₃ film formed under prolonged anodic polarization is mechanically unstable and prone to cracking.
Since the oxide layer must be removed prior to recoating, geometric change to the substrate must be considered. To assess the depth of uniform corrosion after removal of the oxide layer, the sample was subjected to ultrasonic treatment in ethanol within a beaker. Subsequent surface profile measurements reveal a uniform material loss with an average surface abrasion of approximately 8 µm.
The FIB (Focused-Ion-Beam) cross-section shown in Figure 7b, obtained from a cemented carbide cutting tool after industrial electrochemical stripping process in an acidic electrolyte (pH 2) supports the laboratory findings. The cross-section reveals loose WC grains and loss of the cobalt binder matrix in the near-surface region. To further corroborate this behaviour, an additional SEM top-view micrograph of the same tool was analysed (Figure 7a). The surface image clearly shows exposed WC grains and the absence of the cobalt matrix.
4.4. Surface Characterization of WC-6Co After Potentiodynamic Polarisation in Alkaline Electrolyte
Surface profile measurements performed after the potentiodynamic polarization in the alkaline electrolyte (pH 13) revealed neither the formation of a thick oxide layer nor any evidence of oxide-film breakdown. The average material removal from the surface was approx. 0.3 µm. Localized profilometric analysis of smaller areas revealed depressions up to 3 µm in depth (profilometric data not shown). However, pronounced leaching of WC particles resulted in significant surface roughening, which in industrial applications, necessitates subsequent micro-blasting to remove the remaining loose, soft cobalt matrix. This treatment does not increase the actual material removal depth but eliminates the mechanically weakened cobalt matrix until the original carbide structure is reached.
As shown in Figure 8, the exposed surface exhibited a faint pinkish coloration, which is characteristic of Co(OH)₂ and indicates cobalt passivation under alkaline conditions. This observation is fully consistent with the Pourbaix predictions for the Co–H₂O system [6], where cobalt stabilizes thermodynamically as Co(OH)₂ in high-pH environments.
SEM micrograph and EDX spectrum analyses (Figure 9) clearly demonstrate leached WC grains and an oxidized Co-matrix (highlighted in red), which aligns with the predictions from the Pourbaix diagrams [6].
It should be noted that the parameters of the potentiodynamic polarization process differ significantly from those used during industrial electrochemical stripping, where much higher voltages are applied for only a few seconds or minutes. In contrast, during the laboratory polarisation measurement, the samples were exposed to lower potentials but for significantly longer duration, which resulted in more pronounced surface damage. Nonetheless, this measurement provides valuable insights into the corrosion mechanisms occurring during the stripping process.
5. Discussion
Electrochemical investigations of WC–6Co in acidic (pH 2) and alkaline (pH 13) electrolytes revealed distinct corrosion mechanisms that are consistent with thermodynamic predictions from Pourbaix diagrams [6]. In the acidic electrolyte, preferential Co dissolution was observed, whereas tungsten exhibited pronounced pseudo-passivation through WO₃ formation. These findings align with previous studies, such as Sutthiruangwong et al. [5], who reported that cobalt exhibits a lower corrosion potential and higher corrosion current density than WC, while WC shows a more noble corrosion potential and the occurrence of pseudo-passive plateaus. This indicates that WC is considerably more corrosion resistant than Co in acidic environments. This potential difference establishes a galvanic couple in which WC behaves as the cathodic phase and cobalt as the anodic phase, accelerating selective Co dissolution in acidic media — fully consistent with the results obtained in this work.
In contrast, the alkaline electrolyte induces thermodynamic instability in tungsten, leading to the formation of soluble tungstate ions (WO₄²⁻), while cobalt undergoes passivation via Co(OH)₂ formation, effectively limiting further cobalt dissolution. However, due to the low cobalt content of the WC–6Co substrate, this passivation effect is insufficient to prevent overall material degradation dominated by tungsten dissolution. The surface appearance and analyses corroborated this mechanism: the faint pinkish Co(OH)₂ coloration and leached WC grains indicate selective dissolution consistent with the alkaline Pourbaix stability regions. A clear distinction between both electrolytes is also reflected in the anodic current densities relative to the commonly referenced 5 mA·cm⁻² threshold defined in ASTM G61 as an indicator of significant anodic activity. The acidic electrolyte exceeds this threshold already within the active dissolution region, whereas the alkaline electrolyte remains well below it throughout the majority of the scan.
A key outcome of this study is the recognition that passivation phenomena on cemented carbide substrates do not inherently provide reliable protection. The protective effectiveness of oxide or hydroxide films depends strongly on their chemistry, porosity, ion permeability and mechanical stability. For instance, although WO₃ layer formation in acidic conditions initially reduce the corrosion, the resulting film is porous, brittle and prone to mechanical failure. Once fractured or detached, as evidenced by pseudo-passive film breakdown and subsequent re-passivation cycles, WO₃ formation contributes to further material loss rather than protecting the substrate. This behaviour is well described by the place-exchange and field-assisted ion-transport mechanism proposed by Sato [12].
These observations are consistent with other reports on passivity and pseudo-passivity in cemented carbides and related metallic systems [5,10]. Furthermore, the strong agreement between electrochemical measurements, SEM/EDX analyses, FIB cross-sections and the thermodynamic predictions of Pourbaix diagrams underscores the reliability of the identified corrosion pathways. Together, these results highlight that the corrosion behaviour of WC–6Co is governed not only by electrochemical conditions but also by the evolving morphology and mechanical stability of surface films.
6. Conclusions
The corrosion behavior of WC–6Co under electrochemical stripping conditions differs markedly between acidic and alkaline electrolytes. In the alkaline electrolyte (pH 13), tungsten carbide dissolves predominantly as WO₄²⁻, accompanied by mild oxidation and partial passivation of the cobalt binder as Co(OH)₂. In contrast, the acidic electrolyte (pH 2) promotes cobalt dissolution and tungsten pseudo - passivation to WO₃. These findings are in agreement with the thermodynamic stability regions predicted by Pourbaix diagrams [6].
Although the WO₃ layer formed in acidic media initially slows the corrosion rate, but increasing anodic potentials promote continuous oxide thickening, pore formation and subsequent film breakdown. The formation, fracture and reformation of the WO₃ film led to significant tungsten loss and pronounced geometric changes of the substrate. Because the stripping process must be stopped as soon as the current drops to zero, stringent process control is essential to avoid unnecessary overexposure and excessive material removal. This prevents unnecessary overexposure and excessive material loss, supporting optimized stripping and recoating strategies for cemented carbide components.
Overall, the results demonstrate that both electrolytes induce characteristic but fundamentally different corrosion mechanisms, and that surface film formation does not guarantee protection in cemented carbides. Understanding these mechanisms is critical for optimizing electrochemical stripping and recoating strategies to ensure surface integrity and extend the service life of WC–Co tools.
Author Contributions
Conceptualization, S.M., T.B., S.B. and M.O.; methodology, S.M., S.B.; validation, S.M., T.B. and S.B.; formal analysis, S.M.; investigation, S.M.; resources, M.O.; data curation, S.M., T.B.; writing—original draft preparation, S.M.; writing—review and editing, S.M., T.B., M.O., and S.B.; visualization, S.M., T.B., S.B. and M.O.; supervision, T.B., S.B. All authors have read and agreed to the published version of the manuscript.
Funding
This research received no external funding.
Data Availability Statement
The data supporting the findings of this study are internal and involve proprietary electrolytes and confidential industrial processing information. Therefore, they cannot be publicly shared. Data may be made available from the corresponding author upon reasonable request, subject to confidentiality restrictions.
Abbreviations
The following abbreviations are used in this manuscript:
| CE | Counter electrode |
| Co | Cobalt |
| EDX | Energy Dispersive X-ray Spectroscopy |
| FIB | Focused-Ion-Beam |
| LCM | Laser Confocal Microscopy |
| OCP | Open Circuit Potential |
| PDP | Potentiodynamic Polarization |
| PVD | Physical Vapor Deposition |
| Pt | Platinum |
| RE | Reference electrode |
| SEM | Scanning Electron Microscopy |
| W | Tungsten |
| WC | Tungsten Carbide |
| WC-6Co | Cemented carbide consisting of 94 wt% WC and 6 wt% Co |
| WE | Working electrode |
References
- 1. Sarin, V.K., Ed. Comprehensive Hard Materials; Elsevier: Oxford, UK, 2014.
- Norgren, S.; García, J.; Blomqvist, A.; Yin, L. Trends in the P/M Hard Metal Industry. Int. J. Refract. Met. Hard Mater. 2015, 48, 31–45. [CrossRef]
- Kellner, F. Korrosionsverhalten und -mechanismen von Hartmetallen mit unterschiedlicher mikrostruktureller Längenscala. Ph.D. Thesis, Friedrich-Alexander-Universität Erlangen–Nürnberg, Erlangen, Germany, 2010.
- Human, A.W.; Exner, H.E. Electrochemical behaviour of tungsten-carbide hardmetals. Mater. Sci. Eng. A 1996, 209, 180-191. [CrossRef]
- Sutthiruangwong S.; Mori, G. Corrosion properties of Co-based cemented carbides in acidic solutions. Int. J. of Refract. Met. Hard Mater. 2003, 21, 135-145. [CrossRef]
- Pourbaix, M. Atlas of Electrochemical equilibria in aqueous solutions; National Association of Corrosion Engineers (NACE): Houston, TX, USA, 1974.
- Randhawa, N.S.; Katiyar, P.K. Potentiodynamic Polarisation Behaviour and Microscopic Examination of Tungsten Carbide Hard Materials in Supported Ammoniacal Medium. Portug. Electrochim. Acta 2020, 38, 185-200. [CrossRef]
- Cristobal, A.B., Conde, A. Electrochemical stripping of hard ceramic chromium nitride coatings. Thin Solid Films 2005, 488, 238-244. [CrossRef]
- Schuhmann, H.; Oettel, H. Metallografie; Wiley-VCH Verlag GmbH & Co. KGaA: Weinheim, Germany, 2005.
- Sen, Y.; Ürgen, M.; Kazmanli, K.; Cakir, A. F. Stripping of CrN from CrN-coated high-speed steels. Surf. Coat. Technol. 1998, 113, 31-35. [CrossRef]
- Bala, H.; Adamczyk, L.; Qwczarek, E.; Gruetzner, T.; Seyfang, B. C.; Inhibition of corrosion of AISI 316L steel in concentrated acetic acid containing NaCI additions. Ochrona przed korozja 2012, 55(11), 460-463.
- Sato, N. An Overview on the Passivity of Metals. Corros. Sci. 1990, 31, 1–19.
- Song, G. Transpassivation of Fe-Cr-Ni Stainless Steels. Corros. Sci., 2005, 47, 1953–1987. [CrossRef]
- Schmidt, V.M. Elektrochemische Verfahrenstechnik; Wiley-VCH: Weinheim, Germany, 2003.
- Wei, B.; Macdonald, L.S.; Lipkin, D.M. Electrochemical System and Process for Stripping Metallic Coatings. European Patent EP1094134A1, 2001.
- Kaesche, H. Metallic Corrosion, Huston, NACE, 1985.
- Wittstock, G. Lehrbuch der Elektrochemie: Grundlagen, Methoden, Materialien, Anwendungen; Wiley-VCH: Weinheim, Germany, 2023.
- Sheng, W.; Gasteiger, H.A.; Shao-Horn, Y. Hydrogen Oxidation and Evolution Reaction Kinetics on Platinum: Acid vs Alkaline Electrolytes. J. Electrochem. Soc. 2010, 157, B1529–B1536. [CrossRef]
- ASTM G61-86; Standard Test Method for Conducting Cyclic Potentiodynamic Polarization Measurements for Localized Corrosion Susceptibility of Iron-, Nickel-, or Cobalt-Based Alloys. ASTM International: West Conshohocken, PA, USA, 2014; 19. ASTM G61-86(2014), Standard Test Method for Conducting Cyclic Potentiodynamic Polarization Measurements for Localized Corrosion Susceptibility of Iron-, Nickel-, or Cobalt-Based Alloys; ASTM International: West Conshohocken, PA, USA, 2014.
Figure 1.
Cemented carbide sample (WC-6Co) used in the study.

Figure 2.
Polarization curves of alkaline and acidic electrolytes measured on Pt working electrode.

Figure 3.
Potentiodynamic polarisation curves of WC-6Co in alkaline and acidic electrolytes: (a) logarithmic and (b) linear representation.
Figure 3.
Potentiodynamic polarisation curves of WC-6Co in alkaline and acidic electrolytes: (a) logarithmic and (b) linear representation.


Figure 4.
Exposed surface of WC-6Co sample after potentiodynamic polarisation measurement in acidic electrolyte at a scan rate of 1 mV·s⁻¹, revealing the fractured and detached yellowish-grey WO₃-based oxide layer.
Figure 4.
Exposed surface of WC-6Co sample after potentiodynamic polarisation measurement in acidic electrolyte at a scan rate of 1 mV·s⁻¹, revealing the fractured and detached yellowish-grey WO₃-based oxide layer.

Figure 5.
(a) SEM micrograph and (b) corresponding EDX spectrum of the untreated WC-6Co surface.(c) SEM micrograph and (d) corresponding EDX spectrum of WC-6Co surface after potentiodynamic polarisation in acidic electrolyte ( 1 mV·s⁻¹).
Figure 5.
(a) SEM micrograph and (b) corresponding EDX spectrum of the untreated WC-6Co surface.(c) SEM micrograph and (d) corresponding EDX spectrum of WC-6Co surface after potentiodynamic polarisation in acidic electrolyte ( 1 mV·s⁻¹).

Figure 6.
SEM micrograph of WC-6Co surface after potentiodynamic polarisation in acidic electrolyte at 5 mV·s⁻¹.
Figure 6.
SEM micrograph of WC-6Co surface after potentiodynamic polarisation in acidic electrolyte at 5 mV·s⁻¹.

Figure 7.
(a) SEM top-view micrograph of the cemented carbide cutting tool after industrial electrochemical stripping in the acidic electrolyte (pH 2), showing exposed WC grains and cobalt binder depletion at the surface. (b)FIB cross-section (20,000× magnification) of the same tool confirming Co-matrix removal in the near-surface region.

Figure 8.
Exposed surface of WC-6Co sample after potentiodynamic polarisation measurement in alkaline electrolyte at a scan rate of 1 mV·s⁻¹.
Figure 8.
Exposed surface of WC-6Co sample after potentiodynamic polarisation measurement in alkaline electrolyte at a scan rate of 1 mV·s⁻¹.

Figure 9.
: (a) SEM top-view micrograph of the WC-6Co surface after polarization in the alkaline electrolyte. (b) Corresponding EDX spectrum of the full analysed area and (c) EDX spectrum of the red marked region showing cobalt oxidation and WC grain leaching.
Figure 9.
: (a) SEM top-view micrograph of the WC-6Co surface after polarization in the alkaline electrolyte. (b) Corresponding EDX spectrum of the full analysed area and (c) EDX spectrum of the red marked region showing cobalt oxidation and WC grain leaching.


Table 1.
Tafel analysis values of WC-6Co in alkaline and acidic electrolytes.
| Sample | jcorr [mA·cm⁻²] | Ecorr [V] | Rpol [Ω] |
| WC-6Co in alkaline electrolyte (pH 13) |
1.48 ∙ 10-3 | - 0.210 | 4.44 ∙ 104 |
| WC-6Co in acidic electrolyte (pH 2) | 7.42 ∙ 10-3 | - 0.150 | 1.51 ∙ 103 |
Disclaimer/Publisher’s Note: The statements, opinions and data contained in all publications are solely those of the individual author(s) and contributor(s) and not of MDPI and/or the editor(s). MDPI and/or the editor(s) disclaim responsibility for any injury to people or property resulting from any ideas, methods, instructions or products referred to in the content. |
© 2026 by the authors. Licensee MDPI, Basel, Switzerland. This article is an open access article distributed under the terms and conditions of the Creative Commons Attribution (CC BY) license (http://creativecommons.org/licenses/by/4.0/).
Copyright: This open access article is published under a Creative Commons CC BY 4.0 license, which permit the free download, distribution, and reuse, provided that the author and preprint are cited in any reuse.


