Submitted:
11 March 2026
Posted:
12 March 2026
You are already at the latest version
Abstract
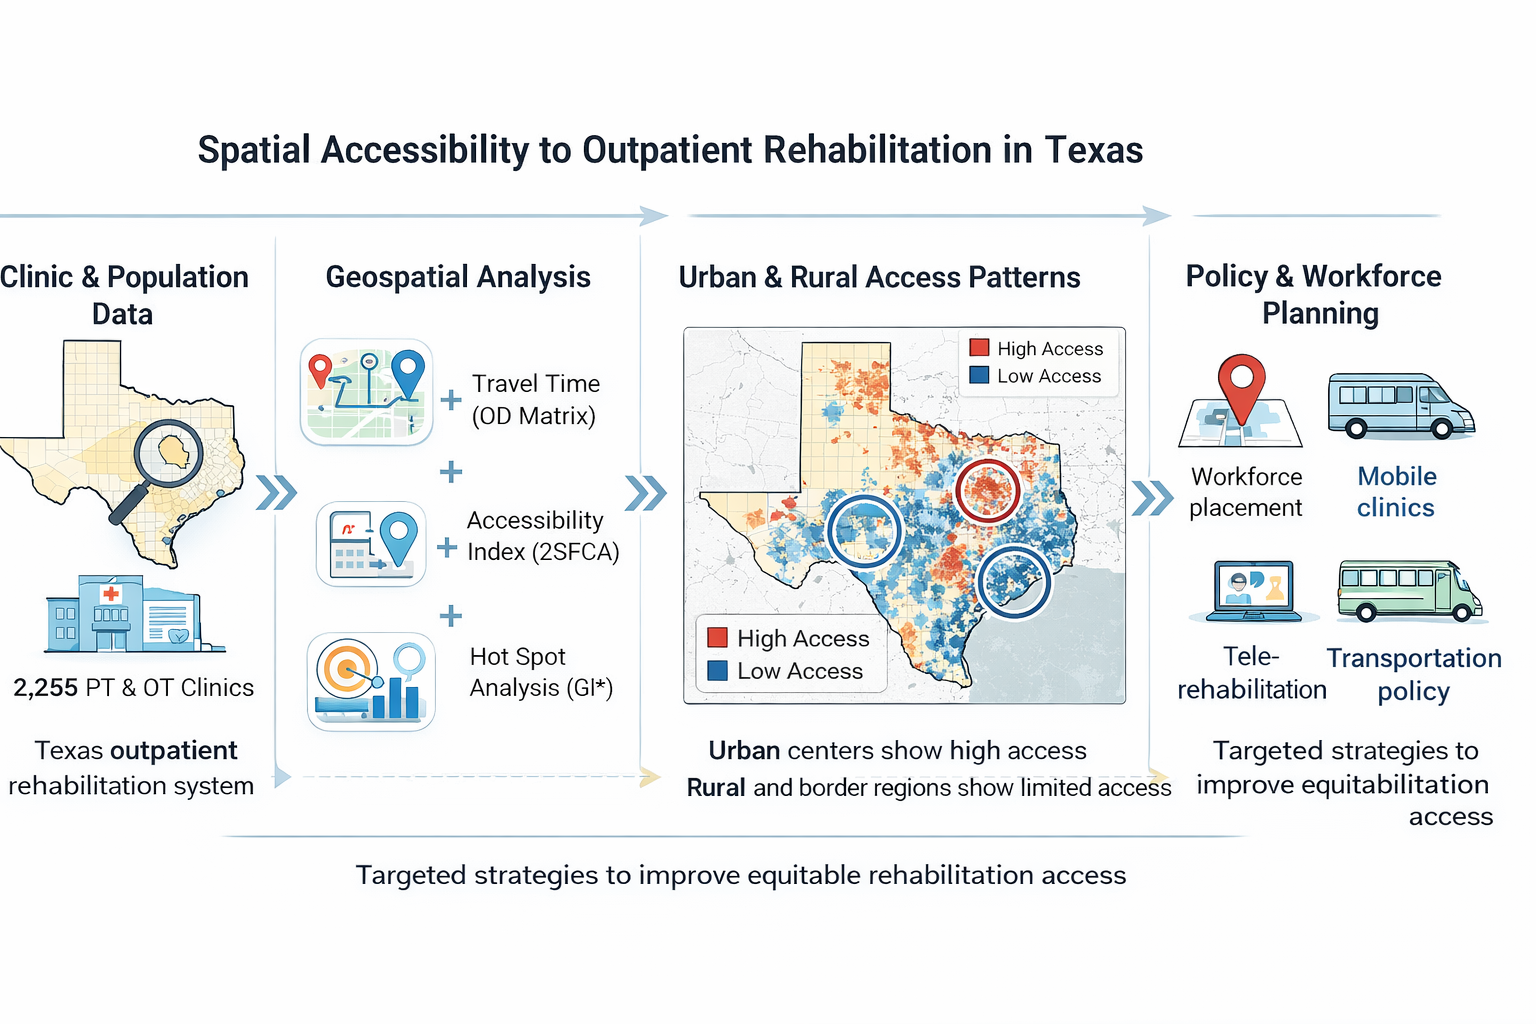
Equitable access to rehabilitation services is essential for individuals living with disa-bility, yet geographic disparities in outpatient rehabilitation care remain understudied. This study examined spatial accessibility to outpatient physical and occupational therapy services across Texas to identify regional inequities and inform workforce and policy planning. A descriptive cross-sectional geospatial analysis was conducted using outpa-tient clinic location data from the Texas Health and Human Services database (2022) and population data from the 2020 U.S. Census. Clinic addresses were verified and geocoded. Accessibility was measured using an origin–destination cost matrix to estimate travel time to the nearest clinic and the two-step floating catchment area (2SFCA) method to calculate an accessibility index. Spatial clustering of access was assessed using the Getis-Ord Gi* statistic to identify hot and cold spots. The analysis included 2,255 outpatient rehabilitation clinics across 6,896 census tracts. Travel times varied substantially, with rural areas ex-periencing the longest travel burdens. The 2SFCA analysis revealed pronounced dis-parities, with low-accessibility clusters concentrated in rural and border regions and high-accessibility clusters in urban metropolitan areas. These findings demonstrate persistent geographic disparities in outpatient rehabilitation access across Texas, sug-gesting the need for targeted workforce placement, transportation investment, and policy interventions to improve equitable access.
Keywords:
rehabilitation services
; physical therapy
; occupational therapy
; health services accessibility
; geospatial analysis
; rural health disparities
; workforce distribution
; health policy
1. Introduction
Access is defined as the timely use of personal health services to achieve the best health outcomes [1] and is shaped by key determinants such as insurance coverage, services, timeliness, and workforce supply [2,3]. Penchansky and Thomas’ Theory of Access identifies six dimensions including: availability, accessibility, accommodation, affordability, and awareness, emphasizing that geographic accessibility is a key determinant in whether patients can realistically receive care [4,5]. An accessible service, as defined by the Penchansky and Thomas model, includes services that are “within reasonable proximity to the consumer in terms of time and distance”[4,5].
Rehabilitation services, including physical and occupational therapy, play a crucial role in managing disability and improving health. Access issues to rehabilitation therapies have received less attention compared to other health services. Even in US, states with direct access legislation, which allows patients to seek rehabilitation care without a physician referral [6,7], geographic barriers can hinder realized access. Realized access is defined as an individual’s actual use of healthcare [8,9]. Insurance expansions under the Affordable Care Act reduced the number of uninsured individuals nationally [10]; however, disparities in healthcare access persist, especially across rural regions that have seen a significant reduction in community and rural hospitals [11] and in states like Texas that did not expand Medicaid [12]. Geographic and structural barriers, or obstacles created for certain groups of people through policies and procedures [13], further exacerbate disparities. Additionally, the passing of H.R.1 - One Big Beautiful Bill Act [14] in 2025, has the potential to reverse access gains made with the Affordable Care Act. H.R.1, for example, will modify eligibility for Medicaid to include a “community engagement requirement” mandating covered individuals to spend at least 80 hours monthly at work, volunteering, or in school. While these changes will not take place until 2027, they have the potential to limit the number of individuals that are eligible for coverage, reducing access [15].
Previous studies highlight these access-related challenges: neighborhoods with higher social vulnerability were found to have fewer outpatient physical therapy clinics in Denver, CO [16]. Similarly, a pilot study using census data from the Greater Brisbane, Australia region, found rehabilitation services clustered in areas with a lower prevalence of disability [17]. Lakhani et. al. used GIS mapping to understand the distribution of individuals with disability and travel times to disability services including physical, occupational, and speech therapies [18]. They found that rural regions with fewer people with disability experienced longer travel times to care clinics [18].
Texas provides a critical context for this analysis. Texas has the largest rural population in the U.S., spanning 90% of its land area [19,20]. Rural populations experience poor access to metropolitan regions and unsafe road conditions [21,22]. Even within metropolitan areas, there exist considerable “transit deserts” particularly in the metropolitan regions of Houston and San Antonio where demand for public transportation exceeds supply due to population size [23]. On average, Texans commute 27 minutes to work, with only 17 percent utilizing public transportation [24,25]. Seventeen percent of residents live in rural regions, and nearly 30% of adults report at least one disability [19,20,26], emphasizing the importance of rehabilitation services. Texas’ demographic diversity, transportation challenges, and uneven healthcare infrastructure make it an ideal setting to explore spatial accessibility. Additionally, a recently published study investigated the availability of physical therapy and occupational therapy providers in Texas and found substantial geographic variability in rehabilitation provider supply across census tracts in Texas, with lower availability in areas with population with greater need, including those with higher rates of disability [27].
The purpose of this study was to (1) examine spatial accessibility to outpatient physical and occupational therapy services across Texas, a large and demographically diverse state, and (2) to identify regional disparities to inform workforce and policy planning. Geospatial analysis and geographic information systems (GIS) were employed to provide insights into rehabilitation accessibility.
2. Materials and Methods
2.1. Study Design and Setting
This study used a descriptive cross-sectional geospatial analysis method, integrating data on the locations of outpatient PT and OT clinics with population data from the 2020 United States Census. The merged datasets were analyzed to explore population factors associated with spatial accessibility.
2.2. Data Sources and Study Population
Data on clinic locations were obtained from the Texas Health and Human Services (THHS) licensure database [28] in September 2023, representing active practice sites for licensed physical and occupational therapists as of September 2022. Population and demographic characteristics were extracted from the 2020 American Community Survey (ACS) [29] at the census tract level.
The mailing list of licensed physical and occupational therapists was obtained from the Executive Council of Physical Therapy and Occupational Therapy Examiners (ECPTOTE) through an open records request submitted on November 30, 2022 [30]. This dataset provided residential addresses for all actively licensed PTs and OTs as of November 2022. Community-level demographic characteristics, including population size, race and ethnicity, disability prevalence, and poverty indicators, were drawn from the 2020 American Community Survey (ACS) [31]. Data cleaning, GIS workflows, and calculation procedures for provider-to-population ratios followed standardized methods previously developed by the research team and described in detail in a recently published feasibility study [32].
2.3. Data Preparation
Clinic address data extracted from the Texas Health and Human Services (THHS) licensure database in September 2023 were standardized, verified through Google Maps and clinic websites, and geocoded in ArcGIS Pro [33] using the World Geocoding Service [34]. Duplicate addresses representing the same practice site were identified and removed. Only outpatient facilities that provided direct patient care were included; administrative offices, inpatient facilities, and home health agencies were excluded. The total number of clinics identified in this way was 2,255. Census tract boundaries and demographic estimates were obtained from the 2020 American Community Survey (ACS) at the tract level (n = 6,896 tracts). A detailed data cleaning workflow, duplicate counts, and verification steps are provided in the Supplementary Materials.
2.4. Geospatial Analysis
An origin–destination (OD) cost matrix analysis in ArcGIS Pro (v.3.3, ESRI) was used to determine the travel time to the nearest outpatient rehabilitation clinic for each Texas census tract centroid. Centroids (n = 6,896) were generated from census tract polygons using the “Feature to Point” tool, providing a consistent origin for analysis. The destination dataset consisted of 2,255 verified outpatient physical and occupational therapy practice sites imported and geocoded in ArcGIS Pro.
A high-quality routable network dataset was essential for accurate travel-time modeling. Publicly available Texas road network files lacked elevation and routing attributes, and splitting the analysis into county-level subsets risked underestimating access by excluding clinics outside county borders but closer to tract centroids. To ensure accuracy, this study used ArcGIS StreetMap Premium [35], a commercial geodatabase with comprehensive roadway connectivity, routing attributes, and elevation data. The dataset was integrated into ArcGIS Pro to generate a state-level routing network.
The OD cost matrix was configured to calculate driving time in minutes, using “Driving Time” as the travel mode. The analysis was limited to one destination per origin (the nearest clinic) and generated a “lines” attribute table containing OD travel times and distances. These results were joined to the census tract dataset for mapping and descriptive analysis.
2.4.1. Origin-Destination Cost Matrix:
The OD cost matrix tool was used to calculate travel times from the geographic centroid of each census tract to the nearest outpatient clinic, using ArcGIS StreetMap Premium as a routable road network dataset.
2.4.2. Accessibility Index Calculation Using a Two-Step Floating Catchment Area (2SFCA):
The two-step floating catchment area (2SFCA) method, first proposed by Radke and Mu, is a robust approach for assessing healthcare accessibility [36,37,38,39]. Unlike the traditional Gravity method, which is effective when the exact location of the provider is known, the 2SFCA method is a better fit for this study because it effectively measures service accessibility by considering both the proximity of populations to healthcare services and the ratio of providers to population [39,40]. The 2SFCA method involves two primary analytical steps using ‘supply’ points (in this study outpatient clinic locations) and ‘demand’ points (in this study census tract centroids) to compute the accessibility index.41 Our study adapted the methodology from previous research by Dong et. al. and Naylor et. al., tailored to the variables of clinic locations and census tracts in Texas [37,38].
Accessibility was quantified using the 2SFCA method, which incorporates both travel time and provider-to-population ratios. Clinic locations served as supply points, and census tract centroids as demand points. A 15-minute drive-time threshold was applied as some accounts suggest patients are not willing to travel more than fifteen minutes for care [42].
In Step 1, the provider-to-population ratio was computed within each clinic’s catchment area by aggregating census tract populations falling within a 15-minute drive. In Step 2, these ratios were summed for each census tract to produce an Accessibility Index (AI) that reflects access to outpatient physical and occupational therapy services relative to population demand.
Accessibility index scores were joined to census tract polygons and visualized using graduated color choropleth maps. Census tract polygons represent the border of each census tract and graduated color choropleth maps illustrate the variability in accessibility index across census tracts. This approach captured both clinic density and overlapping service areas, allowing for granular analysis of urban and rural access patterns.
2.4.3. Hot Spot Analysis
A hot spot analysis was conducted in ArcGIS Pro (v3.3, ESRI) to identify statistically significant clusters of high and low accessibility scores derived from the 2SFCA analysis [43]. The Getis-Ord Gi* statistic evaluates spatial autocorrelation by comparing each census tract’s accessibility score to those of its neighbors, producing z-scores and p-values that indicate whether clustering occurs beyond random chance. Statistically significant positive z-scores correspond to high-access “hot spots,” while negative z-scores correspond to low-access “cold spots.”
Due to the heterogeneity of Texas census tract sizes, a spatial weights matrix was constructed to ensure realistic neighborhood definitions [44]. A fixed-distance band of 4,800 meters (3 miles) was applied to represent urban spatial relationships, while tracts without a neighbor within this distance were assigned a minimum of two neighbors to accommodate rural geographies. Manhattan distance was used to approximate urban road layouts, yielding an average of 8 neighbors per tract.
The Gi* statistic was calculated using ArcGIS Pro’s Hot Spot Analysis tool. A False Discovery Rate (FDR) correction was applied to control for multiple testing. Output included a categorical Gi_Bin field representing significance at 90%, 95%, and 99% confidence levels, which was mapped to visualize spatial patterns of access.
2.5. Statistical Analysis
To examine demographic differences between areas of high and low accessibility, census tracts classified as significant hot or cold spots were extracted from ArcGIS Pro and exported to R (v4.3.1, R Core Team, Vienna, Austria). The Gi_Bin field was recoded as a binary variable (1 = hot spot, 0 = cold spot) and used as the dependent variable in a stepwise logistic regression model. Predictor variables included: Percentages of racial/ethnic groups (Hispanic, White, Black, Asian, American Indian), percent households without vehicles, percent single-parent households, percent households without internet access, percent individuals with disabilities, and percent individuals without a high school diploma.
Multicollinearity testing indicated redundancy between White and minority percentages; minority percentage was excluded from the final model. The logistic regression model was fit using the glm() function with a binomial link, and odds ratios (ORs) were calculated to interpret the strength of associations.
Descriptive statistics were generated for all variables, and comparisons between hot and cold spot tracts were reported alongside regression results. All scripts, code snippets, and model diagnostics are provided in the Supplementary Materials.
3. Results
This section may be divided by subheadings. It should provide a concise and precise description of the experimental results, their interpretation, as well as the experimental conclusions that can be drawn.
3.1. Geospatial Results
3.1.1. Origin Destination Cost Matrix Results
The OD cost matrix results provide the travel time from each census tract centroid to the nearest source of outpatient rehabilitation facility. Figure 1 is a box plot depicting the distribution of total driving time from the centroids of census tracts to the nearest outpatient clinic in minutes. The x-axis represents the total travel time in minutes, which ranged from 0-240. While most of the data points are clustered around the lower end of travel time and the median value of 20 minutes, outliers are visible extending beyond the box plot whiskers with a few extreme values exceeding 240 minutes.
3.1.2. Accessibility Index Results
The index of accessibility calculated from the 2SFCA method was visualized using graduated color choropleth maps using natural breaks. Figure 2 and Figure 3 visualize spatial accessibility by census tract in Texas using a choropleth map based on accessibility index scores calculated through the 2SFCA method. The accessibility index scores are represented with graduated colors. Blue gradients represent accessibility levels where dark blue represents the highest accessibility scores (0.17612-0.277607), medium to light blue represent moderate to lower accessibility scores, and very light blue represents the lowest accessibility (0-0.016726), indicating limited outpatient rehabilitation access.
Within the view of the entire state of Texas (figure 2), the map demonstrates a clear urban-rural divide in accessibility while certain pockets of rural areas exhibit moderate accessibility which is due to proximity to a single clinic for a relatively small population. In the zoomed-in view of the Austin metropolitan region (figure 3-A), the urban core and nearby suburbs show predominantly darker shades of blue, indicating higher accessibility due to a greater density of outpatient rehabilitation clinics. Lighter shades are evident representing diminishing accessibility in areas farther from the urban center. The map also reveals clusters of high accessibility near central Austin and along major highways or transit corridors, reflecting the concentration of healthcare providers in these areas.
In the zoomed-in view of the Dallas-Fort Worth metropolitan region (figure 3-B), urban centers such as Dallas and Fort Worth show predominantly darker blue areas, reflecting higher accessibility due to the concentration of clinics in these densely populated areas. Suburban areas, including Arlington and Garland, have a mix of medium to light blue zones, indicating moderate access to healthcare services. Outlying rural tracts within the metropolitan area are predominantly light blue or very light blue, showing lower accessibility scores as clinic density decreases. The northern region, including areas like Plano, Frisco, Carrollton, and McKinney, exhibit higher accessibility as indicated by darker blue zones. In contrast, the southern region, including areas such as Oak Cliff, DeSoto, Lancaster, and parts of South Dallas, show predominantly lighter blue zones, indicating lower accessibility.
Within the zoomed-in view of the Houston metropolitan region (figure 3-C), there is a noticeable divide in spatial accessibility to outpatient rehabilitation clinics when comparing the eastern and western parts of the city. The western part of Houston, including areas like Katy, Westchase, and the Energy Corridor, show higher accessibility in the form of darker blue zones. Accessibility is bolstered by the proximity of clinics along major highways such as Interstate 10 (Katy Freeway) and Beltway 8, which connect suburban and urban areas efficiently. The eastern part of the city, particularly in industrial and low-income areas such as Pasadena, Baytown, and Galena Park, tend to have lighter blue zones, indicating lower accessibility.
In the zoomed-in view of the San Antonio metropolitan region (figure 3-D), there is a noticeable north-south divide in spatial accessibility to outpatient rehabilitation clinics. The northern part of the metropolitan area, including neighborhoods like Stone Oak, Alamo Heights, and Shavano Park, displays higher accessibility as reflected by darker blue zones. In contrast, southern areas such as Harlandale, Southside, and Von Ormy show predominantly lighter blue zones, indicating lower accessibility. The central city area, particularly around downtown San Antonio and the Medical Center, displays high accessibility (darker blue). This reflects the concentration of healthcare resources and the centrality of major transit corridors.
3.1.3. Getis-Ord Gi* Results
The results of the Getis-Ord Gi* statistic are shown in a series of maps illustrating hot spots and cold spots of the accessibility index across the entire state of Texas. This spatial statistical method identified areas with significantly higher or lower indexes of accessibility. Figure 4 and Figure 5 represent the Getis-Ord Gi* statistic for the spatial accessibility index for Texas (figure 4), and with zoomed-in views of Austin (A), Dallas/Fort Worth (B), Houston (C), and San Antonio (D). Red areas represent hot spots, where there are statistically significant clusters of high accessibility index scores. Blue areas represent cold spots, where there are statistically significant clusters of low accessibility index scores. In the full state map, hot spots are concentrated in major metropolitan regions. Cold spots are prevalent in rural areas, particularly in West Texas (e.g., around Midland, Odessa, and areas west of Lubbock), the Texas Panhandle, and the Rio Grande Valley and border regions.
In the zoomed-in map of the Austin metropolitan region (figure 5-A), central Austin is the most accessible area, reflecting the concentration of providers and proximity to urban infrastructure. There are no cold spots identified within the Austin metropolitan region.
In the zoomed-in map of the Dallas and Fort Worth metropolitan region (figure 5-B), red and orange areas represent statistically significant hot spots, where provider accessibility is higher predominantly concentrated in North Dallas, including areas such as Richardson, Plano, and Garland. Blue areas signify statistically significant cold spots, where accessibility is lower. These low accessibility areas are primarily located in southern Dallas, including parts of Oak Cliff, DeSoto, and surrounding areas.
In the zoomed-in map of the Houston metropolitan region (figure 5-C), hot spots are concentrated in Central Houston, including areas near downtown and neighborhoods such as Montrose and parts of the Texas Medical Center. Suburban areas to the west and north, such as regions near Bellaire and Spring Branch, benefit from the higher clinic density and established infrastructure. Cold spots are primarily located on the eastern periphery, near Baytown and sparsely populated industrial areas, which have fewer providers and increased travel times. A smaller cold spot is visible in the northern suburban region near Humble, which may reflect limited healthcare infrastructure compared to more affluent western suburbs.
In the zoomed-in map of the San Antonio metropolitan region (figure 5-D), hot spots are concentrated in: Central San Antonio, including downtown and nearby neighborhoods, which have a higher density of clinics and proximity to well-developed transportation networks as well as the Northern suburbs, including areas around Stone Oak and parts of New Braunfels. There are no visible statistically significant cold spots on the San Antonio map, but there are minimal hot spots in the eastern outskirts and southern regions of the metropolitan region.
3.1.3. Statistical Results
A stepwise logistic regression analysis was performed to select the most important socioeconomic and demographic predictors that were related to the binary outcome of a location being a hot spot or cold spot. The binary outcome of being in a hot spot or cold spot was determined by converting the categorical variable ‘Gi_Bin’ into a binary variable. A Gi_Bin of 3, 2, or 1, representative of a hot spot of 99, 95, and 90% confidence intervals for increased accessibility was converted to the binary outcome “1.” A Gi_Bin of -3, -2, or -1 representative of a cold spot was converted to the binary outcome of “0” (table 1). The model demonstrated a significant improvement in fit compared to the null model (AIC = 527.16), with a residual deviance of 371.64 (AIC = 395.64), indicating that the included predictors meaningfully explain the variation in the outcome.
Several predictors were statistically significant (p < 0.05). Percent Hispanic (β = 0.136, OR = 1.146, p < 0.001), percent White (β = 0.107, OR = 1.113, p = 0.009), and percent Black (β = 0.099, OR = 1.104, p = 0.015) were all positively associated with increased odds of being in a hot spot. Similarly, percent Asian (β = 0.111, OR = 1.117, p = 0.008) and percent households with single parents (β = 0.124, OR = 1.132, p < 0.001) showed positive relationships with the outcome. Additionally, percent with disability had a positive effect (β = 0.170, OR = 1.185, p < 0.001), suggesting that higher percentages of individuals with disabilities significantly increase the odds of a being in a hot spot.
Conversely, percent no vehicle households (β = -0.075, OR = 0.928, p = 0.004), percent households with no partner (β = -0.045, OR = 0.956, p < 0.001), and percent with no high school diploma (β = -0.073, OR = 0.930, p < 0.001) were negatively associated with the outcome. These results suggest that areas with higher rates of households lacking vehicles, single individuals without partners, and individuals without high school diplomas are associated with reduced odds of being in a hot spot with increased accessibility.

Table 1.
Logistic regression results predicting hot spot.
| Variable | Unstandardized β | SE | z value | P Value | Odds Ratio | CI (lower) | CI (upper) |
| Intercept | -9.34 | 3.98 | -2.35 | 0.019 | 8.79×10⁻⁵ | 2.59x10⁻⁸ | 0.193 |
| Hispanic | 0.136 | 0.041 | 3.29 | <0.001 | 1.146 | 1.058 | 1.246 |
| White | 0.107 | 0.041 | 2.62 | 0.009 | 1.113 | 1.029 | 1.211 |
| Black | 0.099 | 0.041 | 2.43 | 0.015 | 1.104 | 1.020 | 1.200 |
| American Indian | 0.371 | 0.257 | 1.44 | 0.149 | 1.449 | 0.901 | 2.483 |
| Asian | 0.111 | 0.042 | 2.65 | 0.008 | 1.117 | 1.030 | 1.216 |
| No Vehicle Households | -0.075 | 0.026 | -2.88 | 0.004 | 0.928 | 0.880 | 0.975 |
| Households No Partner Present | -0.045 | 0.011 | -4.12 | <0.001 | 0.956 | 0.934 | 0.975 |
| Households Single Parent | 0.124 | 0.027 | 4.5 | <0.001 | 1.132 | 1.07 | 1.196 |
| No Internet Households | 0.037 | 0.019 | 1.94 | 0.052 | 1.038 | 1.001 | 1.078 |
| With Disability | 0.17 | 0.031 | 5.51 | <0.001 | 1.185 | 1.118 | 1.262 |
| No HS Diploma | -0.073 | 0.019 | -3.75 | <0.001 | 0.930 | 0.894 | 0.964 |
|
1Abbreviations: SE, standard error; β, log-odds unstandardized coefficient. 2All predictors refer to the percentage of the population in the census tract. |
|||||||
4. Discussion
This statewide geospatial analysis identified substantial disparities in outpatient rehabilitation accessibility across Texas. The Accessibility Index derived from the 2SFCA showed consistently higher access in the major metropolitan corridors (Dallas–Fort Worth, Houston, Austin, San Antonio) and lower access in rural West Texas, the Panhandle, and border regions. Within cities, accessibility was uneven, with pockets of lower access on urban peripheries and in historically under-resourced neighborhoods. Hot spot analysis (Getis-Ord Gi*) corroborated these patterns, locating statistically significant clusters of high access in urban areas and low access across large rural areas. OD cost matrix results reinforced the accessibility gradient: most urban census tracts were within relatively short drive times of a clinic, whereas rural tracts had markedly longer travel times, sometimes exceeding practical thresholds for multi-visit rehabilitation. For individuals living with disability who require frequent, ongoing therapy, extended travel burdens may translate directly into missed care, delayed recovery, and reduced functional participation.
4.1. The Origin-Destination Cost matrix
The OD cost matrix results suggest that most individuals in Texas live within a 30-minute drive of an outpatient clinic, reflecting relatively strong accessibility in urban areas. However, rural residents face significant travel burdens, with some trips exceeding two hours. This access disparity underscores geographic inequities and the need for targeted interventions to increase rehabilitation access in underserved regions. Even for urban residents, frequent rehabilitation appointments, often two or three times a week, can accumulate substantial travel time, adding up to nearly three hours per week even when the commute is only 30 minutes away. Evidence on patient willingness to travel for rehabilitation services is limited, though some studies suggest patients are reluctant to travel more than fifteen minutes for care [42], pointing to the importance of considering travel burden in planning service delivery. This suggests that more research is needed to understand what would be considered a reasonable travel time for individuals undergoing rehabilitation care.
4.2. Accessibility Index
The 2SFCA analysis highlights striking disparities in rehabilitation accessibility across Texas. Urban centers such as Austin, Dallas, Houston, and San Antonio demonstrate higher accessibility due to dense clinic networks and major transportation corridors, whereas rural areas, including West Texas, the Panhandle, and border regions, face significant challenges, reflecting longstanding urban-rural divides in healthcare access [45,46,47]. Affluent suburbs in northern Dallas and San Antonio, and western Houston, show particularly high accessibility, while historically underserved neighborhoods in South Dallas, South San Antonio, and East Houston remain low-access [48,49,50]. These patterns emphasize systemic inequities linked to both socioeconomic and geographic factors. Florida and Mellander completed a large study on segregation within metropolitan regions in the United States [51]. Austin (1st), San Antonio (3rd), Houston (4th) and Dallas-Fort Worth-Arlington, TX (7th) encompassed four of the highest seven economically segregated metropolitan regions within the United States. Prior research points to Texas cities being economically segregated, or having wealth concentrated in specific regions resulting in neighborhood divisions [50]. This study was the first to demonstrate that rehabilitation accessibility follows similar patterns to economic segregation.
4.3. Implications for Access Interventions
The disparities identified in this study carry implications for equitable rehabilitation access. Equitable rehabilitation access means ensuring that everyone has fair and just opportunities to receive rehabilitation services they need to achieve their full potential, regardless of their background, identity, circumstances or geography. Tract-level accessibility maps offer a tool for health systems and policymakers to guide service expansion, prioritize cold-spot areas, and can inform workforce distribution. Strategies include developing additional outpatient rehabilitation clinics, introducing mobile rehabilitation clinics, and expanding telehealth rehabilitation capacity and reimbursement to reach remote communities. Evidence suggests that mobile health clinics can deliver cost-effective care for underserved populations [52,53,54]. Implementing financial incentive programs for rehabilitation providers to establish or expand practices in regions with reduced accessibility can enhance equity by addressing workforce shortages, as financial incentives have been shown to improve provider distribution in underserved areas [55,56].
4.4. Transportation Networks and Access
Transportation infrastructure plays a central role in shaping healthcare access. Areas along major highways, such as Interstate 35 in Austin and key corridors in Dallas and Houston, show higher accessibility, emphasizing the influence of roadway connectivity. This finding underscores the importance of transportation infrastructure in ensuring equitable healthcare access and highlights the need for integrated solutions that address both healthcare distribution and mobility challenges. Conversely, limited public transit in many Texas metropolitan areas exacerbates barriers for residents in low-access areas. Expanding public transit systems and leveraging Medicaid-supported transportation services could help reduce access disparities, especially for households without vehicles [57,58,59].
4.5. Getis-Ord Gi* Statistic
Hot spot analysis using the Getis-Ord Gi* statistic revealed clear clustering patterns: high-access tracts are concentrated in major metropolitan centers, while large regions of West Texas, the Panhandle, and the Rio Grande Valley remain persistently low-access. Within metropolitan areas, cold spots appear in peripheral or historically underserved neighborhoods, though these disparities are less pronounced relative to rural gaps. This clustering reinforces the urban–rural divide and highlights areas for targeted resource allocation.
4.6. Population Characteristics
Logistic regression analysis provided insight into demographic and socioeconomic predictors of access. Tracts with higher proportions of Hispanic, White, Black, and Asian residents were positively associated with high-accessibility hot spots, reflecting patterns of metropolitan diversity and provider clustering [60,61]. Conversely, households without vehicles and households without partners were strongly associated with low-access areas, underscoring the compounding effects of transportation barriers on rehabilitation access inequities [62,63].
Interestingly, single-parent households were positively associated with hot spot presence, while no-partner households were not, a surprising finding given the established links between single-parent status and economic vulnerability [64,65,66,67]. This complexity highlights the need for further research into local-level dynamics. Disability prevalence was also positively associated with access, suggesting that provider location may be partially responsive to need, though this finding was heterogeneous. Lower educational attainment strongly correlated with low access, consistent with evidence that individuals with less education experience greater barriers to care, poorer health outcomes, and lower insurance coverage rates [68,69]. Digital access disparities, measured by household internet connectivity, showed only marginal significance, but this trend underscores the role of technology in modern care delivery.
4.7. Strengths
This study offers a statewide, granular assessment of outpatient rehabilitation access, analyzing 6,896 census tracts and 2,255 verified PT/OT clinic sites. We combined three complementary geospatial approaches (OD travel time, 2SFCA-derived Accessibility Index, and Getis-Ord Gi* clustering) to characterize both continuous access gradients and statistically significant clusters of high and low accessibility. A documented, auditable cleaning protocol (standardization, de-duplication, and web-based verification) improves confidence in clinic location accuracy. Use of StreetMap Premium enabled routable, elevation-aware travel-time estimation across urban and rural Texas, overcoming limitations of open datasets and avoiding county-by-county splits that can misidentify the nearest clinic. The tract-level integration of ACS demographics supports equity-oriented interpretation and future policy intervention as well as the potential to act locally within areas of metropolitan centers to improve accessibility in areas of most need.
4.8. Limitations
These findings are derived from cross-sectional data and may not capture recent openings/closures or population shifts (clinics: 2022; ACS: 2020). Licensure-based addresses, though cleaned and verified, can contain residual misclassification (e.g., administrative offices, multi-suite sites). The OD analysis uses centroids and nearest-clinic driving time; it does not account for patient choice, clinic capacity, payer networks, waiting times, parking/transit barriers, or tele-rehabilitation. Hot-spot detection required a fixed-distance band (4,800 m) with a minimum-neighbor rule and a Manhattan metric for heterogeneous tract sizes; these decisions balance urban realism and rural inclusion but may under- or over-connect some sparsely populated areas. Finally, the analysis focuses on outpatient PT/OT only; other rehabilitation settings (e.g., outpatient speech therapy, inpatient rehabilitation centers, home health services) were beyond the scope of this study and including these settings may change the broader access picture.
4.9. Future Directions
Future research should focus on regional hot spot analysis within metropolitan areas to better capture neighborhood-level disparities. More advanced techniques could be considered within metropolitan analyses, such as dynamic spatial weighting or temporal analyses [70,71]. These methods would allow for the incorporation of longitudinal data to examine how changes in clinic availability, infrastructure, or policy interventions impact spatial accessibility over time. Finally, inclusion of additional rehabilitation services, such as speech therapy or more comprehensive occupational and physical therapy practice settings could provide a more comprehensive view of healthcare access disparities.
5. Conclusions
This study highlights significant spatial disparities in access to outpatient physical therapy and occupational therapy rehabilitation services across Texas, with pronounced differences between urban and rural regions and within metropolitan areas. The study utilized advanced spatial analysis methods including the 2SFCA and Getis-Ord Gi* statistics to provide insights into hot spots of high accessibility and cold spots of underserved areas. The findings underscore the importance of targeted interventions, such as clinic placement and improved transportation, to address inequities. In the future, a focus on localized analyses and incorporating longitudinal data could provide better information for healthcare policy and planning.
Supplementary Materials
The following supporting information can be downloaded at the website of this paper posted on Preprints.org, Table S1: Data Sources; Table S2: Summary of clinic address verification and duplicates removed; Figure S1: Workflow for Geospatial and Data Analysis; Figure S2: Data Cleaning and Verification Process of Outpatient Clinic Locations in Texas; Table S3: 2SFCA Model Equation Key; Table S4: Step-by-step methods for conducting 2SFCA calculation using ArcGIS Pro; Table S5: Logistic regression output (coefficients on log-odds scale); Table S6: Model selection comparison (AIC); reproducibility statement.
Author Contributions
MR contributed to conceptualization, methodology, data curation, formal analysis, visualization, and writing of the original draft, and oversaw project administration. RP contributed to methodology, supervision, and writing – review and editing. JC assisted with investigation and writing – review and editing. WB provided statistical consultation, contributed to methodology, and assisted with writing – review and editing. KM contributed statistical consultation, methodology support, and writing – review and editing. All authors read and approved the final manuscript.
Funding
This study was funded by the Center on Health Services Training & Research (CoHSTAR) Pilot Study Grant.
Institutional Review Board Statement
Approval to conduct this study was granted by the Texas Woman’s University Houston campus Internal Review Board (IRB) (IRB-FY2023-162).
Informed Consent Statement
Not applicable.
Data Availability Statement
The data that support the findings of this study are available from publicly available datasets included in this published study and through the Executive Council of Physical Therapy and Occupational Therapy Examiners, but restrictions apply to the availability of these data, which were used under license for the current study, and so are not publicly available. Data are however available from the authors upon reasonable request and with permission of the Executive Council of Physical Therapy and Occupational Therapy Examiners.
Acknowledgments
This work was completed in partial fulfillment of the requirements for the Doctor of Philosophy degree at Texas Woman’s University. The author gratefully acknowledges Hiro Chang and Andrea Koh for their invaluable assistance with data cleaning and verification. Additional support for this project was provided by the Center on Health Services Training and Research (COHSTAR), funded by the Foundation for Physical Therapy Research.
Conflicts of Interest
The authors declare no conflicts of interest.
Abbreviations
The following abbreviations are used in this manuscript:
| 2SFCA | Two-step floating catchment area |
| AI | Accessibility Index |
| ACS | American Community Survey |
| OD | Origin-destination |
| Gi* | Getis-Ord statistic |
| PT | Physical therapy |
| OT | Occupational therapy |
| FDR | False discovery rate |
References
- County Health Rankings & Roadmaps. Access to Care. Available online: https://www.countyhealthrankings.org/explore-health-rankings/measures-data-sources/county-health-rankings-model/health-factors/clinical-care/access-to-care (accessed on 17 October 2022).
- Center, Graham. Access Denied. Available online: https://www.graham-center.org/content/dam/rgc/documents/publications-reports/monographs-books/Access%20Denied.pdf.
- Kaiser Family Foundation. The Uninsured: A Primer. Available online: https://files.kff.org/attachment/primer-the-uninsured-a-primer-key-facts-about-health-insurance-and-the-uninsured-in-the-era-of-health-reform.
- Penchansky, R.; Thomas, J.W. The concept of access: Definition and relationship to consumer satisfaction. Med. Care 1981, 19, 127–140. [Google Scholar] [CrossRef] [PubMed]
- Saurman, E. Improving access: Modifying Penchansky and Thomas’s theory of access. J. Health Serv. Res. Policy 2016, 21, 36–39. [Google Scholar] [CrossRef] [PubMed]
- American Physical Therapy Association. Direct Access Advocacy. Available online: https://www.apta.org/advocacy/issues/direct-access-advocacy (accessed on 30 August 2024).
- Clark, B.; Clark, L.; Showalter, C.; Stoner, T. A call to action: Direct access to physical therapy is highly successful in the US military. When will professional bodies, legislatures, and payors provide the same advantages to all US civilian physical therapists? J. Man. Manip. Ther. 2022, 30, 199–206. [Google Scholar] [CrossRef] [PubMed]
- Zahnd, W.E.; Del Vecchio, N.; Askelson, N.; et al. Definition and categorization of rural and assessment of realized access to care. Health Serv. Res. 2022, 57, 693–702. [Google Scholar] [CrossRef]
- Khan, A.A.; Bhardwaj, S.M. Access to health care: A conceptual framework and its relevance to health care planning. Eval. Health Prof. 1994, 17, 60–76. [Google Scholar] [CrossRef]
- Sullivan, J.; Orris, A.; Lukens, G. Entering Their Second Decade, Affordable Care Act Coverage Expansions Have Helped Millions, Provide the Basis for Further Progress. Available online: https://www.cbpp.org/research/health/entering-their-second-decade-affordable-care-act-coverage-expansions-have-helped (accessed on 30 August 2024).
- U.S. Government Accountability Office. Why Health Care Is Harder to Access in Rural America. Available online: https://www.gao.gov/blog/why-health-care-harder-access-rural-america (accessed on 30 August 2024).
- Bodenheimer, T.; Grumbach, K. Understanding Health Policy: A Clinical Approach, 8th ed.; McGraw Hill Medical: New York, NY, USA, 2020. [Google Scholar]
- Wong, A.; Hoang, T.M.H.; Ferrara, V.; Nguyen, T.H. How systemic barriers can impact health inequities when facing climate change stressors: A scoping review of global differences. GeoHealth 2025, 9, e2024GH001272. [Google Scholar] [CrossRef]
- Arrington, J.C. One Big Beautiful Bill Act. Available online: https://www.congress.gov/bill/119th-congress/house-bill/1 (accessed on 25 September 2025).
- Johns Hopkins Bloomberg School of Public Health. The Changes Coming to the ACA, Medicaid, and Medicare. Available online: https://publichealth.jhu.edu/2025/the-changes-coming-to-the-aca-medicaid-and-medicare (accessed on 25 September 2025).
- American Physical Therapy Association Health Policy; Administration. PTJ-PAL. No. 3. Vol. 19. Available online: https://cdn.ymaws.com/www.aptahpa.org/resource/resmgr/ptj-pal/ptj-palvol19no3.pdf.
- Gao, F.; Foster, M.; Liu, Y. Disability concentration and access to rehabilitation services: A pilot spatial assessment applying geographic information system analysis. Disabil. Rehabil. 2019, 41, 2468–2476. [Google Scholar] [CrossRef]
- Lakhani, A.; Parekh, S.; Gudes, O.; et al. Disability support services in Queensland, Australia: Identifying service gaps through spatial analysis. Appl. Geogr. 2019, 110, 102045. [Google Scholar] [CrossRef]
- Kinder Institute for Urban Research. After Census redefines urban and rural, Texas remains steadfastly both. Available online: https://kinder.rice.edu/urbanedge/census-redefines-urban-rural (accessed on 3 November 2023).
- Mora, D.S.; Noble, G.; Alamos, C.L.; McKinley Sandoval Harding, B.M.; Moore, T.P.H. Three rural definitions. Available online: https://www.ers.usda.gov/webdocs/DataFiles/53180/25598_TX.pdf (accessed on 13 February 2023).
- Rural Health Information Hub. Transportation to Support Rural Healthcare. Available online: https://www.ruralhealthinfo.org/topics/transportation (accessed on 10 March 2026).
- Wolfe, M.K.; McDonald, N.C.; Holmes, G.M. Transportation barriers to health care in the United States: Findings from the National Health Interview Survey, 1997–2017. Am. J. Public Health 2020, 110, 815–822. [Google Scholar] [CrossRef]
- Jiao, J. Identifying transit deserts in major Texas cities where the supplies missed the demands. J. Transp. Land Use 2017, 10, 529–540. [Google Scholar] [CrossRef]
- Texas Department of Transportation. 2023 Texas Transit Statistics. Available online: https://www.txdot.gov/content/dam/docs/government/texas-transit-statistics-report-2023..pdf (accessed on 2024).
- Autoinsurance.com. Commuting in the U.S. Facts and Statistics. Available online: https://www.autoinsurance.com/research/us-commuting-statistics/ (accessed on 30 August 2024).
- Centers for Disease Control and Prevention. Disability & Health U.S. State Profile Data: Texas. Available online: https://www.cdc.gov/ncbddd/disabilityandhealth/impacts/texas.html (accessed on 30 August 2024).
- Ratoza, M.R.; Patel, R.M.; Brewer, W.; Mitchell, K.; Chevan, J. Geographic disparities in rehabilitation provider availability and community demographics in Texas: A cross-sectional geographic information systems study accepted. Phys. Ther. 2025. [Google Scholar] [CrossRef]
- Texas Department of State Health Services. Available online: https://www.dshs.texas.gov/ (accessed on 28 August 2025).
- U.S. Census Bureau. American Community Survey (ACS). Available online: https://www.census.gov/programs-surveys/acs (accessed on 24 November 2024).
- Texas Executive Council of Physical Therapy and Occupational Therapy Examiners. Open Records Request. Available online: https://ptot.texas.gov/open-records-request/ (accessed on 23 January 2023).
- U.S. Census Bureau. Census.gov. Available online: https://www.census.gov/ (accessed on 23 January 2023).
- Ratoza, M.; Patel, R.M.; Chevan, J.; Brewer, W.; Mitchell, K. Mapping the availability of rehabilitation providers using public licensure and population data for a geographic information system-based approach to workforce planning: Cross-sectional feasibility study. JMIR Form. Res. 2025, 9, e85025. [Google Scholar] [CrossRef]
- Esri. ArcGIS. Available online: https://www.esri.com/en-us/arcgis/geospatial-platform/overview (accessed on 12 September 2024).
- Esri. ArcGIS World Geocoding. Available online: https://www.arcgis.com/sharing/rest/content/items/305f2e55e67f4389bef269669fc2e284 (accessed on 25 September 2025).
- Esri. On-Premises and Offline Routing, Geocoding & Mapping. Available online: https://www.esri.com/en-us/arcgis/products/arcgis-streetmap-premium/overview (accessed on 25 September 2025).
- Radke, J.; Mu, L. Spatial decompositions, modeling and mapping service regions to predict access to social programs. Ann. GIS 2000, 6, 105–112. [Google Scholar] [CrossRef]
- Dong, Y.; Fu, L.; Tan, R.; Ding, L. The dilemma of medical reimbursement policy in rural China: Spatial variability between reimbursement region and medical catchment area. Int. J. Environ. Res. Public Health 2019, 16, 2867. [Google Scholar] [CrossRef] [PubMed]
- Naylor, K.B.; Tootoo, J.; Yakusheva, O.; Shipman, S.A.; Bynum, J.P.W.; Davis, M.A. Geographic variation in spatial accessibility of U.S. healthcare providers. PLoS ONE 2019, 14, e0215016. [Google Scholar] [CrossRef] [PubMed]
- Pervorse, A. Spatial Accessibility in Health Care. Available online: https://storymaps.arcgis.com/stories/afec06281a264b3e9bdcb02b1ece8778 (accessed on 11 November 2024).
- Gautam, S.; Li, Y.; Johnson, T.G. Do alternative spatial healthcare access measures tell the same story? GeoJournal 2014, 79, 223–235. [Google Scholar] [CrossRef]
- Kanuganti, S.; Sarkar, A.K.; Singh, A.P. Quantifying accessibility to health care using two-step floating catchment area method (2SFCA): A case study in Rajasthan. Transp. Res. Procedia 2016, 17, 391–399. [Google Scholar] [CrossRef]
- Cypress Health Partners. Why Distance Is So Important for Patient Access, and What We’re Doing About It. Available online: https://cypresshealthpartners.com/why-distance-is-so-important-for-patient-access-and-what-were-doing-about-it/ (accessed on 12 December 2024).
- Esri. How Hot Spot Analysis (Getis-Ord Gi*) Works. Available online: https://pro.arcgis.com/en/pro-app/latest/tool-reference/spatial-statistics/h-how-hot-spot-analysis-getis-ord-gi-spatial-stati.htm (accessed on 21 July 2024).
- Grekousis, G. Spatial Analysis Methods and Practice: Describe – Explore – Explain through GIS; Cambridge University Press: Cambridge, UK, 2020. [Google Scholar]
- Chen, X.; Orom, H.; Hay, J.L.; et al. Differences in rural and urban health information access and use. J. Rural Health 2019, 35, 405–417. [Google Scholar] [CrossRef]
- McManus, B.M.; Lindrooth, R.; Richardson, Z.; Rapport, M.J. Urban/rural differences in therapy service use among Medicaid children aged 0–3 with developmental conditions in Colorado. Acad. Pediatr. 2016, 16, 358–365. [Google Scholar] [CrossRef]
- Quigley, D.D.; Chastain, A.M.; Kang, J.A.; et al. Systematic review of rural and urban differences in care provided by home health agencies in the United States. J. Am. Med. Dir. Assoc. 2022, 23, 1653.e1–1653.e13. [Google Scholar] [CrossRef]
- Young, S. Dallas County Remains Segregated by Race, Income and Education Level, New Study Says. Available online: https://www.dallasobserver.com/news/dallas-county-has-widespread-ethnic-disparities-according-to-new-study-10566546 (accessed on 15 December 2024).
- University of Richmond. Mapping Inequality. Available online: https://dsl.richmond.edu/panorama/redlining/ (accessed on 15 December 2024).
- Munson, L. What Is Economic Segregation, and Why Does It Matter? Available online: https://hebfdn.org/echoes/economic-segregation-matter/ (accessed on 15 December 2024).
- Florida, R.; Mellander, C. Segregated City: The Geography of Economic Segregation in America’s Metros. Available online: https://hj.diva-portal.org/smash/get/diva2:868382/FULLTEXT01 (accessed on 15 December 2024).
- Yu, S.W.Y.; Hill, C.; Ricks, M.L.; Bennet, J.; Oriol, N.E. The scope and impact of mobile health clinics in the United States: A literature review. Int. J. Equity Health 2017, 16, 178. [Google Scholar] [CrossRef]
- Malone, N.C.; Williams, M.M.; Smith Fawzi, M.C.; et al. Mobile health clinics in the United States. Int. J. Equity Health 2020, 19, 40. [Google Scholar] [CrossRef]
- Tulane University School of Public Health. How Do Mobile Health Clinics Improve Access to Health Care? Available online: https://publichealth.tulane.edu/blog/mobile-health-clinics/ (accessed on 16 December 2024).
- Bärnighausen, T.; Bloom, D.E. Financial incentives for return of service in underserved areas: A systematic review. BMC Health Serv. Res. 2009, 9, 86. [Google Scholar] [CrossRef]
- University of Washington Center for Health Workforce Studies. State Incentive Programs that Encourage Allied Health Professionals to Provide Care for Underserved Populations. Available online: https://familymedicine.uw.edu/chws/studies/state-incentive-programs-that-encourage-allied-health-professionals-to-provide-care-for-underserved-populations/ (accessed on 16 December 2024).
- Health Affairs. Public Transportation in the US: A Driver of Health and Equity. Available online: https://www.healthaffairs.org/do/10.1377/hpb20210630.810356/full/ (accessed on 16 December 2024).
- Centers for Disease Control and Prevention. Public Transportation System: Introduction or Expansion. Available online: https://archive.cdc.gov/www_cdc_gov/policy/hi5/publictransportation/index.html (accessed on 16 December 2024).
- Smith, L.B.; Yang, Z. Public Transportation Facilitates Access to Health Care, Particularly for People Covered by Medicaid. Available online: https://www.urban.org/urban-wire/public-transportation-facilitates-access-health-care-particularly-people-covered-medicaid (accessed on 16 December 2024).
- Kopczewska, K.; Kubara, M.; Kopyt, M. Population density as the attractor of business to the place. Sci. Rep. 2024, 14, 22234. [Google Scholar] [CrossRef]
- Combes, P.P.; Gobillon, L. The empirics of agglomeration economies. In Handbook of Regional and Urban Economics; Elsevier: Amsterdam, The Netherlands, 2015; Vol. 5, pp. 247–348. [Google Scholar]
- Cochran, A.L.; McDonald, N.C.; Prunkl, L.; et al. Transportation barriers to care among frequent health care users during the COVID pandemic. BMC Public Health 2022, 22, 1783. [Google Scholar] [CrossRef]
- Syed, S.T.; Gerber, B.S.; Sharp, L.K. Traveling towards disease: Transportation barriers to health care access. J. Community Health 2013, 38, 976–993. [Google Scholar] [CrossRef]
- The Annie E. Casey Foundation. Child Well-Being in Single-Parent Families. Available online: https://www.aecf.org/blog/child-well-being-in-single-parent-families (accessed on 6 January 2025).
- Esri. Where Are Children in Single-Parent Families? Available online: https://www.arcgis.com/home/item.html?id=2a15d985d0ad466ab8532885a07ae61d (accessed on 6 January 2025).
- Robinson, M. Map Reveals States with Most Single-Parent Households. Available online: https://www.newsweek.com/us-census-data-map-reveals-states-most-single-parent-households-1908428 (accessed on 6 January 2025).
- Kent, D. U.S. Has World’s Highest Rate of Children Living in Single-Parent Households. Available online: https://www.pewresearch.org/short-reads/2019/12/12/u-s-children-more-likely-than-children-in-other-countries-to-live-with-just-one-parent/ (accessed on 6 January 2025).
- Raghupathi, V.; Raghupathi, W. The influence of education on health: An empirical assessment of OECD countries for the period 1995–2015. Arch. Public Health 2020, 78, 20. [Google Scholar] [CrossRef] [PubMed]
- Sullivan, K. Lack of education breeds disparities despite equal access to care. Available online: https://www.fiercehealthcare.com/healthcare/lack-education-breeds-disparities-despite-equal-access-to-care (accessed on 16 December 2024).
- Esri. Temporal Analysis. Available online: https://doc.arcgis.com/en/insights/latest/analyze/temporal-analysis.htm (accessed on 15 December 2024).
- Janatabadi, F.; Ermagun, A. Access weight matrix: A place and mobility infused spatial weight matrix. Geogr. Anal. 2024, 56, 746–767. [Google Scholar] [CrossRef]
Figure 1.
Figure 1. Boxplot of distribution of travel time from census tract centroid to nearest source of care.
Figure 1.
Figure 1. Boxplot of distribution of travel time from census tract centroid to nearest source of care.

Figure 2.
Spatial accessibility by census tract in Texas.

Figure 3.
Spatial accessibility by census tract in Texas with views of Austin (A), Dallas/Fort Worth (B), Houston (C), and San Antonio (D).
Figure 3.
Spatial accessibility by census tract in Texas with views of Austin (A), Dallas/Fort Worth (B), Houston (C), and San Antonio (D).

Figure 4.
Spatial Accessibility Index Getis-Ord Gi* statistic in Texas.

Figure 5.
Spatial Accessibility Index Getis-Ord Gi* statistic in Texas with views of Austin (A), Dallas/Fort Worth (B), Houston (C), and San Antonio (D).
Figure 5.
Spatial Accessibility Index Getis-Ord Gi* statistic in Texas with views of Austin (A), Dallas/Fort Worth (B), Houston (C), and San Antonio (D).

Disclaimer/Publisher’s Note: The statements, opinions and data contained in all publications are solely those of the individual author(s) and contributor(s) and not of MDPI and/or the editor(s). MDPI and/or the editor(s) disclaim responsibility for any injury to people or property resulting from any ideas, methods, instructions or products referred to in the content. |
© 2026 by the authors. Licensee MDPI, Basel, Switzerland. This article is an open access article distributed under the terms and conditions of the Creative Commons Attribution (CC BY) license (http://creativecommons.org/licenses/by/4.0/).
Copyright: This open access article is published under a Creative Commons CC BY 4.0 license, which permit the free download, distribution, and reuse, provided that the author and preprint are cited in any reuse.


